Article

Sources of the Trace Metals Contaminating Soils in Recreational Forest and Glade Areas in Krakow, a Large City in Southern Poland

by
Katarzyna Solek-Podwika
and
Krystyna Ciarkowska
*
Department of Soil Science and Agrophysics, University of Agriculture in Krakow, Aleja Mickiewicza 21, 31-120 Krakow, Poland
*
Author to whom correspondence should be addressed.
Sustainability 2024, 16(16), 6874; https://doi.org/10.3390/su16166874 (registering DOI)
Submission received: 1 July 2024 / Revised: 4 August 2024 / Accepted: 5 August 2024 / Published: 10 August 2024

Abstract

:
Soil pollution mainly results from particulate matter falling from the atmosphere; for example, PM10 and PM2.5 originate from anthropogenic sources. Krakow is both an industrial and touristic city. The aim of this research was to establish the sources and find the main drivers of trace metal (TM) soil contamination in the recreational city park in Krakow. This study was performed on forest soils and glades located near built-up areas and 100 m above built-up areas. The contents of lead, cadmium, zinc, chromium, organic carbon, total nitrogen, available nutrients, dehydrogenases, urease, and invertase activities in the soils were determined. Geo-accumulation, pollution load, Nemerov pollution indices, and potential ecological risk were calculated. Our results indicated low emissions (house heating and traffic) as the main sources of pollution. TM pollution was higher in the soils of built-up areas than in soils located 100 m above built-up areas, and forest soils were more polluted with TMs than glade soils. Activities undertaken as part of the sustainable development of the city should aim to reduce low emissions.

1. Introduction

Environmental pollution leading to soil contamination is associated with particulate matter falling from the atmosphere (mainly in the form of PM10 and PM2.5) due to anthropogenic sources such as industry (construction and metallurgy), fossil fuel combustion (coal combusting in power plants and furnaces), and transportation. PM10 and PM2.5, which have the greatest negative impact on human health, include many trace metals (TMs), as well as K, Mg, Na, Ca, and P. Moreover, during the combustion of coal, Cr (III), present in coal, is oxidised to Cr (VI), which is hazardous to human health [1,2,3]. Emissions from automobile traffic mainly come from exhaust; the wear and tear of vehicle components, such as brake linings and tires; and incomplete fuel combustion. Identifying the main source of soil contamination is often difficult because, in urbanised areas, a variety of emissions, from point, line, and surface sources, can overlap [1,4]. In Poland, especially in several cities (Krakow, Warsaw, and Poznan), studies have monitored the chemical compositions of the components of particulate matter pollution for several years [5,6,7,8].
According to the World Health Organization [9], in 2016, Krakow was ranked among the top 10 European Union cities with the most polluted air. In the second half of the 20th century, the city was home to a metallurgical smelter, which, in the 1970s and 1980s, emitted more than 100,000 tons of particulate matter pollution into the atmosphere annually. Since that time, reductions in industrial production, the introduction of new technologies, and stricter emissions limits have helped reduce air pollution in the city [10]. The current state of air pollution in Krakow, according to everyday monitoring, has much improved; however, the activity of heat and power plants, the burning of solid fuels, road traffic (the number of vehicles is constantly increasing), and increased air traffic are still sources of air contamination. In addition, there is pollution coming from neighbouring towns and villages (where homes are still heated with coal) and the Upper Silesian Industrial District [2,5]. The process of air pollution is also facilitated by the city’s location in a geographical basin, which negatively impacts the natural ventilation conditions [10]. According to measurements of PM10 and PM2.5 conducted by the Chief Inspectorate of Environmental Protection, in Krakow, in the years 2012–2020, the permissible PM10 content was exceeded (the average daily permissible concentration is 50 µg/m3) 35 times a year, and the average annual concentration of PM2.5 (20 µg/m3) in the city exceeded the permissible limits during the winter period [11].
The most important secondary effect of air pollution in Krakow is the contamination of soils, plants, and animals with TMs [12,13]. Because soils are considered an important reservoir of urban pollutants, TM concentrations in soils can be used as ‘diagnostic tools’ to describe the current state of the environment [12,14].
Urban soils are widely considered to be an important part of the urban ecosystem. Deposited metals have been found to move to the deeper layers of these soil profiles very slowly and in small amounts, where they can remain for many years, causing environmental problems (e.g., deterioration or loss of certain soil functions, changes in chemical properties, and reductions in soil enzymatic activity) and even devastation of the soil environment [15,16].
The contamination of urban soils with TMs is a serious problem due to their high toxicity, slow biodegradability, and the large number of sources that produce them [17]. The TM contents of urban soils have been the subject of several publications, e.g., [15,16,17], with special attention being paid to green areas in cities due to their recreational use and the possibility of human exposure to contaminated soil [12,18,19,20]. Wieczorek et al. [17] compared TM contamination in urban soils that were used as parks, croplands, and grasslands. Soil pollution in urban woodlands and pastures in Tehran was also the subject of research by Mahmoudabadi et al. [21].
Krakow is one of the most popular cities in Europe, which, according to the rankings performed by National Geographic in 2023 [22], held the top position among Polish cities appreciated by tourists from all over the world. The development of the city takes into account the development of the tourist industry, focusing mainly on the cultural, but also natural heritage. Numerous green areas (forests, parks, and meadows) are places of recreation and relaxation for tourists and residents, and these spaces have a role in air purification by capturing gaseous pollutants and suspended dust. To our knowledge, there are not many studies assessing the contamination of urban soils in green areas depending on their use, and those published present ambiguous results. Therefore, there is still a need to obtain more information about the impact of the use of soils from green urban areas on their TM content.
We hypothesised that the soils of urban green areas, independent of plant cover, located about 100 m above built-up areas accumulated much lower amounts of TMs than those located in the immediate vicinity of buildings and roads. In order to test this hypothesis, we estimated the level of TM contamination by calculating the following: geo-accumulation, pollution load, and Nemerov pollution indices, as well as the potential ecological risk of the urban soils of glades and forests (of green and in the vicinity of built-up areas), and then we identified the sources of pollution. In order to establish which soil properties were related to the accumulation of TMs, we defined the relationship between the accumulation of TMs and the properties of forest and glade soils.

2. Materials and Methods

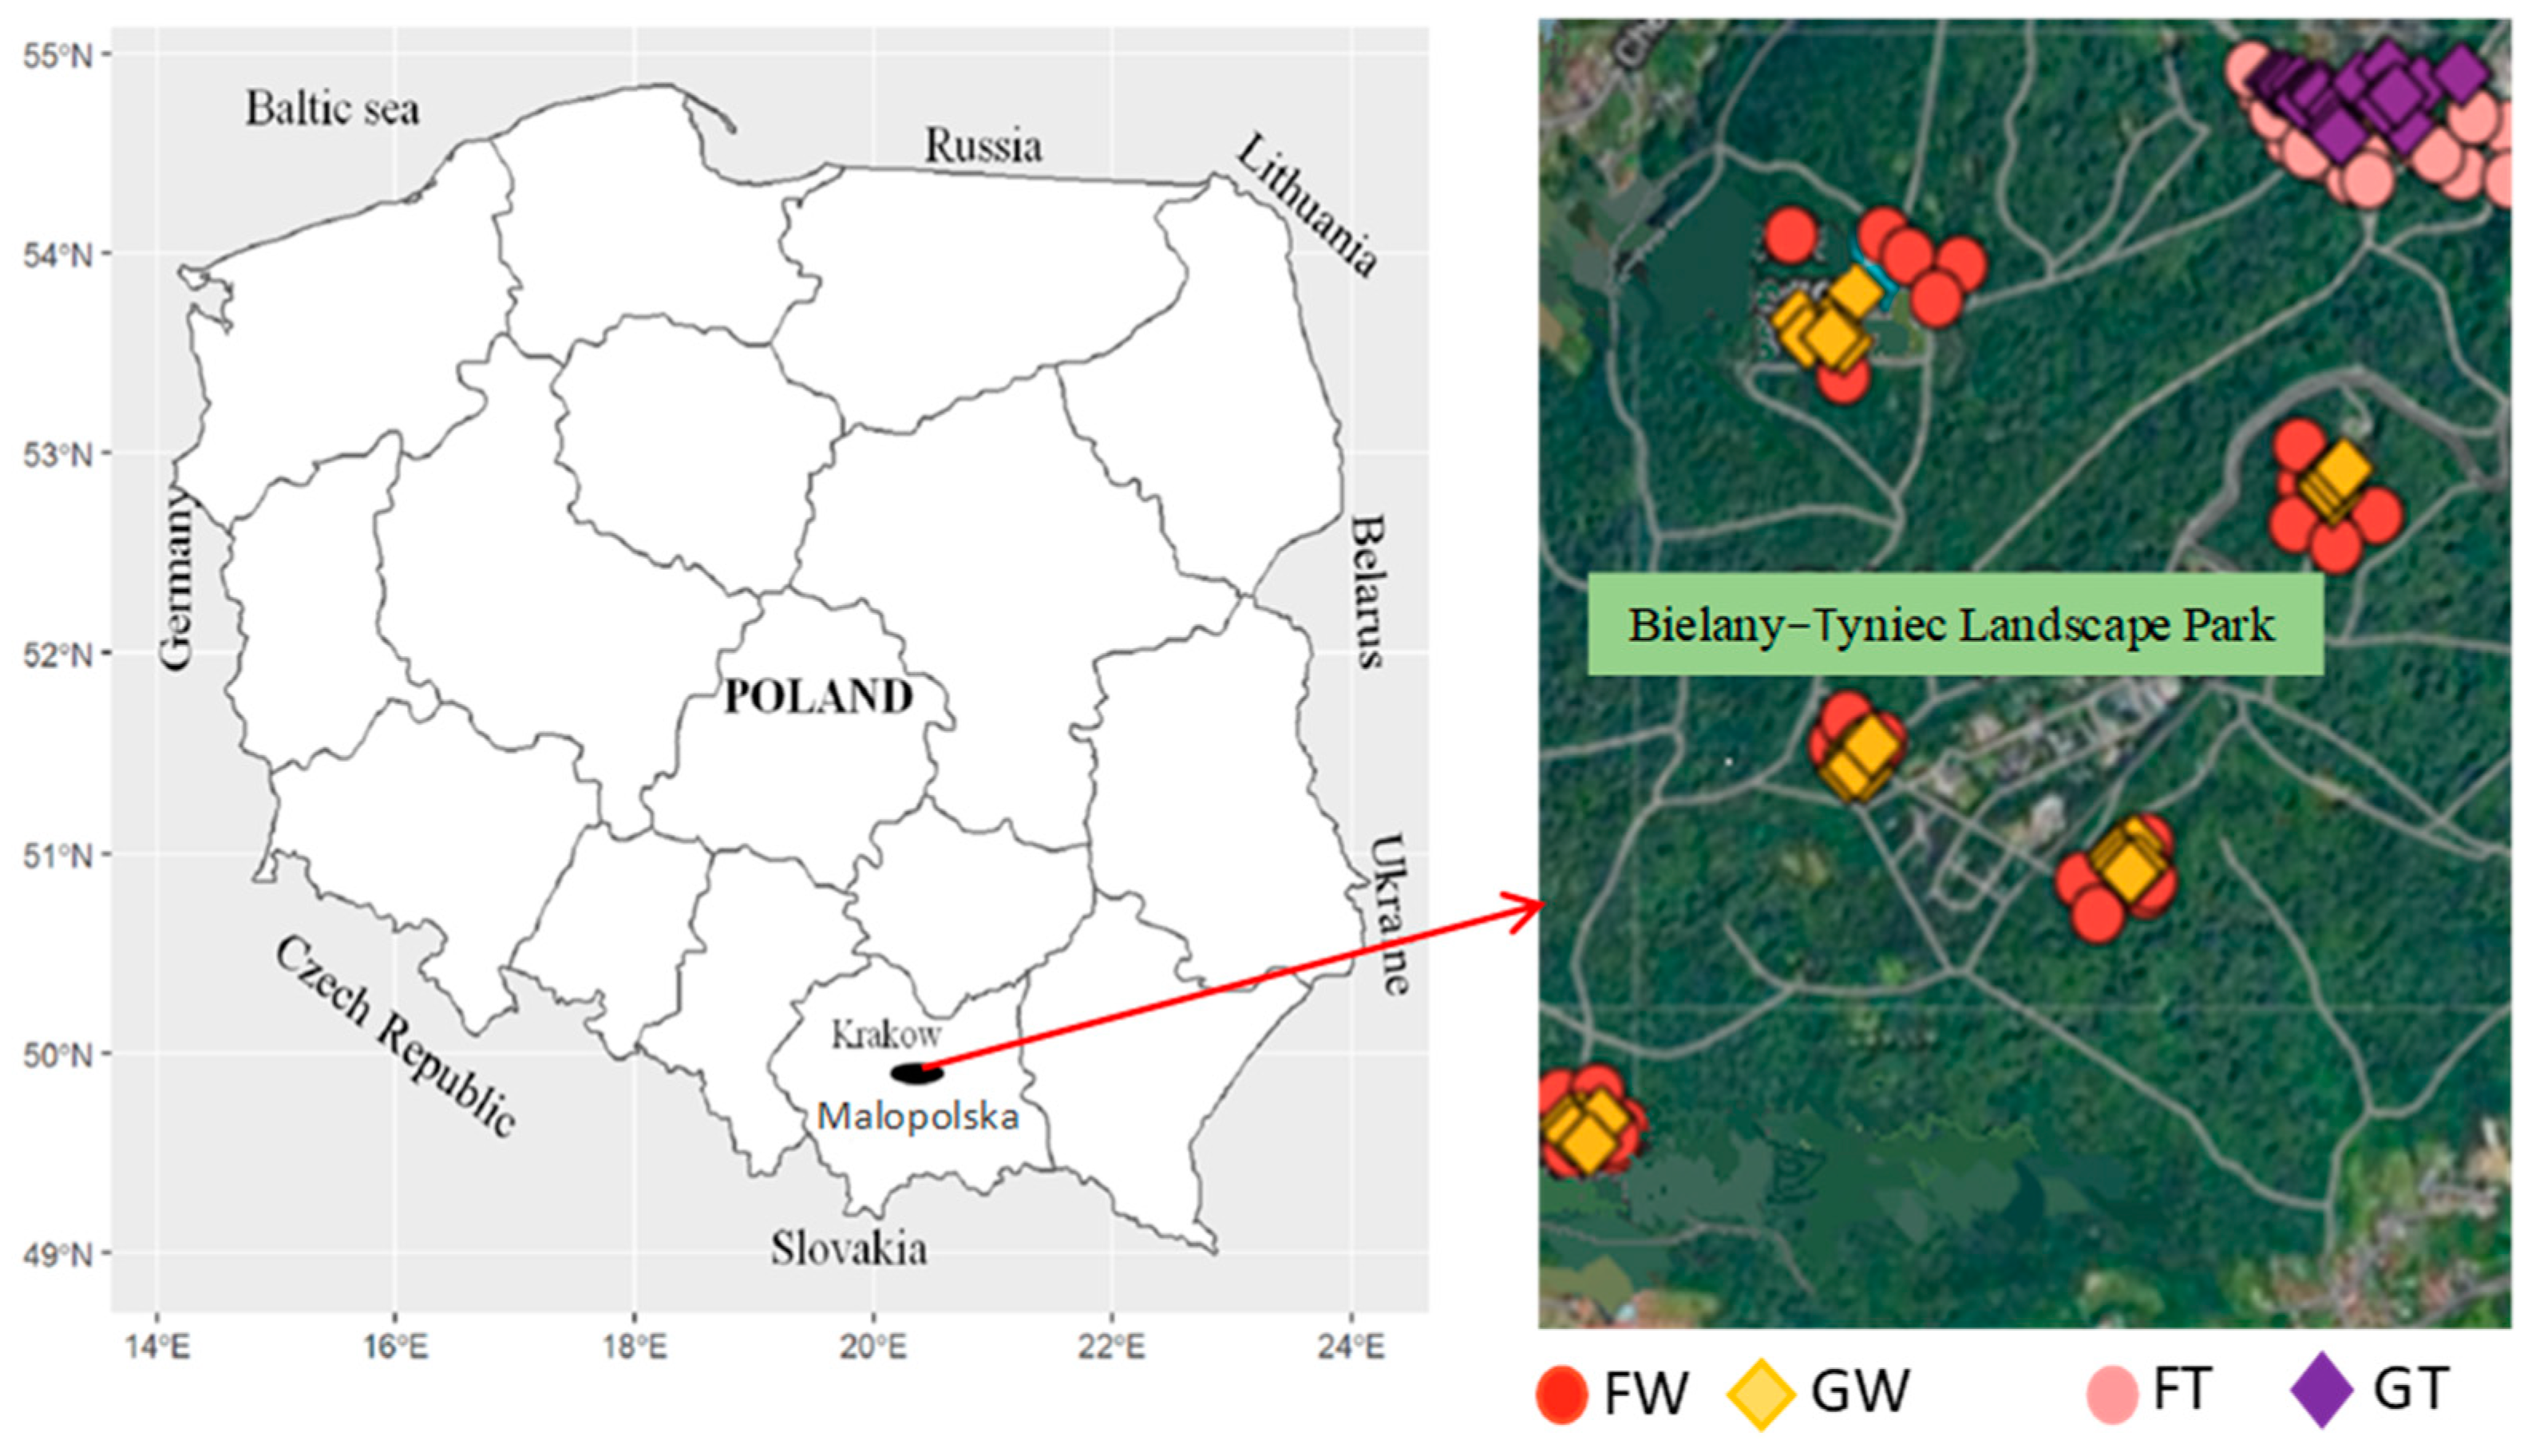
2.1. Characteristics of the Study Area and Sampling

This study was conducted in 2023 in Krakow (50°03′41″ N, 19°56′18″ E)—the second-largest city in Poland in terms of population and area. Krakow is located in the Vistula River valley, in the southern part of Poland (Malopolska region, Figure 1), and currently has a population of about 805,000 [23]. The city has a mild and warm climate with an average annual temperature of about 9 °C and annual rainfall of about 650 mm. The prevailing winds are westerly and easterly, consistent with the direction of the Vistula valley axis [24].
Soils were taken from the western part of Krakow in the Wolski Forest area, which has the status of a city park, created in 1918. It is the most popular place for recreation among Krakow’s residents, offering them some contact with nature. On an area of 420 ha, there are multi-species deciduous tree stands (mainly birch–oak, birch–oak–beech, and beech) and mid-forest glades. The geological bedrock of the studied soils comprises loess formations. The test areas contained soils classified as Cambisols (World Reference Base) [25].
Soil samples were taken from the forests and glades of the Wolski Forest. The sampling sites were set at a distance of 50 m from the forest–glade boundary. Glades located at an altitude of approximately 350 m a.s.l. were designated ‘GW’, and those located approximately 100 m below, adjacent to urban buildings and streets, were designated ‘GT’. Samples taken from the forest in the neighbourhood of the GW soils were designated ‘FW’ (both green areas), with those taken from near the GT soils designated ‘FT’ (both built-up areas). The geographical coordinates of the sampling locations were determined using the Global Positioning System and are presented on the map in Figure 1. The point with the specified coordinates was the central point of a 5 × 5 m square, from which five evenly distributed individual samples with a total mass of 1 kg were taken. Soil samples for the study were taken from 0 to 10 cm (surface) and 10–30 cm (subsurface). The study covered five glades (GW), from which 60 samples were taken from the two layers (12 samples from each glade). In the neighbourhood of the GW samples, 60 samples were collected from the forest (12 samples in the vicinity of each glade). In the built-up areas (GT and FT), 60 samples were collected from a glade and 60 from the adjacent forest. A total of 240 soil samples were taken from the two layers for testing. The samples were divided into two parts, one for enzyme activity analysis, those samples stored at 4 °C, while the other was air-dried and then sieved through a 2 mm-mesh sieve.

2.2. Laboratory Analyses

Selected physicochemical properties were determined from the air-dried soil samples. These included the soil texture, estimated by the densimetric-sieve method and classified according to WRB recommendations [25]; the pH in H2O and 1 M KCl [26]; the total acidity (Hh) determined in 1 M Ca(CH3COO)2 at pH 8.2 [27]; and the total carbon (C) and total nitrogen (N), measured using a Vario El CUBE elementary analyser (Elementar, Germany). The C was considered to be organic carbon (Corg) because there were no carbonates in any of the samples. To obtain the organic matter content, the Corg content was multiplied by the van Bemmelen coefficient—1.724 [26]. The bioavailable P and K were extracted using a 0.03 M CH3COOH-buffered solution, and the bioavailable Mg was extracted using 0.02 M CaCl2, following the Schatschabel method [28]. The total Cd, Pb, Cr, and Zn concentrations were measured after digestion in concentrated HNO3 and HClO4 [29]. The elemental concentrations of P, K, Mg, Cd, Pb, Cr, and Zn were determined using inductively coupled plasma–optical emission spectrometry (ICP-OEC Thermo iCAP 6500 DUO, Thermo-Fisher Scientific, Cambridge, UK).
The dehydrogenase activity (DHA) was determined following the Cassida method [30] and expressed as the amount of 2,3,5-triphenyl formazan formed. The colour intensity was measured using a DU 600 spectrophotometer (Beckman Instruments Inc., USA) at a wavelength of 450 nm [31]. The urease activity (URE) was determined following Tabatabai and Bremner [32], using a urea solution as a substrate. An estimation of the amount of NH3 left after the urea hydrolysis was determined via the distillation of N-NH3 from the sample extract using a Kjeltec8200 (FOSS, Denmark) [32]. The invertase activity (INW) was determined colourimetrically using a sucrose solution as the substrate. The intensity of colouration was measured using DU 600 spectrophotometer (Beckman Instruments Inc., USA) at a wavelength of 540 nm [33]. The results are expressed in terms of the air-dried mass of the soil.

2.3. Statistical and Geostatistical Analyses

The determined soil properties are presented as arithmetic means with standard deviations (SDs). We calculated Pearson’s correlation coefficients in order to check if the two studied variables were linearly related. A two-factor analysis of variance (ANOVA) was used to determine differences in the soil parameters between the soils grouped by plant cover (forest and glade) and location (built-up and green areas) separately for the surface and subsurface layers. First, the Shapiro–Wilk test was used to check whether the variables had a normal distribution, and the variances were checked for homogeneity using Levene’s test. Due to the normal distribution, a parametric ANOVA was applied. To assess the significance of the differences between the mean values of the homogeneous groups, a post hoc Bonferroni correction was used (at p < 0.05). To demonstrate the relationship between the soil parameters and the soil–plant cover and location, a principal component analysis (PCA) was employed. Statistical analyses were performed using Statistica v.13.3 software [34] and the Canoco 5.1 package [35]. The pH in KCl, SOM content, DHA activity, and TM concentrations in the surface layers of the soils are presented in classed post maps made using Surfer 20.0 software.

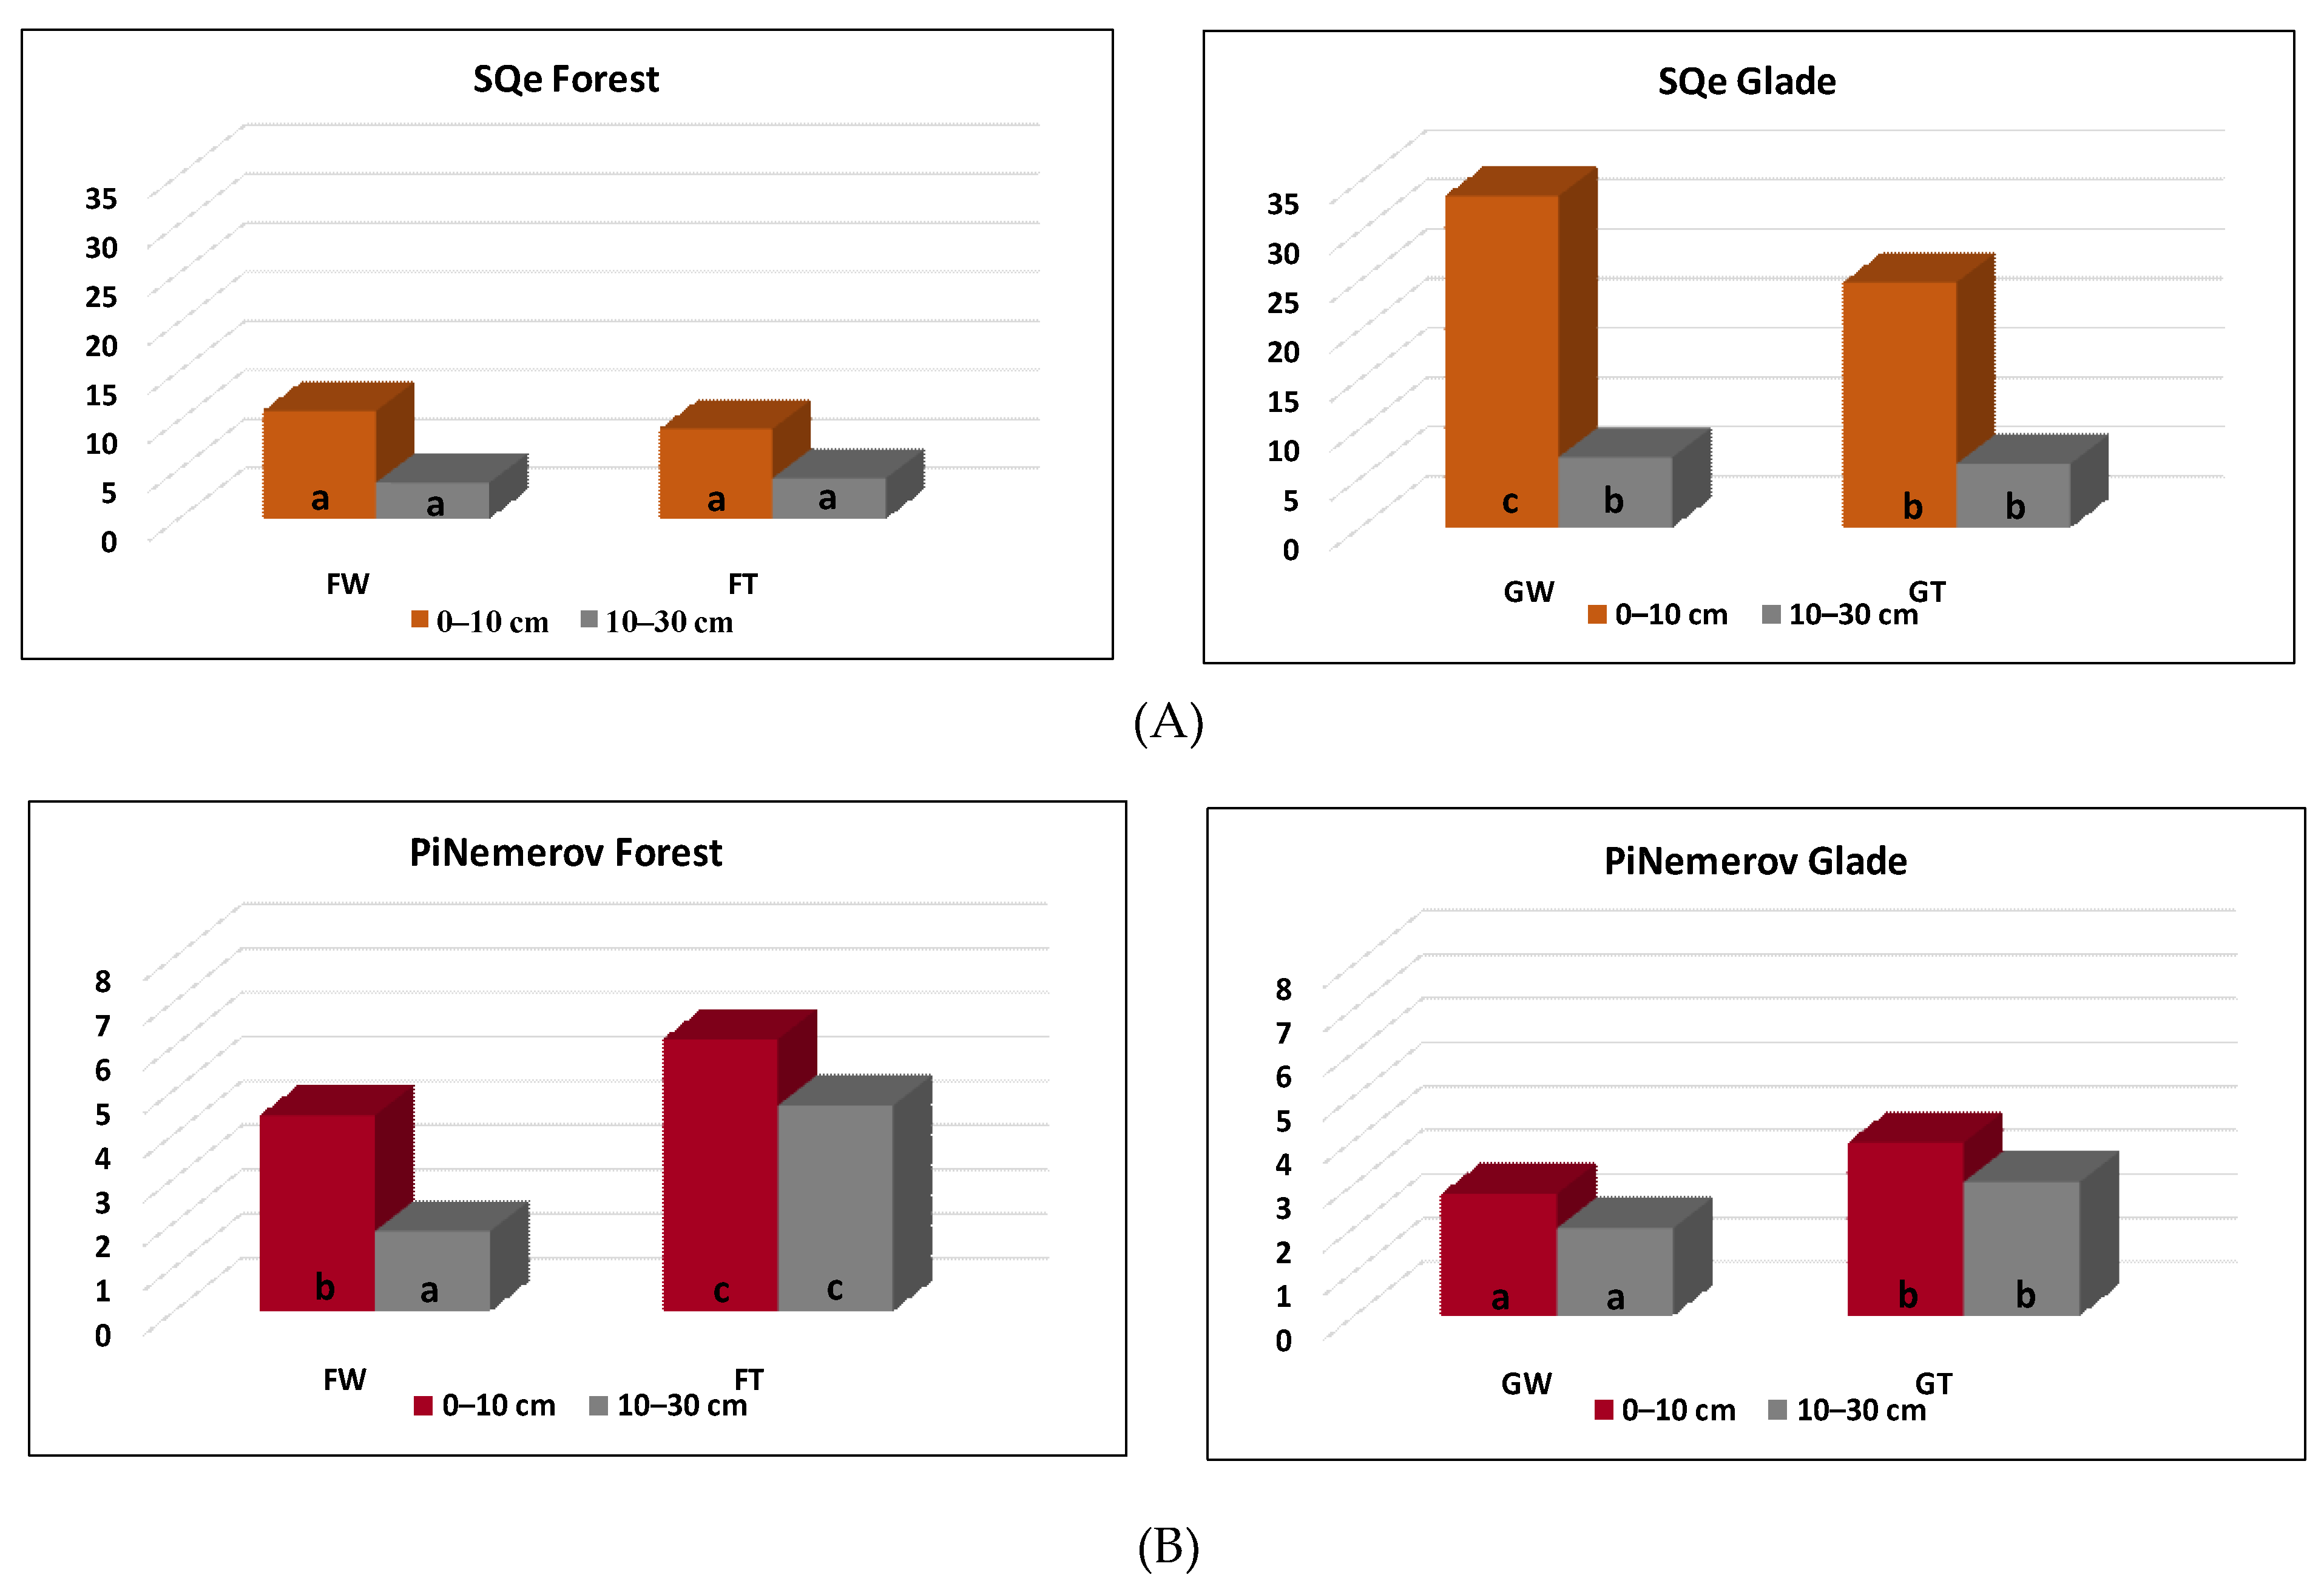
2.3.1. Calculation of Soil Quality Enzyme Index (SQe)

The SQe was calculated as the geometric mean of the activity DHA, URE, and INW [36]:
S Q e = D H A · U R E · I N W 3
It is assumed that the higher the SQe value, the higher the enzyme activity in soils [37].

2.3.2. Calculation of Soil Pollution Indices

Geo-Accumulation Index (Igeo)

Igeo allows for the assessment of the content of individual heavy metals in the soil based on their content in the A or O horizons in relation to a specific background content [38]. It is calculated in the following way:
I g e o = l o g 2   C n 1.5   G B
where Cn is the metal concentration in soil, GB is the metal background concentration, and 1.5 is the correction factor that compensates for the background data due to lithospheric effects.
Igeo values can be interpreted as follows: Igeo < 0 (not polluted), 0–1 (not polluted to moderately polluted), 1–2 (moderately polluted), 2–3 (moderately to highly polluted), 3–4 (highly polluted), 4–5 (highly polluted to very highly polluted), and Igeo > 5 (very highly polluted).

Nemerov Pollution Index

The PiNemerov allows the degree of soil contamination to be assessed, which here included the contents of all analysed TMs [39].
P i N e m e r o v = 1 m i 1 m P i 2 + P i   m a x 2 m
where Pi is the single pollution index of a particular TM, calculated as P i = C B , where C is the content of trace metals in the layer; B is the geochemical background based on reference data—according to Czarnocka [40], the TM contents in the parent material (loess) in Poland amount to Cd—0.18, Pb—9.8, Cr—27, and Zn—30 mg∙kg−1; Pi max is the maximum value of the single pollution index of all the TMs; and m is the number of studied trace metals.
Based on the PiNemerov, there are five classes of soil quality [41]: ≤0.7 = clean, 0.7–1 = warning limit, 1–2 = slight pollution, 2–3 = moderate pollution, and ≥3 = heavy pollution.

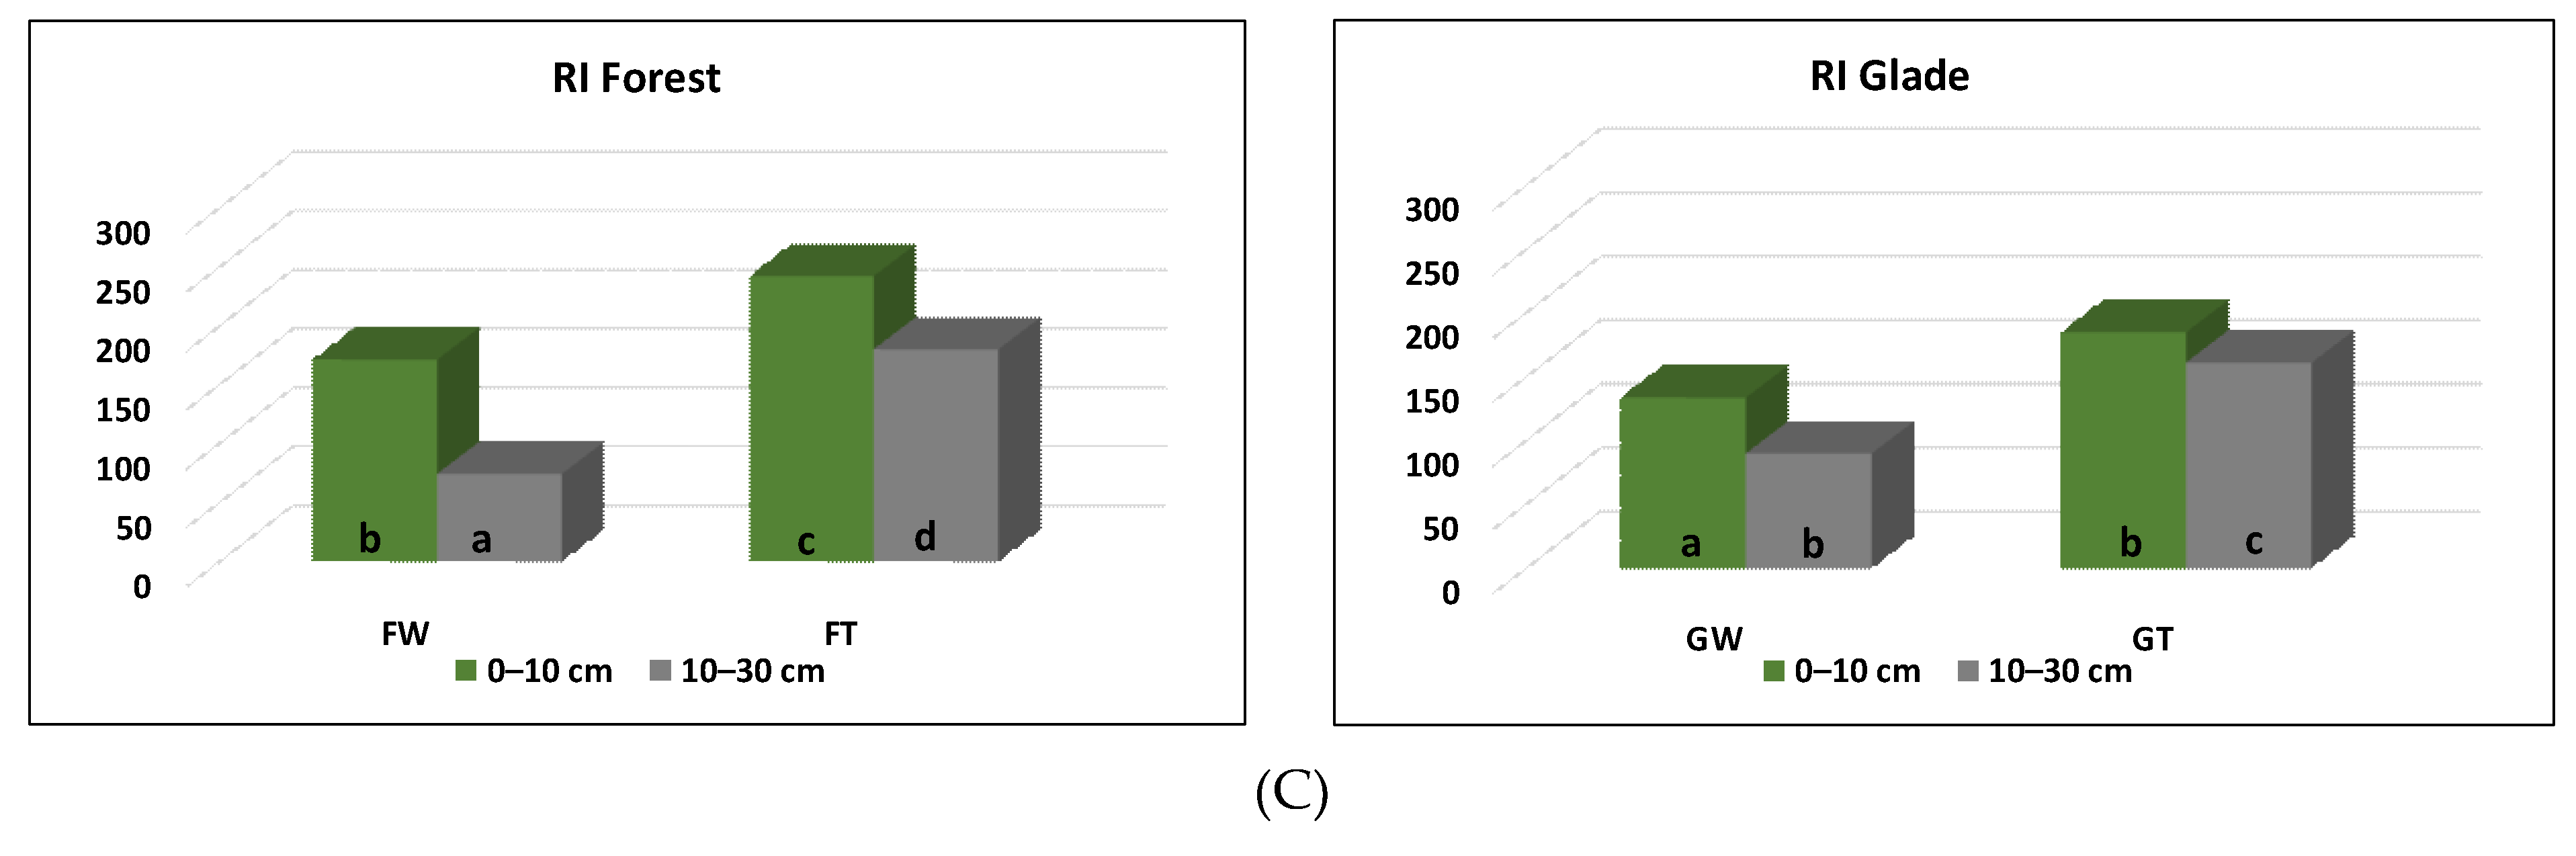
Potential Ecological Risk Index

The potential ecological RI is used to assess the degree of environmental risk caused by a concentration of TMs in soil.
R I = i = 1 m E r i
E r i = T r i
where Er is the single index of ecological risk factor, m is the number of TMs studied, Tri is the toxicity response coefficient of the TMs [42], and Pi is the single pollution index of a TM. The RI classes, according to Håkanson [42], are—≤90 = low, 90–180 = moderate, 180–360 = strong, 360–720 = very strong, and ≥720 = highly strong.

Pollution Load Index (PLI)

Is calculated as a geometric mean of PI [39]:
P L I = P I 1 + P I 2   + P I 3 + P I n   n
where n is the number of analysed metals, and PI is the contamination factor for each metal.
PLI values can be interpreted as follows: <0 = not polluted, 1 = only baseline levels of pollution, and >1 = deterioration of soil quality [39].

3. Results

3.1. Basic Physical and Chemical Properties

The texture of all the soils was similar. They were classified as loamy or clayey silts. The lowest pH values (pH in KCl of 3.6–3.7; Figure 2A) were determined in both layers of the FW soils, and the highest was determined (pH in KCl of 5.0) in the 10–30 cm layer of the GT soils, in which the lowest Hh value was also determined (Table 1). The pH values in H2O, similarly to the pH in KCl, were the lowest in FW soils (Table 1).
The SOM contents in the surface layers of the FW and FT soils were 65.82 and 45.14 g∙kg−1, respectively, and in the analogous layers of the GW and GT soils, 37.76 and 27.63 g∙kg−1, respectively. In the subsurface layers, the SOM content was similar in all soils, ranging from 16.87 to 19.37 g∙kg−1. The total N contents in the 0–10 cm layers were 2.30–2.91 g∙kg−1, and in the 10–30 cm layers, 1.78–2.03 g∙kg−1 (Table 1).
The available K contents were lower in both the FW and GW soils than in the corresponding urban soils of built-up areas (FT and GT). The highest K content was in the GT soil (174.13 mg∙kg−1). The available P contents in the surface layers in the urban soils of built-up areas were approximately 40 mg∙kg−1, and in the subsurface layers, approximately 25 mg∙kg−1. The greatest difference in the available P content was in the surface layers between the FW (55.47 mg∙kg−1) and GW (21.11 mg∙kg−1) soils. In the subsurface layers of the FW and GW soils, the P content was similar, at approximately 15 mg∙kg−1. The available Mg contents in the urban soils of built-up areas (FT and GT) were similar in both layers at approximately 100 mg∙kg−1. In the FW and GW soils, the Mg contents in the surface layers were approximately 60 mg∙kg−1, and in the subsurface layers, 30–40 mg∙kg−1 (Table 1).

3.2. Enzyme Activity and Soil Quality Enzyme Index

In general, the enzyme activity in both layers was lower in the forest soils than in the glade soils. The DHA activity in the forest soils in the 0–10 cm layer was 62.66 mg TPF∙kg−1∙24 h−1 in the FT and 74.82 mg TPF∙kg−1∙24 h−1 in the FW soils. In the glade soils, in GT, it was 122.83 mg TPF∙kg−1∙24 h−1 and in GW soils, DHA activity was 134.75 mg TPF∙kg−1∙24 h−1. The distribution of DHA activity in soils of the study area is shown in Figure 2C. In the same layers, the URE activity was 36.87 (FT)–40.14 mg N-NH4·kg−1·2 h−1 (FW) and 105.57 (GT)–143.33 mg N-NH4·kg−1·2 h−1 (GW). In the differently located forest soils, the INW activity ranged from 0.36 (FT) to 0.60 mg of inverted sugar·g−1·24 h−1 (FW), whereas in the glade soils, it was 0.23–2.08 mg of inverted sugar·g−1·24 h−1, respectively, in GT and GW (Table 1). In subsurface layers, the activities of three enzymes were lower than in surface layers and followed the same pattern of distribution.
The glade soils (GW and GT) were characterised by higher SQe values than the forest soils (FW and FT). The highest SQe values were in the surface layers of the GW soils. The forest soils sampled at different altitudes were characterised by similar SQe values (Figure 3A).

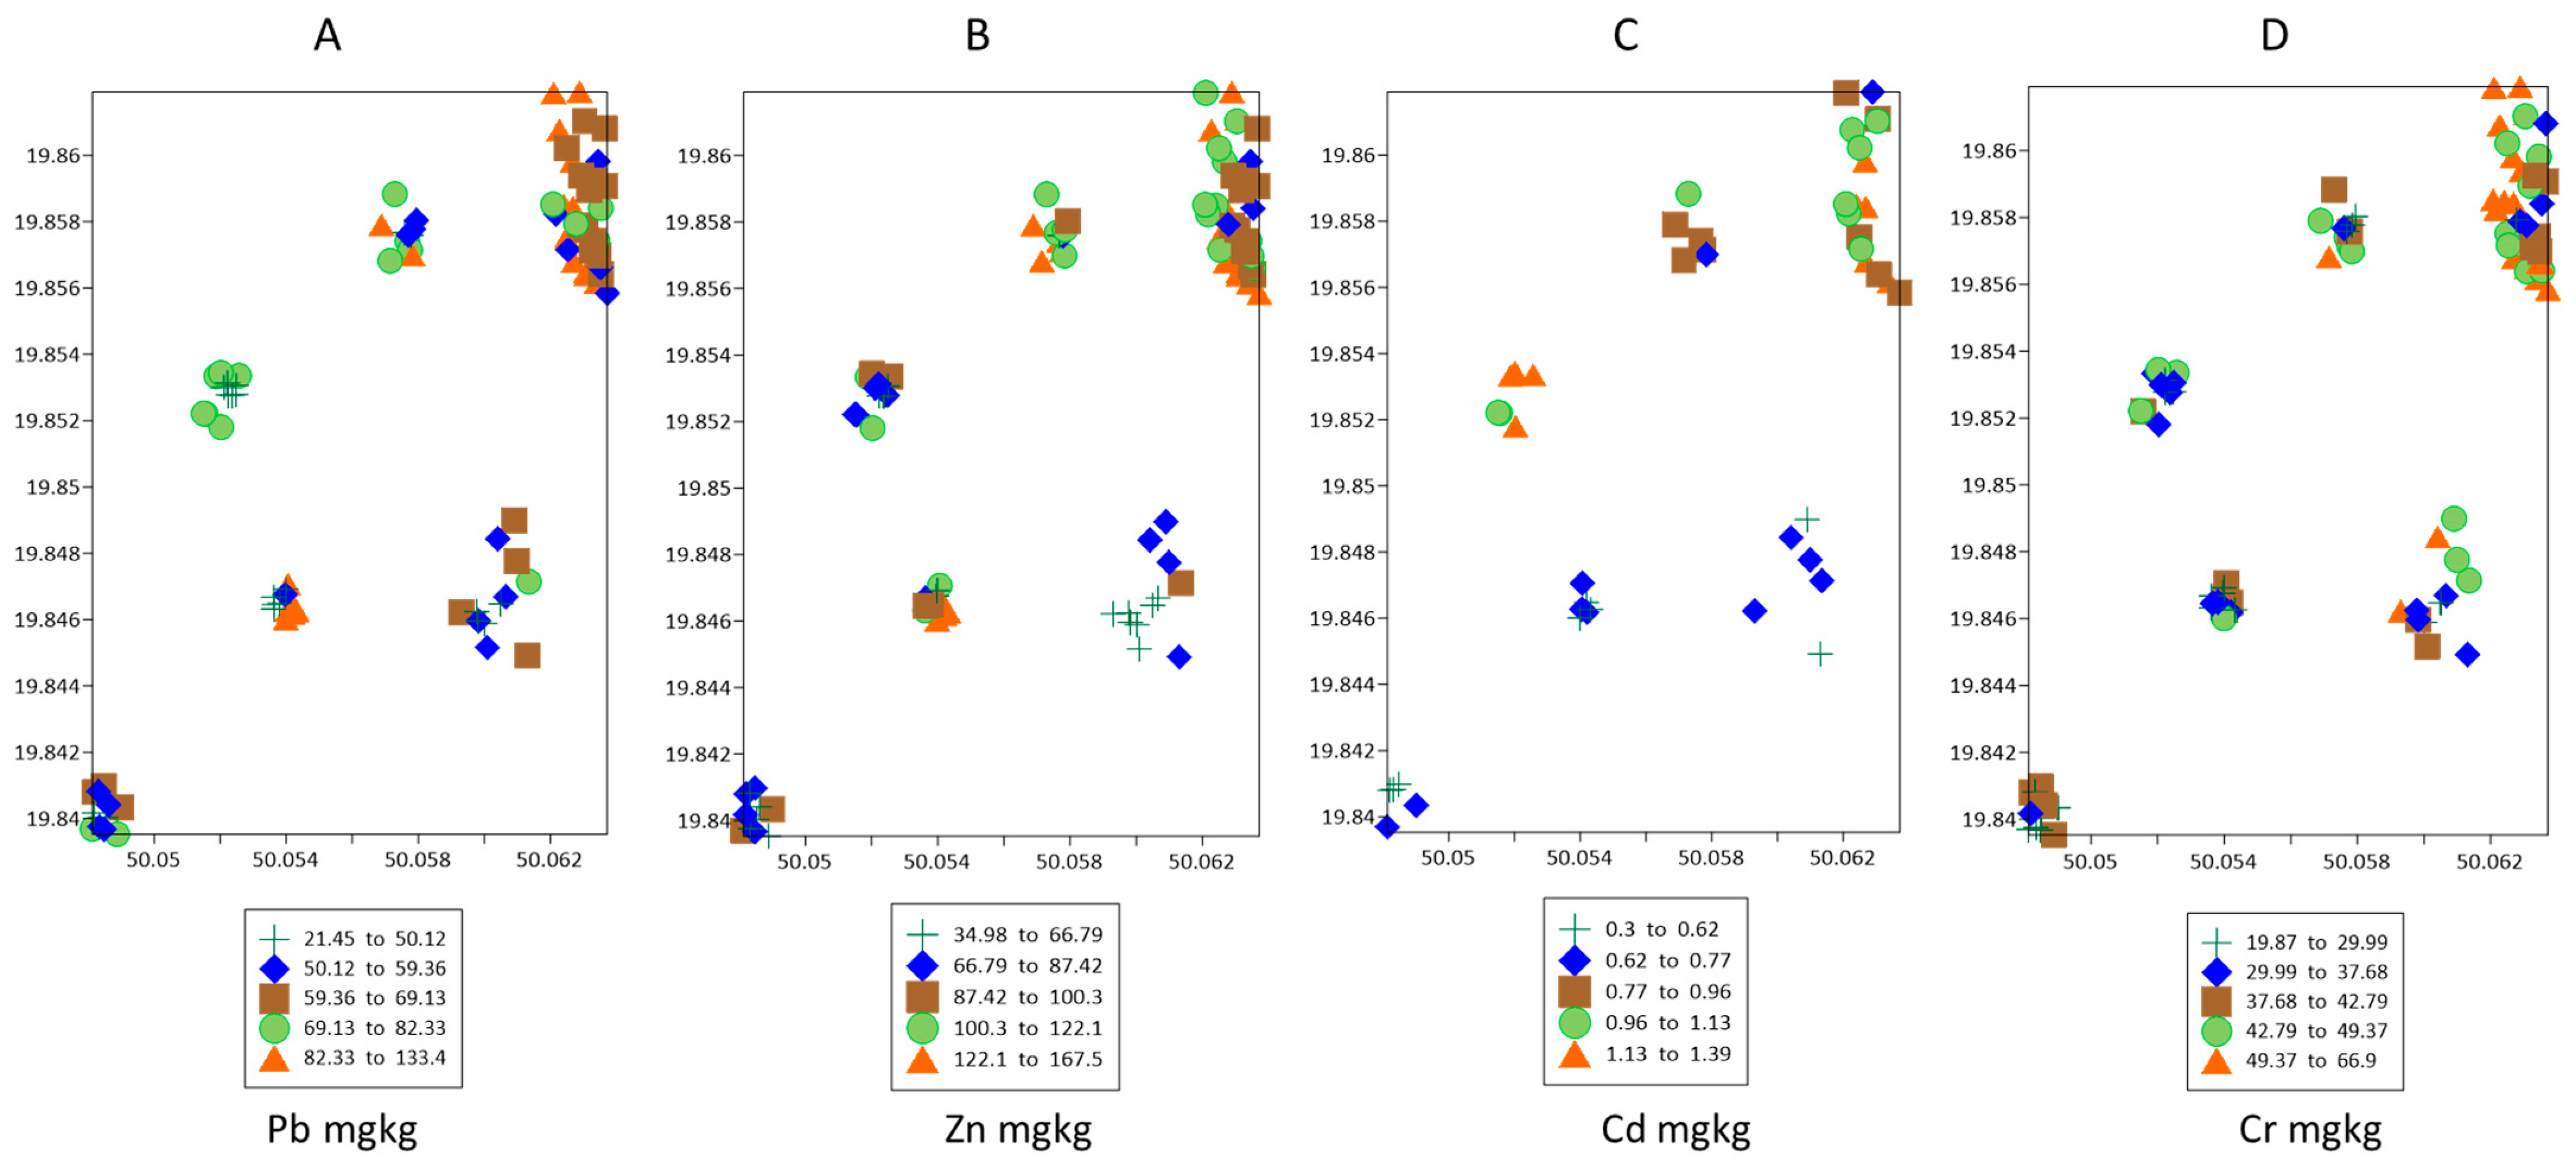
3.3. Concentrations of Zn, Cr, Pb, and Cd and TM Contamination Indices

In the surface layer, the highest mean TM contents (Cd = 1.05, Pb = 102.76, Cr = 52.64, Zn = 125.47 mg∙kg−1) were in the FT soils. The FT soils also had the highest Pb content, at 81.43 mg∙kg−1 in the subsurface layer. The lowest TM contents in the surface layer occurred in the GW soils (Cd = 0.62, Pb = 44.79, Cr = 30.37, Zn = 70.01 mg∙kg−1). The maps of the distribution of TMs in the 0–10 cm layer indicate a higher content of these elements in the urban soils located close to the built-up areas than in the soils of the green areas located 100 m from the city centre (Figure 4A–D). The maps show that the content of Pb and Zn had a similar distribution, reflected by a strong correlation between these elements described by a high Pearson correlation coefficient, r = 0.75 at p < 0.05 (Figure 4A,B; Table 2). The highest Igeo values for Cd, Pb, Cr, and Zn were found in the surface layer of the FT soils, marking these as moderately to heavily polluted with Pb and moderately polluted with Cd (in both the surface and subsurface layers) and Zn (in the surface layer). The surface layer of the FW and GT soils had Igeo values greater than 2 (for Pb) and 1 (for Cd), with the Igeo for Zn being above 1 in the surface layers of FW, FT and GT soils. The Igeo values for Cd and Pb were in a range of 1–2 (moderate contamination) in the surface layer of the GW soils and the subsurface layer of the GT soils. The Igeo values for Cr were usually below 0, except for in the surface layer of the FT soils, where the mean Igeo value was 0.37 (Table 1).
Generally, the FT and GT (built-up area) soils had higher average PiNemerov, RI, and PLI values than the FW and GW (green area) soils. The PiNemerov values for the green area soils ranged from 1.82 to 4.44, whereas in the urban soils of built-up areas, they ranged from 3.05 to 6.16. The RI values in the GW and FW soils were 74.76 to 171.79, and in the GT and FT soils, 161.45 to 242.52, respectively (Figure 3B). Based on the calculated PiNemerov values, heavy pollution was present in both layers of the FT and GT soils and in the surface layer of the FW soils. The remaining soils (GW 0–10 cm, FW and GW 10–30 cm) were characterised, respectively, by moderate or slight pollution (Figure 3B). The RI values for both layers of the FT soils and the surface layer of the GT soils indicated strong potential ecological risk. The RI values for the surface layers of the FW and GW soils and the subsurface layer of the GT soils indicated moderate ecological risk, which was low in the other subsurface layers (Figure 3C).
The PLI values in all the soils were above 1 (indicating a deterioration in soil quality) and were higher in the 0–10 cm layer than in the 10–30 cm layer. The highest PLI values, similarly to the other indices, occurred in the FT soils, the lowest in the GW soils (Table 2).

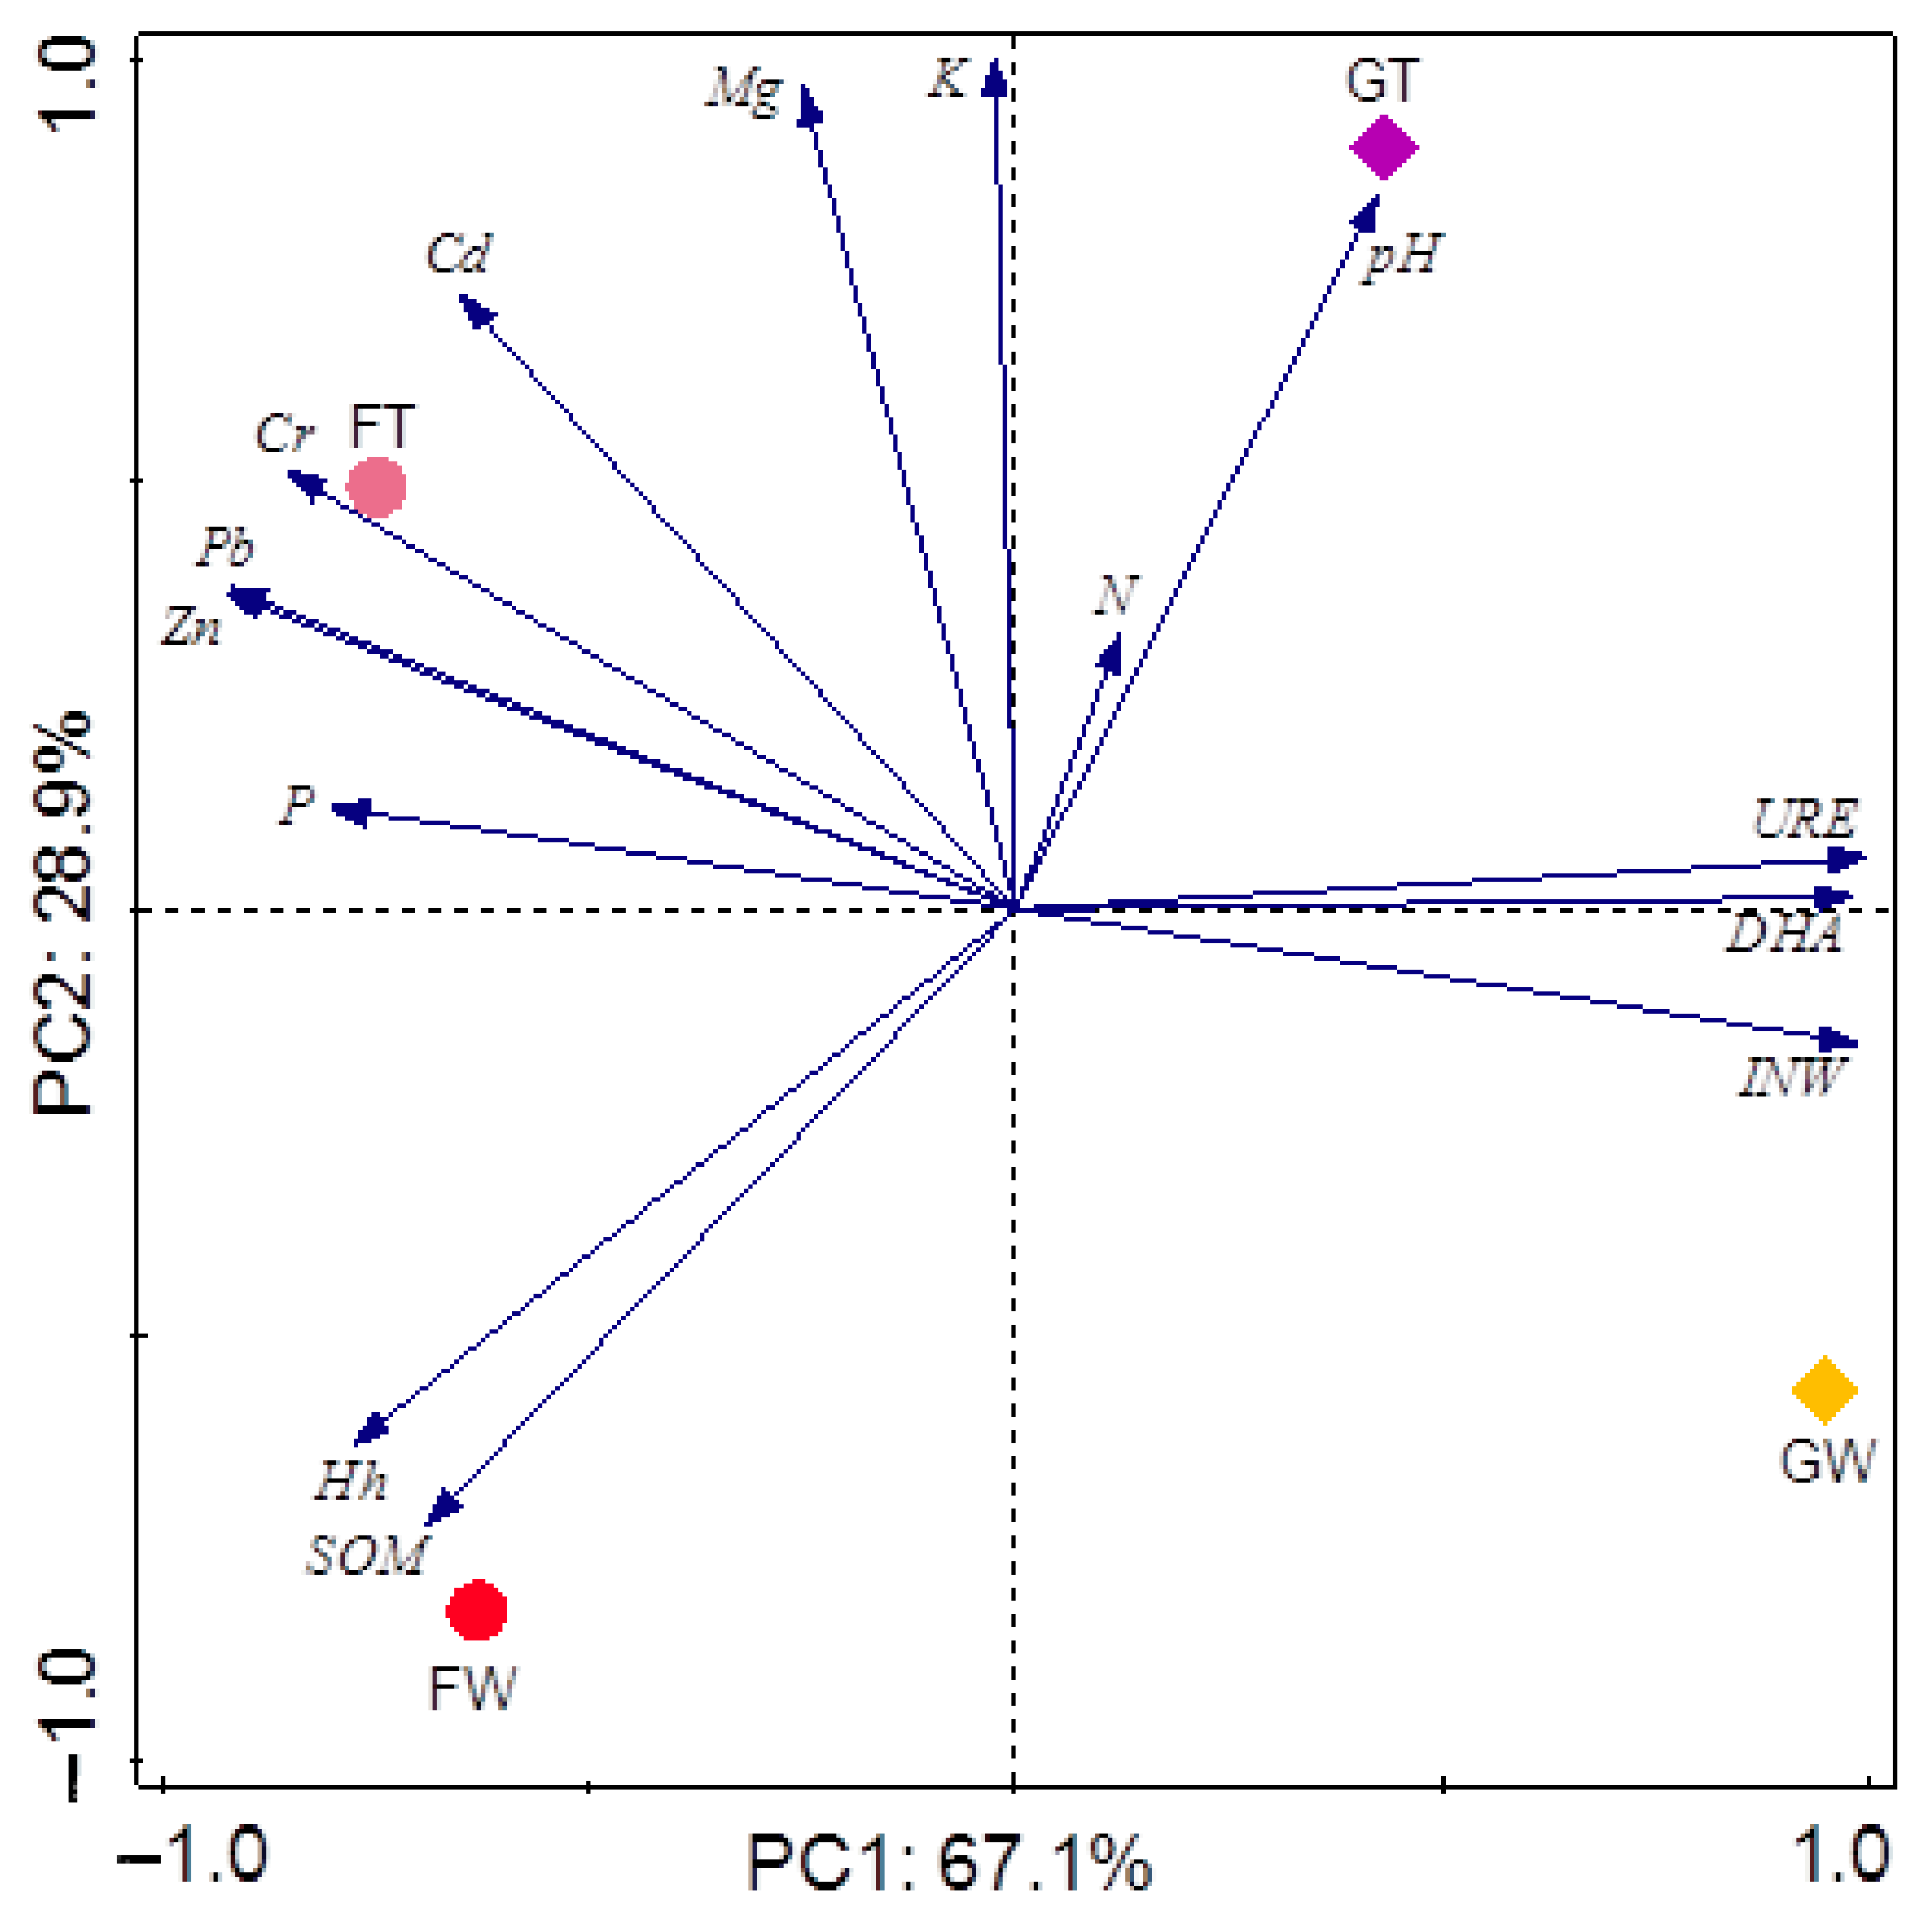
3.4. Main Factors Shaping the Soil Properties

The results of the PCA showed that the first factor, which explained 67.1% of the variation in the variables, was the soil–plant cover (forest/glade), while the second factor, explaining 28.9% of the variation, was the location: soils of built-up areas and of green areas located 100 m above buildings and streets. The dominant influences in shaping the FW soil properties were SOM content and Hh, with the GW soils being negatively correlated with TM content but influenced by INW, DHA, and URE activity. In the FT soils, the greatest influence was from the TM content, which was positively correlated, to different extents, with Mg, K, and P. The GT soil properties were shaped mainly by pH and, to a lesser extent, the total N content and were negatively influenced by SOM and Hh (Figure 5).

4. Discussion

4.1. Evaluation of TM Contents and Their Sources

In all the soils, regardless of location or plant cover, higher values of TM contamination indices were calculated for the surface than for the subsurface layer, indicating anthropogenic sources for these elements. The most TM-polluted among the tested soils were those from built-up areas covered with forest, which were classified as moderately and highly polluted with Pb, Zn, and Cd. The high contents of Pb, Cd, and Zn resulted from low emissions of pollutants from transport, the long-term use of coal for house heating (currently banned), and many years of the Krakow steelworks operations (now modernised) [43]. Although leaded gasoline was withdrawn from Poland at the beginning of the 21st century, its continued use, combined with the generally high persistence of Pb in the environment, is probably also one of the factors causing pollution of the urban soil environment [44]. Similar, although slightly lower, TM contamination was determined in the glade soils located at the same altitude as the forest soils discussed above. The contaminants in these soils came from the same sources, with the lower accumulation of metals in the glade soils being related to the different plant cover.
The forest soils of the green areas (located 100 m above the buildings and streets of the city) were mostly less polluted than the soils located in the built-up areas. The contamination indices of the forest soils of the green areas were always lower than those of the forest soils located in the built-up areas but were sometimes similar to, or even higher than, those of the soils of the glades in the built-up areas. The soils of the glades in the green areas were characterised by the least contamination. This distribution of TM pollution indicates the importance of both the location (the higher-elevated soils suffered less of an impact from the low emissions) and the type of plant cover. Our findings are consistent with remarks made by Haque et al. [45]––that plant cover is an important factor in the degree of soil contamination. The greater accumulation of TMs in the forest soils than in the glade soils can be explained by the TMs being captured by tree crowns, especially those with large leaves [46], resulting in their enrichment in the litter and humus horizons [47]. The plant cover affects the amount of organic matter in the soil [48,49,50], which also determines TM accumulation and processes related to these [19]. Galušková et al. [51] reported on the varying plant-cover-dependent TM contamination of soils in Ostrava and Prague (Czech Republic), where higher TM contents were found in soils under trees than in glades.
The soils in the green areas have mainly been exposed to long-distance pollution resulting from, among other sources, aircraft. Approximately 8 km from Wolski Forest is Krakow-Balice Airport, which served more than 9 million passengers in 2023. Increasing air traffic is a source of air- and soil-polluting TMs [52]. Norton et al. [53] and Massas et al. [54] have reported soils enriched in Pb and Zn along the flight paths leading to the international airports in Athens (Greece) and Boston (MA, USA), respectively. According to Massas et al. [54], the emissions (exhaust) from aircraft are similar to those observed in industrial and urban areas. It can be concluded that the location of the green-area soils additionally favoured the accumulation of pollutants from this source.
The Pb, Cr, and Zn contents in the Wolski Forest soils have been found to be higher, and the Cd contents lower than in the parkland soils of Recife, Brazil [55]. Elevated TM levels in the soils of the parks and forests in and around Krakow have been previously identified by Pająk et al. [56], Gąsiorek et al. [12], and Błońska et al. [44]. Comparing our results (Cd, Pb, Cr, and Zn) with the average TM contents determined in soils from other European cities (collected by Adewumi and Ogundele [4]), based on data from the literature for the period 2010–2022 (Pb = 87.6, Cd = 2.4, Cr = 48.2, Zn = 259.9 mg∙kg−1), we found higher contents of Pb and Cr in our samples. According to Adewumi and Ogundele [4], one of the Polish cities with the lowest Cd content in its urban soils is Toruń, whereas the soils in Lublin have the highest Cr content. Other authors [15,51,57,58] have also pointed out the high metal contents in urban park soils in various cities in Europe and across the world (Prague, Ostrava, Zagreb, New York).
Research has also been carried out on how soil use in cities impacts TM accumulation. Wieczorek et al. [17], studying the contamination of soils in Lodz (a city in Central Poland), found the highest concentrations of Cd, Pb, and Zn in cropland soils, followed by grassland soils then park soils, with the highest contents of Pb, Cd, and Zn in the cropland soils being, respectively, 258, 2.5, and 760 mg·kg−1, in the grassland soils, 90, 1.6, and 95 mg·kg−1, and in the park soils, 68, 1.4, and 280 mg·kg−1. Comparing our results with those of Wieczorek et al. [17], in the park (Wolski Forest) soils in Krakow, the TM contamination was generally lower than in the Lodz soils, except for Pb (76.3–102.7 mg·kg−1). However, a study on the TM contamination of urban forest and pasture soils by Mahmoudabadi et al. [21] found no differences in TM content based on soil use. The concentrations of these metals were always lower than in our study, even though they exceeded background levels for that region.

4.2. TM Accumulation and the Properties of Forest and Glade Soils

In the studied soils, the factors determining high Pb and Zn contents were SOM accumulation (Pearson’s correlation coefficient for both elements was 0.53, p < 0.05) and bioavailable P content (r = 0.55 and r = 0.57, p < 0.05, for Pb and Zn, respectively, Table 2). Similar relationships have been found by Navarrete et al. [14] and Setälä et al. [19]. In our studies, the relationship between the SOM content and Pb and Zn contents also confirmed the similar spatial distribution of these parameters (Figure 2B and Figure 4A,B). Soil organic matter provides additional binding sites for TMs (especially Pb), thus reducing their leaching and promoting their stabilisation and long-term accumulation (persistence) in the soil through the formation of high-molecular-weight organic complexes [17].
The P present in the soil not only contributes to the precipitation of low-solubility Zn, Cd, and Pb phosphates but also limits the uptake of TMs by plants [14,59,60]. Complexation with SOM and available P suggest the accumulation of these metals, especially in humus-rich soil layers [61,62]. It can be concluded that the Zn and Pb contents in the investigated soils were slightly more influenced by the available P than by the SOM, as evidenced by the higher correlation coefficients between Zn and Pb with P than with SOM. Based on these results, we speculate that the available P present in the Wolski Forest soils could potentially have immobilised the TMs.
We also found a positive correlation between TM content and the content of bioavailable forms of K and Mg, indicating anthropogenic accumulation of these elements in the Wolski Forest soils. The K present in urban pollutants comes from biomass and coal combustion processes at low temperatures (old coal stoves), while Mg is added to the diesel fuel burned in diesel engines [2,63]. In this study, the DHA, URE, and INW activities were weakly positively correlated with Cd, with DHA being also weakly correlated with Zn. The non-correlation [64], decreasing [50], and stimulating effects of TMs on enzyme activity in soils [65] have been documented in the literature. Enzyme activity is also influenced by the overgrowing vegetation, with higher SQe values calculated for the glade soils than for the forest soils. As reported by Błońska et al. [65], metal can be a component in catalytic centres and can then activate selected enzymes, forming a metal–substrate complex. The reduction in enzyme activity in soils may result not only from heavy metals contamination but also from the lack of nutrients, which may sometimes result in a stronger decline in enzyme activity than the long-term accumulation of heavy metals in the soil [66]. We can conclude, following Ciarkowska et al. [66], that the high nutrient content in the studied soils, even those originating from pollution, compensated for the adverse effects of the TMs. Fang et al. [67] also found that nutrients (especially P), under conditions of TM soil pollution, have a positive effect on soil enzyme activity. The assessment and identification of soil contamination in urban green spaces is an important part of environmental sustainability maintenance in order to prevent further contamination and improve the quality of life of residents. Limiting pollutant emissions and, in consequence, soil contamination is very important in residential and recreational areas such as parks and gardens due to the risk to human health, especially children, resulting from direct contact with the polluted soil.
The Krakow city authorities have taken actions to reduce air contamination (substituting coal furnaces, used for heating homes, with electrical or gas furnaces, and reducing private car traffic in the city by encouraging greater use of public transport—electric and hydrogen buses).

5. Conclusions

The soils of the built-up areas were characterised by more TM contamination (Zn, Pb, Cd, and Cr) than the soils of the green areas (located 100 m higher than the built-up areas). In the soils of the built-up areas, the accumulated TMs mainly came from low emissions, whereas the accumulation of TMs in the soils of the green areas was mainly from the long-range transport of anthropogenic dust. The greater accumulation of TMs in the forest soils than in the glade soils relates to the importance of plant cover as a factor in determining pollutant accumulation in the soil. Among the soil properties, the SOM and nutrient contents had the greatest impact on TM accumulation.

Author Contributions

Conceptualisation, K.S.-P.; methodology, K.C. and K.S.-P.; writing—original draft preparation, K.S.-P. and K.C.; writing—review and editing, K.S.-P.; supervision, K.C. All authors have read and agreed to the published version of the manuscript.

Funding

This work was partially funded by the Ministry of Science and Higher Education of the Republic of Poland (SUB 010013-DO11, 010013-DO14).

Institutional Review Board Statement

Not applicable.

Informed Consent Statement

Not applicable.

Data Availability Statement

The datasets analysed during the current study are available from the corresponding author upon reasonable request.

Conflicts of Interest

The authors declare no conflicts of interest.

References

  1. Sager, M. Urban soils and road dust—Civilization effects and metal pollution—A Review. Environments 2020, 7, 98. [Google Scholar] [CrossRef]
  2. Samek, L.; Stegowski, Z.; Furman, L.; Fiedor, J. Chemical content and estimated sources of fine fraction of particulate matter collected in Krakow. Air Qual. Atmos. Health 2017, 10, 47–52. [Google Scholar] [CrossRef] [PubMed]
  3. Weissmannová, H.D.; Pavlovský, J. Indices of soil contamination by heavy metals—Methodology of calculation for pollution assessment (minireview). Environ. Monit. Assess. 2017, 189, 616. [Google Scholar] [CrossRef] [PubMed]
  4. Adewumi, A.J.; Ogundele, O.D. Hidden hazards in urban soils: A meta-analysis review of global heavy metal contamination (2010–2022), sources and its Ecological and health consequences. Sustain. Environ. 2024, 10, 2293239. [Google Scholar] [CrossRef]
  5. Reizer, M.; Juda-Rezler, K. Explaining the high PM10 concentrations observed in Polish urban areas. Air Qual. Atmos. Health 2016, 9, 517–531. [Google Scholar] [CrossRef] [PubMed]
  6. Styszko, K.; Szramowiat, K.; Kistler, M.; Kasper-Giebl, A.; Samek, L.; Furmanc, L.; Pacyna, J.; Gołas, J. Mercury in atmospheric aerosols: A preliminary case study for the city of Krakow, Poland. Comptes Rendus Chimie 2015, 18, 1183–1191. [Google Scholar] [CrossRef]
  7. Styszko, K.; Samek, L.; Szramowiat, K.; Korzeniewska, A.; Kubisty, K.; Rakoczy-Lelek, R.; Kistler, M.; Giebl, A.K. Oxidative potential of PM10 and PM2.5 collected at high air pollution site related to chemical composition: Krakow case study. Air Qual. Atmos. Health 2017, 10, 1123–1137. [Google Scholar] [CrossRef]
  8. Majewski, G.; Rogula-Kozłowska, W.; Rozbicka, K.; Rogula-Kopiec, P.; Mathews, B.; Brandyk, A. Concentration, Chemical Composition and Origin of PM1: Results from the First Long-term Measurement Campaign in Warsaw (Poland). Aerosol Air Qual. Res. 2018, 18, 636–654. [Google Scholar] [CrossRef]
  9. World Health Organization. WHO Ambient Air Pollution Database May 2016; World Health Organization: Geneva, Switzerland, 2016.
  10. Traczyk, P.; Gruszecka-Kosowska, A. The condition of air pollution in Kraków, Poland, in 2005–2020, with health risk assessment. Int. J. Environ. Res. Public Health 2020, 17, 6063. [Google Scholar] [CrossRef]
  11. Rataj, M.; Holewa-Rataj, J. Analysis of air quality changes in Malopolska in the years 2012–2020. Nafta-Gaz 2020, 11, 854–863. [Google Scholar] [CrossRef]
  12. Gąsiorek, M.; Kowalska, J.; Mazurek, R.; Pajak, M. Comprehensive assessment of heavy metal pollution in topsoil of historical urban park on an example of the Planty Park in Krakow (Poland). Chemosphere 2017, 179, 148–158. [Google Scholar] [CrossRef] [PubMed]
  13. Hajduga, G.; Generowicz, A.; Kryłów, M. Human health risk assessment of heavy metals in road dust collected in Cracow. E3S Web Conf. 2019, 100, 00026. [Google Scholar] [CrossRef]
  14. Navarrete, I.A.; Gabiana, C.C.; Dumo, J.R.E.; Salmo, S.G.; Guzman, M.A.L.G.; Valera, N.S.; Espiritu, E.Q. Heavy metal concentrations in soils and vegetation in urban areas of Quezon City, Philippines. Environ. Monit. Assess. 2017, 189, 145. [Google Scholar] [CrossRef]
  15. Roje, V.; Orešković, M.; Rončević, J.; Bakšić, D.; Pernar, N.; Perković, I. Assessment of the trace element distribution in soils in the parks of the city of Zagreb (Croatia). Environ. Monit. Assess. 2018, 190, 121. [Google Scholar] [CrossRef]
  16. Golia, E.E.; Papadimou, S.G.; Cavalaris, C.; Tsiropoulos, N.G. Level of Contamination Assessment of Potentially Toxic Elements in the Urban Soils of Volos City (Central Greece). Sustainability 2021, 13, 2029. [Google Scholar] [CrossRef]
  17. Wieczorek, K.; Turek, A.; Szczesio, M.; Wolf, W.M. Comprehensive Evaluation of Metal Pollution in Urban Soils of a Post-Industrial City—A Case of Łódź, Poland. Molecules 2020, 25, 4350. [Google Scholar] [CrossRef]
  18. Sołek-Podwika, K.; Podwika, M.; Niemyska-Łukaszuk, J. Trace element concentration in soil of selected forests of Krakow city. Ecol. Chem. Eng. A 2013, 20, 187–191. [Google Scholar] [CrossRef]
  19. Setälä, H.; Francini, G.; Allen, J.A.; Jumpponen, A.; Hui, N.; Kotze, D.J. Urban parks provide ecosystem services by retaining metals and nutrients in soils. Environ. Pollut. 2017, 231, 451–461. [Google Scholar] [CrossRef] [PubMed]
  20. Montaño-López, F.; Biswas, A. Are heavy metals in urban garden soils linked to vulnerable populations? A case study from Guelph, Canada. Sci. Rep. 2021, 11, 11286. [Google Scholar] [CrossRef]
  21. Mahmoudabadi, E.; Sarmadian, F.; Nazary Moghaddam, R. Spatial distribution of soil heavy metals in different land uses of an industrial area of Tehran (Iran). Int. J. Environ. Sci. Technol. 2015, 12, 3283–3298. [Google Scholar] [CrossRef]
  22. Te Polskie Miasta-w 2023 Roku Nie-Schodzily z Czolowek. Zachwycal Sie Nimi Caly Swiat. Available online: https://www.national-geographic.pl/traveler/artykul/te-polskie-miasta-w-2023-roku-nie-schodzily-z-czolowek-zachwycal-sie-nimi-caly-swiat-231213093607 (accessed on 19 July 2024).
  23. Central Statistical Office (CSO 2023). Urząd Statystyczny w Krakowie/m. Kraków. Available online: https://krakow.stat.gov.pl (accessed on 10 May 2024). (In Polish)
  24. Bokwa, A. Evolution of studies on local climate of Kraków. Acta Geographica Lodziensia 2019, 108, 7–20. [Google Scholar]
  25. IUSS Working Group WRB. World Reference Base for Soil Resources. In International Soil Classification System for Naming Soils and Creating Legends for Soil Maps, 4th ed.; International Union of Soil Sciences (IUSS): Vienna, Austria, 2022. [Google Scholar]
  26. Tan, K.H. Soil Sampling, Preparation and Analysis; Taylor & Francis Group: Boca Raton, FL, USA; London, UK; New York, NY, USA; Singapore, 2005; p. 408. [Google Scholar]
  27. Ostrowska, A.; Gawliński, S.; Szczubiałka, Z. Methods of Soil and Plant Analyses and Evaluation; Instytut Ochrony Środowiska: Warszawa, Poland, 1991; p. 234. (In Polish) [Google Scholar]
  28. Gorlach, E.; Mazur, T. Agricultural chemistry. In Basics of Nutrition and Principles of Fertilization; PWN: Warszawa, Poland, 2001; p. 347. (In Polish) [Google Scholar]
  29. Hendershof, W.H.; Lalande, H.; Reyes, D.; MacDonald, J.D. Trace element assessment. In Soil Sampling and Methods of Analysis; Carter, M.R., Gregorich, E.G., Eds.; Taylor and Francis Group, LLC: New York, NY, USA, 2006. [Google Scholar]
  30. Alef, K.; Nannipieri, R. Methods in Applied Soil Microbiology and Biochemistry; Academic Press: London, UK; New York, NY, USA; San Francisco, CA, USA, 1995; pp. 318–320. [Google Scholar]
  31. Cassida, L.E.; Klein, D.A.; Santoro, T. Soil dehydrogenase activity. Soil. Sci. 1964, 98, 371–376. [Google Scholar] [CrossRef]
  32. Tabatabai, M.A.; Brenner, J.M. Assay of urease activity in soils. Soil. Biol. Biochem. 1972, 4, 479–487. [Google Scholar] [CrossRef]
  33. Frankenberger, J.R.; Johanson, J.B. Method of measuring invertase activity in soils. Plant Soil 1983, 74, 301–311. [Google Scholar] [CrossRef]
  34. Statistica (Data Analysis Software System), version 13.3; StatSoft Inc.: Tulsa, OK, USA, 2019.
  35. ter Braak, C.J.F.; Smilauer, P. Canoco Reference Manual and User’s Guide: Software for Ordination, version 5.0; Microcomputer Power: Ithaca, NY, USA, 2012. [Google Scholar] [CrossRef]
  36. Paz-Ferreiro, J.; Gascó, G.; Gutiérrez, B.; Méndez, A. Soil biochemical activities and the geometric mean of enzyme activities after application of sewage sludge and sewage sludge biochar to soil. Biol. Fertil. Soils 2012, 48, 511–517. [Google Scholar] [CrossRef]
  37. García-Ruiz, R.; Ochoa, V.; Hinojosa, M.B.; Carreira, A. Suitability of enzyme activities for the monitoring of soil quality improvement in organic agricultural systems. Soil Biol. Biochem. 2008, 40, 2137–2145. [Google Scholar] [CrossRef]
  38. Müller, G. Index of geoaccumulation in sediments of the Rhine River. Geo J. 1969, 2, 108–118. [Google Scholar] [CrossRef]
  39. Kowalska, J.B.; Mazurek, R.; Gąsiorek, M.; Zaleski, T. Pollution indices as useful tools for the comprehensive evaluation of the degree of soil contamination—A review. Environ. Geochem. Health 2018, 40, 2395–2420. [Google Scholar] [CrossRef] [PubMed]
  40. Czarnowska, K. Ogólna zawartość metali ciężkich w skałach macierzystych jako tło geochemiczne gleb. Rocz. Glebozn. 1996, XLVII, 43–50. [Google Scholar]
  41. Zhong, L.; Liming, L.; Jiewen, Y. Assessment of Heavy Metals Contamination of Paddy Soil in Xiangyin County, China. In Symposium 4.1.2 Management and Protection of Receiving Environments, 19th World Congress of Soil Science, Soil Solutions for a Changing World 19, Brisbane, Australia, 1–6 August 2010; pp. 17–20, (CABI Digital Library, Brisbane).
  42. Håkanson, L. An ecological risk index for aquatic pollution control: A sedimentological approach. Water Res. 1980, 14, 975–1001. [Google Scholar] [CrossRef]
  43. Silva, H.F.; Silva, N.F.; Oliveira, C.M.; Matos, M.J. Heavy Metals Contamination of Urban Soils—A Decade Study in the City of Lisbon, Portugal. Soil Syst. 2021, 5, 27. [Google Scholar] [CrossRef]
  44. Błońska, E.; Lasota, J.; Szuszkiewicz, M.; Łukasik, A.; Klamerus-Iwan, A. Assessment of forest soil contamination in Krakow surroundings in relation to the type of stand. Environ. Earth Sci. 2016, 75, 1–15. [Google Scholar] [CrossRef]
  45. Haque, F.U.; Faridullah, F.; Irshad, M.; Bacha, A.U.R.; Ullah, Z.; Fawad, M.; Hafeez, F.; Iqbal, A.; Nazir, R.; Alrefaei, A.F.; et al. Distribution and speciation of trace elements in soils of four land-use systems. Land 2023, 12, 1894. [Google Scholar] [CrossRef]
  46. Beckett, K.P.; Freer-Smith, P.; Taylor, G. The capture of particulate pollution by trees at five contrasting UK urban sites. Arboric. J. 2000, 24, 209–230. [Google Scholar] [CrossRef]
  47. Douay, F.; Pruvot, C.; Waterlot, C.; Fritsch, C.; Fourrier, H.; Loriette, A.; Bidar, G.; Grand, C.; De Vaufleury, A.; Scheifler, R. Contamination of woody habitat soils around a former lead smelter in the North of France. Sci. Total Environ. 2009, 407, 5564–5577. [Google Scholar] [CrossRef] [PubMed]
  48. Gruba, P.; Socha, J.; Błońska, E.; Lasota, J. Effect of variable soil texture, metal saturation of soil organic matter (SOM) and tree species composition on spatial distribution of SOM in forest soils in Poland. Sci. Total Environ. 2015, 521–522, 90–100. [Google Scholar] [CrossRef] [PubMed]
  49. Podwika, M.; Solek-Podwika, K.; Kaleta, D.; Ciarkowska, K. The effect of land-use change on urban grassland soil quality (southern Poland). J. Soil. Sci. Plant Nutr. 2020, 20, 473–483. [Google Scholar] [CrossRef]
  50. Błońska, E.; Lasota, J.; Gruba, P. Effect of temperate forest tree species on soil dehydrogenase and urease activities in relation to other properties of soil derived from loess and glaciofluvial sand. Ecol. Res. 2016, 31, 655–664. [Google Scholar] [CrossRef]
  51. Galušková, I.; Borůvka, L.; Drábek, O. Urban soil contamination by potentially risk elements. Soil. Water Res. 2011, 6, 55–60. [Google Scholar] [CrossRef]
  52. Ray, S.; Khillare, P.S.; Kim, K.H. The Effect of Aircraft Traffic Emissions on the Soil Surface Contamination Analysis around the International Airport in Delhi, India. Asian J. Atmos. Environ. 2012, 6, 118–126. [Google Scholar] [CrossRef]
  53. Norton, A.; Russell, A.; Radford, A.; Burgess, M.; Bauer, J.A.; Christiansen, S.L.; Knight, S.; Whitacre, S.; Basta, N.; Ceballos, D. Short Report: Addressing Community Air Traffic Concerns: A Pilot Study on Metals and Other Elements in Soil. Water Air Soil. Pollut. 2024, 235, 22. [Google Scholar] [CrossRef]
  54. Massas, I.; Gasparatos, D.; Ioannou, D.; Kalivas, D. Signs for secondary buildup of heavy metals in soils at the periphery of Athens International Airport, Greece. Environ. Sci. Pollut. Res. 2018, 25, 658–671. [Google Scholar] [CrossRef] [PubMed]
  55. da Silva, F.B.V.; do Nascimento, C.W.A.; Araújo, P.R.M.; da Silva, F.L.; Lima, L.H.V. Soil contamination by metals with high ecological risk in urban and rural areas. Int. J. Environ. Sci. Technol. 2017, 14, 553–562. [Google Scholar] [CrossRef]
  56. Pająk, M.; Szostak, M.; Sławiński, M. Geostatistical studies of forest environment contamination in Uroczysko Grodzisko in Bielansko-Tyniecki landscape park. Arch. Fotogram. Kartogr. I Teledetekcji 2012, 24, 245–256. [Google Scholar]
  57. Burt, R.; Hernandez, L.; Shaw, R.; Tunstead, R.; Ferguson, R.; Peaslee, S. Trace element concentration and speciation in selected urban soils in New York City. Environ. Monit. Assess. 2014, 186, 195–215. [Google Scholar] [CrossRef] [PubMed]
  58. Horváth, A.; Kalicz, P.; Farsang, A.; Balázs, P.; Berki, I.; Bidló, A. Influence of human impacts on trace metal contamination in soils of two Hungarian cities. Sci. Total Environ. 2018, 637–638, 1197–1208. [Google Scholar] [CrossRef] [PubMed]
  59. Bolan, N.S.; Adriano, D.C.; Natesan, N.; Koo, B.J. Effects of organic amendments on the reduction and phytoavailability of chromate in mineral soils. J. Environ. Qual. 2003, 32, 120–128. [Google Scholar] [CrossRef] [PubMed]
  60. Jaworska, H.; Lemanowicz, J. Heavy metal contents and enzymatic activity in soils exposed to the impact of road traffic. Sci. Rep. 2019, 9, 19981. [Google Scholar] [CrossRef] [PubMed]
  61. Gil, C.; Boluda, R.; Ramos, J. Determination and evaluation of cadmium, lead and nickel in greenhouse soils of Almería (Spain). Chemosphere 2004, 55, 1027–1034. [Google Scholar] [CrossRef]
  62. Fritsch, C.; Giraudoux, P.; Coeurdassier, M.; Douay, F.; Raoul, F.; Pruvot, C.; Waterlot, C.; de Vaufleury, A.; Scheifler, R. Spatial distribution of metals in smelter-impacted soils of woody habitats: Influence of landscape and soil properties, and risk for wildlife. Chemosphere 2010, 81, 141–155. [Google Scholar] [CrossRef]
  63. Vallius, M.; Janssen, N.A.; Heinrich, J.; Hoek, G.; Ruuskanen, J.; Cyrys, J.; Van Grieken, R.; de Hartog, J.J.; Kreyling, W.G.; Pekkanen, J. Sources and elemental composition of ambient PM2.5 in three European cities. Sci. Total Environ. 2005, 337, 147–162. [Google Scholar] [CrossRef] [PubMed]
  64. Lasota, J.; Błońska, E.; Łyszczarz, S.; Tibbet, M. Forest Humus Type Governs Heavy Metal Accumulation in Specific Organic Matter Fractions. Water Air Spoil Pollut. 2020, 231, 80. [Google Scholar] [CrossRef]
  65. Błońska, E. Effect of Stand Species Composition on the Enzyme Activity and Organic Matter Stabilization in Forest Soil; Scientific Papers of University of Agriculture in Krakow No. 527; University of Agriculture in Krakow: Kraków, Poland, 2015; Volume 404. [Google Scholar]
  66. Ciarkowska, K. Organic matter transformation and porosity development in non-reclaimed mining soils of different ages and vegetation covers: A field study of soils of the zinc and lead ore area in SE Poland. J. Soils Sediments 2017, 17, 2066–2079. [Google Scholar] [CrossRef]
  67. Fang, L.; Liu, Y.; Tian, H.; Chen, H.; Wang, Y.; Huang, M. Proper land use for heavy metal-polluted soil based on enzyme activity analysis around a Pb-Zn mine in Feng County, China. Environ. Sci. Pollut. Res. 2017, 24, 28152–28164. [Google Scholar] [CrossRef]
Figure 1. Location of the research area (Krakow, Malopolska region) and research sites from which soil samples were taken.
Sustainability 16 06874 g001
Figure 2. (AC) Classed post maps showing distribution of mean pH values in KCl (A), SOM contents (B), and DHA activity (C) in the surface layers of soils collected from the Wolski Forest (built-up and green areas).
Sustainability 16 06874 g002
Figure 3. SQe calculated as the geometrical mean of DHA, URE, and INW (A). Pollution indices: PiNemerov (B), ecological RI (C) for soils grouped according to location and plant cover. FW—forest soils from green areas, FT—forest soils from built-up areas, GW—glade soils from green areas, GT—glade soils from built-up areas in the 0–10- and 10–30 cm layers. Different letters (a–d) show statistically significant differences between mean values of the parameters among soils of different plant cover (α ≤ 0.05).
Sustainability 16 06874 g003aSustainability 16 06874 g003b
Figure 4. (AD) Classed post maps showing distribution of contents of Pb, Zn, Cd, and Cr in surface layers of soils collected in the Wolski Forest (built-up and green areas).
Sustainability 16 06874 g004
Figure 5. PCA results showing the relationship between the studied variables (pH, Hh, SOM, N, K, P, Mg, DHA, URE, INW, Cd, Pb, Cr, and Zn) and the location and plant cover of the soils in the surface layer. FW—forest soils from green areas, FT—forest soils from built-up areas, GW—glade soils from green areas, GT—glade soils from built-up areas in the 0–10 cm layer.
Sustainability 16 06874 g005
Table 1. The soil properties (mean ± SD) grouped according to the plant cover of the soil.
Layer 0–10 cm
ParameterFWGWFTGT
2.0–0.0525.7 ± 15.5 b21.8 ± 10.1 b13.3 ± 1.5 a20.0 ± 1.9 ab
0.05–0.00267.8 ± 14.31 a69.0 ± 7.43 a73.0 ± 8.4 a67.7 ± 1.6 a
<0.0026.5 ± 2.0 a9.2 ± 1.03 b13.7 ± 3.2 c12.3 ± 1.4 c
pH KCl3.6 ± 0.4 a4.3 ± 0.5 b4.5 ± 0.6 b4.7 ± 0.4 b
pH H2O4.6 ± 0.4 a5.2 ± 0.5 b5.2 ± 0.6 b5.2 ± 0.4 b
Hh108.2 ± 32.0 c59.3 ± 16.8 a80.0 ± 11.2 b45.7 ± 14.9 a
SOM65.82 ± 20.31 c37.76 ± 7.43 ab45.14 ± 7.41 b27.63 ± 3.63 a
N2.30 ± 0.88 a2.73 ± 1.03 a2.91 ± 0.69 a2.49 ± 0.63 a
K70.31 ± 19.59 a77.05 ± 38.43 a138.29 ± 21.67 b174.13 ± 17.81 c
P55.47 ± 31.53 b21.11 ± 10.40 a40.58 ± 6.92 b41.10 ± 9.02 b
Mg61.95 ± 16.15 a60.74 ± 23.80 a119.61 ± 22.92 b117.33 ± 10.12 b
DHA74.07 ± 36.75 a134.75 ± 14.62 b62.66 ± 25.48 a122.83 ± 15.96 b
URE40.14 ± 24.58 a143.33 ± 23.57 c36.87 ± 6.32 a105.57 ± 53.62 b
INW0.60 ± 0.37 a2.08 ± 0.70 c0.36 ± 0.06 a1.29 ± 0.26 b
Cd0.74 ± 0.26 ab0.62 ± 0.15 a1.05 ± 0.18 c0.85 ± 0.09 b
Pb76.37 ± 12.82 b44.79 ± 9.06 a102.76 ± 29.41 c66.36 ± 6.54 b
Cr41.20 ± 8.05 b30.37 ± 5.55 a52.64 ± 5.27 c40.86 ± 6.64 b
Zn103.76 ± 32.99 b70.01 ± 19.99 a125.47 ± 15.48 c93.59 ± 7.81 b
Igeo Cd1.36 ± 0.54 ab1.16 ± 0.39 a1.94 ± 0.25 c1.65 ± 0.15 bc
Igeo Pb2.36 ± 0.24 b1.57 ± 0.35 a2.74 ± 0.46 c2.17 ± 0.14 b
Igeo Cr0.00 ± 0.30 b−0.44 ± 0.27 a0.37 ± 0.18 c−0.01 ± 0.24 b
Igeo Zn1.13 ± 0.47 b0.57 ± 0.41 a1.47 ± 0.18 c1.05 ± 0.12 b
PLI3.52 ± 0.58 b2.48 ± 0.28 a4.74 ± 0.53 c3.49 ± 0.19 b
Layer 10–30 cm
ParameterFWGWFTGT
2.0–0.0525.6 ± 16.0 c22.9 ± 10.7 bc13.3 ± 1.2 ab15.7 ± 1.2 a
0.05–0.00265.8 ± 13.8 a65.8 ± 6.8 a72.3 ± 2.5 a73.7 ± 2.0 a
pH KCl3.7 ± 0.3 a4.4 ± 0.6 b4.3 ± 0.6 b5.0 ± 0.2 c
pH H2O4.5 ± 0.2 a5.3 ± 0.3 b4.9 ± 0.2 b5.9 ± 0.2 c
Hh60.6 ± 16.0 c43.9 ± 10.7 b79.3 ± 11.2 d30.4 ± 7.5 a
SOM16.87 ± 8.37 a18.81 ± 6.81 a18.46 ± 4.49 a19.37 ± 2.89 a
N0.97 ± 0.59 a1.78 ± 0.95 b2.01 ± 0.45 b2.03 ± 0.48 b
K35.91 ± 7.70 a61.93 ± 34.46 b87.09 ± 21.97 c157.85 ± 43.89 d
P14.01 ± 3.49 a15.46 ± 9.68 a23.69 ± 3.58 b25.48 ± 8.21 b
Mg31.90 ± 6.02 a38.96 ± 10.37 a100.33 ± 19.85 b105.82 ± 9.532 b
DHA41.36 ± 7.34 b52.24 ± 10.25 c31.30 ± 8.17 a48.89 ± 18.18 bc
URE14.00 ± 10.49 a37.76 ± 17.77 b20.15 ± 5.10 a35.96 ± 13.68 b
INW0.12 ± 0.07 a0.23 ± 0.13 b0.12 ± 0.02 a0.19 ± 0.07 ab
Cd0.27 ± 0.08 a0.41 ± 0.12 b0.78 ± 0.07 c0.77 ± 0.08 c
Pb24.12 ± 10.06 a33.30 ± 6.05 b81.43 ± 10.00 d51.51 ± 4.20 c
Cr26.34 ± 5.69 a25.62 ± 4.73 a36.42 ± 5.04 b32.75 ± 5.66 b
Zn79.66 ± 25.66 b45.35 ± 11.15 a82.36 ± 14.02 c64.34 ± 8.13 b
Igeo Cd−0.05 ± 0.31 a0.53 ± 0.45 b1.53 ± 0.14 c1.51 ± 0.14 c
Igeo Pb0.58 ± 0.46 a1.16 ± 0.26 b2.46 ± 0.29 d1.78 ± 0.12 c
Igeo Cr−0.65 ± 0.31 a−0.68 ± 0.26 a−0.17 ± 0.16 b−0.33 ± 0.22 b
Igeo Zn0.75 ± 0.48 bc−0.03 ± 0.25 a0.85 ± 0.24 c0.50 ± 0.18 b
PLI1.70 ± 0.30 a1.79 ± 0.22 a3.38 ± 0.20 c2.79 ± 0.22 b
Hh in mmol(+)kg−1; SOM and N in g∙kg−1; available forms of K, P, and Mg in mg∙kg−1; DHA in mg TPF∙kg−1∙24 h−1; URE in mg N-NH4·kg−1·2 h−1; INW in mg of inverted sugar·g−1·24 h−1; Cd, Pb, Cr, and Zn in mg·kg−1. 1 SD–standard deviation, 2 different letters show statistically significant differences between mean values of the parameter among soils of different plant cover (α ≤ 0.05).
Table 2. Pearson correlation coefficients between the analysed parameters in soils N = 240.
pHHhSOMNKPMgDHAUREINWCdPbCrZn
pH1
Hh−0.58 11
SOM−0.150.651
N0.42ns0.411
K0.68−0.27ns0.421
P−0.150.620.70ns0.321
Mg0.58ns0.150.390.820.361
DHA0.22ns0.410.390.330.310.201
URE0.18−0.160.180.390.16nsns0.701
INW0.16ns0.310.48nsnsns0.800.811
Cd0.310.180.350.500.580.320.730.150.140.141
Pbns0.500.530.400.440.550.65nsnsns0.721
Crns0.340.400.340.370.370.54nsnsns0.630.681
Zn−0.160.520.530.160.250.570.440.16nsns0.460.750.561
1 Coefficient significant at p < 0.05. ns–non significant.
Disclaimer/Publisher’s Note: The statements, opinions and data contained in all publications are solely those of the individual author(s) and contributor(s) and not of MDPI and/or the editor(s). MDPI and/or the editor(s) disclaim responsibility for any injury to people or property resulting from any ideas, methods, instructions or products referred to in the content.

