Abstract
Effluent-containing dye molecules is a significant environmental hazard. An economical and energy-saving solution is needed to combat this issue for the purpose of environmental sustainability. In this study, Fe-Ni-Co-based trimetallic nanocomposite was synthesized using the coprecipitation method. Scanning Electron Microscopy (SEM), X-ray diffraction (XRD), and Fourier Transform Infra-Red spectroscopy were conducted to explore the physical morphology, phase structure and functional groups of the synthesized catalyst. Among dyes, methyl orange is considered as a major contaminant in textile effluent. The current study focused on the degradation of methyl orange using a trimetallic Fe-Ni-Co-based nanocomposite. A central composite design in response surface methodology was employed to analyze the independent variables including dye concentration, catalyst dose, temperature, hydrogen peroxide, irradiation time, and pH. Dye degradation has been achieved up to 81% in 20 min at the lowest initial concentration (5 mg/L) in optimized conditions. Based on ANOVA, the predicted values were in great agreement with the actual values, signifying the applicability of response surface methodology in the photocatalytic decolorization of dyeing effluents. The results gained from this research demonstrated that the synthesis method of trimetallic nanocomposite (Iron Triad) is a cost-effective and energy efficient method that can be scaled up to a higher level for industrial application.
1. Introduction
The advancement in urbanization, overpopulation, and industrialization has been a major source of water pollution and a great threat to water scarcity all over the world. Pakistan has both surface and underground sources of water. However, underground water supplies are being drained because of exponential population growth and industrialization. The fourth biggest city in Pakistan, Rawalpindi, is also struggling with dwindling water supplies due to rapid increase in its population [1]. Pakistan has a diverse industrial sector that includes leather, textiles, pharmaceuticals, petrochemicals, chemicals, fertilizers, paper and pulp, electrical goods, cement, agriculture, automobile engineering, etc. These industries generate significant amounts of wastewater, including organic, inorganic, and biological contaminants, due to their water-intensive processes. For instance, agricultural industry accounts for 70% of global freshwater use. Pesticides and fertilizers can contaminate surface and groundwater, affecting 40% of global rivers [2]. In addition, chemical industry emits 35% of the worldwide industrial effluent, which contains heavy metals and solvents [3], while the mining industry releases heavy metals and other pollutants into waterways, affecting 20% of the global watersheds [4]. Among these industries, the textile industrial processes require large quantities of organic and inorganic dyes (more than 10,000) for various purposes. They consume a significant amount of water and release 72% of their wastewater into surface waters [5], hence generating 20% of global water pollution, with 10 tons of wastewater per day per mill [6,7]. These pollutants eventually result in polluted drinking water, noxious meat (due to toxin bioaccumulation), contaminated river and lake ecosystems that are no longer capable of maintaining biodiversity, forest loss owing to acid rain, and a variety of other negative repercussions. These factors impacting both human health and the environment, however, are particular to the type of pollutants [8]. The toxic impacts due to the presence of these dyes in water and soil for decades deteriorate the quality of water and result in many water-born infectious diseases, leading to jaundice, cardiac arrest, and hepatitis. A groundbreaking study revealed that by the year 2050, the higher level of nitrogen and phosphorous will cause up to 1 in 3 people to be at higher risk of exposure to water contamination [9]. Currently, 2.2 billion people are living in water-stressed areas without access to safe drinking water, and 771 million are among those who lack the basic amenity of drinking water. These harmful effects on natural resources and ecosystems have encouraged the researchers to study the most appropriate, cost-effective, and eco-friendly approach for handling the textile effluent efficiently [10].
The traditional water treatment methods were used to treat suspended bacteria and colloidal particles in wastewater. Only 20–30% of the organic matter can be removed from contaminated water by conventional treatments, according to domestic and international experimental research and real production outcomes. These methods are not considered efficient for the treatment of dissolved organic contaminants in effluents. Advance water treatment technologies need to be used to overcome the limitations of traditional methods [11]. The prevalent treatments used for the removal of dyes include precipitation, incineration, ozonation [12], disinfection, flocculation, absorption electrodialysis, and electrochemical oxidation [13]. However, these techniques are less efficient for the treatment of complex and chemically stable dyes. Moreover, toxic and volatile gasses are released during the combustion process. Plastics, nuclear waste, and Dichlorodiphenyltrichloroethane (DDT) cannot be removed by biological treatment. Chemical oxidation is another method which uses oxidants, but this method is quite expensive and time consuming, as the half-life of ozone is only 20 min [14].
Interestingly, nanotechnology offers opportunities to improve water treatment systems in terms of cost, size, and pollutant selectivity, rather than simply replacing existing methods. Nanomaterials have a significantly higher surface-to-volume ratio than bulk materials due to their incredibly small size and high activity, which has attracted researchers [15,16]. For the efficient removal of dyes, nanocomposites which contain the mixed metal oxides are currently used [17]. For example, in a recent study, Ni (II)-, Cd (II)- and Mn (II)-based coordination polymers were used as a catalyst for the photodecomposition of rhodamine and antibiotic dinitrazole (DTZ). It was observed that among them, the Mn (II)-based catalyst had a significant 95 and 91% degradation of RhB and DTZ, respectively, in 45 min [18]. In another study, Cu/C hierarchical nanocomposites were synthesized at different temperatures for the photocatalytic degradation of methyl violet under UV irradiation. The results demonstrated that the Cu/C-1000-4 composite achieved 96% efficiency even after four cycles, using a simple regeneration procedure [19]. In a similar study, Fe-doped NiO nanoparticles were prepared by a co-precipitation method for the photodegradation of rhodamine B under visible light. The results showed a 99% degradation of rhodamine B within 40 min with 8% Fe-doped to NiO [20].
Despite the fact that nanotechnology has made the treatment of contaminant facile, there still are some challenges related to the use of nickel oxide nanoparticles, including a lower surface to volume ratio, a larger band gap and the recombination of an electron–hole pair. Furthermore, the use of this catalyst on a large scale is impeded due to a small percentage (4–5%) of UV regions in the solar spectrum [21]. By considering these limitations, a compelling methodology is employed to synthesize an effective light-driven photocatalyst nanocomposite and the doping of transition metal oxides (Co, Cd, Cu, Fe, Zn, Mg, Mn) [20]. Among them, iron oxide nanoparticles are nontoxic, with an efficient photocatalytic efficiency in visible light by reducing the electron–hole recombination and band gap energy of NiO [9]. On the other hand, cobalt oxide is a cost effective, unique and environmentally friendly single component, with an effective band gap of ~2.00 ev for visible light absorption [15,16]. The p-type semiconductor has fascinating electrical and magnetic properties, with vast applications in the degradation of organic pollutants from wastewater. Furthermore, CoO displays an absorption edge in the visible range, demonstrating its potential use in photocatalysis [22].
The trimetallic nanocomposite, due to its high catalytic selectivity/activity, has shown greater efficiency in many applications compared to monometallic nanoparticles [23,24]. This strategy enhances the nanoparticle’s properties by reducing their size and increasing the surface area. In addition, the tuning of the band gap results in a unique photocatalyst with enhanced properties to better absorb light in the solar spectrum. However, the photocatalytic degradation of pollutants is influenced by other factors, such as temperature, catalytic dose, pH, dye concentration, irradiation time, etc. A multi-variable optimization technique is required to optimize these factors for efficient degradation.
In the present work, a novel nanocomposite, containing trimetallic oxides such as iron, nickel, and cobalt have been used for photocatalytic degradation. These three elements are also known as the “Iron Triad” due to their physical and chemical characteristics being similar to each other. The objectives of the present study include (1) the synthesis of a trimetallic nanocomposite of FeO2-NiO2-CoO2 using co-precipitation with improved photocatalytic properties; (2) the efficient degradation of methyl orange (MO) dye using the trimetallic nanocomposite; (3) the optimization of selected parameters using response surface methodology (RSM), which affects the degradation efficiency. In this context, central composite design (CCD) was employed to minimize the runs and optimize the operational parameters. It is an advanced technique for avoiding data redundancy in experimental design [25]. The six operational parameters comprising catalytic dose, dye concentration, irradiation time, pH, hydrogen peroxide concentration and temperature have been optimized using RSM, while the validity of the model has been checked by the ANOVA response.
2. Materials and Methods
2.1. Reagents
All the reagents used in this project were utilized as received, unless specified. The chlorides of Co, Fe and Ni (98% purity), sodium hydroxide (NaOH, >98% purity), ethanol, (99% purity), and methyl orange (MO, 85% purity) were purchased from Sigma Aldrich (St. Louis, MO, USA). All the solutions were prepared in distilled water.
2.2. Synthesis of Fe-Ni-Co Nanocomposite
The nanocomposite was synthesized by the co-precipitation method, as shown in Figure 1. The co-precipitation method is better than other methods due to its cost effectiveness and high yield. The other advantages include desirable morphology and particle size [20]. The solutions were prepared by dissolving FeCl3 (1.62 g), NiCl2 (1.295 g) and CoCl2 (2.3 g) in 100 mL of distilled water. To maintain the pH up to 10, a 0.1 M solution of NaOH was added to the above mixture and it was stirred overnight at 50 °C. The precipitates that formed were then centrifuged and washed with ethanol and water mixture (2:1). The synthesized nanocomposite was then dried in the muffle furnace, ground with a pestle and mortar for further use, and stored in sealed crucibles.
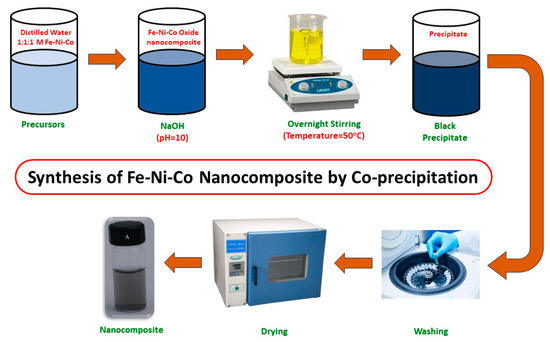
Figure 1.
Synthesis of Fe-Ni-Co nanocomposite.
2.3. Material Characterization
Scanning Electron Microscopy (JEOL, JSM 6490A, Tokyo, Japan) was carried out to observe the surface morphology of the prepared composite. Prior to analysis, the sputtering technique was used to remove the volatile substances and moisture content present in the sample. Furthermore, the elemental configuration was confirmed by Energy Dispersive X-ray Spectroscopy (JEOL, EDS 2300). The X-ray diffraction (XRD, Theta/Theta STOE & Cie Gmbh, Darmstadt, Germany) pattern was recorded with a powder diffractometer 186 (D5000, Siemens; Cu-Ka1, 2 radiations, Dresden, Germany) in the 2θ range of 10–80° with a step size of 0.025° (0.4 s/step). Fourier Transform Infrared Spectroscopy was performed in the range of 400–4000 cm−1 to study the functional groups.
2.4. Optimization of Experimental Parameters Using Response Surface Methodology
In this study, the response surface methodology (RSM) was utilized for the optimization of various parameters using the Design Expert software, version 7.0 [26,27]. Central composite design (CCD) has been used in the current study. In CCD, N = 2k + 2k + cp, in which K is the factor number while cp indicates the central point replica. The effects of six independent variables, including pH, temperature, catalytic dose, dye concentration, hydrogen peroxide concentration, and irradiation time, have been studied for MO degradation. A set of 30 runs were carried out and the obtained response was analyzed for regression and other statistical analysis. The experimental design and ranges are given in Table 1.

Table 1.
Experimental ranges and level of independent variables.
2.5. Photocatalytic Degradation
The efficiency of the prepared nanocomposite was studied for the degradation of methyl orange (MO) using Fe-Ni-Co (0.2–0.8 g/L) at optimized values obtained from the RSM-based experimental design. The pH of the solution was varied from 3.5 to 8.5. To adjust the pH of the solution, 0.1 M HCl and NaOH solutions were used. Prior to the photocatalytic reaction, the dye solution (5–15 mg/L) was stirred in the dark for 20 min to obtain an absorption–desorption equilibrium and then exposed to visible light. The change in the color of the mixture was analyzed using a UV–Visible spectrophotometer (T-60U PG Instruments, Alma Park, Leicestershire, UK), with the maximum absorbance value at 460 nm. To avoid errors, experiments were performed three times, and the percentage degradation was calculated using the formula given below:
where C0 and Ct are the initial and final absorbance value, respectively.
3. Results and Discussion
3.1. Material Characterization
3.1.1. Morphological and Elemental Characterization
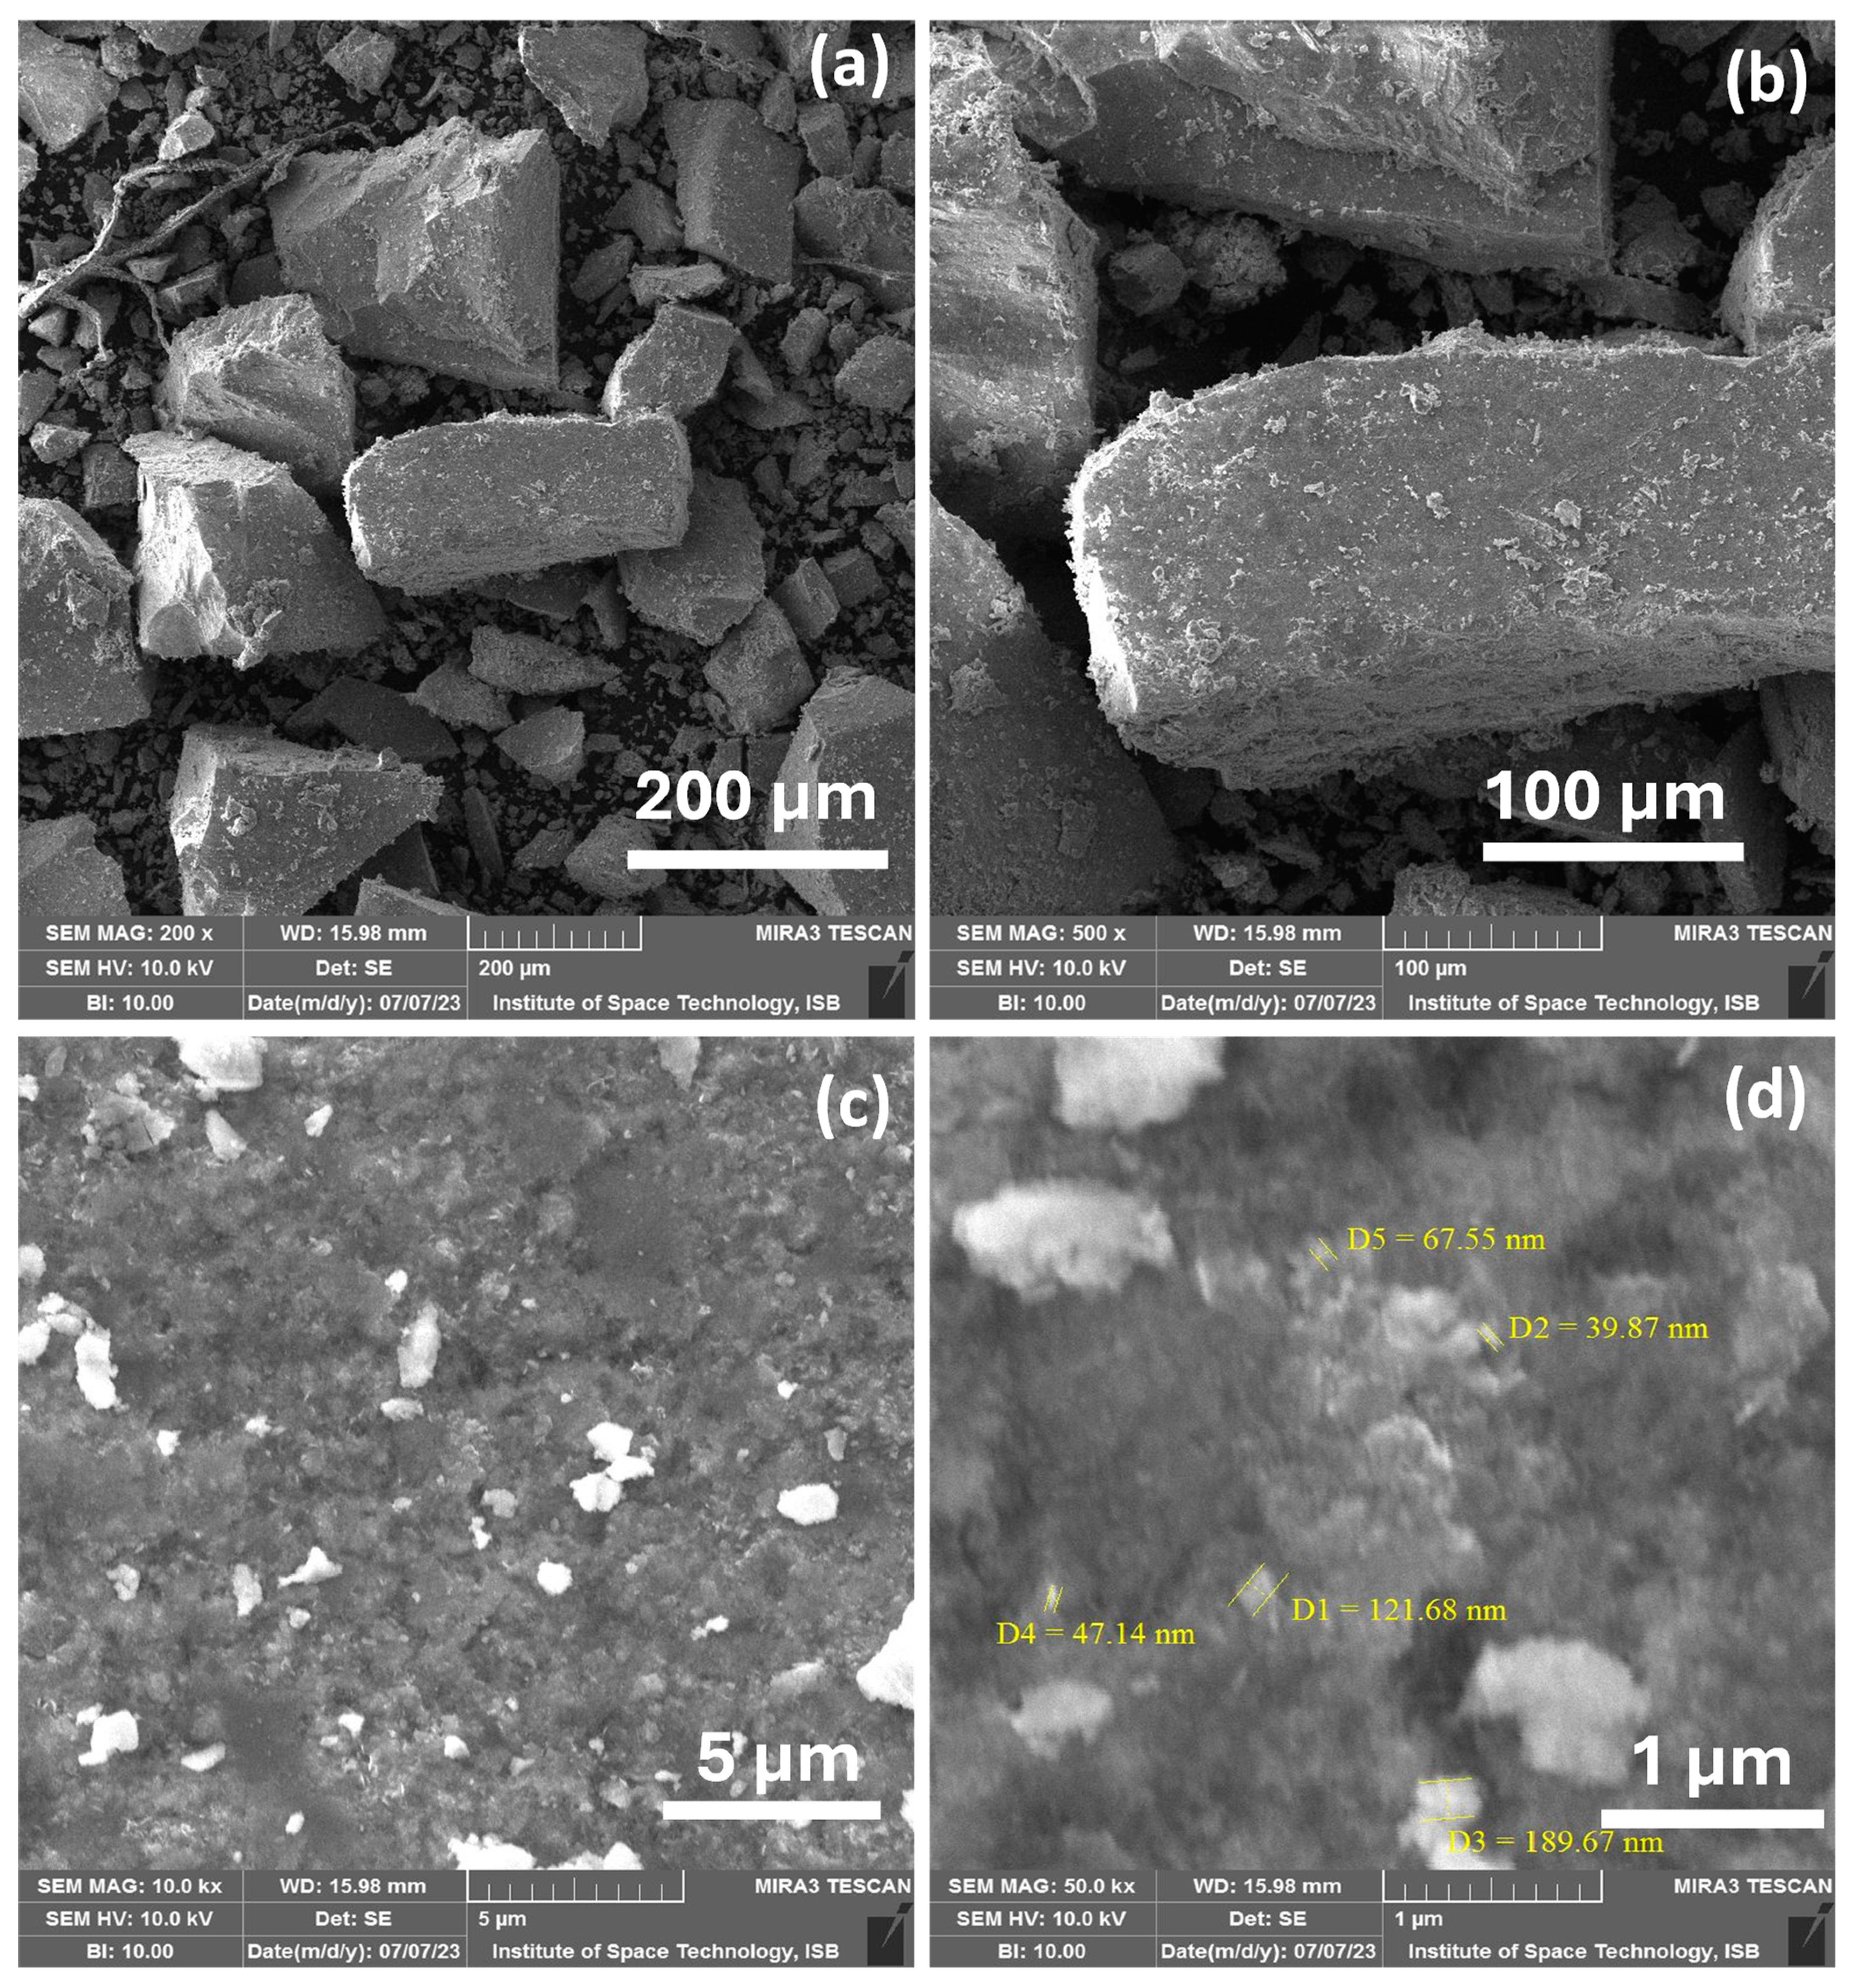
For the morphological studies of the synthesized Fe-Ni-Co-based trimetallic nanocomposite, SEM was carried out. SEM images were taken at 200 and 500× magnification, as shown Figure 2a,b. The agglomerated particles can also be seen in high resolution images (10 kx and 50 kx) in Figure 2c,d. A high surface energy can cause nanoparticle agglomeration, as particles try to reduce their total energy by coming in to contact with one another, which leads to lower catalytic activity. Figure 2d illustrated the average particle size, ranging from 39 to 189 nm.
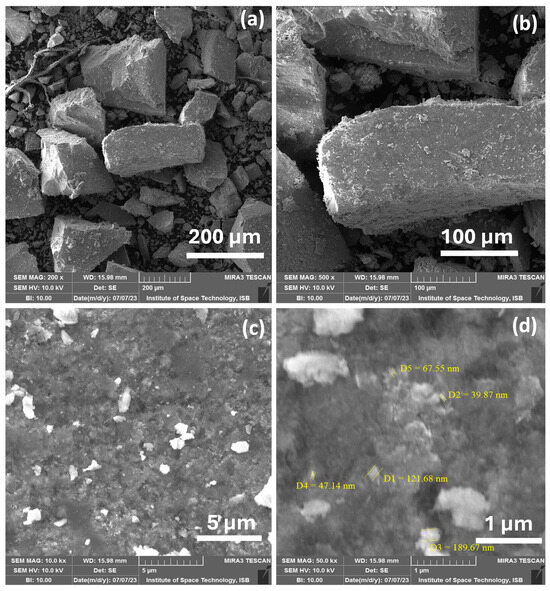
Figure 2.
SEM images of trimetallic nanocomposites at different magnification (a) 200 µm, (b) 100 µm, (c) 5 µm and (d) 1 µm.
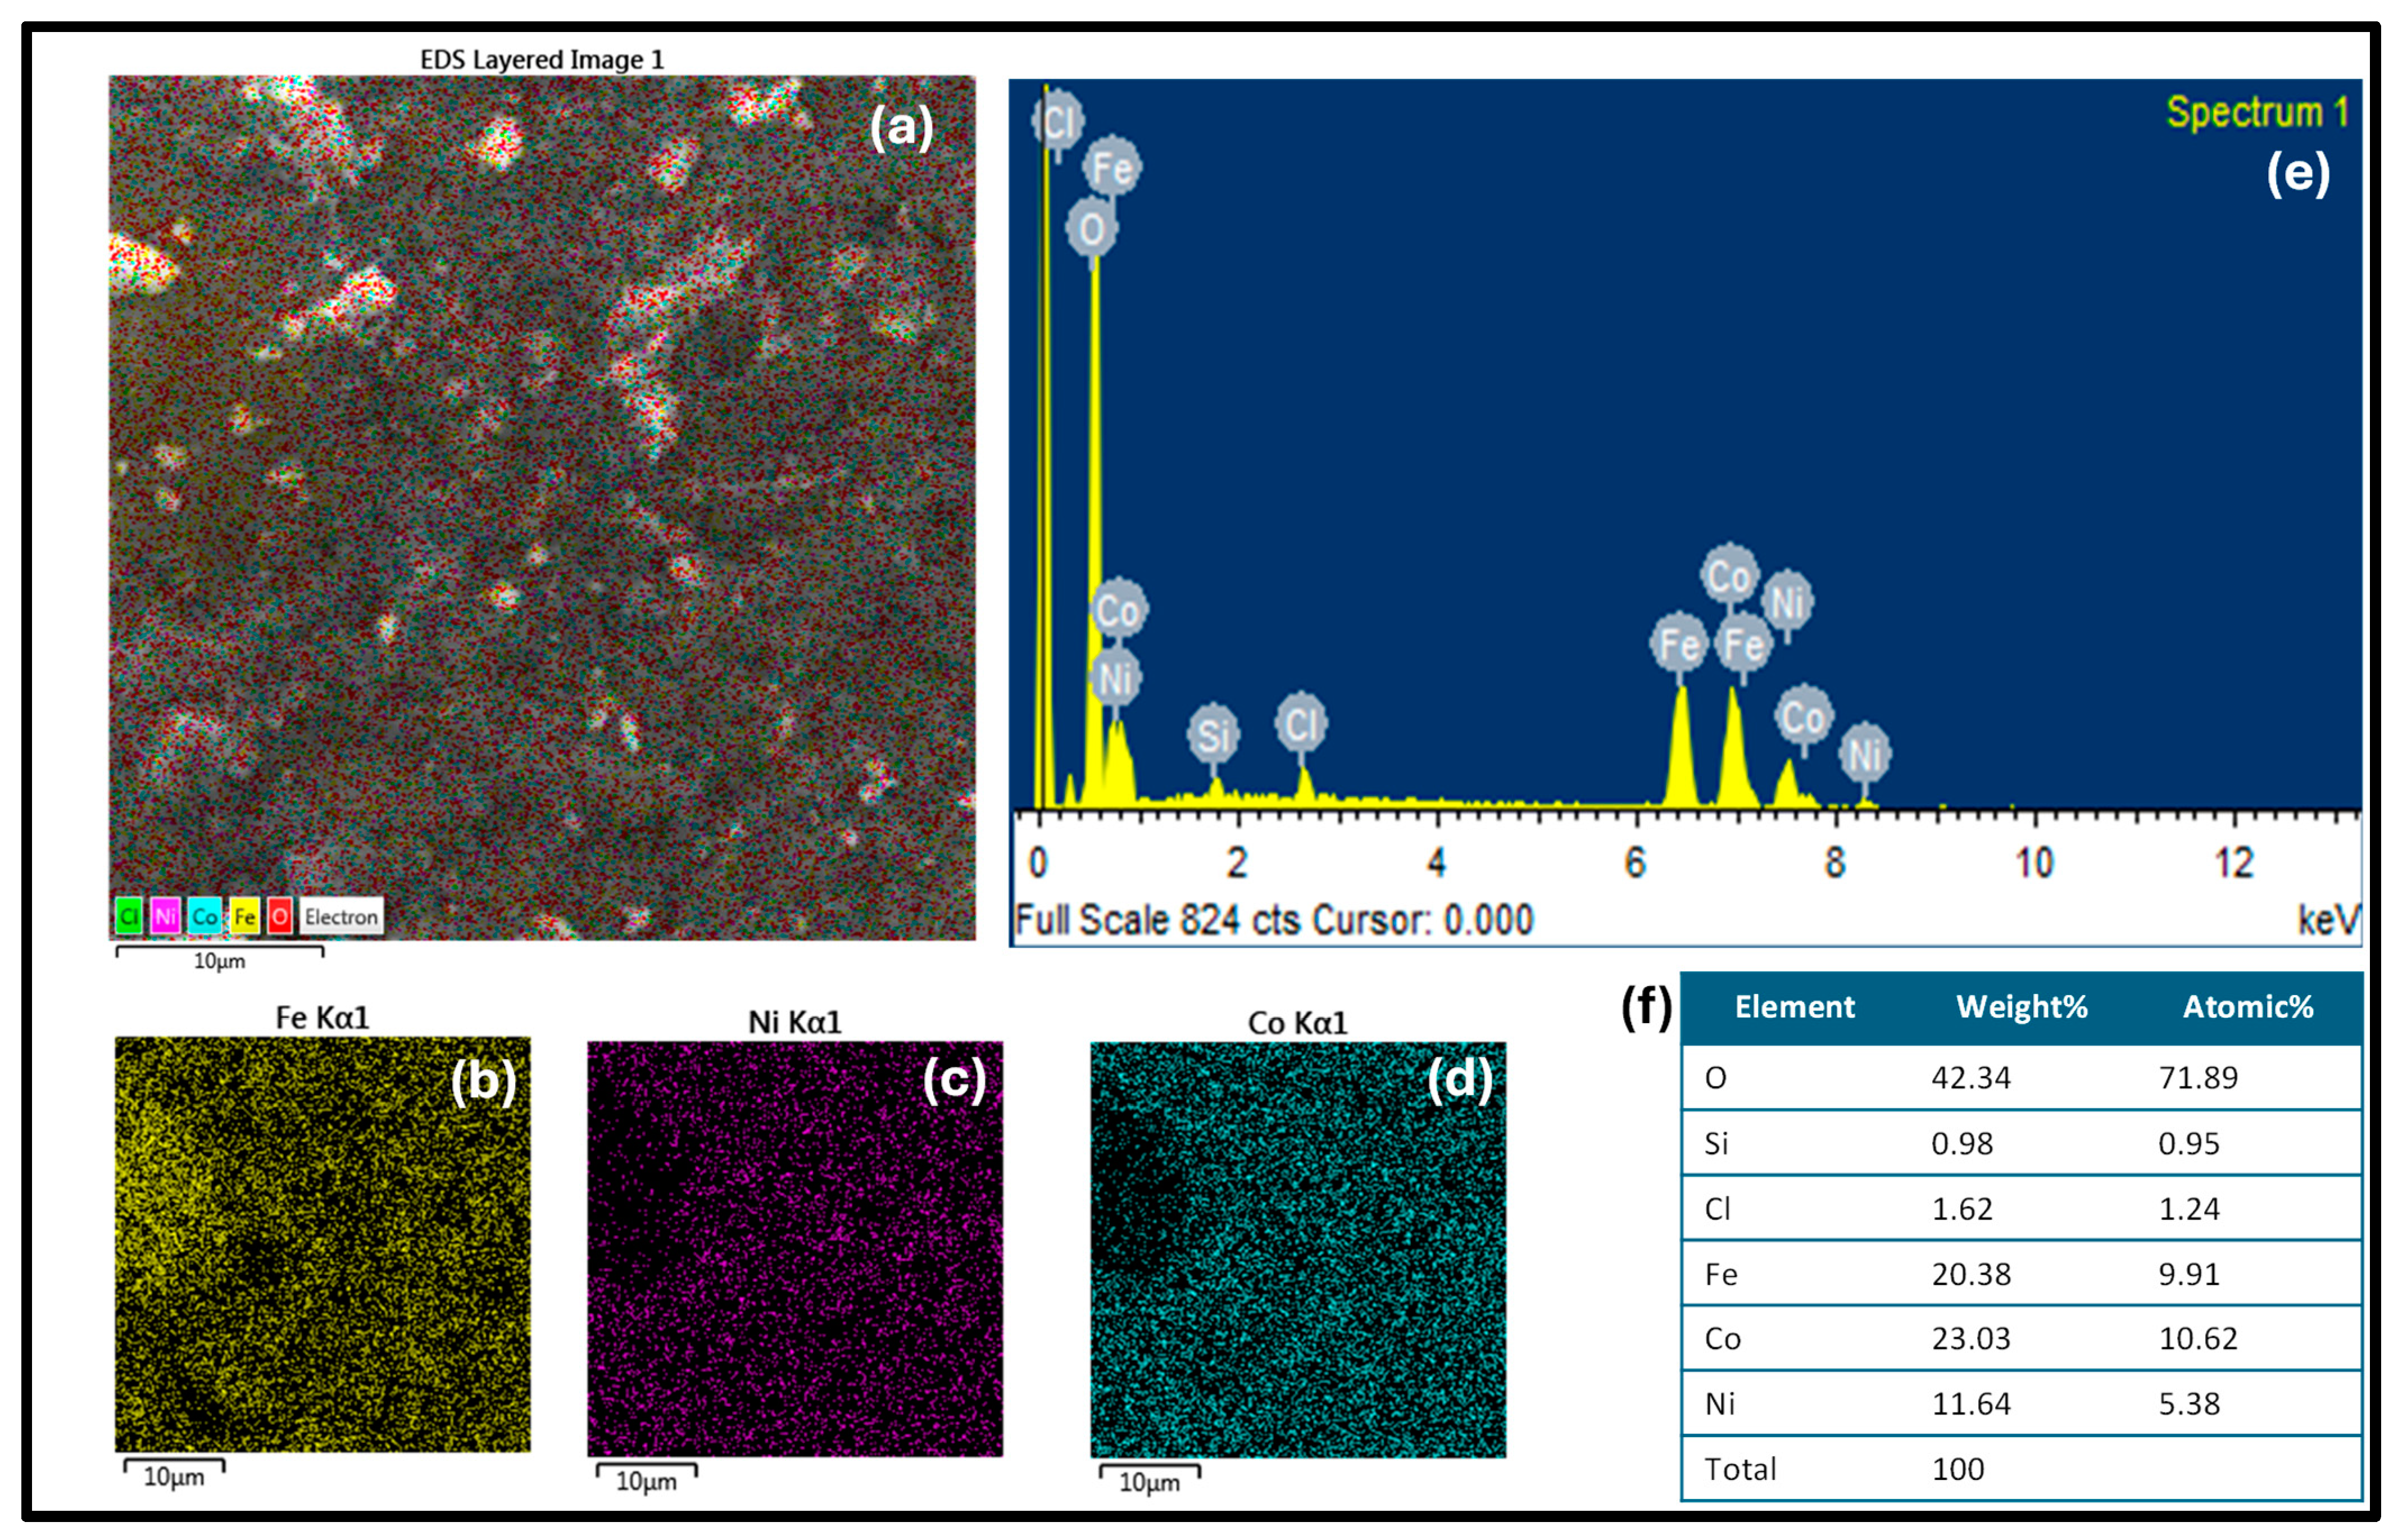
The synthesized nanomaterials were characterized for chemical analysis by EDS. In Figure 3a, the EDS-layered image shows the uniform distribution of the metals Fe, Ni and Co in nanocomposites. The separate diagram for each element including Fe, Ni, and Co is shown in Figure 3b–d, respectively. The homogeneous distribution of Fe, Ni, and Co in a trimetallic composite can result in synergistic effects, in which the presence of three metals improves catalytic activity in comparison to the sum of the individual metal components. The spectra of Figure 3e confirm the presence of all constituting elements (Fe, Ni, and Co) in the nanocomposite. The atomic and weight percentage of the synthesized nanocomposite are given in Figure 3f.
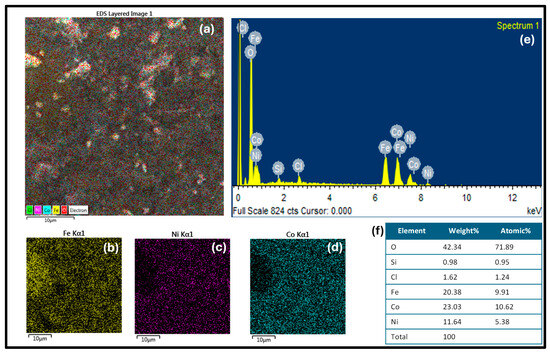
Figure 3.
(a) The EDS-layered image shows the uniform distribution of the metals Fe, Ni and Co in nanocomposites. The separate diagram for each element including Fe, Ni, and Co is shown in (b), (c) and (d), respectively. (e) shows the EDS spectra and (f) illustrates the composition of the trimetallic nanocomposite.
3.1.2. XRD and FTIR Analysis
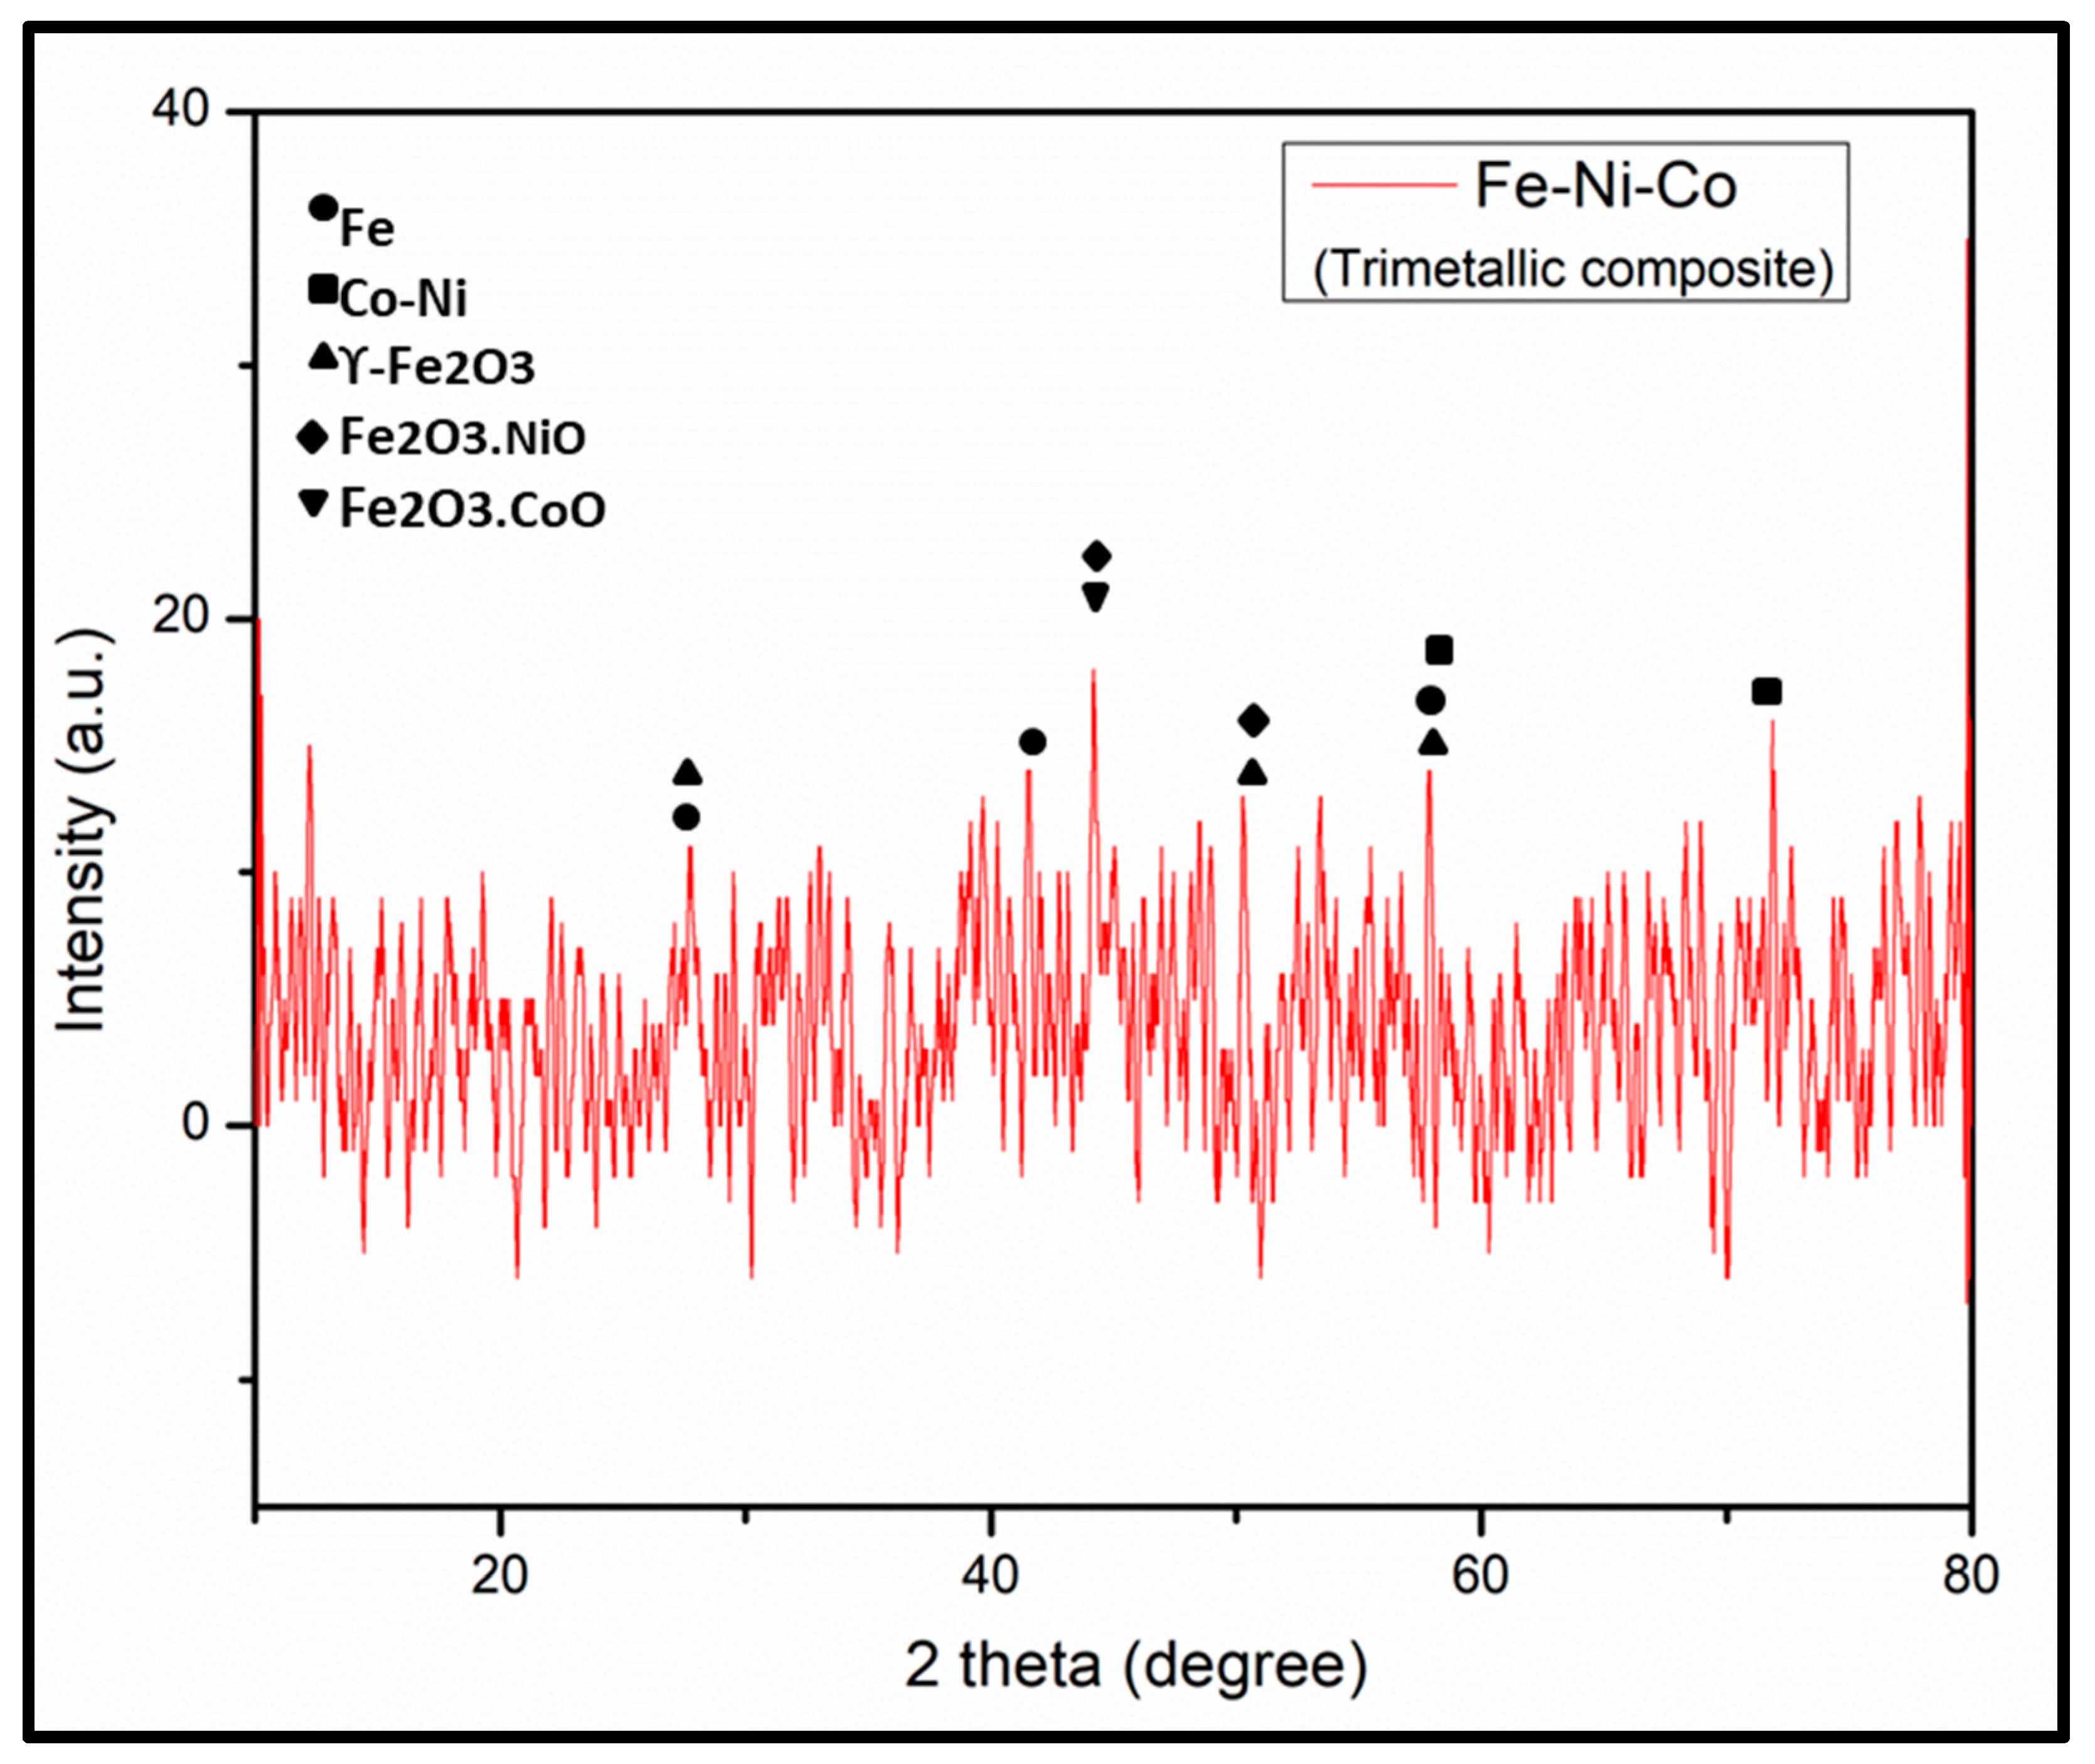
The X-ray diffraction (XRD) pattern was recorded with a powder diffractometer (D5000, Siemens; Cu-Ka1, 2 radiations) in the 2θ range of 10–80° with a step size of 0.025° (0.4 s/step), as shown in Figure 4. The assignment of the peaks has been carried out with reference to XRD patterns of Fe, Ni and Co nanoparticles [28,29,30]. The diffraction peaks at 44° and 50.62° correspond to the (111) and (200) planes of FeNi4.34, respectively, which correspond with FeNi JCPDS # 03-1109 [31]. All the observed XRD peaks positions were compared with JCPDS data (NiFe2O4, JCPDS no. 54-0964; CoFe2O4, JCPDS no. 22-1086; γ-Fe2O3, JCPDS no. 39-1346) [32]. The observed XRD pattern showed the amorphous nature of the synthesized trimetallic composite.
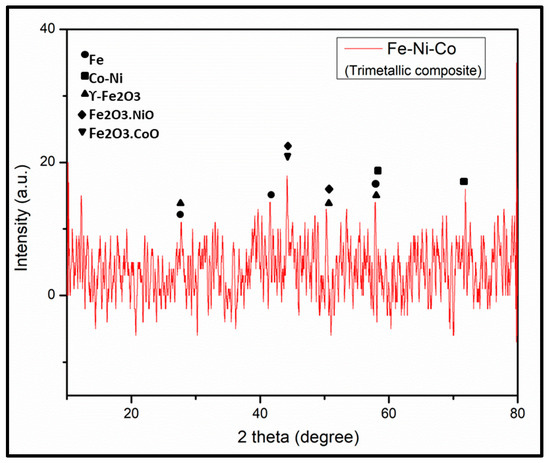
Figure 4.
XRD pattern of trimetallic (Fe-Ni-Co) nanocomposite.
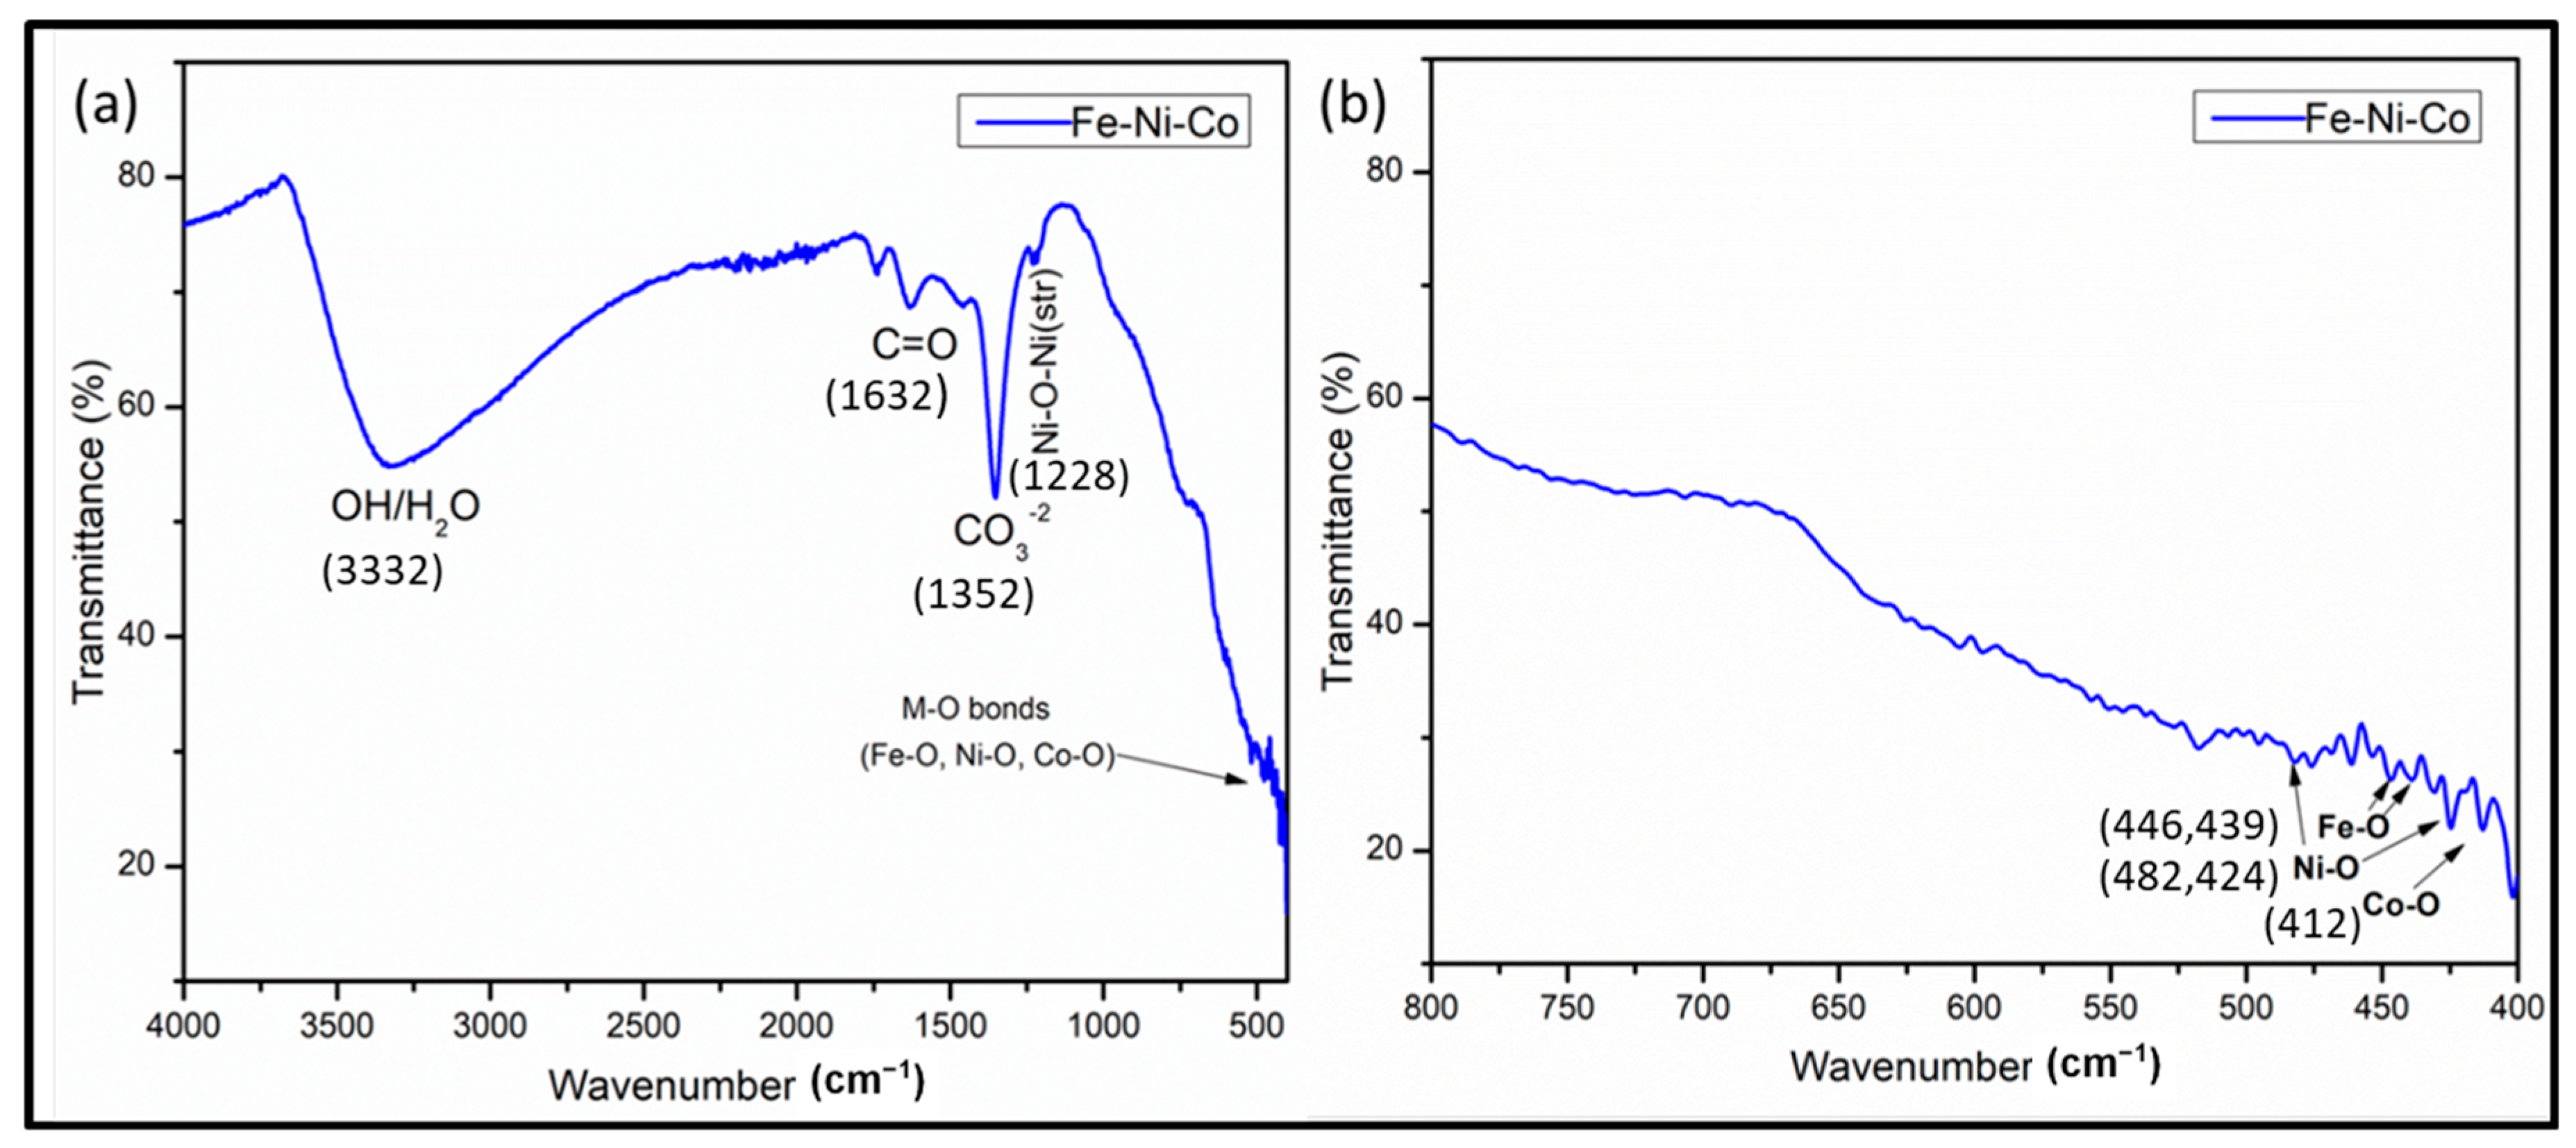
In the FTIR analysis (Figure 5a,b), several absorption bands were observed that provide valuable insights into the composition of the synthesized nanoparticles. Initially, a broad absorption band at 3332.5 was observed, which may be attributed to stretching vibrations in the –OH group. This peak may arise due to the absorbed moisture on the catalyst surface when FTIR analysis was carried out [33,34]. The absorption peak at 1630 corresponds to the stretching vibration peak in C=O. Some additional peaks were also observed at around 500 to 400 cm−1, which are related to the metal oxide bond which belongs to the Co-O, Ni-O and Fe-O vibrations. A lower frequency band at 415 cm−1 is assigned to the stretching mode of the M–O bond in the octahedral sites. Peaks at 482, 424 cm−1 are assigned to Ni-O and peaks at 446 and 439 cm−1 are assigned to the Fe-O bond [34,35].
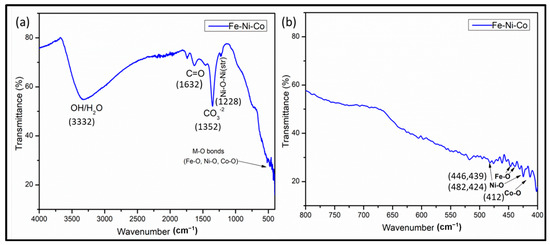
Figure 5.
FTIR spectra of trimetallic nanocomposite (a) and expended FTIR spectral region from 800 to 400 cm−1 (b).
3.2. Mechanism of Photocatalytic Degradtion
When light falls on the nanocomposite, the photons that have energy greater than the band gap get absorbed into the valence band, which causes the excitation of the electrons from the valance band to the conduction band, leaving behind holes in the valence band. The holes cause the splitting of water molecules and generate hydroxyl radical HO•; the electrons in the conduction band reduce the oxygen into superoxide anion ). These photogenerated electron–hole pairs move to the catalytic surface of the nanocomposite, where they cause the degradation of the adsorbed dye into the non-toxic gasses [36]. The schematic representation of photocatalysis is illustrated in Figure 6.
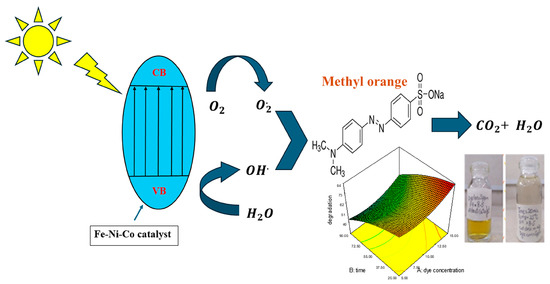
Figure 6.
Schematic overview of photocatalysis.
The mechanism of photocatalytic degradation is shown below:
The positively charged holes and electrons caused the respective oxidative and reductive reactions.
Oxidative reactions
Reductive reaction
2e− + O2 + 2H+→H2O2
e− + H2O2→OH− + OH∙
The OH· (hydroxyl radical), being a very strong oxidant, caused the complete or partial degradation of organic pollutants.
Hence, the efficient photocatalytic degradation of organic dyes occurs without causing any harm to the environment.
3.3. Photocatalytic Degradation
The central composite design has been employed to study the effect of the six independent variables on dye degradation at optimum conditions. The quadratic model second-order polynomial equation has been utilized to show the relationship between the independent variable and response. The central composite design (CCD) matrix generates 33 runs for the above experimental conditions; MO degradation was in correspondence with the degradation predicted by the model given below in Table 2.
Table 2.
Experimental results of photocatalytic degradation.
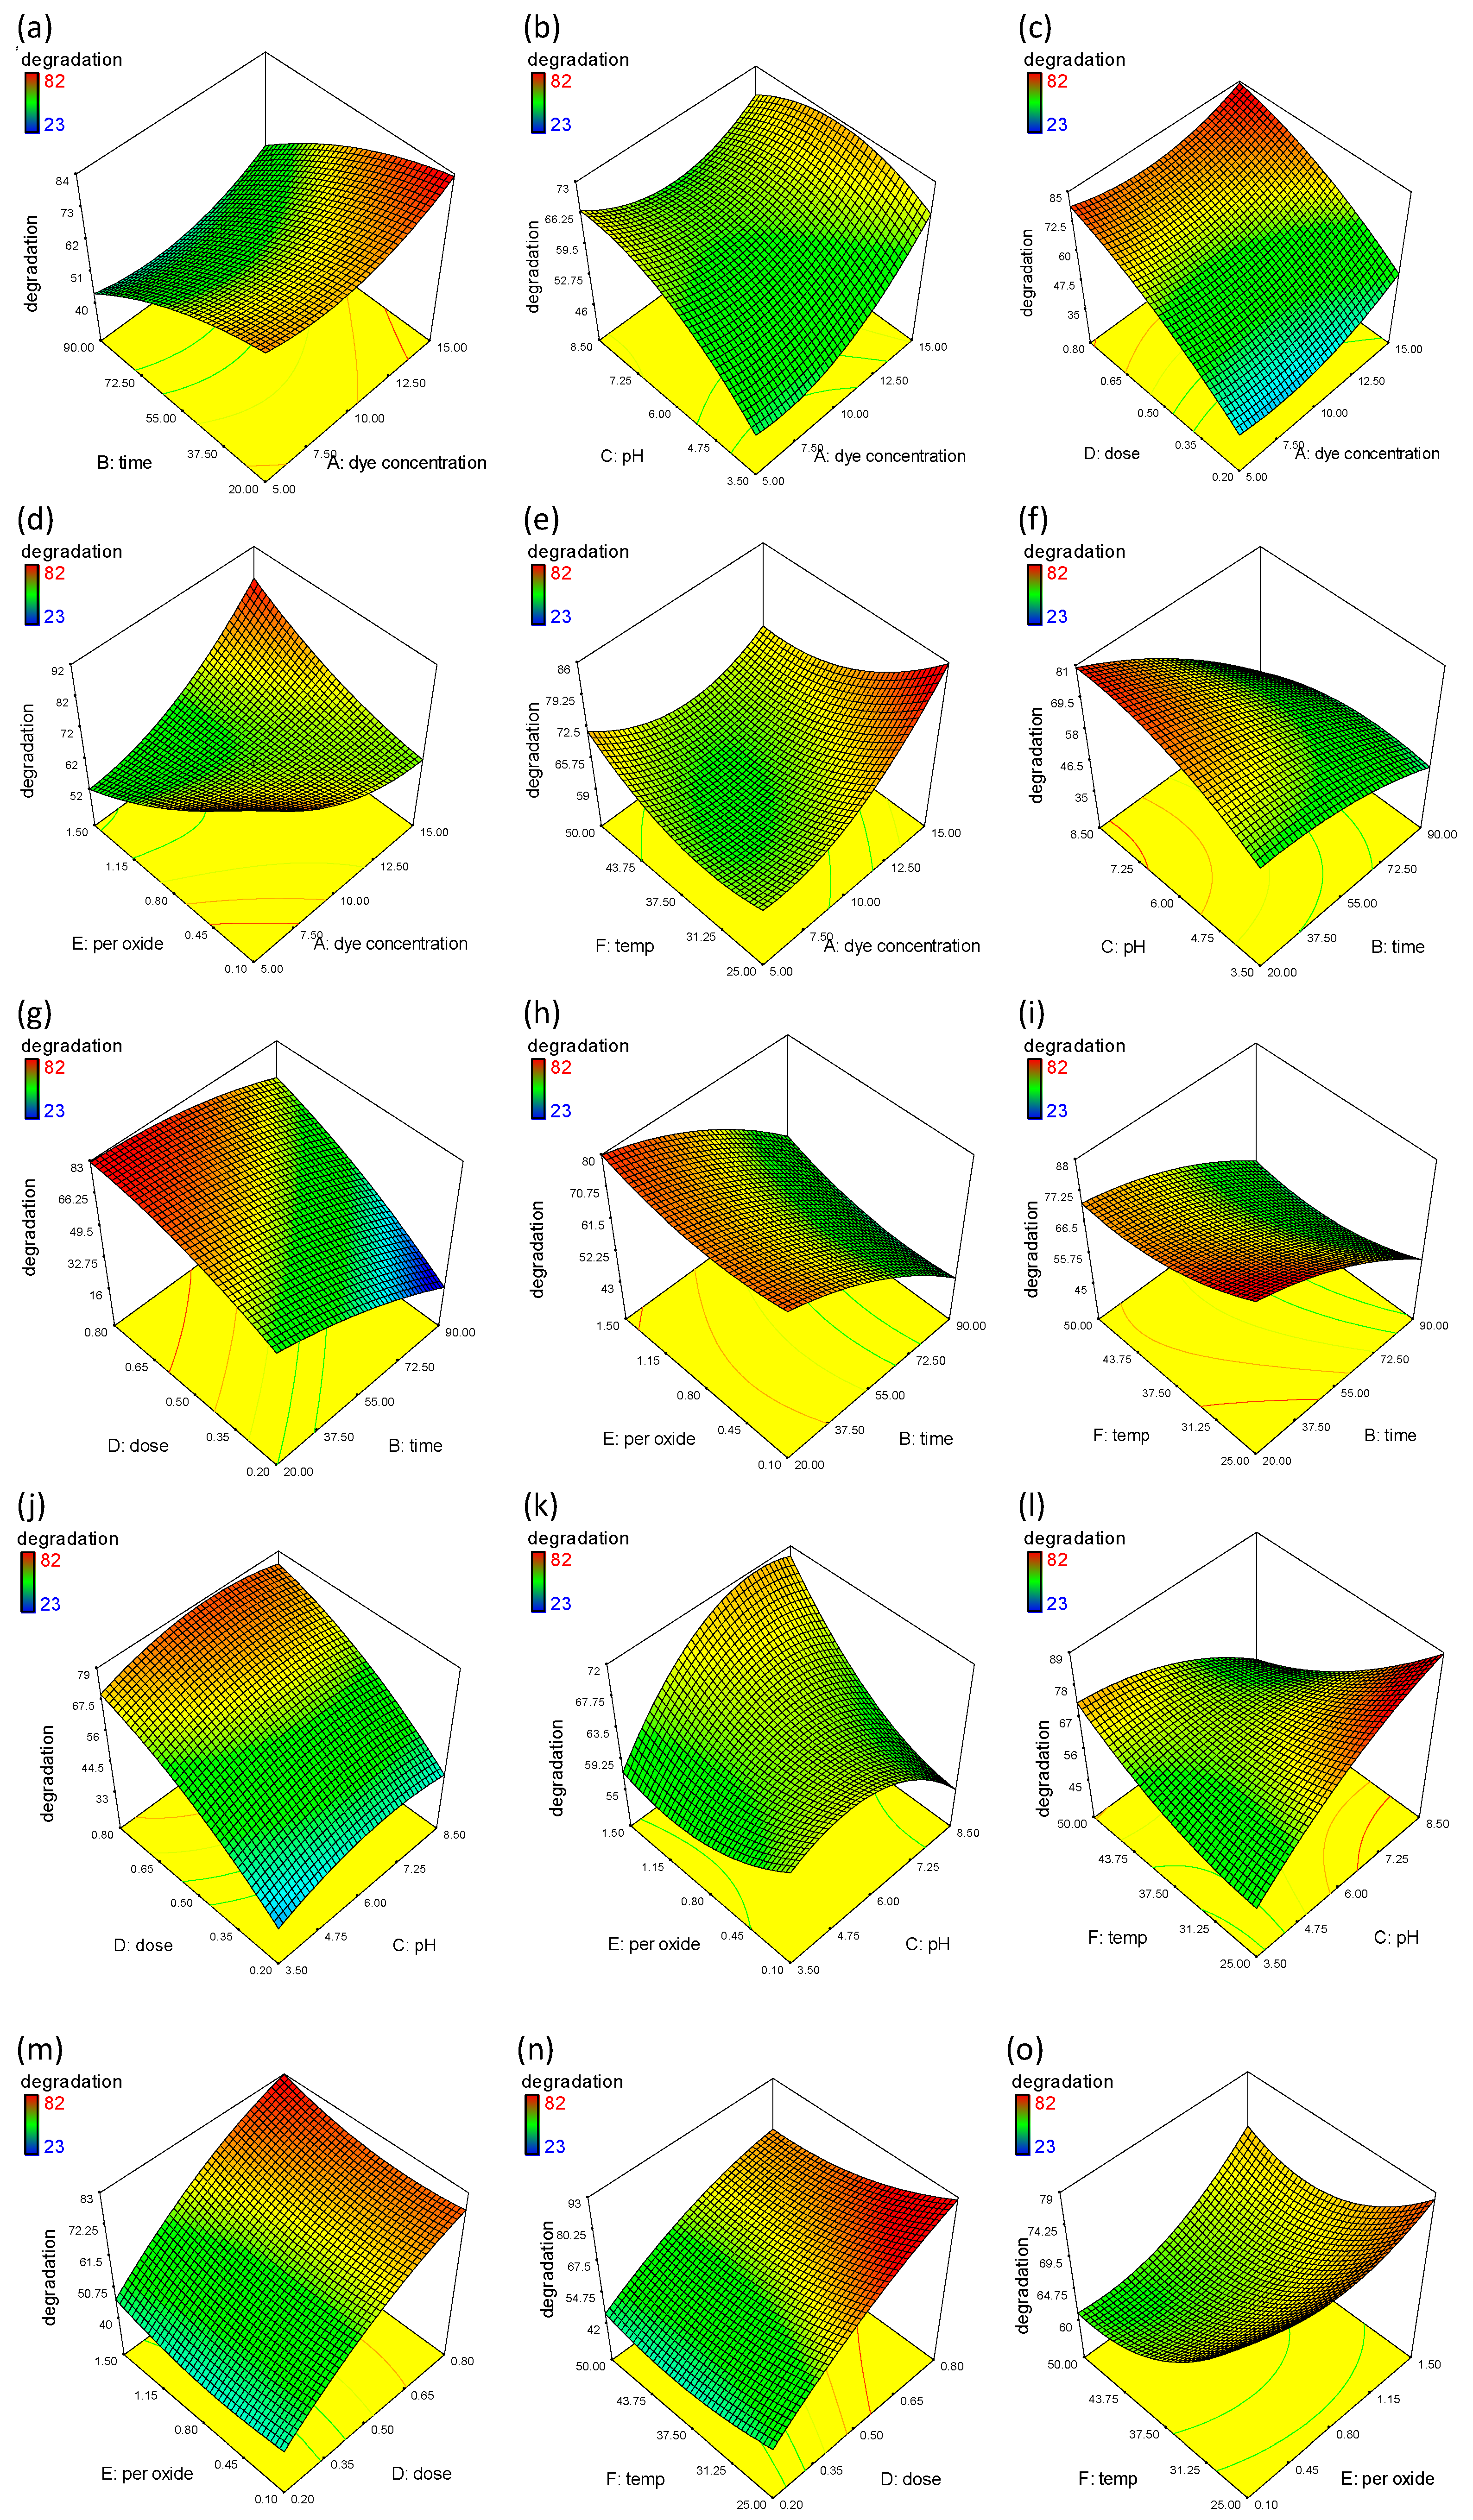
The effect of the initial concentration of MO on its percentage degradation was studied using the Fe-Ni-Co-based nanocomposite. The results were plotted in the form of 3D graphs by RSM. The effect of the initial concentration was studied against each parameter (time, pH, dose, peroxide concentration, and temperature), keeping other parameters constant, as shown in Figure 7a–e. The degradation rate decreased with time by increasing the initial dye concentration from 5 to 15 mg/L, as shown in Figure 7a. This might be attributed to the lower availability of active sites, as the catalyst dose also varies in this case [37]. This inverse relation can also be explained in this context by highlighting that the number of dye molecules increased by increase in concentration, in contrast to the generation of hydroxyl radicals. Thus, the limited hydroxyl radicals would not participate in further degradation. Also, more dye molecules would cause hindrance to the light responsible for initiating the reaction on the catalyst surface [38]. The significant degradation at the higher initial concentration might be attributed to the other factors involved in degradation. Figure 7b shows the effect of pH with increasing initial dye concentration. MO, being an anionic dye, achieves maximum degradation in acidic conditions where a positive charge takes up position on the surface of the catalyst [39]. However, the increase in degradation up to pH 6 is associated with the catalytic surface charge. Significant degradation is observed when increasing the catalyst dose and initial dye concentration, as shown in Figure 7c. The availability of the catalyst dose is responsible for the adsorption of more dye molecules on available active sites. Figure 7d shows the effect of the initial dye concentration and hydroxyl radicals on MO degradation. In contrast to the phenomenon (a decrease in dye degradation with an increase in initial concentration), the presence of hydroxyl radicals significantly increased the degradation rate, as expected. These results are rational enough to confirm the positive influence of hydroxyl radicals on photocatalytic activity [40]. The increase in temperature favors the significant degradation, even at a lower dye concentration, as shown in Figure 7e, which might be attributed to the intensified molecular movement followed by the chemical oxidation of dye molecules at higher temperatures [41].
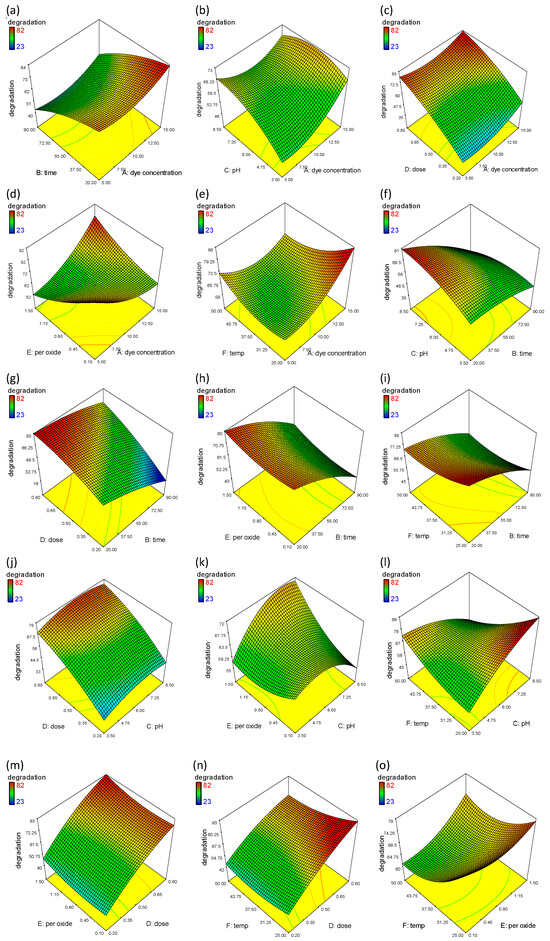
Figure 7.
RSM plots showing the percentage degradation of MO and the interaction between selected variables. (a) The effect of dye concentration and time; (b) the effect of dye concentration and pH; (c) effect of dye concentration and dose; (d) effect of dye concentration and hydrogen peroxide; (e) effect of dye concentration and temperature; (f) effect of time and pH; (g) effect of time and dose; (h) effect of time and hydrogen peroxide; (i) effect of time and temperature; (j) effect of pH and dose; (k) effect of pH and hydrogen peroxide; (l) effect of pH and temperature; (m) effect of dose and hydrogen peroxide; (n) effect of dose and temperature; (o) effect of hydrogen peroxide and temperature.
Reaction time has a significant impact on MO degradation in response to other factors such as solution pH, dye concentration, catalyst dose, and the amount of hydrogen peroxide. Figure 7f shows significant degradation even in shorter irradiation times. However, the degradation increases with an increase in pH and irradiation time. These findings are supported by previous studies, where a shift in pH might affect the characteristics of a photocatalyst both in terms of adsorption behavior and surface charge. Gherbi et al., 2022 synthesized ZnO nanoparticles at different pHs, and an increase in size was observed towards acidic pH that lead to poor adsorption behavior [42]. The surface of the nanocomposite is positively charged at pH < 6.5 in acidic conditions due to the absorption of H^+ions, and at high pH > 7 due to the absorption of OH−ions on the catalyst surface. Two reaction mechanisms, such as spontaneous oxidation by positive holes and direct reduction by electrons, influence the photodegradation efficiency of the MO dye, which is hindered by its anionic or cationic form [43]. Similarly, MO degradation is reported in the literature to increase as the pH increases from 4 to 7, as observed by [44]. Figure 7g–i shows the effect of irradiation time along with catalyst dose, hydrogen peroxide and temperature on MO degradation. The increase in catalyst dose and the presence of hydrogen peroxide concentration dramatically increases the degradation; however, we could not observe a drastic change in degradation with temperature. This is due to the fact that increasing the temperature typically increases the kinetic energy of the reactant molecules, which can speed up the reaction process. This effect, however, only applies up to a certain temperature, after which the rate of reaction can slow, due to nanoparticle deactivation at high temperatures because of thermal structural instability or an increased agglomeration at high temperature [45]. Figure 7j shows the simultaneous effects of dose and pH on the photocatalytic degradation of MO. The catalyst dose in the range of 0.2–0.8 g/L has been used to find the optimum dose. It is determined that the rate of degradation increases with the increase in catalyst dose, irrespective of pH, because the increase in catalyst loading is responsible for the availability of more active sites for dye degradation. The increase in degradation is facilitated by the availability of hydrogen peroxide.
One of the most popular electron acceptors, hydrogen peroxide, enhances the photocatalytic process by raising the level of hydroxyl radicals in the surrounding environment. When added to the solution, it engages in electron-capture competition with other species. However, since it is a potent substance, it is more likely that electrons will be attracted to this substance. As a result, the efficiency of the process will be improved, and the electron–hole recombination will be decreased [46]. H2O2 captures electrons and prevents electron–hole recombination through the following reactions:
Figure 7k,l shows the positive effect of peroxide concentration and temperature on MO degradation due to the charge carrier mobility and interfacial charge transfer for the effective adsorption of dye molecules on the catalyst surface [47]. The elevated temperature improves this phenomenon due to increases in the kinetic energy of the reactant molecules. Also, phase composition and crystallite size are temperature dependent. At different temperatures, nanoparticles with different phase compositions can be obtained with varying photocatalytic efficiency. Furthermore, high temperature leads to nanoparticles with high surface area, which result in agglomeration and thus decrease photocatalytic efficacy [48].
Figure 7m,n demonstrates the maximum significant degradation (+82%) of MO, where catalyst dose has a positive effect on the presence of temperature and peroxide concentration. These results are in accordance with previous reasoning, where the addition of H2O2 improved process effectiveness in less time, and an increase in temperature also increased degradation activity. These results have a significant effect due to the presence of a catalyst dose (more available active sites). Figure 7o shows the positive effect of temperature with respect to the peroxide concentration responsible for the hydroxyl radicals, a strong oxidant which reduces electron–hole recombination and significantly increases the percentage degradation [49].
In this study, six independent variables are optimized using RSM. As per model validation, the maximum 81% degradation in 20 min was observed at the lowest initial concentration (5 mg/L) with 0.20 g/L catalyst dose, and 0.10 mg/L H2O2 concentration at 50 °C and pH 8. Similar removal efficiency was observed when we performed experiments under these optimal conditions, demonstrating the CCD model’s applicability and success in process optimization. Based on the experimental results and software validation, the optimal conditions are defined in terms of efficiency, time, and cost effectiveness. A comparison of the current work with the literature studies is given in Table 3.
Table 3.
Comparison of current work with literature.
3.4. RSM Analysis and ANOVA
The RSM was used to analyze the effect of operational parameters on the degradation efficiency of the nanocomposite in optimum conditions. According to ANOVA, the highest F-value was found for the catalytic dose, i.e., 89.18 and its p value < 0.0001, which shows that the catalyst amount has a great influence on the degradation of the dye. Similarly, the reaction time, with an F-value of 59.32, is also a major influencing variable. The best fitted model was the quadratic model which optimized the parameters. Based on the results, the model equation was derived as follows:
% degradation = −65.98367 − 2.01802A − 0.085802B + 37.80808C +139.79147D − 93.44843E + 1.50483F
−7.14286 × 10⁻⁴ AB − 0.38000AC − 1.52805AB + 4.27823AE − 0.10000AF − 0.082860BC + 0.60714BD +
0.040816BE + 4.31814 × 10⁻³ BF − 0.66667CD + 3.07143CE − 0.52394CF − 0.92606DE − 1.06667DF + 0.30000EF
+ 0.27070A2 − 3.28694 × 10⁻³ B2 − 0.87678C2 − 51.81528D2 + 7.14610E2 + 0.032861F2.
−7.14286 × 10⁻⁴ AB − 0.38000AC − 1.52805AB + 4.27823AE − 0.10000AF − 0.082860BC + 0.60714BD +
0.040816BE + 4.31814 × 10⁻³ BF − 0.66667CD + 3.07143CE − 0.52394CF − 0.92606DE − 1.06667DF + 0.30000EF
+ 0.27070A2 − 3.28694 × 10⁻³ B2 − 0.87678C2 − 51.81528D2 + 7.14610E2 + 0.032861F2.
Through analysis of variance (ANOVA test), the RSM model suitability was checked [55]. The model’s F-value of 15.44 implies the model is significant. Values of “Prob > F” less than 0.0500 indicate the model terms are significant. In this case, B, D, AC, AE, AF, BC, BD, CE, CF, DF, A2, B2, C2, D2, E2, F2 are significant model terms.
Values greater than 0.1000 indicate the model terms are not significant. So, the lack of fit is non-significant. The recommendation is a minimum of 3 lack of fit df and 4 df for pure error. This ensures a valid lack of fit test. The value of the coefficient of variation % is 7.05. If its value is below 10, this means that the result of our experiment and our experimental design work efficiently. If its value is higher than 10, then it indicates that our model is not fit for the experiment.
The fit of the model was qualified by the estimated higher determination coefficient (R2 = 0.9881) which indicated that the model could be used as a predictor of the response. The predicted responses were in good agreement with the experimentally obtained response (R2 = 0.9881 and Adj R2 = 0.9241). The ANOVA result has been shown in the following table, Table 4.
Table 4.
ANOVA and lack of fit for response surface quadratic model.
3.5. Adequacy of Regression Model
A normal probability plot is a statistical test to see if the data points fall within the 95% confidence interval [26]. The predicted and the experimental values of degradation lie close to each other. Figure 8 shows strong correlation and the accuracy of the model. Since all the data points lie on the central line it shows the validity of the CCD.
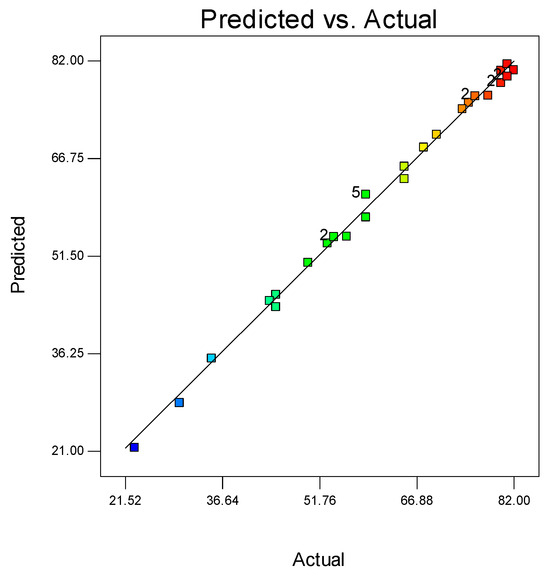
Figure 8.
Comparison between the predicted and actual degradation of MO.
4. Conclusions
Overall, this research on nanocomposite photocatalysts for the degradation of pollutants like MO contributes to the advancement of sustainable wastewater treatment technologies by offering efficient, cost effective, and environmentally friendly solutions. The Fe Ni-Co-based nanocomposite of trimetallic oxides was effectively used for the degradation of MO. RSM has been employed to optimize all the parameters using CCD. Six operational parameters, i.e., temp, time, dose, dye concentration, peroxide concentration, and pH, have been optimized by expert design software. The quadratic model was the best fit model to check the significance of the experimental design. Dye degradation has been achieved up to 81% in 20 min at the lowest initial concentration (5 mg/L) in optimized conditions (0.20 g/L catalyst dose, 0.10 mg/L H2O2 concentration at 50 °C and pH 8). Based on ANOVA, the predicted values were in great agreement with the actual values, signifying the applicability of RSM in the photocatalytic decolorization of dyeing effluents. A similar removal efficiency was observed when we performed experiments under these optimal conditions, demonstrating the CCD model’s applicability and success in process optimization. Based on the experimental results and software validation, the optimal conditions are defined in terms of efficiency, time, and cost effectiveness. Among the six experimental parameters, catalytic dose has a great influence over the degradation rate, and the increased amount of catalytic dose provides more active sites for the MO adsorption; however, a higher amount beyond the optimum level would decrease the efficiency. Nanotechnology, being an innovative approach for the degradation or removal of environmental pollutants from wastewater, is still being developed. Based on the results gained from this research, this synthesis method of a trimetallic nanocomposite (Iron Triad) is a cost-effective and energy efficient method that can be scaled up to a higher level for industrial application.
Author Contributions
Conceptualization, Z.H., P.Z. and S.I.; methodology, A.R.; software, H.M.A.S.; validation, Z.H., P.Z. and Z.Z.; formal analysis, A.R., B.S.I. and K.B.; writing—original draft preparation, A.R., B.S.I. and K.B.; writing—review and editing, Z.H., S.I., H.M.A.S. and Z.Z.; supervision, Z.H. and S.I. All authors have read and agreed to the published version of the manuscript.
Funding
This research received no external funding.
Data Availability Statement
Data are contained within the article.
Acknowledgments
The authors would like to acknowledge the Rawalpindi Women University and National University of Science and Technology for providing the lab facilities to carry out this research work successfully.
Conflicts of Interest
The authors declare no conflicts of interest.
References
- ul Haq, F.; Naeem, U.A.; Gabriel, H.F.; Khan, N.M.; Ahmad, I.; Ur Rehman, H.; Zafar, M.A. Impact of urbanization on groundwater levels in Rawalpindi City, Pakistan. Pure Appl. Geophys. 2021, 178, 491–500. [Google Scholar] [CrossRef]
- Rad, S.M.; Ray, A.K.; Barghi, S. Water pollution and agriculture pesticide. Clean Technol. 2022, 4, 1088–1102. [Google Scholar] [CrossRef]
- Kanagamani, K.; Geethamani, P.; Narmatha, M. Hazardous waste management. In Environmental Issues and Sustainable Development; IntechOpen: London, UK, 2020. [Google Scholar]
- Ighalo, J.O.; Kurniawan, S.B.; Iwuozor, K.O.; Aniagor, C.O.; Ajala, O.J.; Oba, S.N.; Iwuchukwu, F.U.; Ahmadi, S.; Igwegbe, C.A. A review of treatment technologies for the mitigation of the toxic environmental effects of acid mine drainage (AMD). Process Saf. Environ. Prot. 2022, 157, 37–58. [Google Scholar] [CrossRef]
- Singh, P.; Vishnu, M.; Sharma, K.K.; Singh, R.; Madhav, S.; Tiwary, D.; Mishra, P.K. Comparative study of dye degradation using TiO2-activated carbon nanocomposites as catalysts in photocatalytic, sonocatalytic, and photosonocatalytic reactor. Desalination Water Treat. 2016, 57, 20552–20564. [Google Scholar] [CrossRef]
- Ansari, A.; Siddiqui, V.U.; Rehman, W.U.; Akram, M.K.; Siddiqi, W.A.; Alosaimi, A.M.; Hussein, M.A.; Rafatullah, M. Green synthesis of TiO2 nanoparticles using Acorus calamus leaf extract and evaluating its photocatalytic and in vitro antimicrobial activity. Catalysts 2022, 12, 181. [Google Scholar] [CrossRef]
- Jiang, Q.; Chen, S.; Deng, X.; Feng, Y.; Reddy, N.; Zhu, Q.; Liu, W.; Qiu, Y. A sustainable low temperature yarn reinforcing process to reduce water and energy consumptions and pollution in the textile industry. J. Clean. Prod. 2019, 210, 646–652. [Google Scholar] [CrossRef]
- Hussain, Z.; Arslan, M.; Malik, M.H.; Mohsin, M.; Iqbal, S.; Afzal, M. Treatment of the textile industry effluent in a pilot-scale vertical flow constructed wetland system augmented with bacterial endophytes. Sci. Total Environ. 2018, 645, 966–973. [Google Scholar] [CrossRef]
- Ifpri, V. The Murky Future of Global Water Quality: New Global Study Projects Rapid Deterioration in Water Quality; International Food Policy Research Institute (IFPRI) and Veolia Water North America: Washington, DC, USA; Chicago, IL, USA, 2015. [Google Scholar]
- Kashiwasi, H.; Fujs, T. World Water Day: Two Billion People Still Lack Access to Safely Managed Water; World Bank: Washington, DC, USA, 2023. [Google Scholar]
- Wu, Q.; Xu, X.; Yang, H.; Ke, L. Application of nanotechnology in wastewater treatment. Nanosci. Nanotechnol. 2017, 1, 19–25. [Google Scholar]
- Venkatesh, S.; Venkatesh, K.; Quaff, A.R. Dye decomposition by combined ozonation and anaerobic treatment: Cost effective technology. J. Appl. Res. Technol. 2017, 15, 340–345. [Google Scholar] [CrossRef]
- Yavuz, Y.; Savaş Koparal, A.; Öğütveren, Ü.B. Electrochemical oxidation of Basic Blue 3 dye using a diamond anode: Evaluation of colour, COD and toxicity removal. J. Chem. Technol. Biotechnol. 2011, 86, 261–265. [Google Scholar] [CrossRef]
- Naseem, T.; Durrani, T. The role of some important metal oxide nanoparticles for wastewater and antibacterial applications: A review. Environ. Chem. Ecotoxicol. 2021, 3, 59–75. [Google Scholar] [CrossRef]
- Chani, M.T.S.; Khan, S.B.; Rahman, M.M.; Kamal, T.; Asiri, A.M. Sunlight assisted photocatalytic dye degradation using zinc and iron based mixed metal-oxides nanopowders. J. King Saud Univ.-Sci. 2022, 34, 101841. [Google Scholar] [CrossRef]
- Akbari, A.; Sabouri, Z.; Hosseini, H.A.; Hashemzadeh, A.; Khatami, M.; Darroudi, M. Effect of nickel oxide nanoparticles as a photocatalyst in dyes degradation and evaluation of effective parameters in their removal from aqueous environments. Inorg. Chem. Commun. 2020, 115, 107867. [Google Scholar] [CrossRef]
- Kamal, T.; Ahmad, I.; Khan, S.B.; Ul-Islam, M.; Asiri, A.M. Microwave assisted synthesis and carboxymethyl cellulose stabilized copper nanoparticles on bacterial cellulose nanofibers support for pollutants degradation. J. Polym. Environ. 2019, 27, 2867–2877. [Google Scholar] [CrossRef]
- Wu, Y.; Zhong, W.; Wang, X.; Wu, W.; Muddassir, M.; Daniel, O.; Raj Jayswal, M.; Prakash, O.; Dai, Z.; Ma, A. New Transition Metal Coordination Polymers Derived from 2-(3, 5-Dicarboxyphenyl)-6-carboxybenzimidazole as Photocatalysts for Dye and Antibiotic Decomposition. Molecules 2023, 28, 7318. [Google Scholar] [CrossRef]
- Rao, C.; Zhou, L.; Pan, Y.; Lu, C.; Qin, X.; Sakiyama, H.; Muddassir, M.; Liu, J. The extra-large calixarene-based MOFs-derived hierarchical composites for photocatalysis of dye: Facile syntheses and contribution of carbon species. J. Alloys Compd. 2022, 897, 163178. [Google Scholar] [CrossRef]
- Minisha, S.; Johnson, J.; Mohammad Wabaidur, S.; Gupta, J.K.; Aftab, S.; Siddiqui, M.R.; Lai, W.-C. Synthesis and Characterizations of Fe-Doped NiO Nanoparticles and Their Potential Photocatalytic Dye Degradation Activities. Sustainability 2023, 15, 14552. [Google Scholar] [CrossRef]
- Truppi, A.; Petronella, F.; Placido, T.; Striccoli, M.; Agostiano, A.; Curri, M.L.; Comparelli, R. Visible-light-active TiO2-based hybrid nanocatalysts for environmental applications. Catalysts 2017, 7, 100. [Google Scholar] [CrossRef]
- Vijayalakshmi, S.; Lydia, I.S.; Vasudevan, D. Indian Journal of Advances in Chemical Science. Indian J. Adv. Chem. Sci. 2019, 7, 122–129. [Google Scholar]
- Basavegowda, N.; Mishra, K.; Lee, Y.R. Trimetallic FeAgPt alloy as a nanocatalyst for the reduction of 4-nitroaniline and decolorization of rhodamine B: A comparative study. J. Alloys Compd. 2017, 701, 456–464. [Google Scholar] [CrossRef]
- Yu, W.; Porosoff, M.D.; Chen, J.G. Review of Pt-based bimetallic catalysis: From model surfaces to supported catalysts. Chem. Rev. 2012, 112, 5780–5817. [Google Scholar] [CrossRef] [PubMed]
- Hamza, W.; Fakhfakh, N.; Dammak, N.; Belhadjltaeif, H.; Benzina, M. Sono-assisted adsorption of organic compounds contained in industrial solution on iron nanoparticles supported on clay: Optimization using central composite design. Ultrason. Sonochemistry 2020, 67, 105134. [Google Scholar] [CrossRef] [PubMed]
- Tahir, H.; Saad, M.; Attala, O.A.; El-Saoud, W.A.; Attia, K.A.; Jabeen, S.; Zeb, J. Sustainable Synthesis of Iron–Zinc Nanocomposites by Azadirachta indica Leaves Extract for RSM-Optimized Sono-Adsorptive Removal of Crystal Violet Dye. Materials 2023, 16, 1023. [Google Scholar] [CrossRef] [PubMed]
- Vaez, M.; Zarringhalam Moghaddam, A.; Alijani, S. Optimization and modeling of photocatalytic degradation of azo dye using a response surface methodology (RSM) based on the central composite design with immobilized titania nanoparticles. Ind. Eng. Chem. Res. 2012, 51, 4199–4207. [Google Scholar] [CrossRef]
- Manjunatha, M.; Reddy, G.S.; Mallikarjunaiah, K.; Damle, R.; Ramesh, K. Determination of phase composition of cobalt nanoparticles using 59 Co internal field nuclear magnetic resonance. J. Supercond. Nov. Magn. 2019, 32, 3201–3209. [Google Scholar] [CrossRef]
- Hirano, Y.; Kasai, Y.; Sagata, K.; Kita, Y. Unique approach for transforming glucose to C3 platform chemicals using metallic iron and a Pd/C catalyst in water. Bull. Chem. Soc. Jpn. 2016, 89, 1026–1033. [Google Scholar] [CrossRef]
- Jayaseelan, C.; Rahuman, A.A.; Ramkumar, R.; Perumal, P.; Rajakumar, G.; Kirthi, A.V.; Santhoshkumar, T.; Marimuthu, S. Effect of sub-acute exposure to nickel nanoparticles on oxidative stress and histopathological changes in Mozambique tilapia, Oreochromis mossambicus. Ecotoxicol. Environ. Saf. 2014, 107, 220–228. [Google Scholar] [CrossRef] [PubMed]
- Qazi, U.Y.; Yuan, C.-Z.; Ullah, N.; Jiang, Y.-F.; Imran, M.; Zeb, A.; Zhao, S.-J.; Javaid, R.; Xu, A.-W. One-step growth of iron–nickel bimetallic nanoparticles on FeNi alloy foils: Highly efficient advanced electrodes for the oxygen evolution reaction. ACS Appl. Mater. Interfaces 2017, 9, 28627–28634. [Google Scholar] [CrossRef]
- Chen, C.; Tuo, Y.; Lu, Q.; Lu, H.; Zhang, S.; Zhou, Y.; Zhang, J.; Liu, Z.; Kang, Z.; Feng, X. Hierarchical trimetallic Co-Ni-Fe oxides derived from core-shell structured metal-organic frameworks for highly efficient oxygen evolution reaction. Appl. Catal. B Environ. 2021, 287, 119953. [Google Scholar] [CrossRef]
- Khairnar, S.D.; Shrivastava, V.S. Facile synthesis of nickel oxide nanoparticles for the degradation of Methylene blue and Rhodamine B dye: A comparative study. J. Taibah Univ. Sci. 2019, 13, 1108–1118. [Google Scholar] [CrossRef]
- You, S.-M.; El Rouby, W.M.; Thamilselvan, A.; Tsai, C.-K.; Darmanto, W.; Doong, R.-A.; Millet, P. Fe/Ni bimetallic organic framework deposited on TiO2 nanotube array for enhancing higher and stable photoelectrochemical activity of oxygen evaluation reaction. Nanomaterials 2020, 10, 1688. [Google Scholar] [CrossRef] [PubMed]
- Ramasamy, R.; Ramachandran, K.; Philip, G.G.; Ramachandran, R.; Therese, H.A. Design and development of Co3O4/NiO composite nanofibers for the application of highly sensitive and selective non-enzymatic glucose sensors. RSC Adv. 2015, 5, 76538–76547. [Google Scholar] [CrossRef]
- Barzinjy, A.; Hamad, S.; Aydın, S.; Hussain, F. Green and eco-friendly synthesis of Nickel oxide nanoparticles and its photocatalytic activity for methyl orange degradation. J. Mater. Sci. Mater. Electron. 2020, 31, 11303–11316. [Google Scholar] [CrossRef]
- Begum, S.; Mishra, S.R.; Ahmaruzzaman, M. Facile synthesis of NiO-SnO2 nanocomposite for enhanced photocatalytic degradation of bismarck brown. Inorg. Chem. Commun. 2022, 143, 109721. [Google Scholar] [CrossRef]
- Iwuozor, K.O.; Ighalo, J.O.; Emenike, E.C.; Ogunfowora, L.A.; Igwegbe, C.A. Adsorption of methyl orange: A review on adsorbent performance. Curr. Res. Green Sustain. Chem. 2021, 4, 100179. [Google Scholar] [CrossRef]
- Omiri, J.; Snoussi, Y.; Bhakta, A.K.; Truong, S.; Ammar, S.; Khalil, A.M.; Jouini, M.; Chehimi, M.M. Citric-acid-assisted preparation of biochar loaded with copper/nickel bimetallic nanoparticles for dye degradation. Colloids Interfaces 2022, 6, 18. [Google Scholar] [CrossRef]
- Boubkr, L.; Bhakta, A.K.; Snoussi, Y.; Moreira Da Silva, C.; Michely, L.; Jouini, M.; Ammar, S.; Chehimi, M.M. Highly Active Ag-Cu Nanocrystal Catalyst-Coated Brewer’s Spent Grain Biochar for the Mineralization of Methyl Orange and Methylene Blue Dye Mixture. Catalysts 2022, 12, 1475. [Google Scholar] [CrossRef]
- Chen, Y.-W.; Hsu, Y.-H. Effects of reaction temperature on the photocatalytic activity of TiO2 with Pd and Cu cocatalysts. Catalysts 2021, 11, 966. [Google Scholar] [CrossRef]
- Gherbi, B.; Laouini, S.E.; Meneceur, S.; Bouafia, A.; Hemmami, H.; Tedjani, M.L.; Thiripuranathar, G.; Barhoum, A.; Menaa, F. Effect of pH value on the bandgap energy and particles size for biosynthesis of ZnO nanoparticles: Efficiency for photocatalytic adsorption of methyl orange. Sustainability 2022, 14, 11300. [Google Scholar] [CrossRef]
- Znad, H.; Abbas, K.; Hena, S.; Awual, M.R. Synthesis a novel multilamellar mesoporous TiO2/ZSM-5 for photo-catalytic degradation of methyl orange dye in aqueous media. J. Environ. Chem. Eng. 2018, 6, 218–227. [Google Scholar] [CrossRef]
- Abbasi, S.; Hasanpour, M. The effect of pH on the photocatalytic degradation of methyl orange using decorated ZnO nanoparticles with SnO2 nanoparticles. J. Mater. Sci. Mater. Electron. 2017, 28, 1307–1314. [Google Scholar] [CrossRef]
- Muşat, V.; Crintea, L.; Anghel, E.-M.; Stănică, N.; Atkinson, I.; Culiţă, D.C.; Baroiu, L.; Țigău, N.; Cantaragiu Ceoromila, A.; Botezatu, A.-V. Ag-Decorated Iron Oxides-Silica Magnetic Nanocomposites with Antimicrobial and Photocatalytic Activity. Nanomaterials 2022, 12, 4452. [Google Scholar] [CrossRef] [PubMed]
- Aziztyana, A.P.; Wardhani, S.; Prananto, Y.P.; Purwonugroho, D.; Darjito. Optimisation of Methyl Orange Photodegradation Using TiO2-Zeolite Photocatalyst and H2O2 in Acid Condition; IOP Conference Series: Materials Science and Engineering, 2019; IOP Publishing: Bristol, UK, 2019; p. 042047. [Google Scholar]
- Rizwan, K.; Bilal, M.; Slimani, Y.; Show, P.L.; Rtimi, S.; Roy, A.; Iqbal, H.M. Hydrogen-based sono-hybrid catalytic degradation and mitigation of industrially-originated dye-based pollutants. Int. J. Hydrogen Energy 2023, 48, 6597–6612. [Google Scholar] [CrossRef]
- Phromma, S.; Wutikhun, T.; Kasamechonchung, P.; Eksangsri, T.; Sapcharoenkun, C. Effect of calcination temperature on photocatalytic activity of synthesized TiO2 nanoparticles via wet ball milling sol-gel method. Appl. Sci. 2020, 10, 993. [Google Scholar] [CrossRef]
- Arshad, R.; Bokhari, T.; Javed, T.; Bhatti, I.; Rasheed, S.; Iqbal, M.; Nazir, A.; Naz, S.; Khan, M.; Khosa, M. Degradation product distribution of Reactive Red-147 dye treated by UV/H2O2/TiO2 advanced oxidation process. J. Mater. Res. Technol. 2020, 9, 3168–3178. [Google Scholar] [CrossRef]
- Wang, H.; Li, G.; Fakhri, A.; Wang, H.; Li, G.; Fakhri, A. Fabrication and structural of the Ag2S-MgO/graphene oxide nanocomposite. J. Photochem. Photobiol. B Biol. 2020, 207, 111882. [Google Scholar] [CrossRef]
- Matussin, S.N.; Khan, F.; Harunsani, M.H.; Kim, Y.-M.; Khan, M.M. Visible-light-induced photocatalytic and photoantibacterial activities of Co-Doped CeO2. ACS Omega 2023, 8, 11868–11879. [Google Scholar] [CrossRef] [PubMed]
- Kgatle, M.; Sikhwivhilu, K.; Ndlovu, G.; Moloto, N. Degradation kinetics of methyl orange dye in water using trimetallic Fe/Cu/Ag nanoparticles. Catalysts 2021, 11, 428. [Google Scholar] [CrossRef]
- Alshehri, A.A.; Malik, M.A. Facile one-pot biogenic synthesis of Cu-Co-Ni trimetallic nanoparticles for enhanced photocatalytic dye degradation. Catalysts 2020, 10, 1138. [Google Scholar] [CrossRef]
- Zhao, J.; Dang, Z.; Muddassir, M.; Raza, S.; Zhong, A.; Wang, X.; Jin, J. A new Cd (II)-based coordination polymer for efficient photocatalytic removal of organic dyes. Molecules 2023, 28, 6848. [Google Scholar] [CrossRef]
- Saad, M.; Tahir, H. Synthesis of carbon loaded γ-Fe2O3 nanocomposite and their applicability for the selective removal of binary mixture of dyes by ultrasonic adsorption based on response surface methodology. Ultrason. Sonochem. 2017, 36, 393–408. [Google Scholar] [CrossRef] [PubMed]


Disclaimer/Publisher’s Note: The statements, opinions and data contained in all publications are solely those of the individual author(s) and contributor(s) and not of MDPI and/or the editor(s). MDPI and/or the editor(s) disclaim responsibility for any injury to people or property resulting from any ideas, methods, instructions or products referred to in the content. |
© 2024 by the authors. Licensee MDPI, Basel, Switzerland. This article is an open access article distributed under the terms and conditions of the Creative Commons Attribution (CC BY) license (https://creativecommons.org/licenses/by/4.0/).