Abstract
The northwest region of Mexico stands out as one of the areas with the greatest contribution to the national aquaculture industry, which has led its producers to reconsider the need to innovate in the processes of technological incorporation in sustainable ways. Thus, the aim of this study was to determine the attitudinal and motivational context perceived in aquaculture companies in the region, related to the innovation, competitiveness and support programmes. By means of Likert scaling, it was possible to identify aspects of both domains that would facilitate the development of technological innovation within aquaculture. Such an escalation also showed the need to intensify efforts, with the participation of the state, public and private universities, as well as non-governmental organisations, to develop strategies and policies that facilitate the incorporation of innovative technologies. The research design is structured under a descriptive-explanatory approach, with a cross-sectional format, in which 108 surveys were applied. These surveys were designed using the Likert scale and validated with the McDonald’s Omega method, with ω = 0.773. Cronbach’s α and exploratory factor analysis (EFA) were employed, showing a correlation between the items of the construct and its subcategories. The values of the covariance of the items obtained through the exploratory analysis show that 56% of the items have a correlation greater than 0.05. This indicates that there is a positive attitude and motivation towards the implementation of technological innovation in aquaculture in the study region, with participation from all three levels of government.
1. Introduction
Aquaculture represents a relevant area of opportunity in the search for food sovereignty in Mexico, as well as an important source of employment. Among the economic activities of the primary sector, it is the one that has shown the greatest growth in recent years [1]. In 2021, the Food and Agriculture Organization of the United Nations [2] mentioned that just over 214 million tonnes of food were produced from aquaculture in the global context, with an estimated value of USD 424 billion.
Among the countries involved in aquaculture, Mexico has excelled among the main producers. This has been possible because it has geographical characteristics that favour and make this activity possible, such as a favourable climate, as well as the surface area available for its development, estimated at more than 250,860 hectares open to aquaculture cultivation [3]. In 2021, 287,000 tonnes were achieved in these areas [4].
The Northwest Mexico states of Baja California, Baja California Sur, Sonora, and Sinaloa, form a major aquaculture region in the country [5]. Its competitive advantage lies in its high biological productivity, driven by the presence of ecosystems that provide conditions for the development of a wide variety of marine species. This allows for a greater contribution to the aquaculture industry at the national level, positioning it as a leader in the production of farmed shrimp [6].
However, despite representing a dynamic activity with significant growth, aquaculture has presented a series of obstacles in recent years, stemming from different factors, such as the appearance and spread of diseases, high feed costs, the contamination of culture water, as well as other issues that have made it impossible to increase productivity. Farmers are confronted with decisions regarding the incorporation of sustainable technologies to address these limitations in the production processes [7].
It is important to highlight that technological incorporation can be applied in different processes, such as innovation, the production process, sustainability, the participation of governmental and non-governmental actors, as well as the management, marketing, and competitiveness of various productive sectors [8]. The need to intensify efforts and sustainable technological implementation is recognised, with the aim of obtaining results that make the most of the potential of this activity [2].
Technological development and innovation in the production process are linked as factors in the development and competitiveness of companies [9]. Competitiveness is achieved through innovation, value created per unit, use and efficiency of resources [10].
Another pillar of technological incorporation is the support provided by government entities or public institutions through programmes. Their objective is to strengthen crop technologies and capitalisation through productive reconversion, boost productivity in the sector, the generation of economic and human capital [11], as well as the development of science and innovation [12].
Regarding sustainable processes in aquaculture production, companies dedicated to the development of this activity require continuous technological readjustments that promote sustainability under social, environmental and economic approaches [13]. These approaches contribute to the optimisation of production factors, thus maximising yields, coping with diseases and minimising costs [7,14].
The incorporation of sustainable technology has allowed the implementation of new forms of production that contribute to the sustainable development of this sector [15], as well as the achievement of efficient management and greater productivity by optimising processes [16].
Osmundsen et al. [17] point out that the government regulation of an industry such as aquaculture must consider the growth and development of the sector, as well as environmental and social sustainability. Yue and Shen [18] point out that aquaculture requires innovative and disruptive technologies to increase production and thus improve its sustainability and profitability. Ragasa et al. [19] point out that there is a need for the development and resilience in aquaculture to promote access to improved strains, cost-effective feeds, production technologies, disease surveillance and fish health management practices. In addition, stable policies and favourable regulations are needed to attract investment, protect the environment and ensure sustainable growth.
In addition to the guidelines and recommendations of the authors mentioned above, prior to the implementation of innovative technologies in the aquaculture sector, it is necessary to know the attitude and motivation towards innovation, competitiveness and support programmes of the aquaculture farm operators, since without this human knowledge, the implementation or start-up of technological innovation can fail. Therefore, a Likert scale consisting of 24 items was designed to assess the construct, considering the guidelines and recommendations of the above-mentioned authors. These comprise two subcategories (Appendix A): innovation and competitiveness, as well as support programmes for technology development and implementation. The first is relevant for the sustainable boosting of production. The second is relevant for the implementation of technologies through public policies, including training and investment programmes.
For this reason, the objective of the present research is to develop a scale to determine the attitude and motivation of aquaculture entrepreneurs in the northwest region of Mexico towards technological innovation to improve the competitiveness of the aquaculture sector in the region. The attitudinal and motivational context for sustainable technological incorporation in aquaculture is crucial for the northwestern region of Mexico.
2. Materials and Methods
It is hypothesised that the a priori determination of the attitude and motivation of aquaculture farmers towards technological innovation in aquaculture in the northwest region of Mexico is essential for the subsequent planning, management and sustainable handling of technological innovation in this activity.
As attitude and motivation are theoretical constructs that do not allow a direct quantitative measurement, the attributes of the construct and its subcategories are determined by means of the Likert scale items. The internal consistency, the degree of the relationship between the items, as well as the validity of the scale are determined by McDonald’s Omega, Cronbach’s α and exploratory factor analysis (EFA).
To assess the levels of information provided by the items of the construct and their subcategories, other properties of the histograms are used, in addition to the indicated statistics.
Exploratory factor analysis (EFA) allows us to examine the relationship or interdependence between the items [20,21] used in the Likert scale to measure the construct. To apply the EFA to the items, they must meet the conditions of normality, linearity and multicollinearity, which are determined following Pérez [22] normality by means of skewness and kurtosis, which is confirmed when they fluctuate between −1.5 and 1.5. The construction of the histogram allows us to visually appreciate the symmetry of the distribution of the scales of the items, as well as other statistical moments that describe it.
The histograms were constructed by considering the average Likert scale of each item for each of the 108 respondents, dividing them into nine class marks. The Likert scales are 1, 2, 3, 4 and 5. These correspond to strongly agree, agree, indifferent, disagree and strongly disagree.
Linearity is determined by the correlation between the items of the subcategory’s innovation and competitiveness versus the construct, as well as between support programmes versus the construct.
Multicollinearity is determined by the combination of Bartlett’s test of sphericity, which is significant when p < 0.05 [23], and the Kaiser–Meyer–Olkin measure of sampling adequacy, which is adequate for values of 0.7.
Once the conditions are met, factor analysis is carried out following the principal components or principal axes method. The first one consists of determining the common, specific and error variance of the distribution. The second, the principal axis method determines the covariance between items. The latter is used in this work to determine the correlation between each item and the total of the survey for the construct and its two subcategories, thus determining the relative relevance of each item.
For greater clarity, the covariances of the items obtained using the principal axes method are rotated using the Varimax Orthogonal Rotation method with Kaiser normalisation [24]. The data analysis was carried out using IBM SPSS Statistics 29.0.
Other statistical parameters of the histograms, such as mean, standard error of the mean, median, mode, standard deviation, variance, skewness, standard error of skewness, kurtosis, standard error of kurtosis, range and minimum value describe the behaviour of the item scales in the construct and in its two subcategories.
Cronbach’s α (α) determines the consistency between items. A reliability α greater than 0.7 indicates that the instrument is suitable for use in research [25]. This coefficient was determined for the construct and its subcategories.
The Likert scale consists of a set of items, statements, which can be rated numerically. These items are divided into domains, fields or levels relating to the aspects that are to be investigated in relation to the construct under investigation. In this case, the domains are motivation towards innovation and competitiveness in aquaculture, as well as in governmental support programmes for aquaculture.
The measurement instrument containing the constructs is subjected to statistical tests to demonstrate its validity and reliability [26]. Therefore, in this study the McDonald’s Omega method (ω) was applied, with which the internal consistency of the scores present in the instrument was analysed, according to the following expression [27]:
McDonald defined ω, the omega coefficient, which determines the reliability of a homogeneous test; λj, are the loadings and Ψ the unique variance.
In this model, the covariance of any two item scores Xj, Xk is given by the expression:
Cluster analysis encompasses a range of statistical techniques aimed primarily at identifying groups within a set of individuals [28]. These techniques enable the grouping of analysis units into homogeneous sets, ensuring that the units within the same cluster are very similar to each other and markedly different from units in other clusters [29]. This analysis produces dendrograms, which are tree-shaped graphical representations that visualize the relationships between data and data groups, aiding in the understanding of their hierarchical structures [30]. A cluster analysis is performed through a dendrogram to visually represent the hierarchical relationship between production, sustainability, management, competitiveness and the support programmes.
The research is then carried out with producers in the aquaculture sector in the northwest region of Mexico, focusing on aspects of aquaculture innovation. It is structured as a descriptive, cross-sectional study, since only one measurement of the variables is taken from all participants [31] and is based on a quantitative approach [32].
A questionnaire survey was designed, allowing us to understand the situation prevailing in this activity and its attitudinal and motivational perspectives regarding innovation in this productive sector [33].
In the design of the instrument, the Likert scale was used considering the qualifiers of 1, 2, 3, 4 and 5 for each item, according to the scales strongly agree, agree, neither agree nor disagree, disagree and strongly disagree, respectively [34]. The survey is structured into 7 questions and 24 items, divided in three sections. The first section (5 questions) gathers aspects related to the profile of the respondents and their roles within the administrative structure of the companies for which they work. Each respondent was assured that the identity of their data would be protected by signing the informed consent form.
In the second section, 24 items were designed using a Likert scale to gather motivation and attitude towards innovation in aquaculture. Taking these aspects into account, the study of technological incorporation is categorised into two groups. The first group comprises aspects related to productivity and sustainability. The second group focuses on the support programmes that the aquaculture sector receives from the government. The items are assigned as follows:
- Innovation and competitiveness (18 items);
- Support programmes (6 items).
For the subcategories, the average response for each item of the 108 surveys was obtained and rounded to determine the most predominant response, as it is an ordinal scale.
It is relevant to note that the subcategories of innovation and competitiveness can be disaggregated into different dimensions, such as production, sustainability, management and competitiveness [35,36]. This disaggregation allows for a more detailed and specific analysis of how each area influences the production systems of aquaculture enterprises.
In the third section, two questions were included to identify the main existing technologies that should be incorporated into production processes to achieve sustainable management.
Sample Size
To determine the size of the sample, the target population was taken as those who carry out aquaculture activities (owners or partners, administrators, biologists, production managers and technology generators) and who carry out their productive activities in the northwest region of Mexico. A statistical formula was applied for the case where the population size was unknown [37].
where
- Z = 95% confidence level (Z = 1.96);
- p = probability of success, or expected proportion (p = 50%);
- q = probability of failure (q = 50%);
- d = precision = 9.43%.
Substituting values:
According to this calculation, the number of respondents is 108.
3. Results
3.1. Statistical Analysis
A Likert scale questionnaire was used, and McDonald’s Omega (ω) was calculated, yielding a value of ω = 0.773, indicating that the items are consistent according to the previous study [26], where values higher than 0.7 are considered optimal.
The dendrogram shown in Figure 1 reveals a strong link between motivation towards innovation in aquaculture and innovation and competitiveness, as indicated by Euclidean distances, with support programmes forming a separate group.
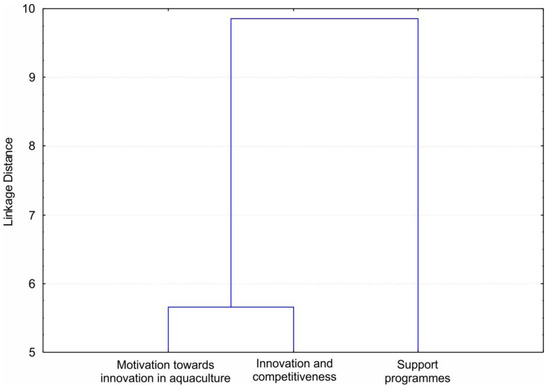
Figure 1.
Dendrogram of similarity between motivation towards innovation in aquaculture, innovation and competitiveness and support programmes.
3.2. Attitudinal and Motivational Profiles for Sustainable Technology Uptake in Aquaculture
Profile of Respondents
Of the 108 surveys applied, 93.52% were completed by men, indicating that performance in aquaculture is regularly masculinized [38]. This sector has been shaped by heteronormative practices in activities falsely assigned to the male gender, highlighting the need to implement practices under an inclusive innovation approach [39].
About the position held by the respondents within the production unit, 33.33% are biologists, and 25% oversee production; the rest hold various roles, such as administrators, technology managers and owners or partners, the latter representing 21.3% of the sample.
In terms of seniority, 32.41% worked for the company for less than 5 years, while 23.15% worked for the company for more than 20 years. Regarding to the level of academic training, Figure 2 shows that 59.26% indicate that they have a professional education, 13.89% have a postgraduate degree, and only 10.19% have a basic education. Having employees with a high level of education allows the implementation of productive and competitive development actions in the activity being carried out [7].
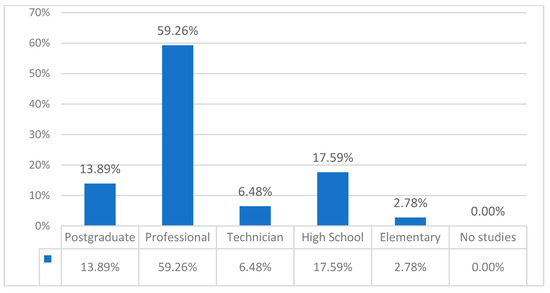
Figure 2.
Educational level of the study target population.
3.3. Innovation and Competitiveness
The results show that more than 50% of respondents agree that incorporating technology into management and production processes has a positive impact on the sustainability and competitiveness of aquaculture (see Figure 3). In this way, it is evident that producers know that one of the main ways to achieve success in different variables, such as management and sustainability, is to work in line with technological innovation. The aquaculture sector requires innovative changes that lead to improvements in production processes and increase the industrial value of the activity. However, this represents a challenge [1].
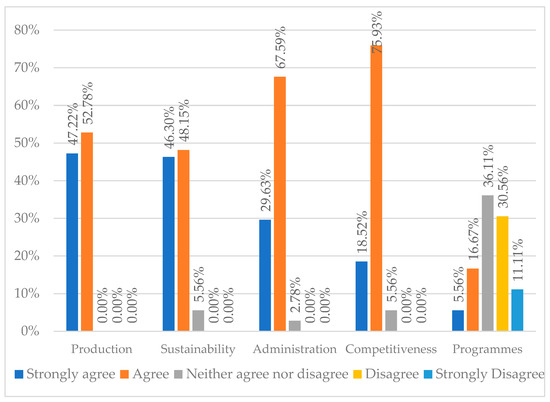
Figure 3.
Motivational attitudes for technological incorporation in aquaculture production in Northwest Mexico.
Innovation and competitiveness can be disaggregated into production, sustainability, administration, competitiveness and support programmes through a dendrogram. The Euclidean distances were found to be similar for the first four items, suggesting they could belong to the same domain studied and be classified in a single group, which is not the case for the support programmes, which are in a separate group (see Figure 4).
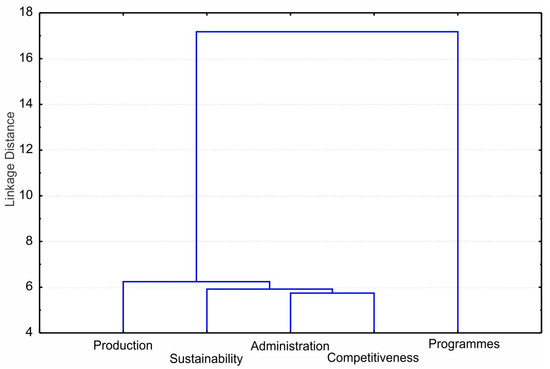
Figure 4.
Dendrogram of similarity between production, sustainability, management, competitiveness and support programmes.
Table 1 shows the correlation matrix between production, sustainability, administration, competitiveness and the support programmes, with correlations where p < 0.05000 highlighted in bold. The results indicate that these variables are related to each other in different degrees.

Table 1.
Correlation matrix between the variables production, sustainability, administration, competitiveness and support programmes.
While 97.23% of the producers believe that innovation should be part of diverse aquaculture processes, they also recognize that, although shrimp production is the most successful, process improvements should be extended to the production of other species, such as abalone, tilapia and others.
On the other hand, producers point out that deficiencies in the equipment necessary to carry out aquaculture activities are decisive for the position and competitiveness of the company, hence the importance of technological innovation in equipment.
In relation to technological incorporation in the production processes (Table 2), the producers indicate that they know about technologies related to the supply of food for larvae or hatchlings (67.59%). Additionally, 11.11% indicate that they know about technological incorporation in the production of energy, and 7.41% are familiar with technologies related to food sources. The rest of the data are of lesser significance, and, as can be seen, the producers are unaware of the various types of innovative technologies that can be implemented in their production processes.
Table 2.
Potential technologies feasible to incorporate in aquaculture fields in the northwest region of Mexico.
Innovation in various activities in the aquaculture sector in farms requires attention. The respondents consider that the greatest focus in this regard should be on the prevention of infections in production (46.30%). A total of 22.22% focus on the quantity and quality of water entering the ponds, 12.96% on the management of production, and 4.63% on promoting some activities that strengthen production. The remaining data are of less significance (Table 3).
Table 3.
List of priority technological improvements for aquaculture farms in Northwest Mexico.
On the other hand, 94.45% of the respondents considered that technological innovation is important for environmental care in the aquaculture sector, especially in a region where environmental measures are not implemented.
3.4. Support Programmes
It is important to highlight that, to achieve technological implementation in aquaculture, it is necessary to have an innovative philosophy; in this sense, Table 4 shows that 98.15% of producers considered that innovation is an important part of their processes when carrying out their productive activities.
Table 4.
Motivation towards innovation in aquaculture.
71.29% of the respondents agree that there are training programmes that allow the dissemination and transfer of technology in aquaculture (Table 5).
Table 5.
Needs for the implementation of training programmes for the transmission and dissemination of new innovative technologies in aquaculture.
However, 40.74% of respondents indicated that local governments are not involved in aquaculture innovation activities, though they believe it should be one of the main promoters due to the relationship of the activity with the development and economic growth of the region (Table 6).
Table 6.
Involvement of local governments in support of aquaculture innovation activities.
Another relevant aspect is the collaboration with research centres, universities and scientific organisations, with the aim of guiding the attitudes of the productive sectors towards the incorporation of sustainable technologies as an alternative to increase their competitiveness. In this context, 89.81% of the producers agree that these links facilitate biotechnological exploitation, paving the way for innovation in aquaculture (see Table 7).
Table 7.
Relevance of the participation of research centres in biotechnological exploitation and aquaculture innovation.
3.5. ASF and Cronbach’s Coefficient
The normality for the construct, as well as the subcategories of support programmes and innovation and competitiveness, is shown in Table 8.
Table 8.
Normality statistics.
The values of skewness and kurtosis vary between −1.5 and 1.5, so the item scales have a normal behaviour. The histograms for the construct and subcategories are shown in Figure 5.
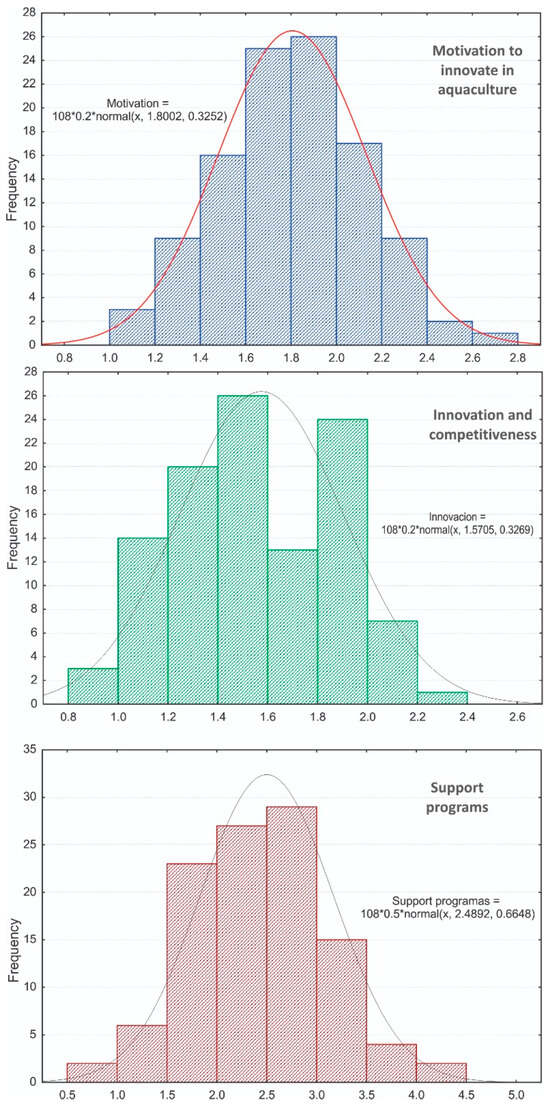
Figure 5.
Histogram of the category motivation to innovate in aquaculture and the subcategories innovation and competitiveness and support programmes.
Note the symmetry and centrality of the histograms, which are corroborated by the parameter values shown in Table 9. The distribution of the construct is the most symmetrical, as the mean, median and mode have practically the same value. The histogram of the subcategories innovation and competitiveness deviates the most from symmetry, as the above-mentioned central measures differ in mean and mode. The histogram of the subcategory support programmes is practically symmetrical, as the mean and mode practically coincide.
Table 9.
Other statistics of the histograms of the construct and its subcategories.
Regarding the measures of dispersion or variation, the histograms of the support programmes subcategory present the greatest dispersion, measured through the standard deviation, range and standard error of the mean, whose values are 0.66, 3.33 and 0.06, respectively.
Linearity is shown by the correlation of 0.866 between innovation and competitiveness, as well as 0.667 between support programmes and the construct (see Figure 6A,B). Each black dot in the graph represents the average of the items for each subcategory (x-axis) in relation to the construct of motivation to innovate in aquaculture (y-axis). Likewise, the straight line represents the equation that governs this relationship.
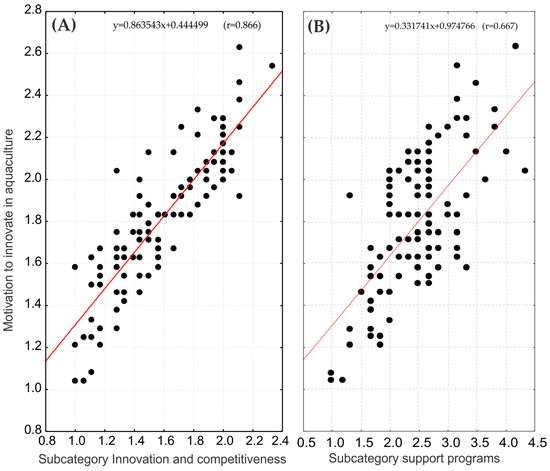
Figure 6.
Relationship between motivation for innovation in aquaculture with the following: (A) subcategories innovation and competitiveness; (B) subcategory support programmes.
For multicollinearity the Kaiser–Meyer–Olkin (KMO) statistic was 0.756. Bartlett’s p-test for sphericity was 0.0, i.e., p < 0.05. Therefore, both statistics confirm that the third condition of the ASA is fulfilled. For the principal axes method using the Varimax Orthogonal Rotation method with Kaiser normalisation, the results in Table 10 are obtained.
Table 10.
EFA, principal axes method, common variance (σc).
Items 1 to 16 correspond to the subcategories innovation and competitiveness and 17 to 24 to the subcategory support programmes. It is observed that all items are correlated with differentiated intensities. In the innovation and competitiveness subcategory, more than half (2, 4, 6, 7, 8, 9, 10, 12 and 16), 56% have an intensity greater than 0.5. The items with the highest correlation address the core content of the effects of innovation and competitiveness, except item 16, which touches on a relevant accessory aspect of the internal relations and operation of aquaculture farms, which was relevant for the respondents.
Regarding the subcategory support programmes, all the items show a correlation higher than 0. 5, which indicates that agents external to the actual operation of the aquaculture farms are relevant for the respondents (operators and owners of aquaculture farms), who consider that public bodies should be actively involved in the development of the evaluated construct. Therefore, there is a positive attitude and motivation towards innovation and competitiveness of aquaculture, supported by the participation of external governmental agents. This highlights a wide field of possibilities towards public policy management among authorities, operators and the owners of aquaculture farms.
The reliability analysis using Cronbach’s alpha reveals that both the construct ‘motivation to innovate in aquaculture’ and the subcategories ‘Innovation and competitiveness’ and ‘Support programmes’ obtained an index higher than 0.7. According to Bojórquez Molina et al. [40], a value above 0.7 indicates a strong relationship between the questions, which guarantees the reliability of the measurement instrument (see Table 11).
Table 11.
Reliability analysis of the instrument with Cronbach’s alpha.
4. Discussion
4.1. Innovation and Competitiveness
A positive attitude and motivation of aquaculture operators towards innovation and competitiveness, obtained through the Likert scale items, significantly enhances the contribution of aquaculture activity to the economy, food security and markets. This is remarkable, as it forms part of an important international food supply chain in seafood markets, being a determining factor in achieving competitiveness with quality food products [41].
Integrated production and marketing of some aquaculture species can be economically viable if they comply with some quality, innovation and market characteristics [42].
In the global context, sectors such as aquaculture base their marketing on blockchains and networks [43], which improves traceability and transparency in the value chains of their products, addressing the needs of markets and business competitiveness. Aquaculture faces problems in food supply, and the pressure to generate a value chain in these markets is high [44]. Recent research [45] indicates that the production of diverse fish species would help the aquaculture industry to be more competitive and address food supply problems.
In a study conducted in China, the authors conclude that the aquaculture sector faces various challenges, including organisational management, which they say is deficient, with antiquated administrative operating structures [46]. This is related to what González Ochoa et al. [47] found, who point out that, through the incorporation of technology, administrative tasks can be carried out in an automated and intuitive way, managing to unify the administrative process (planning, organisation, management and control of business processes).
The results show that the use of technological tools in aquaculture production has a positive impact on profitability, particularly with the use of automatic feeders, as found by [15]. Technological tools in aquaculture contribute to the efficient management of feed and nutrition for the organisms [48].
China has positioned itself as the main aquaculture producer worldwide due to the diversification of species based on technological innovation, as well as certifications in various processes within the industry [49]. Today, aquaculture producers have only made limited attempts to innovate their activities, with the internet and some aspects of the production system being the most prominent strategies [50].
However, there are innovations that have been studied and developed, including biofloc technology (BFT), which is an alternative to reduce environmental damage caused by excess nutrients and organic matter in pond water [51]. In addition, the use of microorganisms in both feed and culture water to increase the nutritional value of the animals would improve the production system, contributing to sustainability and profitability [52].
Authors have found that, through food handling, it is possible to incorporate sustainable technologies through the inclusion of new ingredients/additives, improving animal nutrition or allowing the total or partial substitution of fishmeal [53,54,55,56,57]. It is highlighted that efficient feeding and the quality of the feed ingredients are some of the best production strategies in aquaculture [58].
Another alternative is the use of automatic feeders for the optimisation of feeding, as well for monitoring the values of fundamental parameters in production, such as pH, temperature, dissolved oxygen concentration and toxic compounds such as total ammonium. This makes it possible to evaluate the quality of the pond water and potential risks during the fattening process of the organism’s growth [59]. This information relates to the results obtained in this research, which show an inherent need for technological incorporation in aquaculture production processes.
Some models of innovation in the aquaculture sector allow savings and sustainable improvements, as well as the optimisation of production processes in the same areas [60]. The demand for food and the low production of wild fish require the implementation of technologies that help to meet the social demands of diverse varieties of seafood, with the aquaculture sector being a determining factor in achieving this [61]. The results of this research are associated with what was found by [62], who points out that technological innovation transfer at the farm level is currently one of the most important innovation strategies for the sector.
Technological innovation with a focus on sustainability is a great concern for companies aiming to achieve adequate levels in this area [63]. Aquaculture industry needs to add biological, chemical and wastewater treatment monitoring to its production system to reduce water consumption, make better use of this resource and avoid waste in ponds, which will help to improve the fish habitat and welfare. The high-frequency monitoring of water quality provides essential data for fish farm management [64].
It is important to raise awareness of the impact of untreated wastewater in aquaculture and how it is discharged back into the sea, leading to serious environmental problems and diseases in farmed species due to low chemical oxygen demand (COD) and high levels of nitrogen and phosphorus, as mentioned by Liu, Wang and Huang [65].
Pond water treatment is important for decreasing disease hazards and improving water quality [66], thus benefiting the sector’s activity and sustainability. In this regard, to maintain the ecological health of water bodies used in aquaculture, the proper treatment of aquaculture wastewater is essential [67].
4.2. Support Programmes
The items in the subcategory support programmes show a high correlation with the construct, creating opportunities for technological implementation in aquaculture. This philosophy fosters intelligent, sustainable and environmentally efficient cultivation practices [68]. The technological progress and innovation make it possible to develop aquaculture under a sustainable approach [69].
This innovative philosophy is implemented in the process of seeding, cultivation, maturation process, reproduction, spawning and breeding from egg to post-larvae of farmed shrimp. Through biotechnology, processes such as the reproduction cycle, the production of more disease-resistant populations, better growth rates and increased tolerance to abiotic changes are controlled [70].
However, despite the relevance and interest in technological innovation in aquaculture production processes, it was found that the economic factor is determinant in investment decisions, given the high costs involved in incorporating cutting-edge technologies and training for their proper use. Therefore, the participation of the state, universities and non-governmental organisations, through support programmes, makes their implementation possible.
As found by [71] an effective way to adequately organise activity in the aquaculture sector is by modifying the legislation that regulates the sector’s economic aspects, government support, production, as well as the administrative organisation and operation of the activity.
Through the participation of research centres, universities, scientific organisations, among others, technological innovation can provide a solution to the specialised modernisation of production processes, as these institutions act as important actors for the scientific and innovative development of productive activities [72]. This is related to the fact that 89.81% of the producers affirm that, through links with research centres in biotechnological exploitation, it will be possible to achieve innovation objectives in aquaculture.
Academic and governmental actors are determining factors in the implementation of strategies and actions through research; for example, the use of biotechnologies and genetic improvements that allow the improvement of conditions in the sector [1]. There are many interests and actors involved, including the producers themselves, multinational corporations, as well as research groups. The latter play a determinant role in addressing problems and needs of the sector, as well as in finding solutions [73].
In general, innovative aspects of economic activity, where the government plays an important role, contribute to optimal development through support programmes [74]. This information aligns with the findings in the present research regarding the importance of government intervention in the development of aquaculture.
In this context, countries such as Norway have implemented government policies focused on the technological improvement of aquaculture activities with high technological levels; in global contexts, the sector has maintained a significant growth rate in recent decades but has been limited to only a few countries [75].
Coastal zone planning raises issues that transcend regional concerns [35]. The development of management and planning approaches is required to improve aspects related to production [76]. Furthermore, activities such as aquaculture, which can also be practised in urban areas, are highly dependent on municipal management and the level of interest in their inclusion in public policy [77].
5. Conclusions
The Likert scale, together with McDonald’s Omega, Cronbach’s alpha and ASF provided insight into the domains of attitude and motivation to technological innovation among fish farmers in the northwest region of Mexico as the values are reliable. The domains are (a) innovation and competitiveness and (b) support programmes.
Innovation and competitiveness are made up of production, sustainability, management and support programmes. The first four components maintain similar equidistance to each other and could be grouped under the same study category. However, support programmes are differentiated and are in a separate category. Results comparable to those shown in the dendrogram were observed in the correlation matrix, where a similar pattern emerged among the variables with a p < 0.05, indicating that they are related to varying degrees with each other and with the subcategories.
More than 50% of the sampled population agrees with the incorporation of technology into competitive and sustainable production processes, and 97.2% accept technological innovation as an integral part of aquaculture processes. This implies the existence of a favourable path towards the implementation of public policies in this area.
A total of 71.30% of the fish farmers agree that there are programmes for the dissemination and transfer of aquaculture technology, which also favour the implementation of public policies.
Thus, the a priori determination of the attitude and motivation towards technological innovation of aquaculturists in northwest Mexico will allow for the incorporation of innovations in different areas of the production processes. These include automatic feeding, double seeding technologies, prevention of diseases in organisms, the creation of improved feed and equipment, care of the environment through the treatment of pond water, and organisational management, all of which contribute to the unification of administrative process and informed decision-making.
Finally, it is important to highlight that 89.81% of the producers indicated that there should be a link with research centres to achieve innovation objectives. Although 71.29% of the respondents affirm that there are training programmes for the dissemination and transfer of technology in aquaculture, 40.74% accuse the government of not becoming involved to make changes possible. Therefore, the development of strategies, actions and programmes that help to link the key actors in this sector is required, as well as the development of sustainable technologies to implement sustainable production processes and greater competitiveness.
Through Cronbach’s alpha and ASF, it was determined that the 24 items are related and contribute to the determination of the construct and its subcategories. The results indicate that the respondents have a positive attitude and motivation towards the implementation of innovation and technology in aquaculture, as well as an intense interest in the participation of the three levels of government in the empowerment of aquaculture in the region. Thus, there is a basis for the construction of public policies to improve and enhance aquaculture and thus the economic and social development of the community. This type of study provides the practical insights necessary prior to the development of public policies or the management of the resources of a region.
Research Limitations and Future Directions
Limitations: the lack of registers and databases of producers in the aquaculture sector makes this kind of research more complex because of the difficulty of locating them for the different studies that were carried out.
Future research: technological incorporation, under sustainable approach, is already a necessity in the productive sectors; therefore, more studies should be carried on the design of public policies to determine the technical and operational feasibility of strategies that could be implemented in coordination between productive sectors, government agencies and research centres.
Author Contributions
Conceptualization, A.U.-C. and H.J.P.G.; methodology, A.U.-C. and H.J.P.G.; software, H.J.P.G.; validation, V.M.P.-G. and J.H.B.; formal analysis, A.A.C.-B. and G.A.R.-M.d.O.; investigation, A.U.-C. and H.J.P.G.; resources, M.C.S.A.; data curation, G.K.G.-F.; writing—original draft preparation, A.U.-C.; writing—review and editing, A.U.-C. and A.A.C.-B.; visualization, V.M.P.-G.; supervision, J.H.B. and M.C.S.A.; project administration, G.A.R.-M.d.O. and G.K.G.-F.; funding acquisition, does not apply. All authors have read and agreed to the published version of the manuscript.
Funding
This research received no external funding.
Institutional Review Board Statement
Not applicable.
Informed Consent Statement
For the present research entitled Sustainable Technological Incorporation in Aquaculture, we focused on exploring attitudinal and motivational perceptions of entrepreneurs in the northwest region of Mexico. The respondents gave their informed consent, once the aims and objectives of the research were explained to them, then proceeded to answer the Likert scaling survey. They were all adults, and the information collected does not contain sensitive personal data in terms of the chapter one, article three and section VI of the Federal Law for the Protection of Personal Data in Possession of Private Parties in force in the United Mexican States, which reads as follows: Sensitive personal data: Those personal data that affect the most intimate sphere of their owner, or whose improper use may give rise to discrimination or entail a serious risk for the owner. Sensitive data are those that may reveal aspects such as racial or ethnic origin, present and future state of health, genetic information, religious, philosophical and moral beliefs, trade union membership, political opinions, and sexual preference. Ethical review and approval of this study was waived for the following reason: this research does not involve sensitive personal data, medical research involving human subjects, or medical care involving research.
Data Availability Statement
Data are contained within the article.
Conflicts of Interest
The authors declare no conflicts of interest.
Appendix A
Items that make up the construct motivation to innovate in aquaculture.
| Subcategory: Innovation and Competitiveness |
| P1. Innovation enables the introduction of new products, services, processes, sourcing, production and customer or consumer-oriented changes in the aquaculture business. P2. Innovation is part of the production philosophy of fish farmers in the region. P3. The main innovation required is for the improvement of technology to increase environmentally friendly production. P4. There is a need for innovation in aquaculture equipment improvements. P5. Innovation is needed in seeding, culture, maturation process, reproduction, spawning and rearing from egg to post-larvae of farmed shrimp. P6. Innovation is a way to prevent or mitigate virus damage in shrimp farming production. P7. Innovation should be extended to other products such as tilapia, abalone, among others, in addition to shrimp. P8. Innovation is needed in the development of technologies for monitoring physic-chemical and biological parameters of water, as well as in feeding mechanisms for shrimp or other species in farms. |
| P9. Innovate to improve the quality of water intakes for efficient and quality supply. P10. Innovation is required to achieve an increase in the commercial value of aquaculture production. P11. Collaboration with other fish farmers is needed to do better business. P12. It is convenient to innovate in processes and products, to offer more attractive products to the market. P13. Innovation is necessary in the commercialisation of products in national and international markets. P14. Technological innovation is necessary for the management of virus attacks on aquaculture products. P15. Innovation is needed in the forms of organisation in aquaculture production activity. P16. There is communication, respect and collaboration between the different hierarchical levels of the people involved in the farm or pond. P18. Innovation should cover short, medium and long-term objectives for shrimp farming and other associated activities. P24. A process for the treatment of water discharged to drains in the pond drainage should be innovated. |
| Subcategory: Support Programmes |
| P17. There are technical and financial support programmes by the federal, state or municipal government in innovation. P19. There should be investment in innovation in aquaculture research and development. P20. Commercial banks in the region support innovation in the aquaculture sector. P21. Innovation in aquaculture will be achieved through links with biotechnology research centres. P22. There are training programs that allow the transmission or dissemination of new innovation technologies in aquaculture activity. P23. The municipality supports aquaculture innovation activities |
References
- Carrera-Quintana, S.C.; Gentile, P.; Girón-Hernández, J. An overview on the aquaculture development in Colombia: Current status, opportunities and challenges. Aquaculture 2022, 561, 738583. [Google Scholar] [CrossRef]
- FAO. El Estado Mundial de la Pesca y la Acuicultura 2022, 1st ed.; FAO: Rome, Italy, 2022; p. 288. [Google Scholar]
- SADER; CONAPESCA. National Program of Fish and Aquaculture 2020–2024 [Internet]. 2020. p. 73. Available online: https://www.gob.mx/cms/uploads/attachment/file/616554/PROGRAMA_Nacional_de_Pesca_y_Acuacultura_2020-2024baja.pdf%0Ahttps://www.dof.gob.mx/nota_detalle.php?codigo=5609194&fecha=30/12/2020 (accessed on 10 March 2024).
- SADER; SIAP. Panorama Agroalimentario 2022. Sader Servicio de Información Agroalimentaria y Pesquera. 2022. Available online: https://www.gob.mx/siap/prensa/panorama-agroalimentario-2022?idiom=es (accessed on 23 March 2024).
- Comisión Nacional de Acuacultura y Pesca C. CONAPESCA-Gobierno de México. 2019. p. 290. Anuario Estadístico de Acuacultura y Pesca 2019. Available online: https://nube.conapesca.gob.mx/sites/cona/dgppe/2019/ANUARIO_ESTADISTICO_DE_ACUACULTURA_Y_PESCA_2019.pdf (accessed on 15 March 2024).
- López Torres, G.V.; Moreno Moreno, L.R. Acuicultura en Baja California: Redes, Actores y Empresas, 1st ed.; Universidad Autónoma de Baja California: Baja California, México, 2022; p. 303. [Google Scholar]
- Carrazco Escalante, J.C.; León Balderrama, J.I. Capacidad de absorción y competitividad en el cultivo de camarón del municipio de Ahome, Sinaloa. Estud. Soc. Rev. Aliment. Contemp. Y Desarro. Reg. 2017, 27. [Google Scholar] [CrossRef]
- Gong, X.; Wong, W.K.; Peng, Y.; Khamdamov, S.J.; Albasher, G.; Hoa, V.T.; Thanh Nhan, N.T. Exploring an interdisciplinary approach to sustainable economic development in resource-rich regions: An investigation of resource productivity, technological innovation, and ecosystem resilience. Resour. Policy 2023, 87, 104294. [Google Scholar] [CrossRef]
- Zayas Barreras, I. El desarrollo tecnologico y la innovación como ente principal de competitividad en las empresas del sector agropecuario en el municipio de Angostura, Sinaloa. Mex. Agronegocios 2018, 42, 867–877. [Google Scholar]
- Porter, M. La Ventaja Competitiva de las Naciones, 1st ed.; Plaza & Janes Editores: Barcelona, España, 1991; p. 1056. [Google Scholar]
- Instituto Interamericano de Cooperación para la Agricultura (IICA). Evaluación de Diseño Programa de Fomento a la Productividad Pesquera y Acuícola. 2015. Available online: https://www.transparenciapresupuestaria.gob.mx/work/models/PTP/programas/sed/evaluaciones/2016/08s261pcdi16.pdf (accessed on 10 March 2024).
- Díaz-Canel Bermúdez, M. ¿Por qué necesitamos un sistema de gestión del Gobierno basado en ciencia e innovación? An. La Acad. Cienc. Cuba. 2021, 11, 1–14. [Google Scholar]
- Nicheva, S.; Waldo, S.; Nielsen, R.; Lasner, T.; Guillen Garcia, J.; Jackson, E.; Motova, A.; Cozzolino, M.; Lamprakis, A.; Zhelev, K.; et al. Collecting demographic data for the EU aquaculture sector: What can we learn? Aquaculture 2022, 559, 738382. [Google Scholar] [CrossRef]
- De La Torre Valdez, H.C.; Peralta Salazar, Y.; Olivas Valdez, E.; Durazo Bringas, M.G. Factores que determinan la competitividad del Parque Acuícola Cruz de Piedra en Empalme, Sonora, México. Rev. El Col. San Luis 2020, 10, 1–33. [Google Scholar] [CrossRef]
- Guélac Gómez, J.; Sánchez Calle, J.E.; Valles-Coral, M.A. Impacto del uso de herramientas tecnológicas en la producción acuícola. Enfoque UTE 2022, 14, 66–76. [Google Scholar] [CrossRef]
- Del Carpio Gallegos, J.F.; Miralles, F. Análisis cualitativo de los determinantes de la innovación en una economía emergente. Retos 2019, 9, 161–175. [Google Scholar] [CrossRef]
- Osmundsen, T.C.; Olsen, M.S.; Gauteplass, A.; Asche, F. Aquaculture policy: Designing licenses for environmental regulation. Mar. Policy 2022, 138, 104978. [Google Scholar] [CrossRef]
- Yue, K.; Shen, Y. An overview of disruptive technologies for aquaculture. Aquac. Fish 2022, 7, 111–120. [Google Scholar] [CrossRef]
- Ragasa, C.; Agyakwah, S.K.; Asmah, R.; Mensah, E.T.D.; Amewu, S.; Oyih, M. Accelerating pond aquaculture development and resilience beyond COVID: Ensuring food and jobs in Ghana. Aquaculture 2022, 547, 737476. [Google Scholar] [CrossRef]
- Lloret-Segura, S.; Ferreres-Traver, A.; Hernández-Baeza, A.; Tomás-Marco, I. El análisis factorial exploratorio de los ítems: Una guía práctica, revisada y actualizada. An. Psicol./Ann. Psychol. 2014, 30, 1151–1169. [Google Scholar] [CrossRef]
- Cruz, I.J.; Berra Barona, C.; Rodríguez León, Y.J. Efecto de Las Redes Sociales en el Desarrollo de las Habilidades Cognitivas: Análisis Factorial Exploratorio. Univ. Cienc. 2024, 13, (Especial CIVITEC). 83–98. [Google Scholar]
- Pérez, E.; Medrano, L.A. Análisis Factorial Exploratorio: Bases Conceptuales y Metodológicas. Revista Argentina de Ciencias del Comportamiento (RACC), ISSN-e 1852-4206, Volume 2, 2010, pp. 58–66. Available online: https://dialnet.unirioja.es/servlet/articulo?codigo=3161108&info=resumen&idioma=ENG (accessed on 29 July 2024).
- Zhunio-Falcones, S.E.; Cabrera-Tenecela, P. Análisis factorial exploratorio y confirmatorio de la Escala de Intervención Docente Orientada a Promover la Metacognición en el Aula (EIDOPMA). S. Am. Res. J. 2022, 2. [Google Scholar] [CrossRef]
- Pizarro Romero, K.; Martínez Mora, O. Análisis factorial exploratorio mediante el uso de las medidas de adecuación muestral kmo y esfericidad de bartlett para determinar factores principales. J. Sci. Res. 2020, 5, 903–924. [Google Scholar]
- Sridana, R.; Tomoliyus, T.; Sukamti, E.R.; Prabowo, T.A.; Abrori, R.B. The Effect of Coaching Style on Performance of Athletes through Anxiety as Mediating Variable in Adolescent Swimmers. Retos: Nuevas Tendencias en Educación Física, Deporte y Recreación, ISSN-e 1988-2041, ISSN 1579-1726, Volume 55, 2024, pp. 241–248. Available online: https://dialnet.unirioja.es/servlet/articulo?codigo=9420367&info=resumen&idioma=ENG (accessed on 29 July 2024).
- Frías-Navarro, D. Apuntes de estimación de la fiabilidad de consistencia interna de los ítems de un instrumento de medida. Lect. Crítica Y Recom. Para Redactar El Inf. Investig. 2022, 2022, 1–26. [Google Scholar]
- McDonald, R.P. Test Theory: A Unified Treatment. 2013, pp. 1–485. Available online: https://www.taylorfrancis.com/books/mono/10.4324/9781410601087/test-theory-roderick-mcdonald (accessed on 16 June 2024).
- Fernández Santana, O. El Análisis de Cluster: Aplicación, interpretación y validación. Pap. Rev. De Sociol. 1991, 37, 65–76. [Google Scholar] [CrossRef]
- María-José, R.-J.; Mora Catalá, R. Análisis de Cluster o Análisis de Conglomerados. In Publicaciones de la Universidad de Alicante. 2001. Available online: https://rua.ua.es/dspace/handle/10045/12079 (accessed on 29 July 2024).
- Falconí Punguil, D.G.; Gualpa Mendoza, J.N. Método para la Determinación de Similaridad y Distancia Entre Investigadores a Partir de Algoritmos de Clasificación. Universidad Técnica de Cotopaxi. 2019. Available online: https://scholar.google.es/scholar?hl=es&as_sdt=0%2C5&q=falconi+2019+m%C3%A9todo+para+determinar+la+similaridad&btnG=#d=gs_qabs&t=1723522648979&u=%23p%3Dy5JYEmvZJOMJ (accessed on 29 July 2024).
- Rodríguez, M.; Mendivelso, F. Diseño de investigación de Corte Transversal. Rev. Médica Sanitas 2018, 21, 141–146. [Google Scholar] [CrossRef]
- Arias Gonzáles, J.L. Diseño y Metodología de la Investigación, 1st ed.; Enfoques Consulting EIRL: Arequipa, CA, USA, 2021; p. 124. [Google Scholar]
- Grasso, L. Encuestas Elementos Para su Diseño y Análisis; Encuentro Grupo Editor: Córdoba, Argentina, 2016; Volume 3, pp. 49–58. Available online: https://books.google.com.co/books?id=jL_yS1pfbMoC&printsec=frontcover&hl=es#v=onepage&q&f=false (accessed on 7 May 2024).
- Ángela Guadalupe Canto de Gante, L.; Elim Sosa González, W.; Bautista Ortega, J.; Judith Escobar Castillo, I.; Santillán Fernández, A. Escala de Likert: Una alternativa para elaborar e interpretar un instrumento de percepción social. Alta Tecnol. Y Soc. 2020, 38, 38–45. [Google Scholar]
- Moe Føre, H.; Thorvaldsen, T.; Osmundsen, T.C.; Asche, F.; Tveterås, R.; Fagertun, J.T.; Bjelland, H.V. Technological innovations promoting sustainable salmon (Salmo salar) aquaculture in Norway. Aquac. Rep. 2022, 24, 101115. [Google Scholar] [CrossRef]
- Bostock, J.; Lane, A.; Hough, C.; Yamamoto, K. An assessment of the economic contribution of EU aquaculture production and the influence of policies for its sustainable development. Aquac. Int. 2016, 24, 699–733. [Google Scholar] [CrossRef]
- Torres, M.; Paz, K.; Salazar, F. Métodos de Recolección de Datos Para una Investigación; 2006 E-newsletter, 2, 1–13. Available online: http://148.202.167.116:8080/jspui/handle/123456789/2817 (accessed on 12 March 2024).
- Barajas, A.P.; Saldaña, T.M.; Velázquez, M.A.J.; Cue, J.L.G. Política pública para el campo: PROCAMPO en el centro del país. Rev. Mex. Cienc. Agric. 2016, 7, 147–157. [Google Scholar]
- Sepúlveda Hernández, S.; Vizcarra Bordi, I.; Moctezuma Pérez, S.; García Mondragón, D.; Gómez Demetrio, W. desigualdades de género en la innovación inclusiva de la producción trucha-arcoíris, Estado de México. Agric. Soc. Y Desarro. 2023, 19, 493–512. [Google Scholar] [CrossRef]
- Bojórquez Molina, J.A.; López Aranda, L.; Hernández Flores, M.E.; Jiménez López, E. Utilización del alfa de Cronbach para validar la confiabilidad de un instrumento de medición de satisfacción del estudiante en el uso del software Minitab. In Proceedings of the 11th Latin American and Caribbean Conference for Engineering and Technology, Cancún, México, 14–16 August 2013; Available online: https://laccei.org/LACCEI2013-Cancun/RefereedPapers/RP065.pdf (accessed on 15 July 2024).
- Idenyi, J.N.; Eya, J.C.; Nwankwegu, A.S.; Nwoba, E.G. Aquaculture sustainability through alternative dietary ingredients: Microalgal value-added products. Eng. Microbiol. 2022, 2, 100049. [Google Scholar] [CrossRef]
- Gomes da Silva, E.; Castilho-Barros, L.; Henriques, M.B. Economic feasibility of integrated multi-trophic aquaculture (mussel Perna perna, scallop Nodipecten nodosus and seaweed Kappaphycus alvarezii) in Southeast Brazil: A small-scale aquaculture farm model. Aquaculture 2022, 552, 738031. [Google Scholar] [CrossRef]
- Tolentino-Zondervan, F.; Ngoc, P.T.A.; Roskam, J.L. Use cases and future prospects of blockchain applications in global fishery and aquaculture value chains. Aquaculture 2023, 565, 739158. [Google Scholar] [CrossRef]
- Cordeiro, C.M. A corpus-based approach to understanding market access in fisheries and aquaculture international business research: A systematic literature review. Aquac. Fish. 2019, 4, 219–230. [Google Scholar] [CrossRef]
- Jaiswal, S.; Rasal, K.D.; Chandra, T.; Prabha, R.; Iquebal, M.A.; Rai, A.; Kumar, D. Proteomics in fish health and aquaculture productivity management: Status and future perspectives. Aquaculture 2023, 566, 739159. [Google Scholar] [CrossRef]
- Wang, P.; Ji, J.; Zhang, Y. Aquaculture extension system in China: Development, challenges, and prospects. Aquac. Rep. 2020, 17, 100339. [Google Scholar] [CrossRef]
- González Ochoa, A.L.; Machado Ramírez, J.G.; Talavera Hernández, M.E.; Sevilla Rizo, A. Influencia de las TIC en el proceso administrativo. Rev. Científica FAREM-Estelí 2020, 33, 52–63. [Google Scholar] [CrossRef]
- Oliveira, F.A.; Argentim, D.; Novelli, P.K.; Agostinho, S.M.M.; Agostinho, L.M.; Agostinho, C.A. Automatic feeders for Nile tilapia raised in cages: Productive performance at high feeding frequencies and different rates. Arq. Bras. Med. Vet. E Zootec. 2016, 68, 702–708. [Google Scholar] [CrossRef][Green Version]
- Yue, G.H.; Tay, Y.X.; Wong, J.; Shen, Y.; Xia, J. Aquaculture species diversification in China. Aquac. Fish. 2024, 9, 206–217. [Google Scholar] [CrossRef]
- Rastegari, H.; Nadi, F.; Lam, S.S.; Ikhwanuddin, M.; Kasan, N.A.; Rahmat, R.F.; Mahari, W.A.W. Internet of Things in aquaculture: A review of the challenges and potential solutions based on current and future trends. Smart Agric. Technol. 2023, 4, 100187. [Google Scholar] [CrossRef]
- Ariza, F.G.; Rodriguez, E.M. Tecnología Biofloc (BFT), una alternativa sostenible para el desarrollo de la acuicultura: Revisión. Ing. Y Región 2019, 21, 2–11. [Google Scholar] [CrossRef]
- Martínez Córdova, L.R.; Martínez Porchas, M.; Robles Porchas, G.R.; Garibay Valdez, E. Alternativas de Acuacultura Sostenible: Aspectos Nutricionales. In Investigación e Innovación en Nutrición Acuícola, 1st ed.; Cruz Suárez, L.E., Tapia Salazar, M., Nieto López, M.G., Villarreal Cavazos, D.A., Gamboa Delgado, J., Martínez Palacios, C.A., Eds.; Universidad Autónoma de Nuevo León: Monterrey, Mexico, 2022; pp. 245–262. [Google Scholar]
- García-Ulloa, M.; Hernandez-Llamas, A.; Armenta-Soto, S.J.; Rodríguez-González, H. Substituting fishmeal with mixtures of wheat, corn and soya bean meals in diets for the white leg shrimp, Litopenaeus vannamei (Boone): Effect on production parameters and preliminary economic assessment. Aquac. Res. 2017, 48, 4864–4873. [Google Scholar] [CrossRef]
- Goda, A.; Saad, A.; Hanafy, M.; Sharawy, Z.; El-Haroun, E. Dietary effects of Azolla pinnata combined with exogenous digestive enzyme (DigestinTM) on growth and nutrients utilization of freshwater prawn, Macrobrachium rosenbergii (de Man 1879). J. Ocean. Limnol. 2018, 36, 1434–1441. [Google Scholar] [CrossRef]
- Arriaga-Hernández, D.; Hernández, C.; Martínez-Montaño, E.; Ibarra-Castro, L.; Lizárraga-Velázquez, E.; Leyva-López, N.; Chávez-Sánchez, M.C. Fish meal replacement by soybean products in aquaculture feeds for white snook, Centropomus viridis: Effect on growth, diet digestibility, and digestive capacity. Aquaculture 2021, 530, 735823. [Google Scholar] [CrossRef]
- Llanes, J.; Parisi, G. Substitution of a high percentage of fishmeal for silages of fishery by-products in extruded diets for Clarias gariepinus. Cuba. J. Agric. Sci. 2021, 55, 1–8. [Google Scholar]
- Sánchez-Alcade, M.C.; García-Ulloa, M.; Martínez Montaño, E.; Castro-Martínez, C.; Álvarez-Ruíz, P.; Rodríguez González, H. Use of Enzyme Mixtures in Diets Based on Animal and Plant Ingredients for Litopenaeus vannamei: Effect on Digestibility, Growth, and Enzyme Activity. Turk. J. Fish. Aquat. Sci. 2023, 23, TRJFAS21999. [Google Scholar] [CrossRef]
- Midhun, S.J.; Arun, D. Alternative feed technology in aquaculture. Recent Adv. Aquac. Microb. Technol. 2023, 291–306. [Google Scholar] [CrossRef]
- Rodríguez-Leal, O.V.; Arceo-Díaz, S.; Bricio-Barrios, E.E.; Amezcua-Valdovinos, I.; Alfredo, S.-G.B. Propuesta de diseño de un alimentador automatizado para la acuicultura. Difu100ci@ Rev. Difusión Científica Ing. Y Tecnol. 2021, 15, 124–131. [Google Scholar]
- Cristiano, S.; Baarset, H.; Bruckner, C.; Johansen, J.; Pastres, R. Emergy assessment to assess the ecological sustainability of smolt production and innovative options for the reuse and valorisation of aquaculture discards. Ecol. Indic. 2023, 146, 109850. [Google Scholar] [CrossRef]
- Rowan, N.J. The role of digital technologies in supporting and improving fishery and aquaculture across the supply chain—Quo Vadis? Aquac. Fish. 2023, 8, 365–374. [Google Scholar] [CrossRef]
- Joffre, O.M.; Klerkx, L.; Dickson, M.; Verdegem, M. How is innovation in aquaculture conceptualized and managed? A systematic literature review and reflection framework to inform analysis and action. Aquaculture 2017, 470, 129–148. [Google Scholar] [CrossRef]
- Kamali, S.; Ward, V.C.A.; Ricardez-Sandoval, L. Dynamic modeling of recirculating aquaculture systems: Effect of management strategies and water quality parameters on fish performance. Aquac. Eng. 2022, 99, 102294. [Google Scholar] [CrossRef]
- Sampaio, F.G.; Araújo, C.A.S.; Dallago, B.S.L.; Stech, J.L.; Lorenzzetti, J.A.; Alcântara, E.; Losekann, M.E.; Marin, D.B.; DionísioLeão, J.A.; Bueno, G.W. Unveiling low-to-high-frequency data sampling caveats for aquaculture environmental monitoring and management. Aquac. Rep. 2021, 20, 100764. [Google Scholar] [CrossRef]
- Liu, J.; Yi, N.K.; Wang, S.; Lu, L.J.; Huang, X.F. Impact of plant species on spatial distribution of metabolic potential and functional diversity of microbial communities in a constructed wetland treating aquaculture wastewater. Ecol. Eng. 2016, 94, 564–573. [Google Scholar] [CrossRef]
- Fedorova, G.; Grabic, R.; Grabicová, K.; Turek, J.; Van Nguyen, T.; Randak, T.; Brooks, B.W.; Zlabek, V. Water reuse for aquaculture: Comparative removal efficacy and aquatic hazard reduction of pharmaceuticals by a pond treatment system during a one year study. J. Hazard Mater. 2022, 421, 126712. [Google Scholar] [CrossRef]
- Sun, X.; Li, X.; Tang, S.; Lin, K.; Zhao, T.; Chen, X. A review on algal-bacterial symbiosis system for aquaculture tail water treatment. Sci. Total Environ. 2022, 847, 157620. [Google Scholar] [CrossRef]
- Sonnenholzner-Varas, J.I. Where is echinoderm aquaculture heading in Latin America? Potential, challenges and opportunities. Rev. Biol. Trop. 2021, 69 (Suppl. S1), S514–S549. [Google Scholar] [CrossRef]
- Torres Valderrama, P.I. El modelo de la triple hélice como propuesta para incorporar innovación en la acuicultura nacional. Rev. Electrónica Gestión Las Pers. Y Tecnol. 2019, 12, 59–75. [Google Scholar]
- Goswami, M.; Trudeau, V.L.; Lakra, W.S. Biotechnology in modern aquaculture: Innovations, advancements, and challenges. Front. Aquac. Biotechnol. 2023, 1–13. [Google Scholar] [CrossRef]
- Wiber, M.G.; Mather, C.; Knott, C.; Gómez, M.A.L. Regulating the Blue Economy? Challenges to an effective Canadian aquaculture act. Mar. Policy 2021, 131, 104700. [Google Scholar] [CrossRef]
- Berger, C. La Acuicultura y su Potencial en el Contexto del Desarrollo Sostenible del Perú. Universidad Científica del Sur [Internet]. 2020, 1. Available online: https://revistas.cientifica.edu.pe/index.php/southsustainability/article/view/585 (accessed on 2 January 2024).
- Britsch, M.L.; Leslie, H.M.; Stoll, J.S. Diverse perspectives on aquaculture development in Maine. Mar. Policy 2021, 131, 104697. [Google Scholar] [CrossRef]
- Gentry, R.R.; Rassweiler, A.; Ruff, E.O.; Lester, S.E. Global pathways of innovation and spread of marine aquaculture species. One Earth 2023, 6, 20–30. [Google Scholar] [CrossRef]
- Naylor, R.; Fang, S.; Fanzo, J. A global view of aquaculture policy. Food Policy 2023, 116, 102422. [Google Scholar] [CrossRef]
- Kvalvik, I.; Robertsen, R. Inter-municipal coastal zone planning and designation of areas for aquaculture in Norway: A tool for better and more coordinated planning? Ocean. Coast Manag. 2017, 142, 61–70. [Google Scholar] [CrossRef]
- Gangnery, A.; Bacher, C.; Boyd, A.; Liu, H.; You, J.; Strand, Ø. Web-based public decision support tool for integrated planning and management in aquaculture. Ocean. Coast Manag. 2021, 203, 105447. [Google Scholar] [CrossRef]


Disclaimer/Publisher’s Note: The statements, opinions and data contained in all publications are solely those of the individual author(s) and contributor(s) and not of MDPI and/or the editor(s). MDPI and/or the editor(s) disclaim responsibility for any injury to people or property resulting from any ideas, methods, instructions or products referred to in the content. |
© 2024 by the authors. Licensee MDPI, Basel, Switzerland. This article is an open access article distributed under the terms and conditions of the Creative Commons Attribution (CC BY) license (https://creativecommons.org/licenses/by/4.0/).