Article

Sustainability Development through a Nearly Zero Energy Building Implementation Case: An Office Building in South Jakarta

by
Farizal Farizal
1,2,*,
Muhammad Aqil Noviandri
1 and
Hanif Hamdani
1
1
Department of Industrial Engineering, Faculty of Engineering, Kampus Baru UI, Universitas Indonesia, Depok 16424, Indonesia
2
Research Center for Biomass Valorization (RCBV), Kampus Baru UI, Universitas Indonesia, Depok 16424, Indonesia
*
Author to whom correspondence should be addressed.
Sustainability 2024, 16(16), 7027; https://doi.org/10.3390/su16167027
Submission received: 8 May 2024 / Revised: 17 June 2024 / Accepted: 20 June 2024 / Published: 16 August 2024
(This article belongs to the Section Green Building)

Abstract

:
Nearly zero energy buildings (NZEBs) might play a significant role in addressing current global environmental problems, i.e., greenhouse gas (GHG) emissions. Buildings are one of the main electricity consumers. With current electricity production coming mainly from fossil fuel power plants, buildings contribute indirectly to GHG emissions. This report shows potential energy-saving alternatives (thus reducing the carbon footprints) for an 18-story office building in South Jakarta’s central business district. Four alternatives are considered, namely cooling tower and CWP pump replacement, BAS installation, LED dim light replacement, and solar panel installation. The project that implements all four alternatives indeed produces the biggest emissions savings. However, its net present value (NPV) is negative, which means the project is not economically feasible. Furthermore, any combination of projects involving solar panel installation will produce negative NPVs. The combination of cooling tower and CWP pump replacement, BAS installation, and LED dim light replacement will be the best option, with an NPV of IDR 437,853,822, an energy consumption index (IKE) value of 11.76 (meaning the “efficient” building category) and a carbon emissions reduction of 1172.65 tons of CO2.

1. Introduction

According to the United Nations Environment Program, the 232.4 billion square meters of global building floor area in 2016 is estimated to increase to 315.5 billion square meters in 2030, or to increase by 36% [1]. A more recent estimation projects that the building area will grow to 358 billion square meters in 2030, where nearly 298 billion square meters will be in developing and emerging economic countries [2]. Buildings are a significant contributor to carbon emissions due to their energy consumption for heating, cooling, lighting, and day-to-day operations. Globally, buildings and the construction sector are responsible for around 38% of global energy-related CO2 emissions [3]. In the USA, greenhouse gas (GHG) emissions due to buildings’ heating, cooling, and other forms of energy consumption contribute to 20% of the total emissions [4]. Most of the energy consumed in buildings is electricity coming from the grid and natural gas [5], while 82.31% of primary energy sources are fossil fuels [6].
The nearly zero energy building (NZEB) concept may offer a solution to this issue by minimizing buildings’ energy consumption, thereby reducing the carbon footprints of buildings [7]. In Indonesia, the government has imposed obligations to minimize GHG emissions through Presidential Regulation No. 61 of 2011, which outlines the National Action Plan for Reducing Greenhouse Gas Emissions, and Presidential Regulation No. 71 of 2011, which pertains to the Implementation of the National GHG Inventory. Indonesia signed the Kyoto Protocol through Law No. 17 of 2004, agreeing to participate in global efforts to reduce GHG emissions and implement sustainable development. Indonesia also committed to fulfilling its commitment to the Paris Agreement to reduce its emissions by 29% in 2030. The target will go up to 41% with international collaborations [8].
However, achieving NZEBs comes at a cost [9,10]. To save energy by replacing inefficient electrical appliances with smart ones or constructing independent renewable power sources like solar panels, a significant amount of investment is needed. This study aims to reconcile these seemingly contradictory issues by exploring different options for implementing NZEBs. It measures the impact of reducing electrical energy consumption on building efficiency and calculates the potential reduction in carbon emissions, and it also takes into account the associated economic impacts.

2. Theoretical Review

A nearly zero energy building (NZEB) is a building with very high energy performance, where the nearly zero (or very low amount) energy demand is covered by energy from renewable sources [11]. The basic principle of NZEB design is to optimize building design so that the energy needed can be saved as much as possible and can be met primarily by renewable energy sources. NZEB design can be performed through the following steps [10]:
  • Reducing energy utilization dissipation from the start through passive design, for instance, sealing gaps between doors and floors, using double entrance doors, etc.
  • Increasing energy savings through active design, for instance, replacing old air conditioning (AC) with smart AC, using LEDs for lighting, etc.
  • Generating electricity through implementing renewable energy sources, such as photo voltaic (PV), wind, microhydro, etc.
The implementation of NZEBs has been observed in various locations, such as the Cube Berlin in Germany. The Cube Berlin is a 10-story multi-tenant office building covering a total area of 19,500 m2. It utilizes innovative technologies, including solar panels, high thermal insulation systems, and advanced energy management technology. As a result, it saves 25% more energy compared to other environmentally friendly building standards [12]. The National Renewable Energy Laboratory (NREL) in Golden, Colorado, USA, is also an example of an NZEB. The NREL occupies an area that is 362,055 ft2 wide. To fulfill its energy need, i.e., 35 kBtu per ft2, the facility combines 2.5 megawatts of rooftop photovoltaic, solar thermal collector, and other renewable sources. In Indonesia, an example of an NZEB is the Green Office Park in BSD, Tangerang. The office consists of 11 five-story buildings with energy-saving technologies such as efficient AC, employs environmentally friendly building materials, and is supported by solar panels.
NZEBs are closely related to the concept of the energy consumption intensity (IKE, or intensitas konsumsi energi in the Indonesian language) in the building field. The IKE measures how efficiently a building uses energy to meet its operational needs without sacrificing users’ comfort. A building with a low IKE index is more efficient in its energy consumption than the one with higher IKE. The IKE can also be used to compare the energy efficiency among buildings. The IKE is expressed using Equation (1).
I K E = E c A
where IKE is the energy consumption intensity (kWh/m2/month), Ec is the energy consumption (kWh), and A is the building floor area (m2).
The IKE may differ from one building to another. It depends on many factors, including the building type, building size, energy consumption pattern, energy-saving level, building position, building envelope condition, and electrical equipment used [13]. The Minister of Energy and Mineral Resources, MEMR, has issued a regulation related to the IKE, namely Regulation No. 13 of 2012 on Energy and Water Saving. If for a particular month a building that employs air conditioning (AC) has an IKE more than 23.75 kWh/m2, it is categorized as very wasteful. If the building has an IKE between 19.17 and 23.75 kWh/m2, it is categorized as wasteful, etc. The IKE index is shown in Table 1.
NZEBs may play important role in reducing carbon emissions. Carbon emissions are the release of carbon-containing gases into the atmospheric layers that protect the earth. They are one form of air pollution from human activities that can damage the environment and human health. Equation (2) is the formula for calculating carbon emission reduction due to using less electricity.
E R = E S E F
where ER: Emission reduction (ton CO2), ES: Energy savings (MWh), EF: Emission factor (ton CO2/MWh).
Emission factor (EF). To calculate the carbon gas emission equivalent due to 1 kWh of electricity consumption, it is necessary to know the energy source or mix of energy sources used to generate the electricity. For commercial/office buildings, the source of their electrical energy is generally coming from the electric grid that mainly utilizes coal fired power plant. According to the Directorate General of Electricity of the Ministry of Energy and Mineral Resources [15], the Java-Madura-Bali (JAMALI) grid generation system with a total of 302 plants, the emission factor value at the City of Jakarta and surrounding areas is 0.8 ton CO2/MWh [16]. The emission factor will be the carbon reduction factor based on energy saving.
Besides from reducing carbon emissions, implementing NZEB also involves economic considerations and analysis. Every NZEB effort requires capital and operation and maintenance (OM) costs. NZEB projects involve significant initial investments to implement energy dissipation activities, energy efficiency measures, renewable energy technologies, and other sustainable features. If the NZEB is implemented by private, doers obligate profit from the project they fund. The most popular economic analysis method is the net present value (NPV) method [17,18]. In NPV calculations, NPV measures the difference between the present value of cash inflows (revenues), PVin, and the present value of cash outflows (costs), PVout, over the life cycle of the project. General NPV formula is stated in Equation (3).
N P V = P V i n P V o u t
If the NPV in Equation (3) turns out positive, it indicates that the present value of the income exceeds the initial investment and OM costs. The project is good to go. Otherwise, the project is unworthy. The NPV result in Equation (3) very much depends on cash inflows and cash outflows data used. In many cases, the data needed is not available. In this matter, estimation is carried out. Cash outflows and cash inflows data collection and estimation methods can be seen at [19,20].
Once the NPV is known, a sensitivity analysis (SA) is carried out. SA evaluates how changes in certain factors can influence economic analysis results. The goal of SA is to understand the level of uncertainty in a project or investment and identify the factors that influence the project. SA is also conducted because NPV calculation is based on estimated data [20]. If the NPV is positive, which means the project is feasible, SA is conducted by raising the costs and/or reducing the revenue. On the other hand, if the NPV is negative, which means the project is not feasible, SA is conducted by lowering the costs and raising the income (revenue).

3. Research Methodology

Figure 1 describes the stages and methods carried out in this research.
The problem extraction stage begins with stating that energy consumption in the building is still somewhat wasteful category and can be improved. A literature study is conducted to develop improved alternatives, and references from previous research regarding theories, ideas and empirical data relevant to the issue are searched. Alternatives are assessed based on their applicability to the building situation. For this purpose, data is retrieved and collected directly from the field. Primary data collection is carried out by first listing and classifying all devices used in the building, then continuing by measuring their power consumption, i.e., the electricity consumption of the air conditioning system, electronic equipment, lighting, transportation equipment & water pumps for one month in September 2023. Power consumptions are later used to estimate the costs incurred using the systems. At the same time, retrofit is determined based on the lowest consumption without disturbing worker comfort. Energy-saving investments appropriate to the existing conditions, available literature, and the technology applied are selected. The energy savings will be reviewed again to evaluate whether the IKE criteria can be changed from the current status to the better one, from somewhat wasteful to quite efficient. Next, the energy savings are converted into carbon emission reductions. The NPV is calculated to determine whether the project is feasible or not. Based on the NPV result, sensitivity analysis (SA) is conducted.

4. Result and Analysis

4.1. Study Case

Along with economic growth, South Jakarta, one of Jakarta’s centers of business and economic activity, faces major challenges to meet ever-increasing energy needs. The Governor Regulation (PERGUB) of the Special Capital Region of Jakarta Province Number 60 of 2022 concerning Green Buildings requires building managers to make efficient use of resources by using energy-efficient equipment in their buildings. LED lights, fans, air conditioners, and so on are required to consume the lowest possible energy. As the capital of Indonesia, Jakarta is home to more than six thousand buildings of 12 stories or more. In 2021, it was ranked 12 cities with the highest high-rise buildings in the world. Jakarta has 107 buildings that are 150 m high or more and 42 buildings that are more than 200 m high [21].
This study is taking place at an office building located in South Jakarta. The Building was erected in 1997. It has 18 floors with the total number of tenants is around 1650 people. Table 2 shows the Building profile. From data shown in Table 2, there are on average 92 people per floor and a person occupies on average 16.6 m-square area. This information indicates that the Building is a well utilized office building.
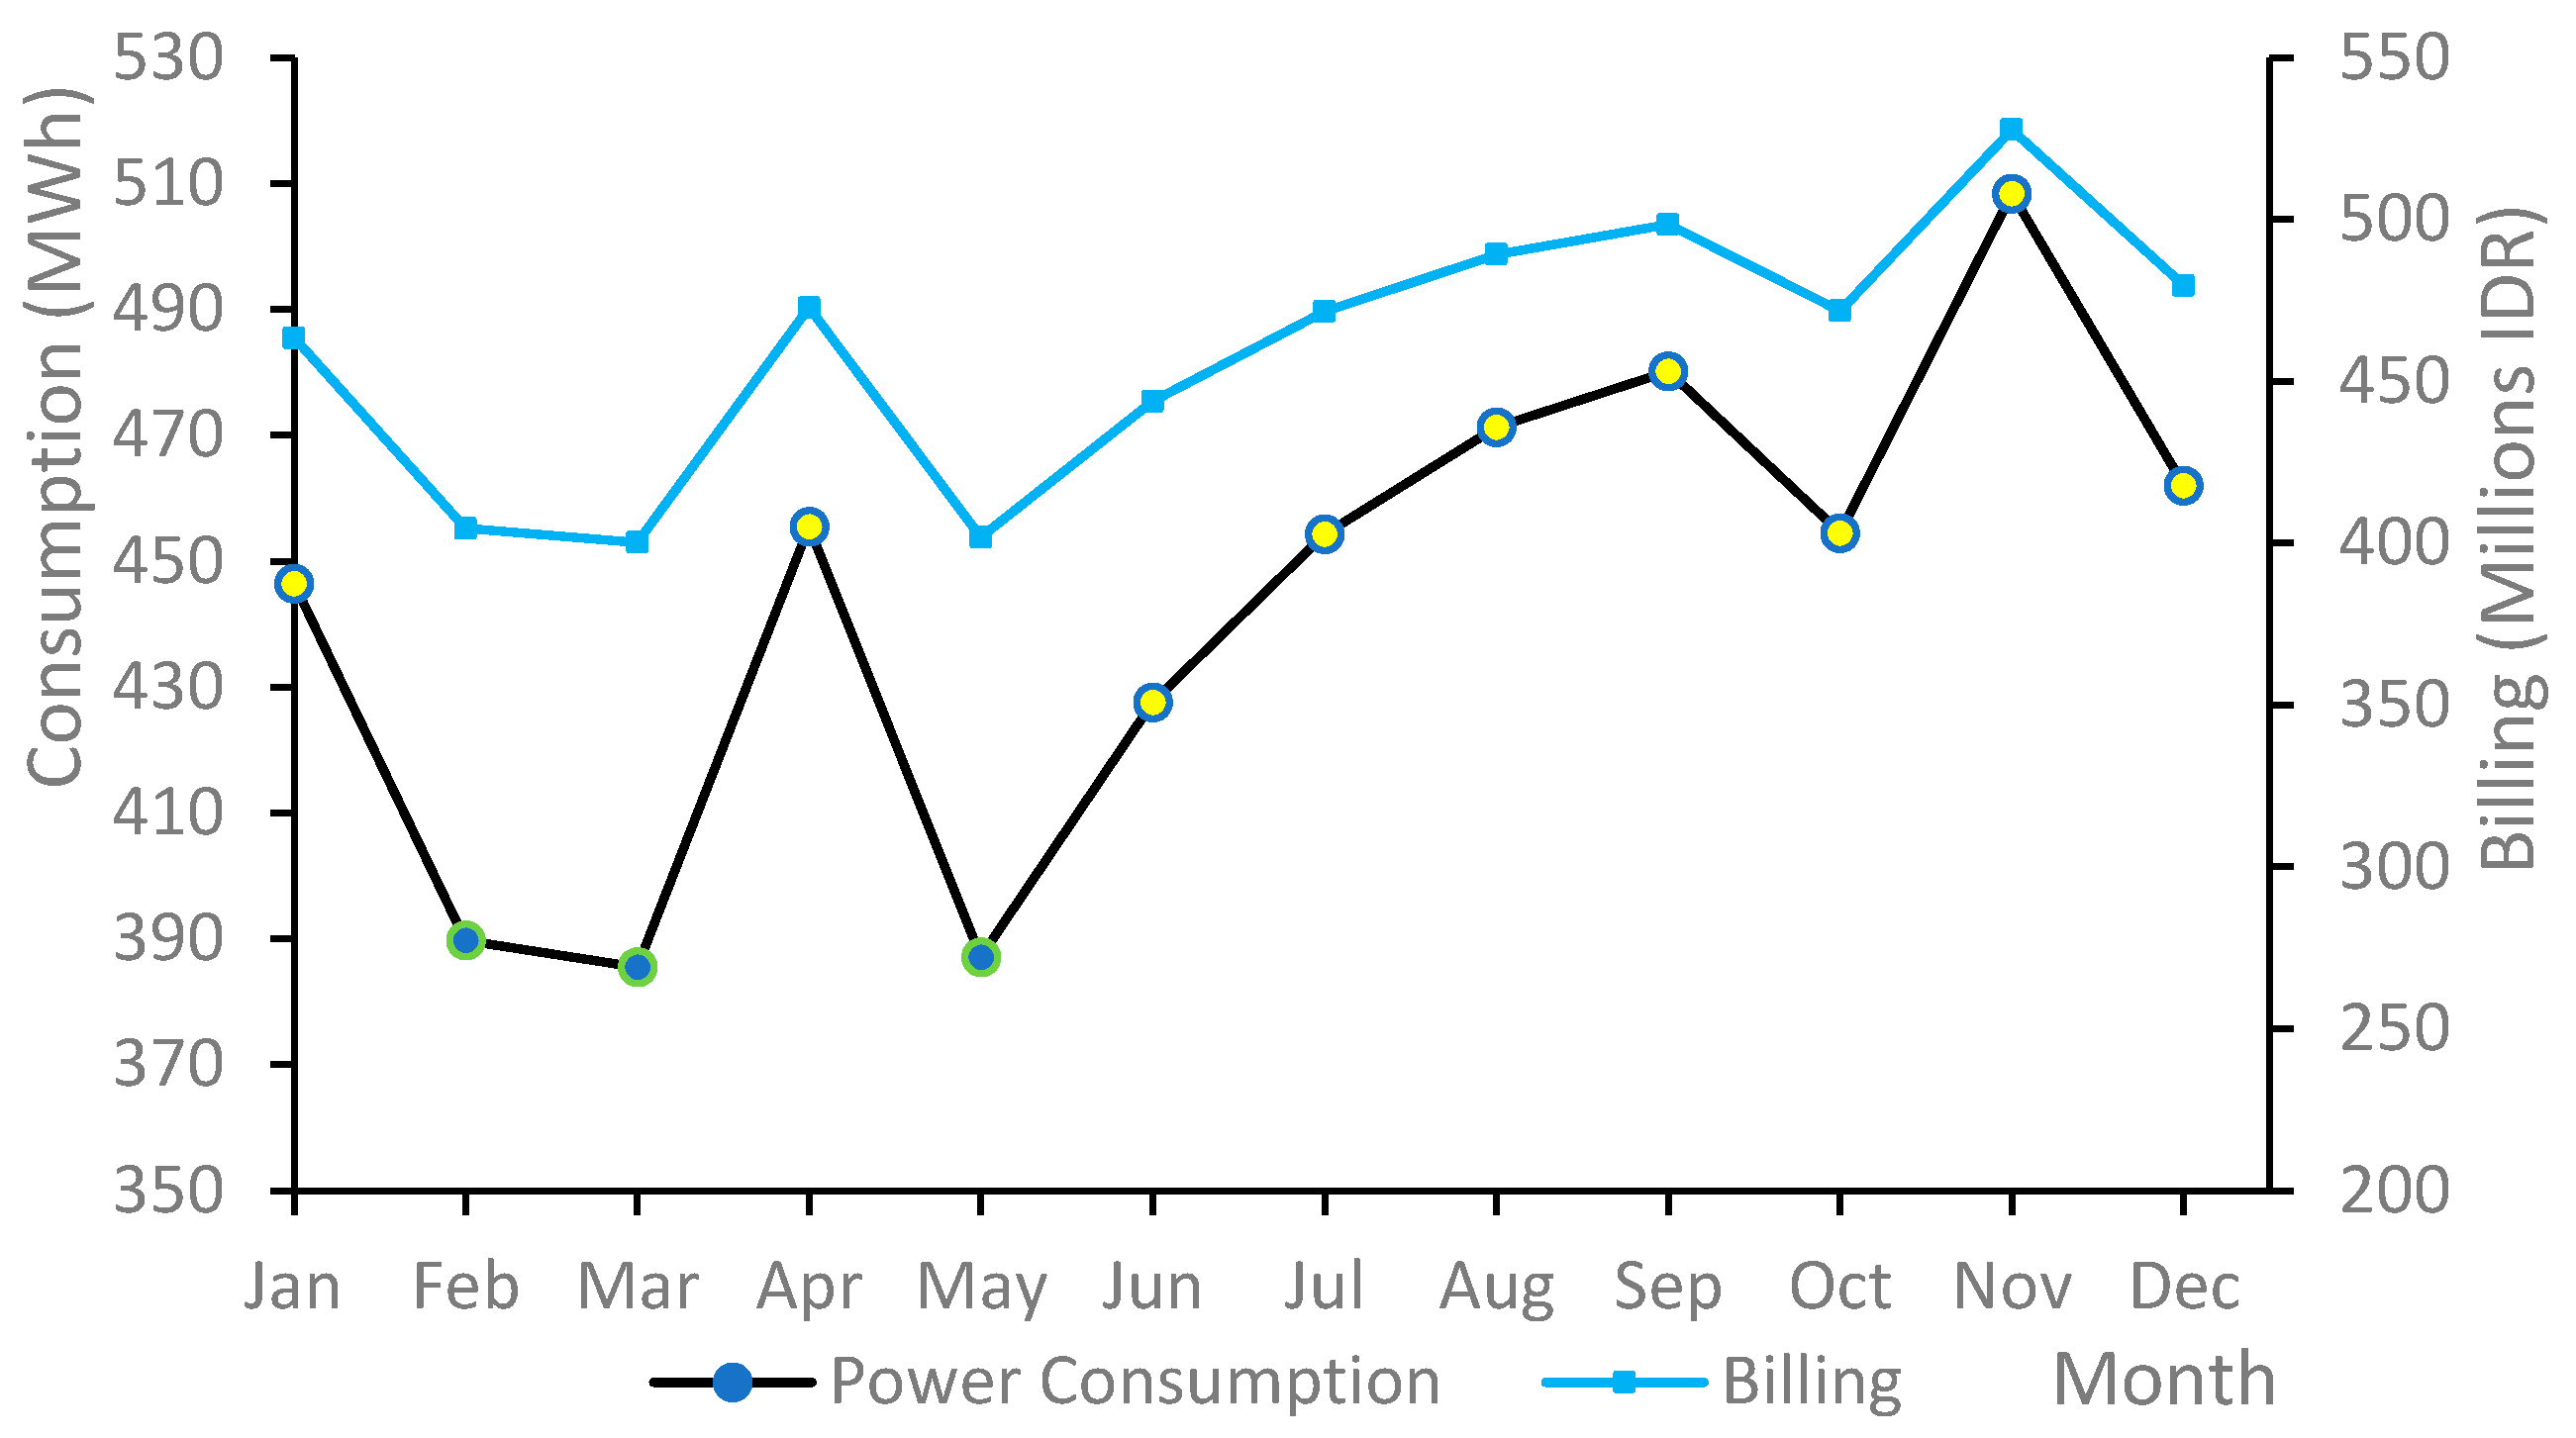
To determine the Building’s existing energy consumption status, i.e., Building’s IKE index and category, twelve month building energy consumption historical data are collected. The related IKE index is calculated using Equation (1), while IKE category is determined using Table 1. Figure 2 summarizes the results.
Figure 2 shows that during 2022, only in 3 months (February, March, and May) the Building has IKE belong to “Quite efficient” category (indicated by light green circles). The rest, its IKE falls to “A bit wasteful” category (yellow color circles). On average the Building’s IKE in 2022 is 16.23. This result indicates that the Building is using energy inefficiently. A study on a similar building (a-17 story office building with 21,833 m2 area) ends up with IKE 17.59 [22]. Another study on a-15 story office building with 19,993.34 m2 area even ends up with higher IKE, i.e., 19.97 [23]. However, even though this building has a better IKE index, improvement is still needed.
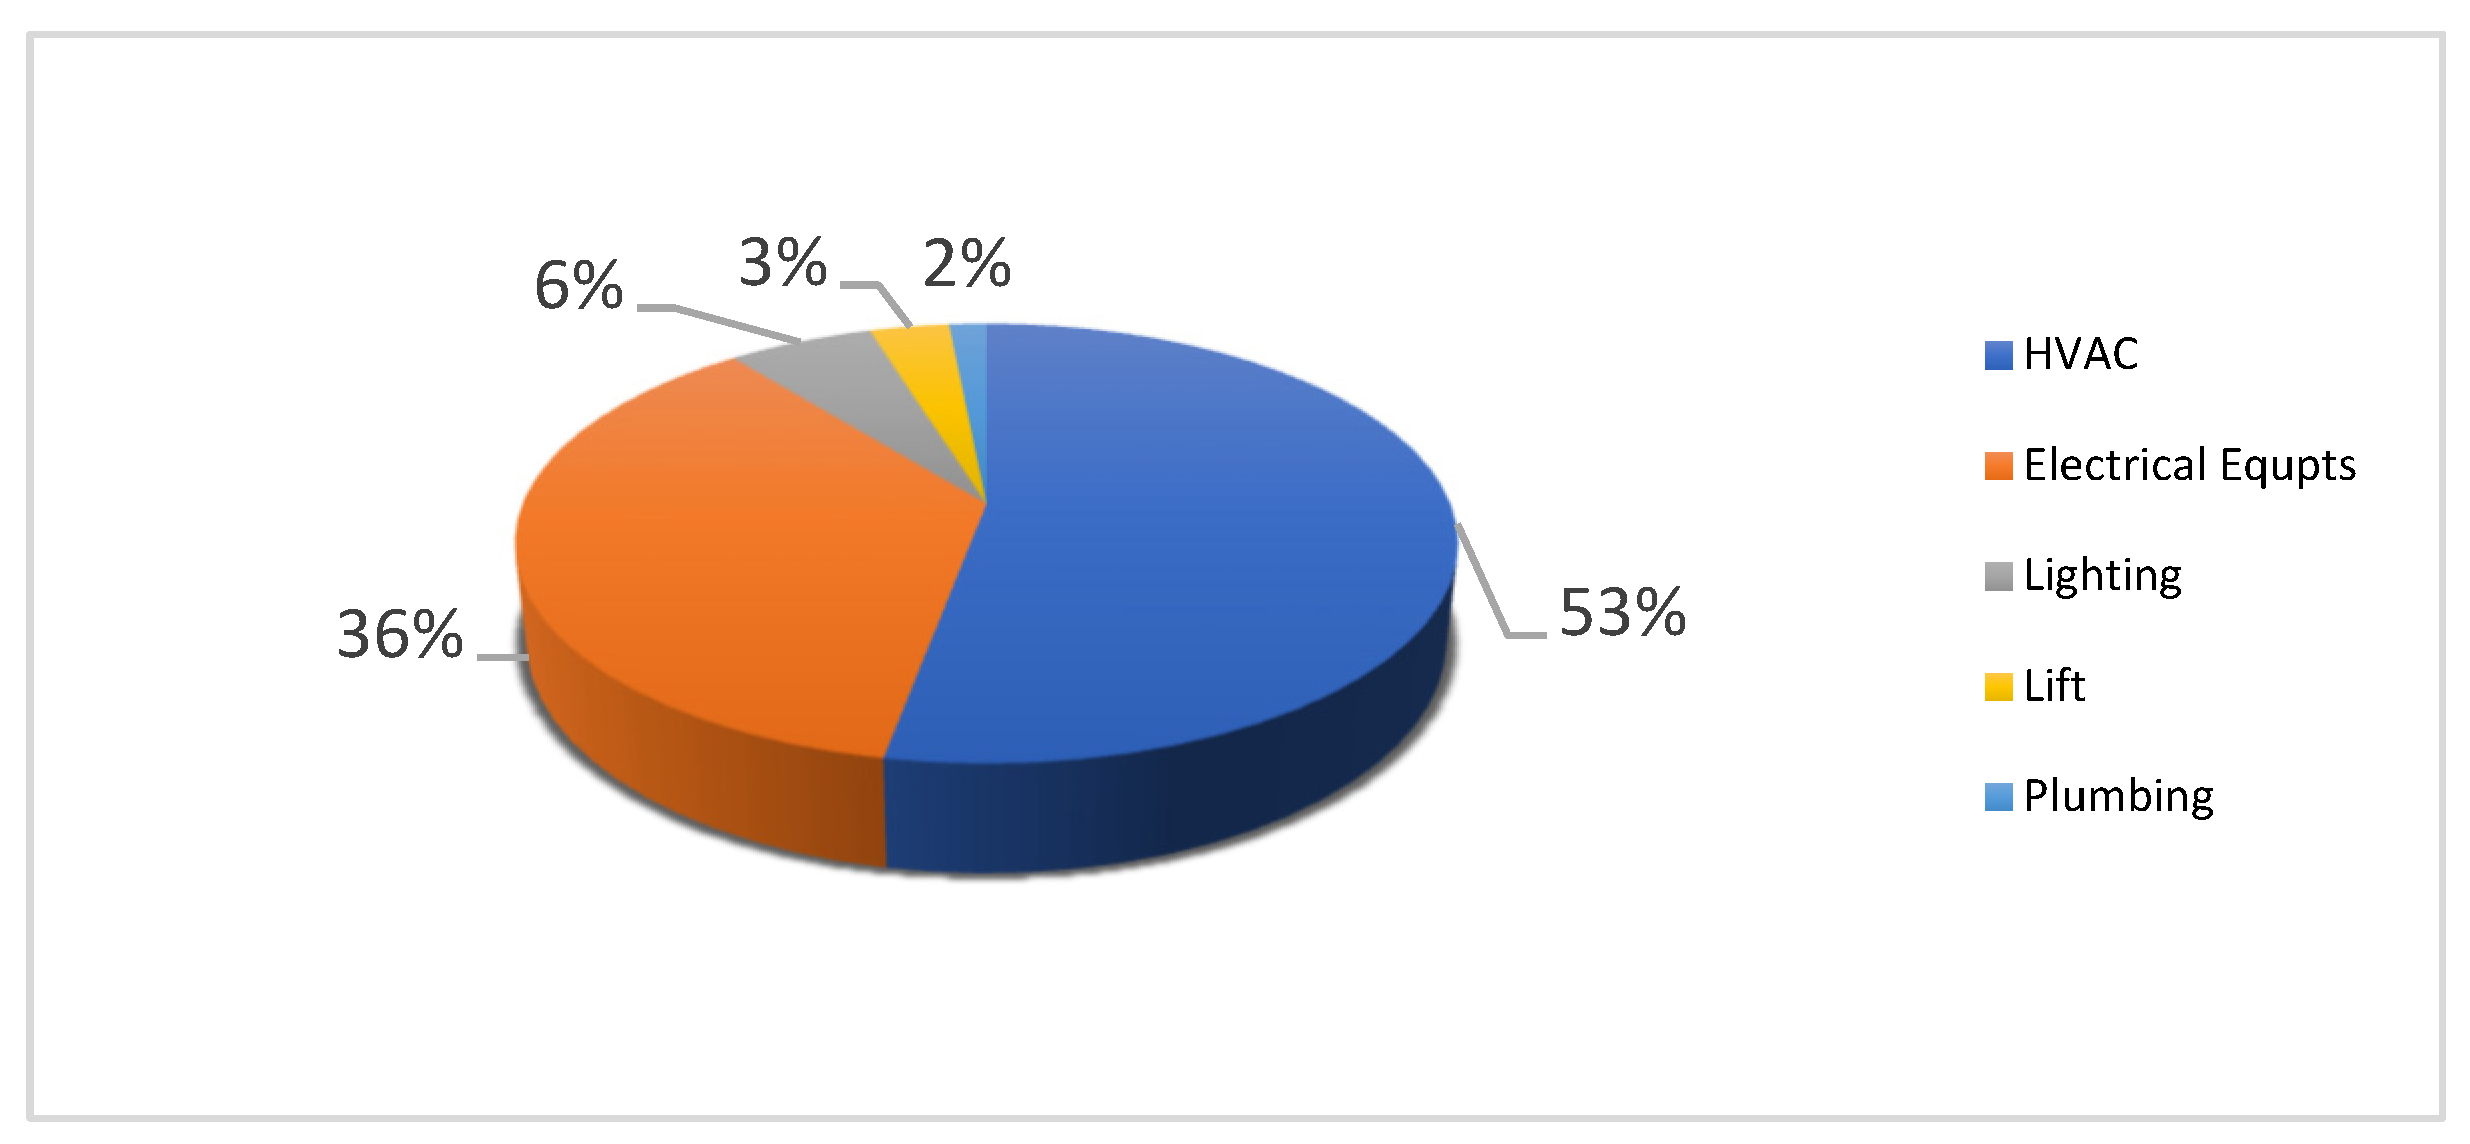
To provide a productive office environment, the Building is equipped with some systems, i.e., air conditioning systems, electrical equipment, including lighting systems, lifts, and water pumps. To conduct the improvement, Building’s energy consumption is measured via sub distribution panels which are classified as electrical equipment. Lamps’ Energy consumption is measured per floor. This allows for the portion of electrical equipment and lighting systems to be known. Figure 3 shows the measurement results of the electricity consumption.
Figure 3 clearly shows that the largest Building’s operation energy consumption is the air conditioning system (53%). This finding is in line with [24]’s finding conducted in the Philippines (which stated that AC consumes 51% of the energy), [25] in Pakistan (which stated that AC consumes 65% of the energy), and [26] in India (which stated that AC in commercial building is consumed 55% of the energy). After AC, Figure 3 shows that the second largest electricity consumption is the electric equipment (36%). This finding makes sense for implementing energy savings in AC and electric equipment. However, the use of electrical equipment such as servers, laptops, PCs, TVs, meeting monitors, refrigerators, microwaves, projectors, etc. depends on building tenants; the Building owner (operator) does not have the authority to control their utilization. Therefore, the second improvement effort is on the lighting equipment. Efficiency improvement is assessed while keeping the comfort of tenants working in the Building.
Current AC system in the Building consists of three AC systems with the central AC system consumes the largest amount of electricity, namely 235,089 kWh/month. Ref. [27] redesigned the HVAC and cooling system to reach NZEB. In this study, the proposed strategy to improve this central AC system is to replace its cooling tower and centrifugal water pump (CWP). Replacement is not carried out for water-cooled packaged unit (WCPU) because it involves major intervention in the Building structure. This renovation is not possible. The WCPU is generally installed as an internal unit inside the building. This condition prevents the current WCPU replacement with the new more efficient model except with implementing a major building reconstruction. If the WCPU replacement is carried out, the project will disrupt the Building’s activity significantly. The project is also costly. Meanwhile, cooling towers and CWP pumps are generally installed as part of the external cooling system outside the Building. The cooling tower with a capacity of HRT 450 consumes 55 kW, while the CWP pump with a water transfer capacity of 22 m3 to 50 m3 consumes 37 kW. Replacement for a more energy-efficient item is proposed. For cooling towers, the replacements are items that have the same specifications, but with more efficient energy consumption; the efficiency may reach 46.1% [28]. The alternative is the cooling tower with lighter fan cells and blades. Meanwhile, the CWP pump was replaced with a new pump whose design is more efficient in energy consumption, but the capacity required is the same. As a result there is a reduction in the number of CWP pumps from 3 to 2. From these replacements, the costs needed are IDR 639,150,000 for investment and IDR 44,200.000 per year for maintenance. Detail collected data of the costs are discussed in Section 4.2.1.
For the AC system, the next alternative improvement to install is the Building automation system (BAS). BAS is an automated system that controls and supervises the operation of various mechanical and electrical systems in a building. Ref. [29] reviewed papers on building energy consumption saving through automation and control systems. In the AC system, BAS is used to supervise, control, and schedule the operation on the equipment. When BAS equipment is applied to the AC sub-system, large equipment such as WCPU, cooling tower, CWP pump can be adjusted to work according to current needed operational conditions. Based on historical data, AC’s operational condition can be classified into 3 blocks. Time I is between 05:00–07:00 in the morning. At these hours, the Building begins to operate. With tenants’ activities scheduled at 07:00, the cooling capacity required is around 30%. Time II is between 07:00–16:00. At this period, the number of building occupants will reach 80% to 100% of the capacity. Therefore, the required cooling capacity is at 90%. Time III is between 16:00–21:00. At this time the number of occupants is generally higher than in Time I but lower than in Time II and the outside air temperature is relatively lower than Time II. The required cooling capacity reaches around 50%. From the collected data, the investment costs for BAS installation are IDR 5,520,239,684, and the maintenance costs are IDR 170,000,000 per year. Detail data are discussed in Section 4.2.2.
For the lighting system, an alternative way to save energy is installing LED dim lights. LED dim light is a lamp with adjusted light intensity according to user preferences or needs. Ref. [30] investigated replacing old lighting systems commonly used in buildings with movement control-based lighting and daylight sensing lighting. Ref. [31] showed that installing a sensor to control lighting saved up to 80% of lighting energy. Currently, LED down lights are the main lighting system in the Building. The Building is equipped with a total of 4881 lights over its 18 floors. These lamps are the object of efficiency improvement. The LED down lights installed in the Building have power 20 Watts. They are operated for 17 to 24 h. The LED dim lights are integrated into an automatic control system that can be adjusted according to the daytime brightness, the occupants’ presence, and the sensor. To optimize the saving, observation is also put on the day-lighting time and building operations. As a result, lighting time can be classified into 4 times zone. Time I is between 05:00–07:00. At this hour, the Building begins to operate. The occupancy capacity is around 30%, so the lighting capacity is 50%. Time II is between 07:00–16:00. At this time the Building capacity reaches 80–100%, so lighting capacity is 100%. Time III is between 16:00–20:00. At this time the Building capacity goes back to 30%, so the required light capacity is 50%. Time IV is between 20:00–05:00. At this time, the Building is almost empty. It has no operational activities except for the on-duty security and engineering staffs. For the lighting system improvement, the investment costs are IDR 1,458,380,000 with additional investment costs in the year tenth is IDR 878,580,000. Detailed collected data of the cost are discussed in Section 4.2.3.
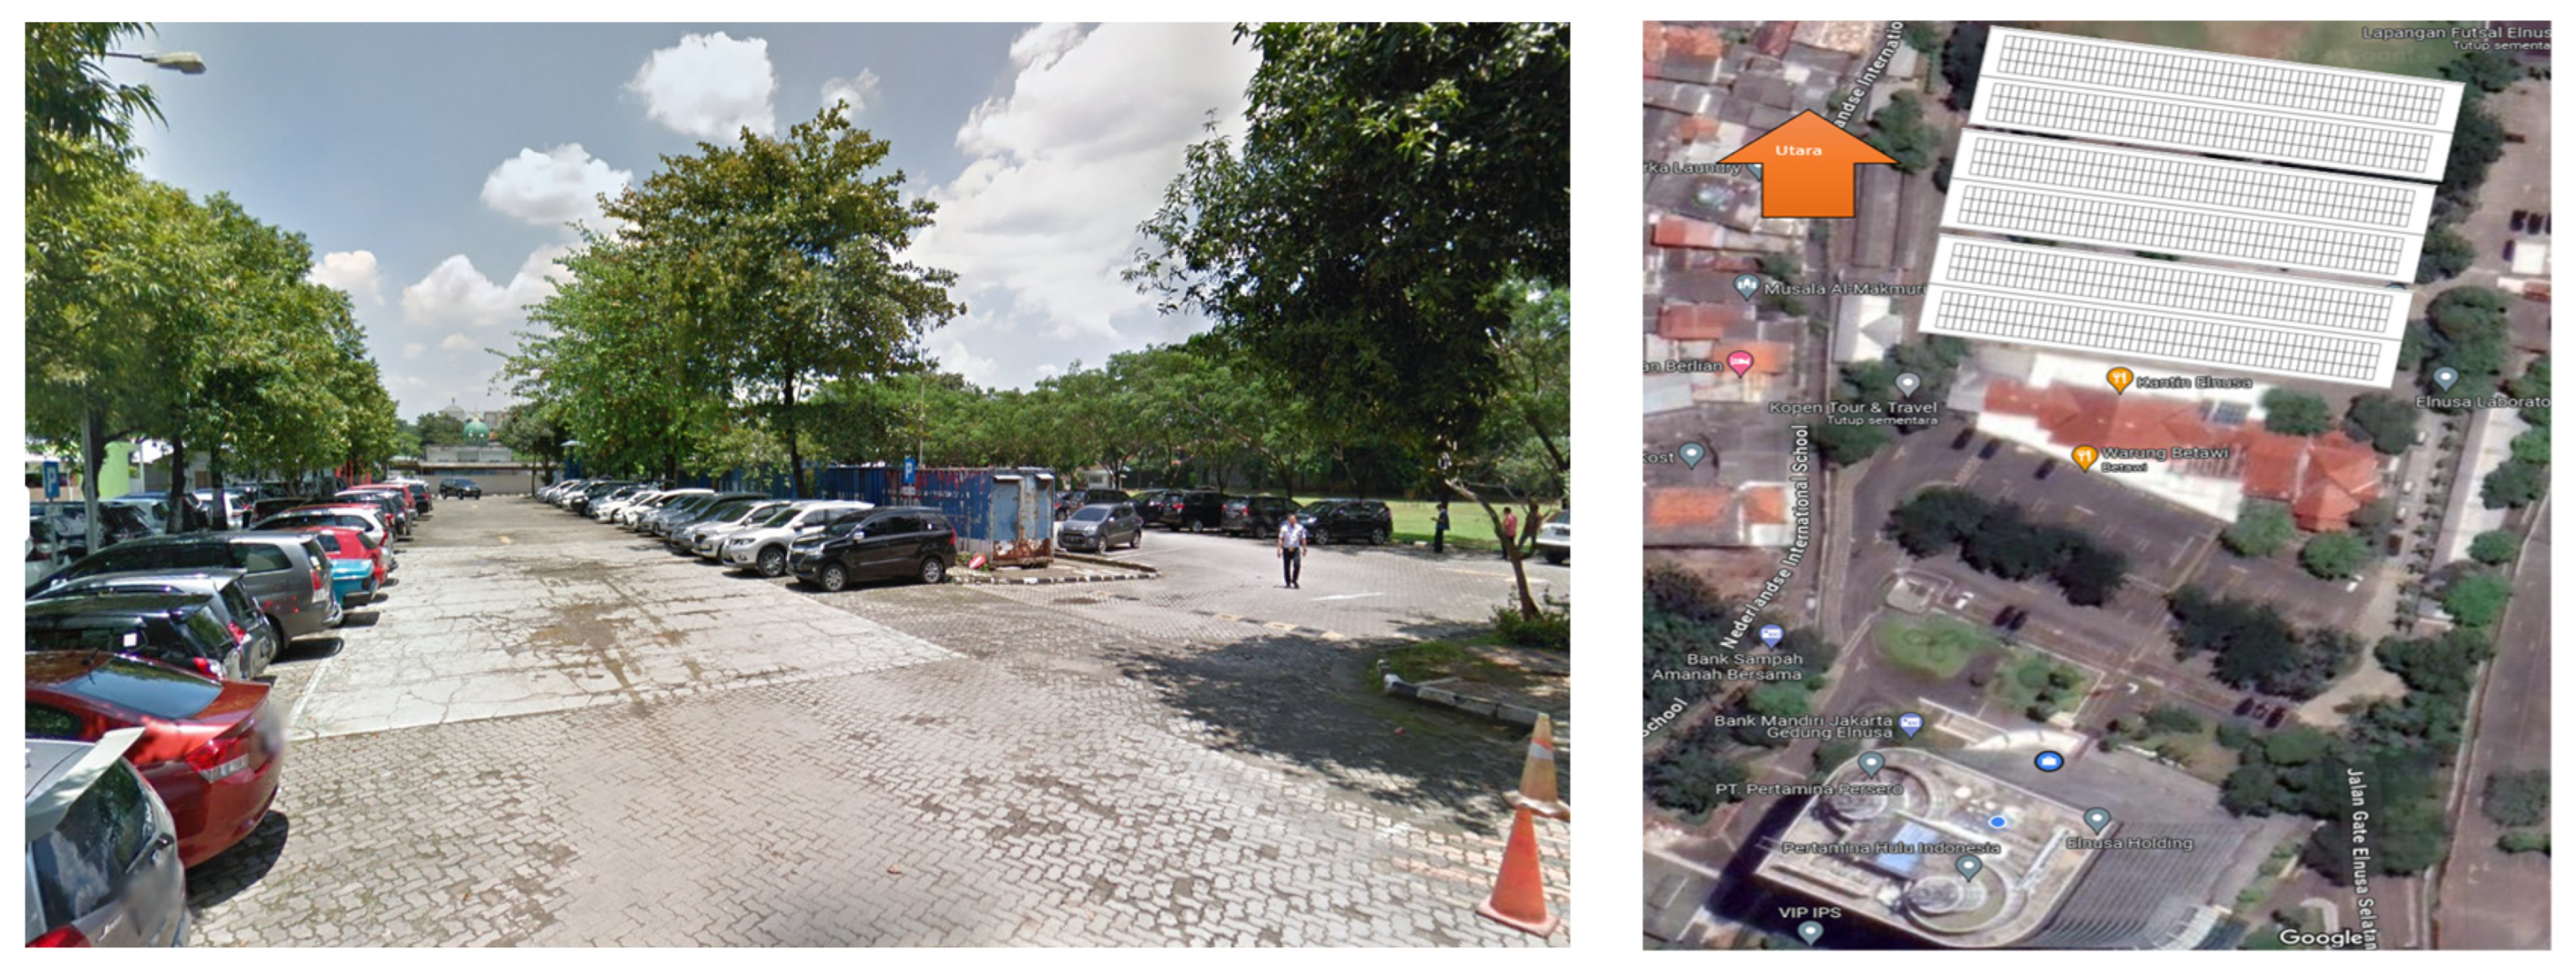
As an integral effort to implement NZE to the Building, among many alternatives to generate electricity, solar panels are considered as a good alternative [32,33]. The panels will be installed in the Building’s backyard that currently used as a parking lot. This large open area allows for easy panel installation and optimal sunlight exposure throughout the day (see Figure 4). Currently, the office has a 2817 m2 open space parking lot. The solar panels are planned to be installed in 3 canopies format. A canopy has a length of 55 m and a width of 14 m, so that each canopy has an area of 770 m2. A photovoltaic module has a length of 2 m and a width of 1 m. A canopy of 770 m2 can be installed with 936 modules arranged in a series of 6 rows; one row has 156 modules. A monocrystalline module can generate a power of 410 Wp. The estimated energy produced for 936 modules is 383.76 kWp. According to [34], PV out for South Jakarta is 3.61 kWh/kWp per day. Daily Output for the total solar panels is 1385.37 kWh per day or 505,661.36 kWh per year. To harvest this benefit, the investment should be spent is IDR 7,958,186,000 and the maintenance cost is IDR 115,958,186 per year. Detailed collected data of the costs are discussed in Section 4.2.4.
One possible challenge to harvest the full performance of PV output is Jakarta’s pollution. As the Capital of Indonesia, Jakarta is the home of business, social and cultural activities. In addition to its 10.2 million residents, everyday 1.26 million of its suburban areas such as Depok, Tangerang Selatan, Bekasi, and Bogor commute to Jakarta [35]. In 2022, the number of vehicles in Jakarta is 26,370,535 units where most of them are motorcycles [36]. In addition to emissions from transportation, emissions’ sources at Jakarta are also from industry, waste burning, and power plants. The emissions are more intense in Central and South Jakarta where the Building is located [37]. Emissions such as CO, CO2, SOx, NOx gases and PM2.5 particulate can cover solar panel surfaces. This thin layer hinders the sunlight from reaching module crystalline, thus reduces the energy generated [38,39,40].

4.2. Detailed Calculation and Sensitivity Analysis

4.2.1. Cooling Tower and CWP

The first alternative for energy consumption saving is replacing the cooling tower and CWP pump for the central AC. Table 3 and Table 4 show electricity consumption and cost incurred per year before and after the equipment replacement, respectively. The calculation assumes for 16 h (05:00–20:00) of operation and the electricity tariff of IDR 1035.78 per kWh.
Using Table 3 and Table 4, electricity consumption and cost saving due to cooling tower and CWP pump replacement are estimated as 919,360 kWh − 773,760 kWh = 145,600 kWh per year and IDR 952,254,701 − IDR 801,445,133 = IDR 150,809,568 per year. Using Equation (1) the IKE is:
IKE = ( 5,322,803 145,600 ) 12 ÷ 27,338 = 15.78
and using Equation (2), the emissions’ reduction is 116,480 kg CO2 (or 116.48 ton CO2) per year. The IKE decreased by 0.52 but it is still within the “a bit wasteful” category.
To calculate the NPV for this replacement, investment costs and other related data are collected directly from their sources or from secondary sources [19]. Table 5 shows detailed investment cost data for the project, while Table 6 shows recapitulation of the investment.
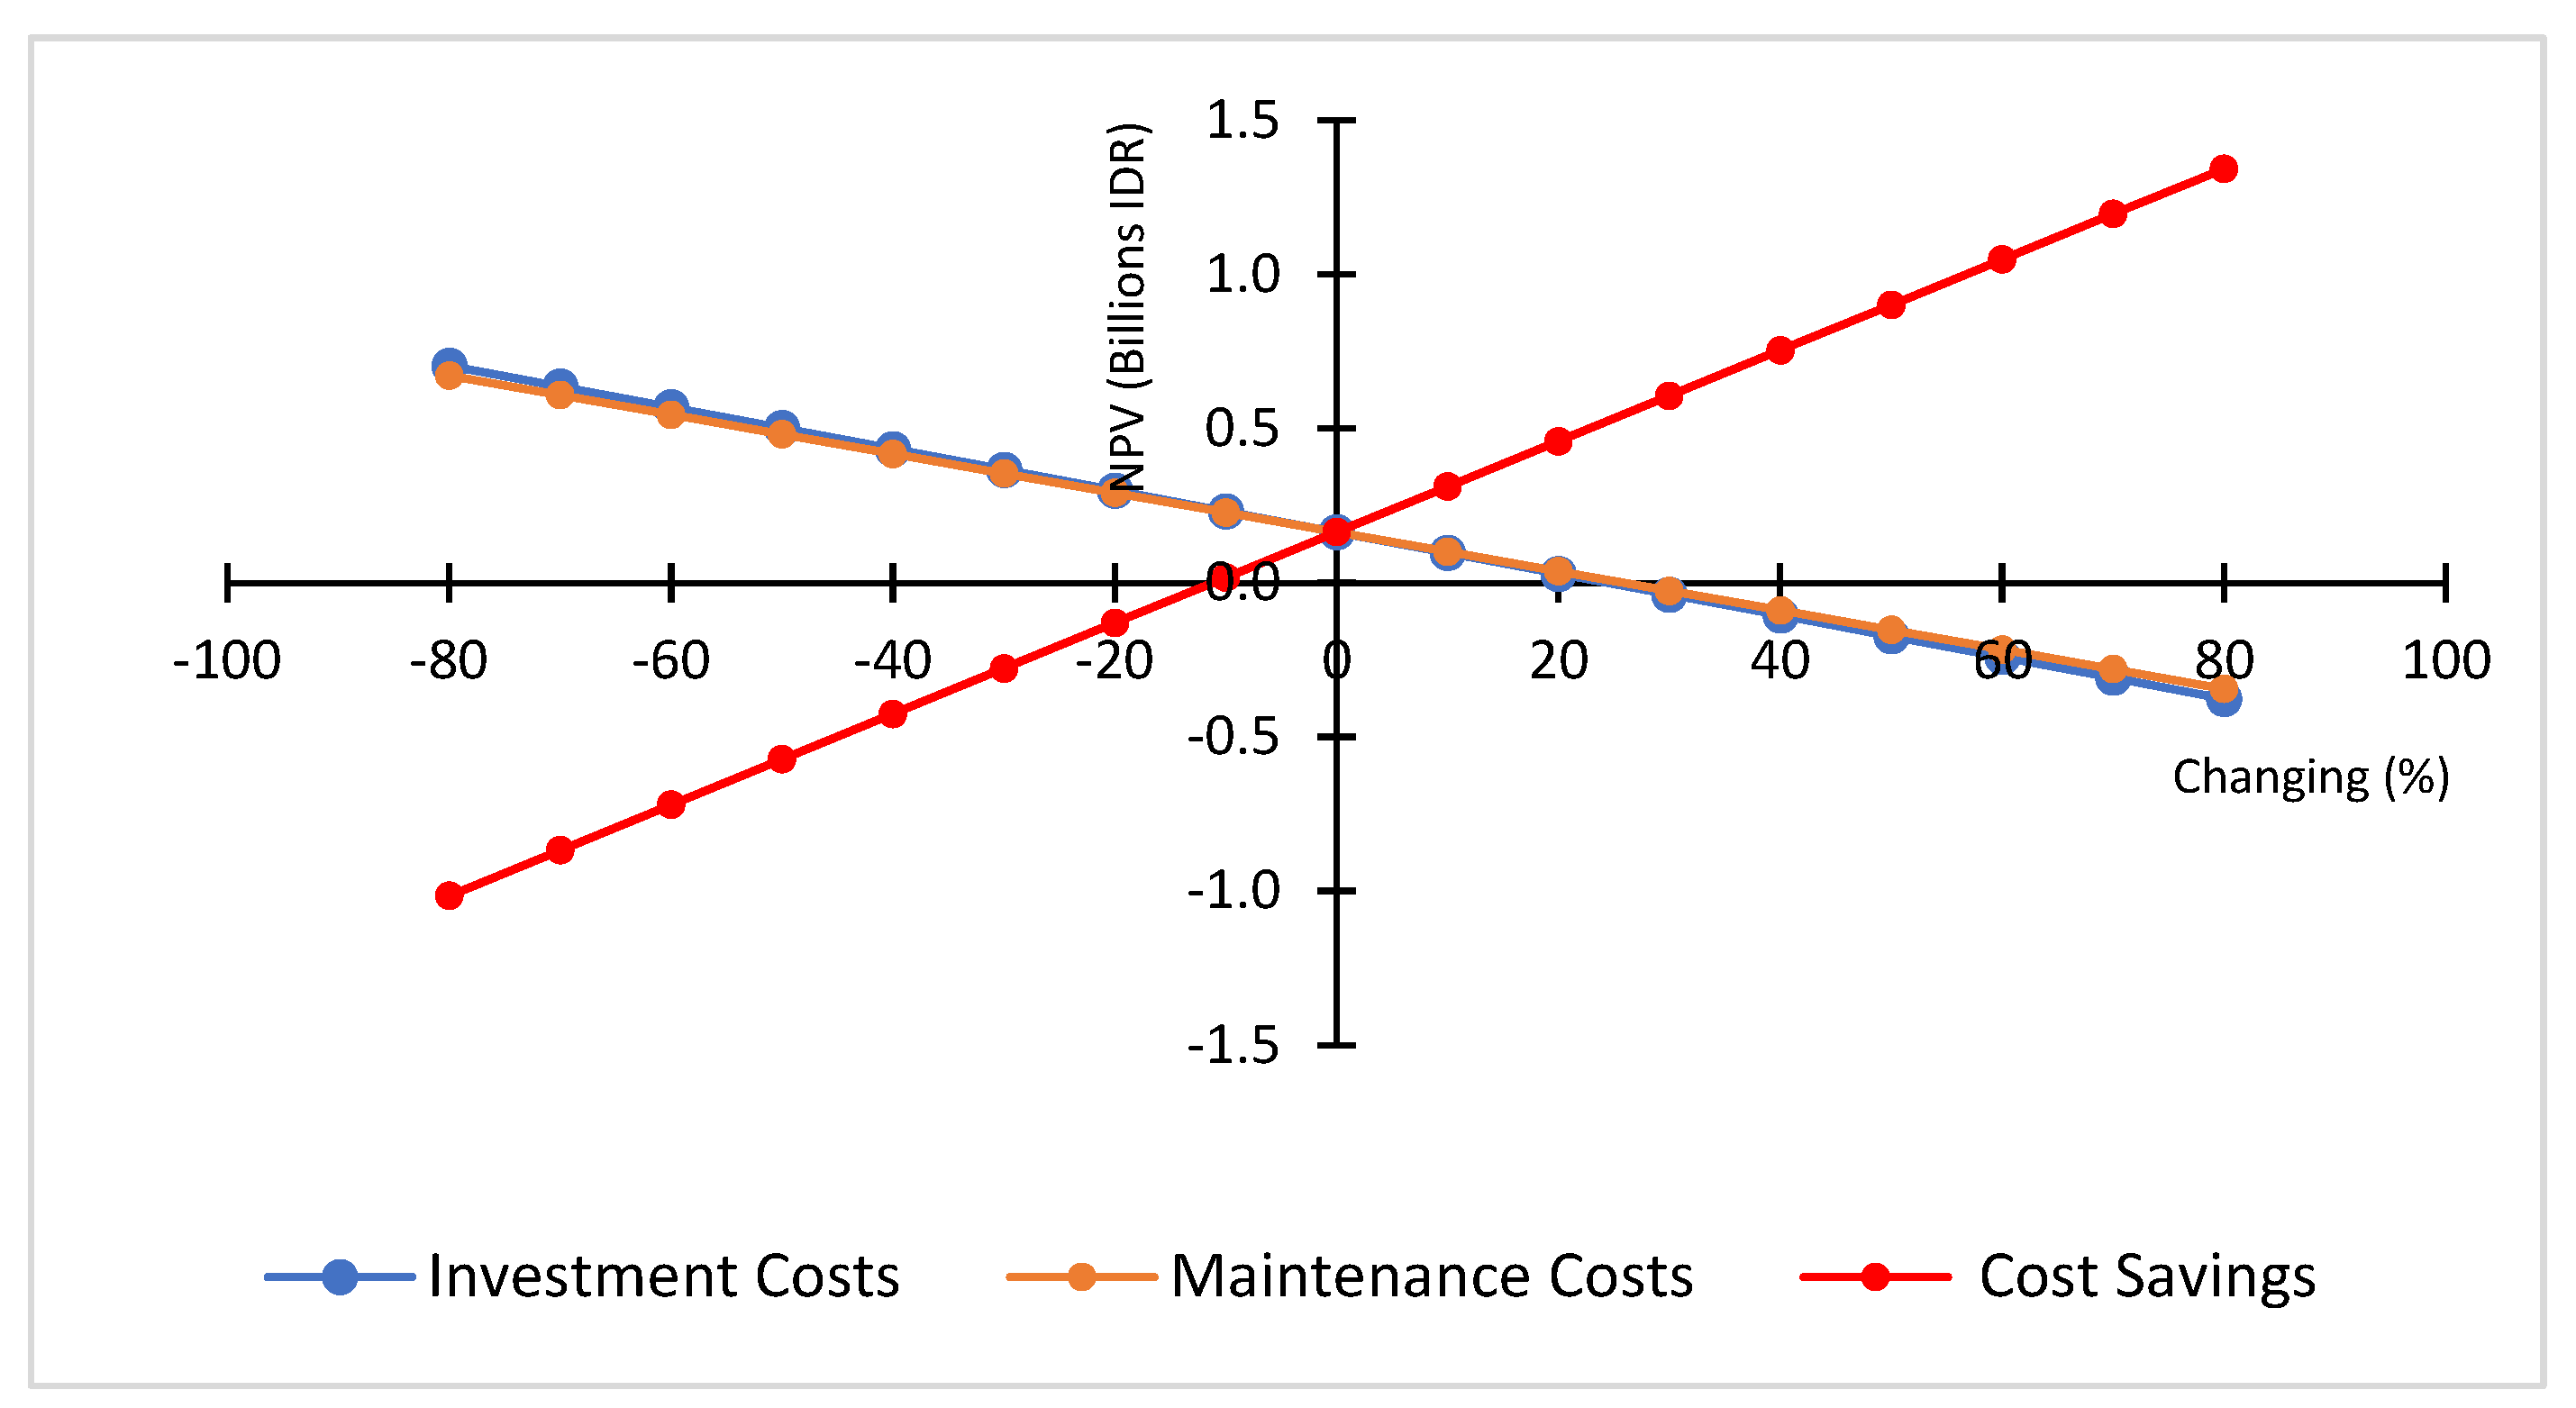
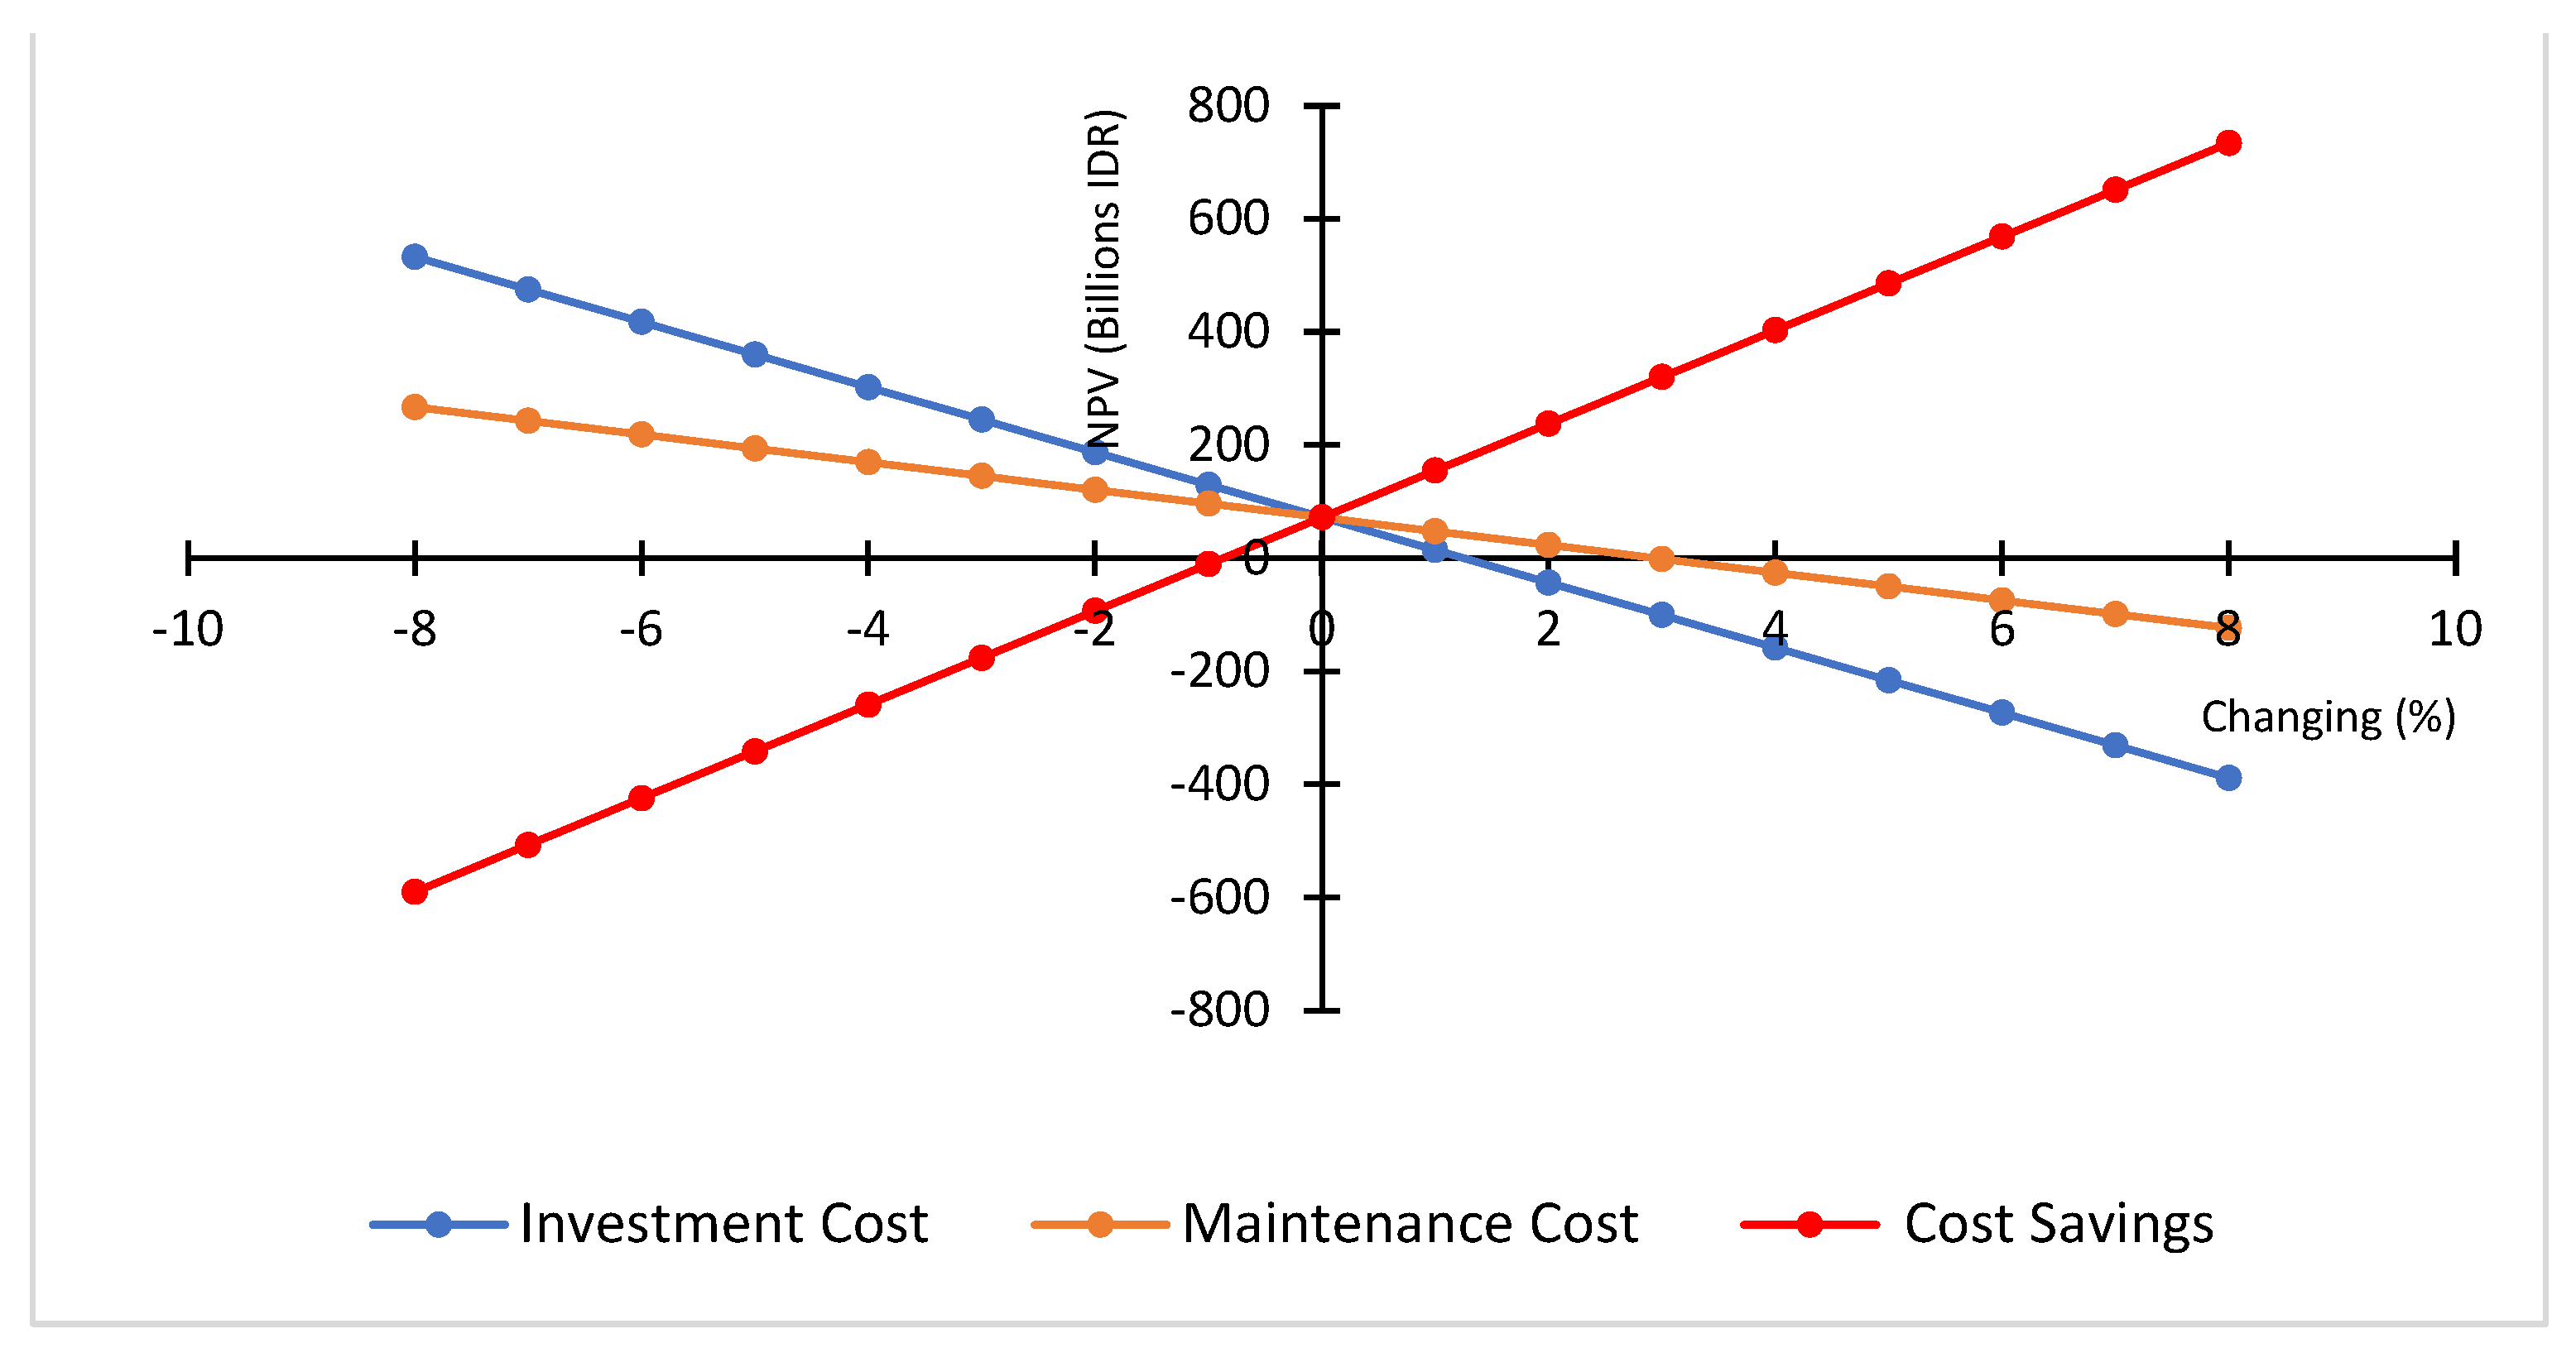
Plugging the data on Table 4 and Table 5 to Equation (3), the calculated NPV is IDR 183,580,999. Breakeven for the project is 11 years. This positive NPV indicates that replacing the cooling tower and CWP pump is feasible and good to go. The project’s breakeven is also attractive since it is nearly half of the project duration. Furthermore, since the NPV is positive, the SA is carried out to see the impact of declining revenue and/or raising cost to the NPV. To do so, the revenue is reduced and/or costs are increased within certain percentages. The SA results are displayed in Figure 5 and Figure 6.
Figure 5 shows that the NPV is still positive if the investment cost increases by 20%, i.e., the NPV value is IDR 29,348,753. The NPV is also still positive if the maintenance cost increases by 20%; the value is IDR 37,354,111. Comparing these two costs, the investment cost is slightly more sensitive than the maintenance cost to the NPV. This means the investment cost increment induces more impact to NPV than the maintenance cost increment. Figure 5 shows that the investment cost line (the blue line) is initially above the maintenance cost line (the orange line). But, as the costs’ increment increases, the blue line ends up under the orange line. In most cases, the investment cost is more sensitive to the NPV than the maintenance cost since the investment cost is generally much higher than maintenance cost. In this study, for cooling tower and CWP pumps, its maintenance cost is almost similar to the investment cost. As the result, this produces almost a similar impact to the NPV. On the other hand, cost saving (revenue) decrement has more impact on the NPV than costs increment. The figure shows that a 10% revenue decrement will drop the NPV to IDR 16,923,557. These findings inform the project owner to be more careful in managing income since it impacts the NPV more than the costs.
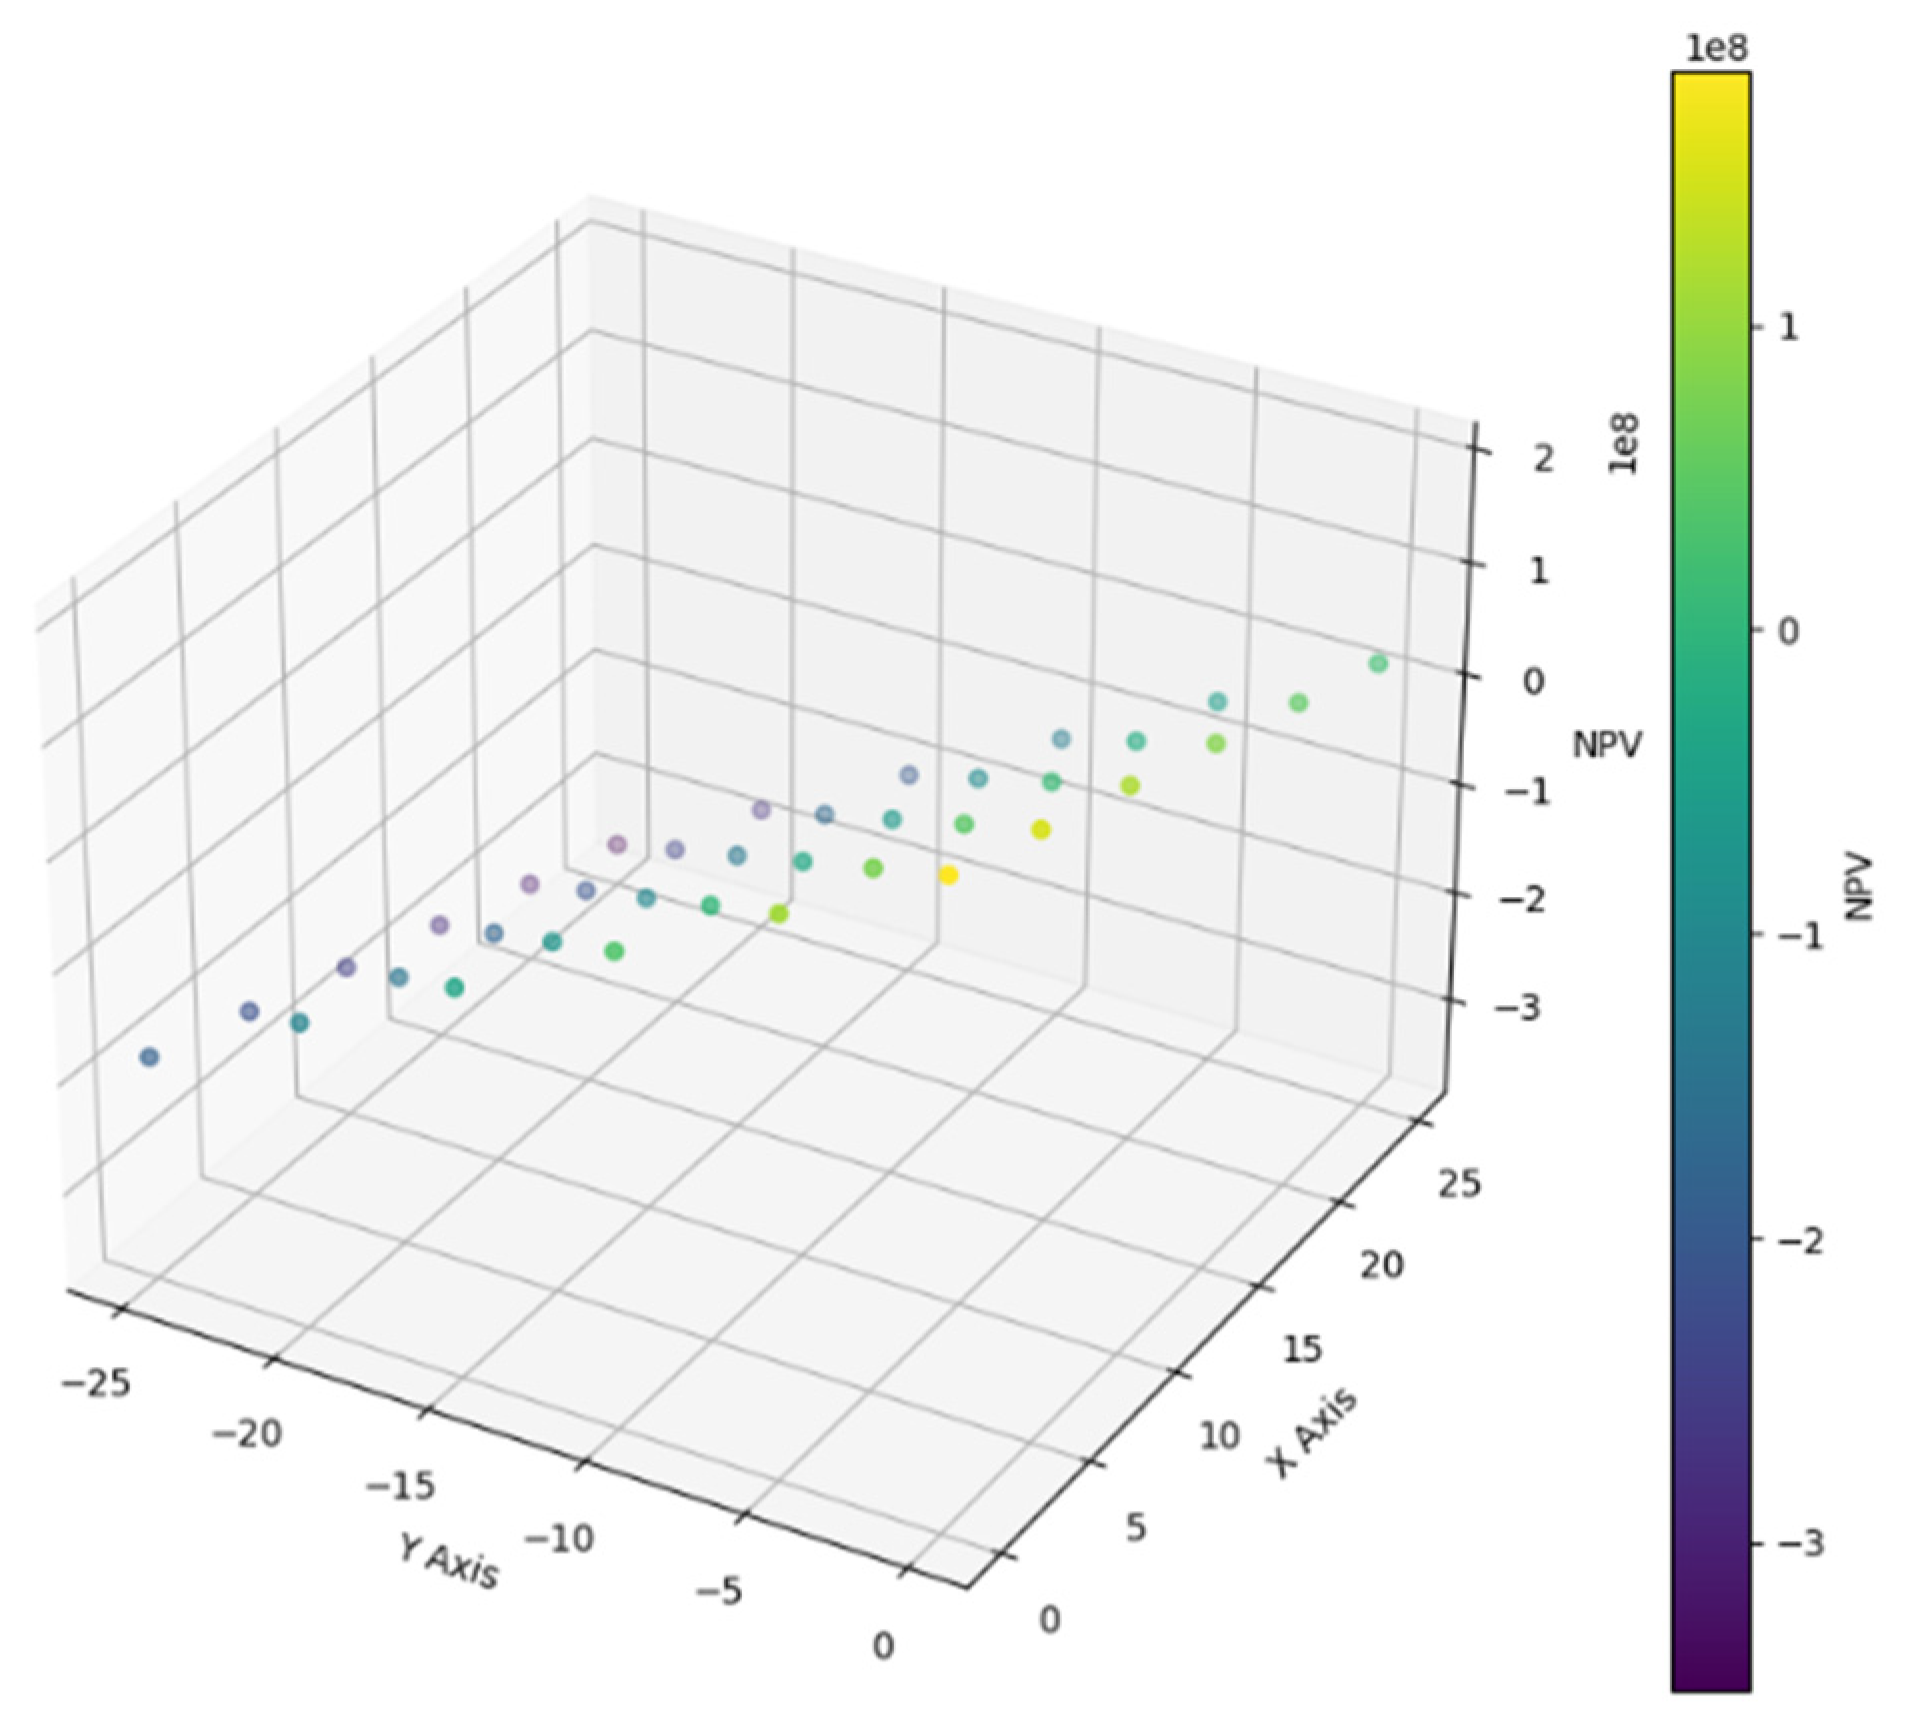
Next is two-dimensional SA. This SA deals with the NPV changing due to two variables changing simultaneously. In this matter, SA is carried out with the increment of investment cost (X) and decrement of revenue (Y) at the same time. Two-dimensional SA is shown on Figure 6.
Figure 6 shows that 5% revenue decrement and 15% investment cost increment will reduce the NPV to IDR 11,601,238.

4.2.2. AC Automation System BAS

The second energy saving alternative is installing a building automation system (BAS). When BAS is applied to the air conditioning sub-system, large equipment such as water-cooled package unit (WCPU), cooling tower, CWP pump can be adjusted to its working capacity according to the existing operational conditions. Table 7 and Table 8 show complete data on BAS before and after replacement.
Based on Table 7 and Table 8, power savings due to BAS installation is 3,748,160 kWh − 2,623,712 kWh = 1,124,448 kWh. Using Equation (1), this saving leads to IKE index as 12.80. The IKE category dropped to “quite efficient”. Implementing this scenario, using Equation (2), its carbon emissions’ reduction is 1,124.448 × 0.8 = 899.56 ton CO2 per year. Saving per year due to BAS installation is IDR 3,882,269,165 − IDR 2,717,588,415 = IDR 1,164,680,749 per year.
To evaluate project feasibility, the NPV is calculated using Equation (3) with data input shown in Table 9 and Table 10.
The NPV for the project is IDR 72,165,340 and its breakeven is 17 year. The positive NPV value indicates that the BAS installation project is feasible. The breakeven which is less than the project age also indicates that the project is profitable. Figure 7 shows SA results for the project.
Figure 7 shows that a 1% investment cost increment will reduce the NPV to 14,595,407. While for maintenance cost, a 2% increment will reduce the NPV to IDR 23,348,170. This analysis shows that the NPV is more sensitive toward the investment cost changing than the maintenance cost. This conclusion is also indicated by the slopes. The slope of investment cost line is steeper than the slope of maintenance cost line. SA for energy saving reduction (or revenue decrement) ends up with an NPV of IDR 72,165,340 for less than a 1% reduction. Two-dimensional SA for this project has not been performed since its one-dimensional SA already has a very tight value.

4.2.3. LED Dim Lighting

The third alternative energy-saving measure is replacing the current light, LED down light, with LED dim light. The building has a total of 4881 light-spots that spreading within its 18 floor. The light operates under two schemes: 17 h (05:00–21:00) and 24 h’ load. With Building’s electricity tariff is IDR 1035.78 per kWh, Table 11 and Table 12 summarize energy consumption and cost data before and after the LED dim light replacement, respectively.
The 20 W LED dim light has the same lumen as the LED downlight with a nominal of 2160 lm. Replacing the current LED down light with LED dim light, the light’s lumen should not be changed. But, using the dim light, the operational time of the light can be managed to four time blocks.
Using data in Table 11 and Table 12, electricity and cost savings due to LED dim light installation are 443,368 kWh − 247,006 kWh = 196,362 kWh and IDR 459,231,293 − IDR 255,844,123 = IDR 203,387,170 per year, respectively. Related IKE value is 15.62 with category “a bit wasteful,” and carbon reduction is 157,090 kg CO2 (or 157.09 ton CO2) per year.
To conduct economic feasibility of this light replacement, the NPV is calculated using Equation (3) with data input summarized in Table 13 and Table 14.
The NPV for the project is IDR 161,697,308. The value indicates that the project is feasible and good to go. Of 20 years project duration, the breakeven is achieved at year 17th. Figure 8 shows SA for the LED dim light project.
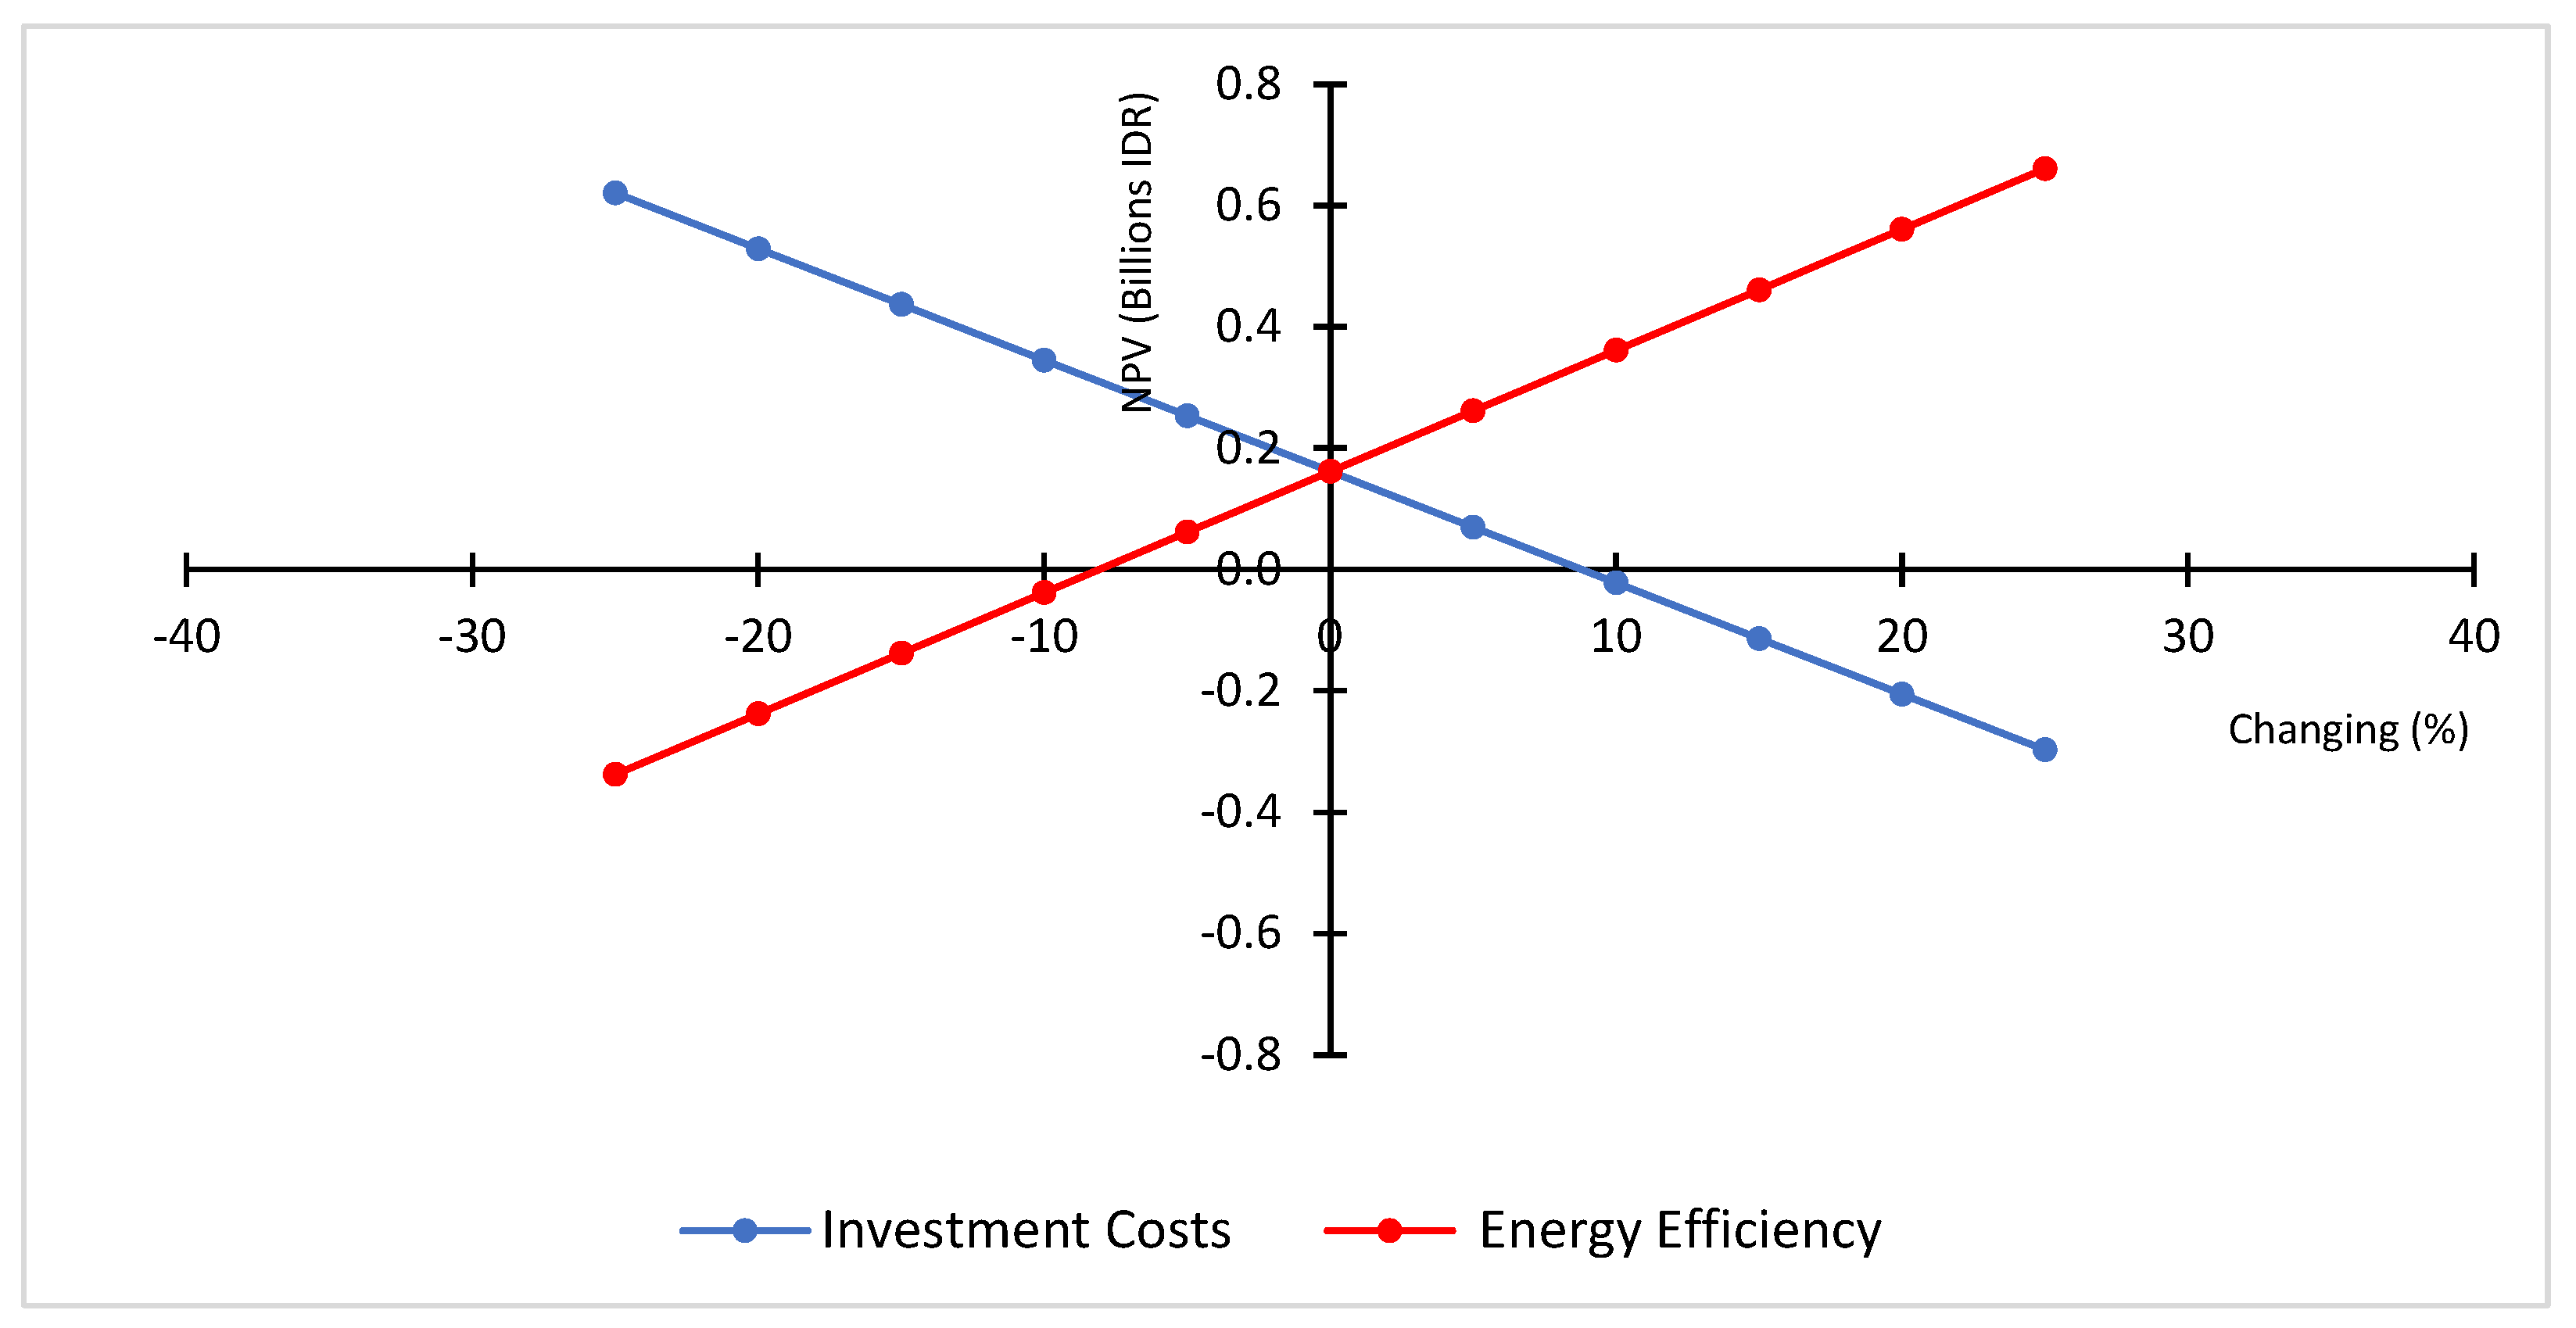
Figure 8 shows that if the investment cost increases by 5%, the project to install LED dim light is still feasible. It is indicated by positive NPV; i.e., IDR 69,937,913. At the same token, if the energy efficiency (revenue saving) decreases. A 5% revenue decrement will still give positive NPV, i.e., IDR 61,853,047.

4.2.4. Solar Panel Installation

The last effort to implement NZE building after minimizing energy consumption and installing more efficient (smart) equipment is self-generating the remaining energy needed. The effort will be made by installing solar panels at the office’s parking lot.
For the office building located at South Jakarta, it is estimated that installing 936 solar modules in the available parking space will generate 505,661.36 kWh per year with a saving value of IDR 524,876,496 per year. To ensure the solar panel installation applicability, it is necessary to review the Government Regulation regarding the issue. The regulations are shown in Table 15.
Examining Table 15, it can be concluded that there is no barrier of government regulations that preventing the Building from installing solar panels.
The IKE value after installing the solar panel is 14.68. The value indicates that the Building belongs to “somewhat wasteful” category. The emissions reduction due to this effort are 505.661 × 0.8 = 404.53 ton CO2 per year.
Next, the solar panel project feasibility is checked by calculating its NPV. Detailed project investment costs, operation and maintenance costs, as well as the project characteristics needed for the calculation are summarized in Table 16, Table 17 and Table 18, respectively.
Using data listed in Table 16, Table 17 and Table 18 as the input, the NPV, calculated using Equation (3) is -IDR 4,824,831,009; the NPV is negative. The value means that the solar farm installation is not feasible. One reason for this infeasible result is the relatively high price of PV modules in Indonesia [47,48] and the relatively low price of industrial electricity tariff.
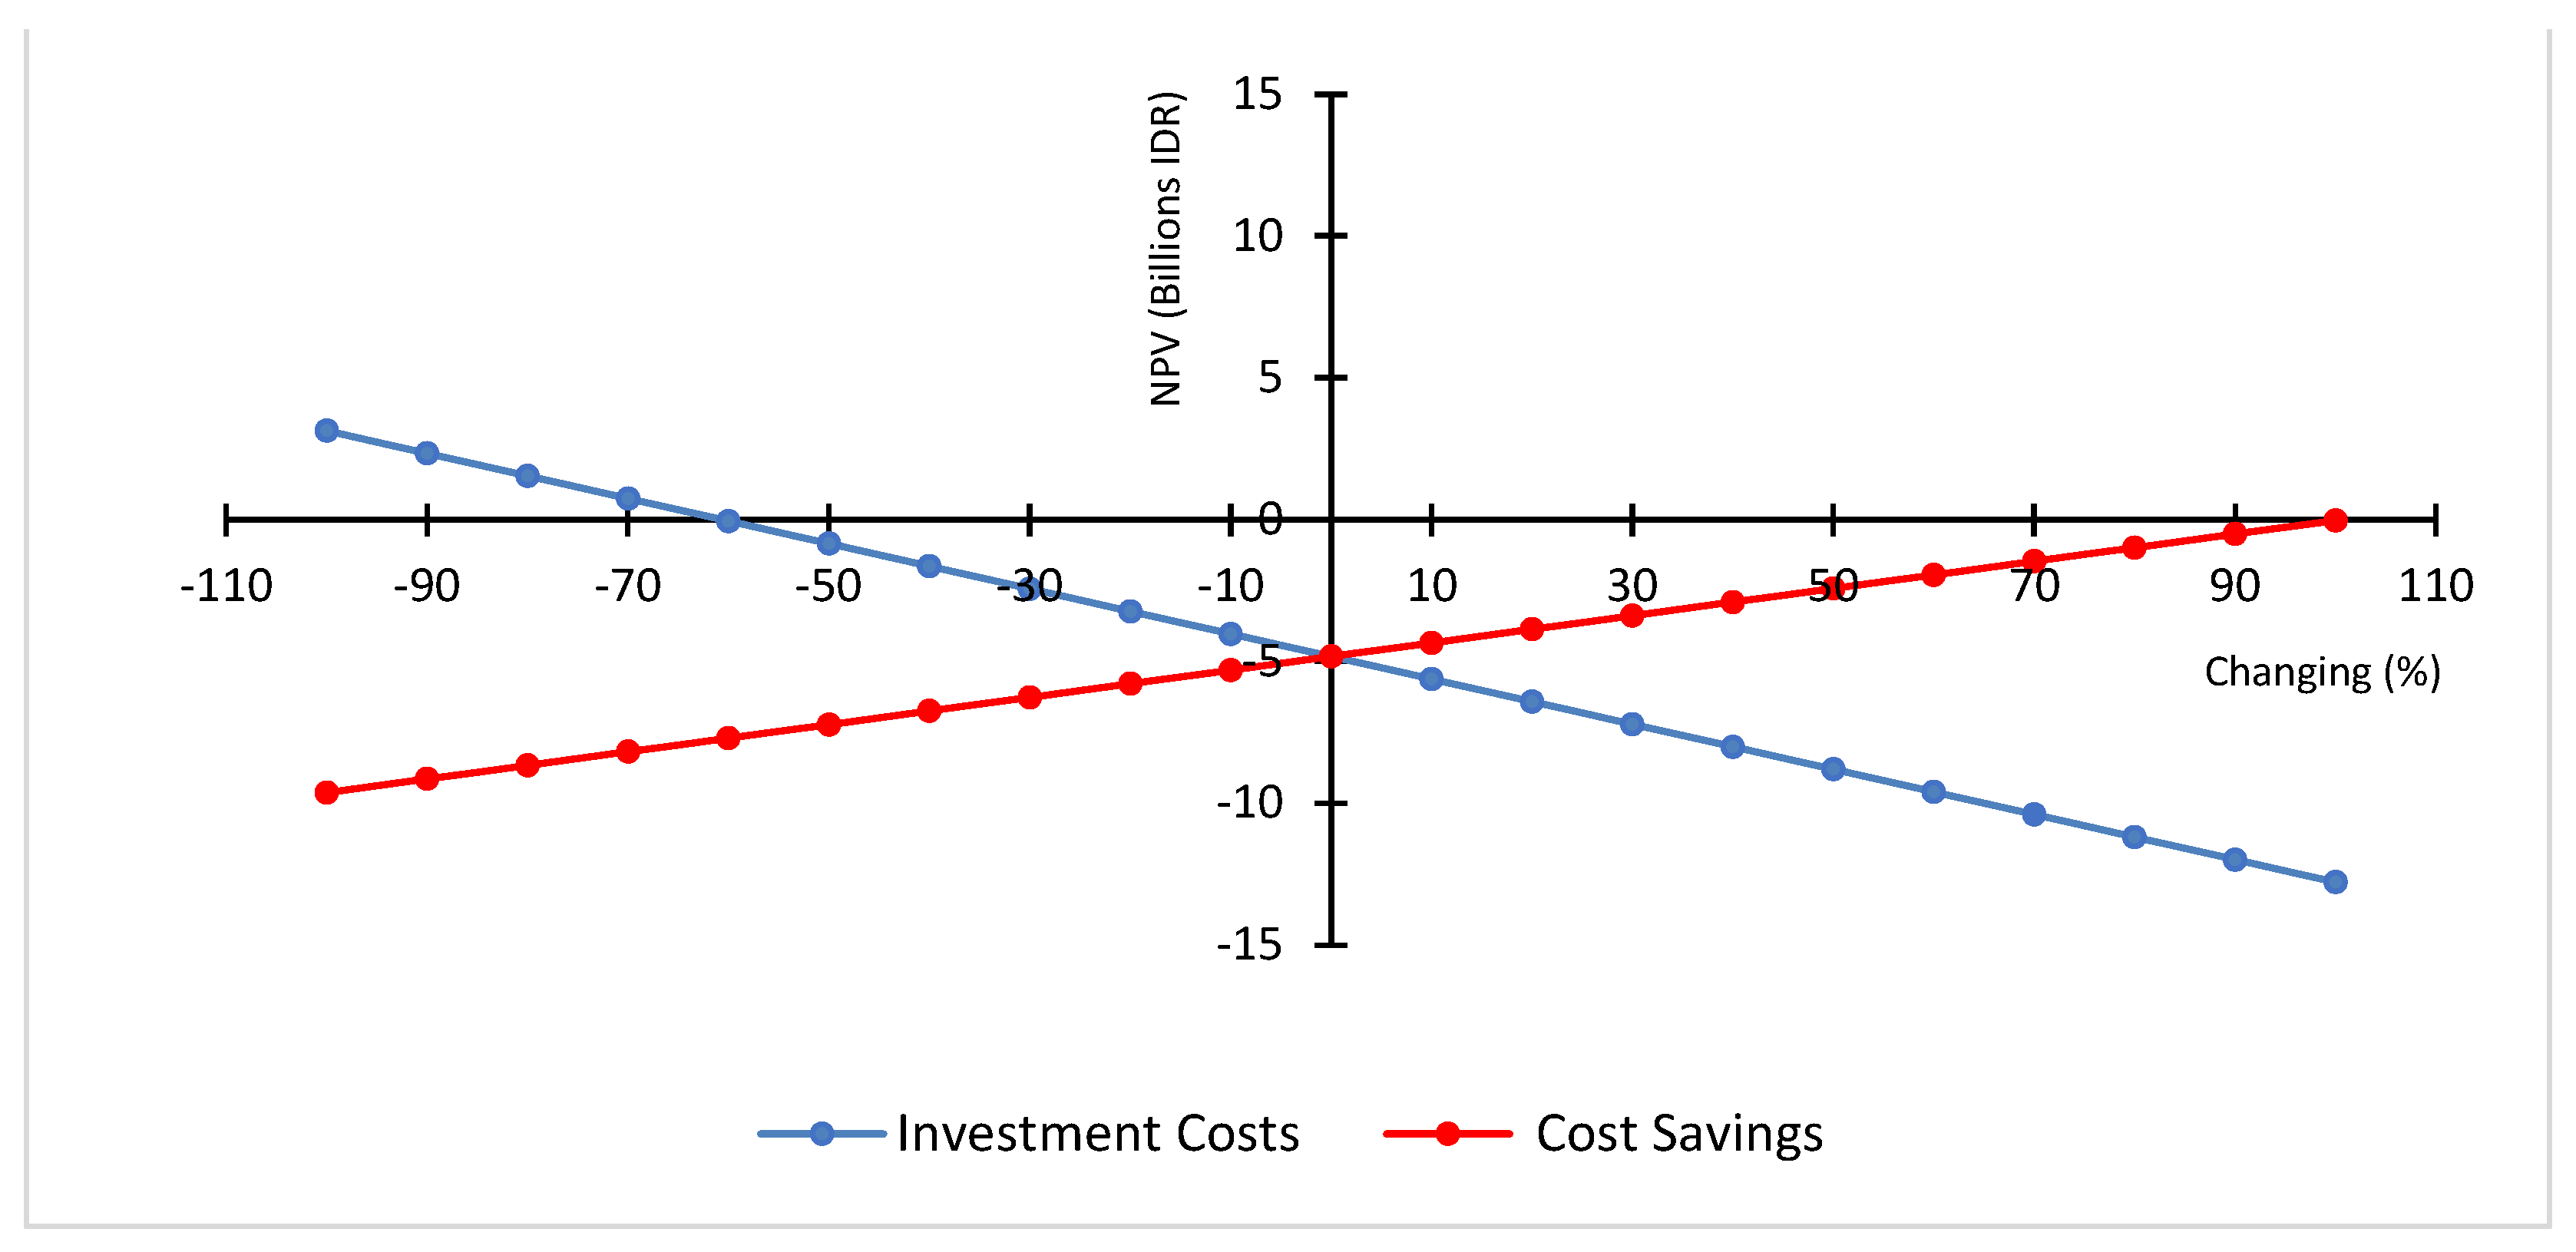
Since the NPV of the project is not feasible, SA is conducted to know how much the investment costs should go down to make the NPV positive and/or how much the saving should be received (meaning how much the electricity tariff is) to make the project possible. Figure 9 shows SA for the solar panel project.
Figure 9 shows that the investment cost should go down above 60% to make the NPV positive. If the investment cost reduces 70%, the NPV is IDR 745,899,191. It means that to make the PV panel installation attractive, the solar panel and its main components’ prices should go down sharply from the current prices listed on Table 16. Another possible way to make the NPV positive is to increase the electricity tariff from its current price. According to Figure 9, the tariff should go up by more than 100%. If the rate goes up by 110%, the NPV will be IDR 453,278,747.

4.2.5. Combination Scenario

A combination of the four project alternatives is displayed on Table 19. The table can provide a more comprehensive picture of not only the amount of money needed to fund the projects but also the projects status, and benefit on carbon footprint reduction and the Building’s electricity efficiency level. The table may help making better decisions.
Table 19 shows that if the target is getting the greatest energy savings and carbon emissions’ reduction, the best combination is utilizing the four projects A + B + C + D (combination number 14), i.e., replacing cooling tower and CWP pump, BAS installation, replacing the LED down light including solar panels’ installation. This scenario will reach IKE value of 10.22 (“efficient” building category) and reduce carbon emissions by 1577.18 ton CO2. However, this scenario is very expensive. It needs a big investment. This alternative is economically not attractive since its NPV is negative. The best combination project is combination of A + B + C projects (project combination number 11). This alternative gives the greatest NPV, i.e., IDR 437,853,822, while still making the Building belongs to “efficient” category and saving 1172.66 ton CO2 emissions. In the case of tight funding, installing the LED dim light (alternative number 3) might be the best choice. The alternative gives positive NPV, reduces a reasonable amount of carbon emissions, and improves the Building efficiency. Table 19 indicates that any projects with combination of PV installation will give negative NPV. This means any investment alternatives involving solar panels are not feasible for the Building [47,48].

5. Conclusions

Implementation of the nearly zero energy building through replacing cooling tower and CWP pump, installing building automation system BAS, installing the LED dim light, and installing solar panel has a positive impact on the Building’s energy consumption index (IKE). Combination all the four alternatives will save 1577.18 ton CO2 carbon emissions and improve the Building’s IKE to “efficient” category. However, comparing the four alternatives individually, installing BAS improves the highest building’s IKE.
When including the costs and profit of the projects to the analysis, solar panels’ installation consumes the most expensive investment cost and thus produces a negative NPV. Any investment combinations involving solar panel installation produce negative NPVs, so that the application of NZEB with solar panel installation is unfeasible in the office building. Combination of cooling tower & CWP pump replacement, BAS installation, and LED dim light replacement produces the best value, namely the NPV of IDR 437,853,822, IKE reduction of 11.76 to “efficient” category and reduction of carbon emissions of 1172.65 ton CO2.
Sensitivity analysis of the NPV shows that investment cost is more sensitive than maintenance cost for both the cooling tower and CWP pump and BAS installation projects. For the solar panel project, the investment cost, i.e., solar panel components and parts, should go down more than 60% to make the project attractive.
This study shows that NZEB is a feasible way to improve building efficiency and to reduce emissions. Future research can be done in several directions. To make the results of this study executable, future study can be focused on NZEB project management. The project should be planned appropriately to minimize disruption to the tenants’ daily routine activities, to avoid delay, and prolong the project. Good project management will administer project’s complexity and minimize disturbance. Disruption increases as the project is more complex [49] (Tokede et al., 2016). The more complex the project, the more the project management is needed. Building retrofit is not cheap especially if the project involves several packages including PV installation. Future research can also deal with strategy determination to reduce risk and to make sure financial fluidity of the project. For this purpose, multi criteria decision making methods such as Analytical Hierarchy Process (AHP) can be used. The method determines the success factors and their weight. These results are used as the input to determine the strategy. Another possible direction for future research is developing a model that can be used to estimate retrofit cost, IKE index, or emissions reduction for different types of buildings. The model can be developed using Multi-Linear Regression, Non Linear Regression, Artificial Neural Network, or else [50]. Several predictors can be used such as the number of floors, the number of lights installed, and the amount of energy generated.

Author Contributions

F.F.: Conceptualization, Methodology, Validation, Formal Analysis, Supervision, Writing—review & editing, Funding Acquisition. M.A.N.: Writing—review & editing. H.H.: Methodology, Formal Analysis, Investigation, Data Curation, Writing—original draft. All authors have read and agreed to the published version of the manuscript.

Funding

This work is partially supported by PUTI Q1 2020 Grant funded by DRP Universitas Indonesia under Contract No. NKB-1413/UN2.RST/HKP.05.00/2020.

Institutional Review Board Statement

This study did not require ethical approval.

Informed Consent Statement

Not applicable.

Data Availability Statement

Data is contained within the article.

Conflicts of Interest

The authors declare no conflict of interest.

References

  1. UNEP. United Nations Environment Programme. Towards Zero-Emission Efficient and Resilient Buildings, Global Status Report 2016, Prepared by Global Alliance for Buildings and Construction (GABC). 2016. Available online: https://goo.gl/oWUi3Y (accessed on 4 March 2024).
  2. Statista. Aggregated Ffloor Area of Buildings Worldwide from 2010 to 2022 with a Forecast for 2030. 2024. Available online: https://www.statista.com/statistics/1414826/global-buildings-floor-area/ (accessed on 4 March 2024).
  3. GABC. Global Alliance for Buildings and Construction, International Energy Agency and the United Nations Environment Program 2019: 2019 Global Status Report for Buildings and Construction: Towards a Zero-Emission, Efficient and Resilient Buildings and Construction Sector. 2019. Available online: https://globalabc.org/sites/default/files/2020-03/GSR2019.pdf (accessed on 4 March 2024).
  4. Goldstein, B.; Gounaridis, D.; Newell, J.P. The carbon footprint of household energy use in the United States. Proc. Natl. Acad. Sci. USA 2020, 117, 19122–19130. [Google Scholar] [CrossRef] [PubMed]
  5. IEA. Greenhouse Gas Emissions from Energy. International Energy Agency, Paris. 2021. Available online: https://www.iea.org/data-and-statistics/data-product/greenhouse-gas-emissions-from-energy (accessed on 12 November 2023).
  6. Ritchie, H.; Rosado, P. Energy Mix, OurWorldInData.org. 2024. Available online: https://ourworldindata.org/energy-mix (accessed on 4 March 2024).
  7. Ó’Riain, M.; Harrison, J. Cost-optimal passive versus active NZEB. How cost-optimal calculations for retrofit may change NZEB best practice in Ireland. Archit. Sci. Rev. 2016, 59, 358–369. [Google Scholar] [CrossRef]
  8. Sofia, E. Implikasi Paris Agreement melalui Program REDD+ berbasis blue carbon di Indonesia. J. Magister Huk. Udayana 2018, 8, 176. [Google Scholar] [CrossRef]
  9. Baden, S.; Fairey, P.; Waide, P.; Laustsen, J. Hurdling Financial Barriers to Low Energy Buildings: Experiences from the USA and Europe on Financial Incentives and Monetizing Building Energy Savings in Private Investment Decisions. 2006 ACEEE Summer Study on Energy Efficiency in Buildings. Washington, DC, USA. 2016. Available online: http://publications.energyresearch.ucf.edu/wp-content/uploads/2018/06/FSEC-PF-396-06.pdf (accessed on 4 March 2024).
  10. Harvey, L.D.D. Recent advances in sustainable buildings: Review of the energy and cost performance of the state-of-the-art best practices from around the world. Annu. Rev. Environ. Resour. 2013, 38, 281–309. [Google Scholar] [CrossRef]
  11. Bisegna, F.; Evangelisti, L.; Gori, P.; Guattari, C.; Mattoni, B. From efficient to sustainable and zero energy consumtion building. In Handbook of Energy Efficiency in Buildings: A Life Cycle Approach; Asdrubali, F., Desideri, U., Eds.; Butterworth-Heinemann: Amsterdam, The Netherlands, 2018. [Google Scholar]
  12. Waldek, S. Architecture: Is This Eco-Friendly “Smart Office” the Way of the Future? Architectural Digest. 2020. Available online: https://www.architecturaldigest.com/story/eco-friendly-smart-office-future (accessed on 12 November 2023).
  13. Gonzáles-Torres, M.; Pérez-Lombard, L.; Coronel, J.F.; Maestre, I.R.; Yan, D. A review on buildings energy information: Trends, end-uses, fuels and drivers. Energy Rep. 2022, 8, 626–637. [Google Scholar] [CrossRef]
  14. Peraturan Menteri Energi dan Sumber Daya Alam. Permen ESDM Nomor 13 Tahun 2012. 2012. Available online: https://peraturan.bpk.go.id/Details/142561/permen-esdm-no-13-tahun-2012 (accessed on 12 November 2023).
  15. DGE-MEMR. Direktorat Jenderal Ketenagalistrikan Kementrian Energy dan Sumber Daya Mineral Faktor Emisi GRK Sistem Ketenagalistrikan Tahun 2019. 2019. Available online: https://gatrik.esdm.go.id/assets/uploads/download_index/files/96d7c-nilai-fe-grk-sistem-ketenagalistrikan-tahun-2019.pdf (accessed on 12 November 2023).
  16. ACE. ASEAN Centre for Energy, ASEAN CO2 Emissions from Coal-Fired Power Plants: A Baseline Study. 2021. Available online: https://accept.aseanenergy.org/asean-co2-emissions-from-coal-fired-power-plants-a-baseline-study/ (accessed on 3 May 2024).
  17. Jones, T.W.; Smith, J.D. Historical perspective on the net present value and equivalent annual cost. Account. Hist. J. 1982, 9, 6. Available online: https://egrove.olemiss.edu/aah_journal/vol9/iss1/6 (accessed on 15 November 2023). [CrossRef]
  18. Graham, J.; Harvey, C. How do CFOs make capital budgeting and capital structure decisions? J. Appl. Corp. Financ. 2002, 15, 8–23. [Google Scholar] [CrossRef]
  19. Farizal, F.; Maulana, A. Risk based techno economic analysis of coiled tubing project of Indonesia offshore field. J. Ind. Eng. Manag. 2022, 7, 27–37. [Google Scholar] [CrossRef]
  20. Canada, J.R.; Sullivan, W.G.; White, J.A. Capital Investment Analysis for Engineering and Management, 2nd ed.; Prentice-Hall: Upper-Saddle River, NJ, USA, 1996. [Google Scholar]
  21. Databoks. Peringkat 12 Dunia, Jakarta Memiliki 149 Gedung Pencakar Langit. 2021. Available online: https://databoks.katadata.co.id/datapublish/2021/10/13/peringkat-12-dunia-jakarta-miliki-149-gedung-pencakar-langit (accessed on 10 June 2024).
  22. Setiawan, C.; Rangkuti, C.; Bhikuning, A. Analisa audit energi untuk optimalisasi pemakaian listrik air conditioning pada gedung perkantoran X di Jakarta. J. Penelit. Dan Karya Ilm. Lemb. Penelit. Univ. Trisakti 2024, 9, 66–81. [Google Scholar] [CrossRef]
  23. Riyadi, S.; Tambunan, J.M. Analisis Peningkatan Efisiensi Penggunaan Energi Listrik pada Sistem Pencahayaan dan Air Conditioning di Gedung Graha Mustika Ratu. Seminar Nasional Energi & Teknologi. 2018. Available online: https://www.google.com/url?sa=t&source=web&rct=j&opi=89978449&url=https://jurnal.unismabekasi.ac.id/index.php/sinergi/article/download/835/721&ved=2ahUKEwiS2e78j9iGAxU8xjgGHZYPBRQ4ChAWegQIFBAB&usg=AOvVaw1PecGuCiEeznmOWnEpZib_ (accessed on 10 June 2024).
  24. Ibanez-Lopez, A.S.; Martinez-Val, J.M.; Moratilla-Soria, B.Y. A dynamic simulation model for assessing the overall impact of incentive policies on power system reliability, costs and environment. Energy Policy 2017, 102, 170–188. [Google Scholar] [CrossRef]
  25. Latif, M.H.; Ahmed, T.; Khalid, W.; Anis, M.; Mahmood, T. Energy Audit, retrofitting and solarization in educational institutes of Pakistan: An effective approach towards energy conservation. In Proceedings of the 2019 International Conference on Engineering and Emerging Technologies (ICEET), Lahore, Pakistan, 21–22 February 2019. [Google Scholar] [CrossRef]
  26. Chakraborty, A.; Dey, D.; Das, P. Investigation of energy consumption and reservation scheme using energy auditing techniques. In Proceedings of the 2018 International Conference on Smart Systems and Inventive Technology (ICSSIT), Tirunelveli, India, 13–14 December 2018. [Google Scholar] [CrossRef]
  27. Barone, G.; Buonomano, A.; Giuzio, G.F.; Palombo, A. Towards zero energy infrastructure buildings: Optimal design of envelope and cooling design. Energy 2023, 279, 128039. [Google Scholar] [CrossRef]
  28. Mandi, R.P.; Hegde, R.K.; Sinha, S.N. Performance enhancement of cooling towers in thermal power plants through energy conservation. In Proceedings of the 2005 IEEE Russia Power Tech, St. Petersburg, Russia, 27–30 June 2005. [Google Scholar] [CrossRef]
  29. Vandenbogaerde, L.; Verbeke, S.; Audenaert, A. Optimizing building energy consumption in office buildings: A review of building automation and control systems and factors influencing energy savings. J. Build. Eng. 2023, 76, 107233. [Google Scholar] [CrossRef]
  30. Belany, P.; Hrabovsky, P.; Kolkova, Z. Combination of lighting retrofit and life cycle cost analysis for energy efficiency improvement in buildings. Energy Rep. 2021, 7, 2470–2483. [Google Scholar] [CrossRef]
  31. Wang, L.; Li, H.; Zou, X.; Shen, X. Lighting system design based on a sensor network for energy savings in large industrial buildings. Energy Build. 2015, 105, 226–235. [Google Scholar] [CrossRef]
  32. Ye, A.; Guan, B.; Liu, X.; Zhang, T. Using solar energy to achieve near-zero energy buildings in Tibetan Plateau. Renew. Energy 2023, 218, 119347. [Google Scholar] [CrossRef]
  33. Ahmed, A.; Ge, T.; Peng, J.; Yan, W.-C.; Tee, B.T.; You, S. Assessment of the renewable energy generation towards net-zero energy buildings: A review. Energy Build. 2022, 256, 111755. [Google Scholar] [CrossRef]
  34. Solargis. (n.d.). Global Solar Atlas. Available online: https://globalsolaratlas.info/global-pv-potential-study (accessed on 15 November 2023).
  35. BPS. Statistik komuter JABODETABEK Hasil Survey Komuter Jabodetabek 2019. 2019. Available online: https://webapi.bps.go.id/download.php?f=z9f8bUFoQTl0K+VHCSajCHNLc9dUMkvRJ3X2qPBLv2+X8rxcdVVLoImGHq3aBUB94i9VXqjUoLGxe9FXe+W0o8r2Le58NHhDqIjb6ciZjmgFfrPZRNW8Q6GniZoOabpx0DchYeNgWDLtT8Sdgr8ueeIJQN7ekjCAg/TPl+6Y3pmx1nSZ/ip4WZthevbpfCkrpPtBK7mUSqCguxKn3Q2LsAkP6xAcBRMz/kevq4noR99Pa76spPMkAv+mj+g7WaSBZH4vGpmkqbHq0LQZKHBeHg== (accessed on 15 November 2023).
  36. BPS. 2023. Available online: https://jakarta.bps.go.id/indicator/17/786/1/jumlah-kendaraan-bermotor-menurut-jenis-kendaraan-unit-di-provinsi-dki-jakarta.html (accessed on 10 June 2024).
  37. CREA. Work from Home (WFH) and Other Gimmicks Cannot Clear Jakarta’s Air. Report of Centre for Research on Energy and Clean Air. 2023. Available online: https://energyandcleanair.org/wp/wp-content/uploads/2023/08/CREA_Jakarta-AQ-WFH_08.2023_EN.pdf (accessed on 10 June 2024).
  38. Syafarina, I.; Latifah, A.L.; Wahyuni, I.N.; Ismanto, R.D.; Indrawati, A.; Rosyidi, M.; Iriana, W.; Kusumaningtyas, S.D.A.; Imami, A.D.; Yulihastin, E.; et al. Impact of air pollution on solar radiation in megacity Jakarta. In Proceedings of the 2022 IC3INA International Conference on Computer, Control, Informatics, and Its Applications, Virtual, 22–23 November 2022; pp. 158–162. [Google Scholar] [CrossRef]
  39. Song, Z.; Liu, J.; Yang, H. Air pollution and soiliing implications for solar photovoltaic power generation: A comprehensive review. Appl. Energy 2021, 298, 117247. [Google Scholar] [CrossRef]
  40. Golroodbari, S.Z.; van Sark, W. Simulation of performance differences between offshore and land-based photovoltaic systems. Prog. Photovolt. Res. Appl. 2020, 28, 873–886. [Google Scholar] [CrossRef]
  41. Lee, J.-H.; Kim, D.-G.; Jeong, S.-K.; Song, Y. Analysis of heat source system degradation due to aging and evaluation of its effect on energy consumption. Energies 2022, 15, 9217. [Google Scholar] [CrossRef]
  42. Eleftheriadis, G.; Hamdy, M. The impact of insulation and HVAC degradation on overall building energy performance: A case study. Buildings 2018, 8, 23. [Google Scholar] [CrossRef]
  43. Taki, A.; Zakharanka, A. The impact of degradation on a building’s energy performance in hot-humid climates. Sustainability 2023, 15, 1145. [Google Scholar] [CrossRef]
  44. Peraturan Menteri Energi dan Sumber Daya Alam. Permen ESDM Nomor 49 Tahun 2018. 2018. Available online: https://peraturan.bpk.go.id/Details/142300/permen-esdm-no-49-tahun-2018 (accessed on 10 June 2024).
  45. Peraturan Menteri Energi dan Sumber Daya Alam. Permen ESDM Nomor 26 Tahun 2021. 2021. Available online: https://jdih.maritim.go.id/id/permen-esdm-no-26-tahun-2021 (accessed on 10 June 2024).
  46. Rahman, T.; Mansur, A.; Hossain Lipu, M.; Rahman, M.; Ashique, R.; Houran, M.; Elavasaran, R.; Hossain, E. Investigation of degradation of solar photovoltaics: A review of aging factors, impacts, and future directions toward sustainable energy management. Energies 2023, 16, 3706. [Google Scholar] [CrossRef]
  47. Farizal; Hana, P. Economic Analysis of Middle Class Residential with Solar Cell: Case Study of Cyber Orchid Town Houses in Depok. In Proceedings of the 13th International Conference on QIR (Quality in Research), Yogyakarta, Indonesia, 25–28 June 2013; Paper D3. Jogjakarta. Available online: https://repository.widyatama.ac.id/xmlui/bitstream/handle/123456789/3580/Table%20of%20Contents.pdf?sequence=5&isAllowed=y (accessed on 20 March 2024).
  48. Farizal; Angelina, J. Designing the Installation of Solar Panel Plant in Sunda Strait Bridge Mega Project. In Proceedings of the 5th International Conference on Engineering Technologies and Applied Sciences, ICETAS 2018, Bangkok, Thailand, 22–23 November 2018. Available online: https://ieeexplore.ieee.org/stamp/stamp.jsp?tp=&arnumber=8629195 (accessed on 20 March 2023).
  49. Tokede, O.O.; Naren, G.; Wamuziri, S.C. Evaluating the Cost of Disruption in Office Retrofit Building Projects. In Proceedings of the 10th ICEC Conference 2016 Cost Engineering, Quantity Surveying & Project Management World Congress, Rio de Janeiro, Brazil, 9–12 October 2016; Available online: https://www.researchgate.net/publication/315688667 (accessed on 10 November 2023).
  50. Jaf, D.K.I.; Abdulrahman, P.I.; Mohammed, A.S.; Kurda, R.; Qaidi, S.M.A.; Asteris, P.G. Machine learning techniques and multi-scale models to evaluate the impact of silicon dioxide (SiO2) and calcium oxide (CaO) in fly ash on the compressive strength of green concrete. Constr. Build. Mater. 2023, 400, 132604. [Google Scholar] [CrossRef]
Figure 1. Diagram of flow and scope of the research.
Sustainability 16 07027 g001
Figure 2. Building’s power consumption and energy cost of 2022.
Sustainability 16 07027 g002
Figure 3. Building electricity consumption according to its utilization.
Sustainability 16 07027 g003
Figure 4. Parking lot for installing the solar panel (left) and aerial view of the panel (right).
Sustainability 16 07027 g004
Figure 5. NPV sensitivity analysis of cooling tower & CWP pump replacement.
Sustainability 16 07027 g005
Figure 6. Two-dimensional NPV sensitivity analysis of cooling tower & CWP pump replacement.
Sustainability 16 07027 g006
Figure 7. NPV sensitivity analysis of BAS installation.
Sustainability 16 07027 g007
Figure 8. Sensitivity analysis of LED down light replacement.
Sustainability 16 07027 g008
Figure 9. NPV sensitivity analysis of solar panel installations.
Sustainability 16 07027 g009
Table 1. Energy consumption intensity (IKE) index for building [14].
CategoryIKE Index (kWh/m2/Month)
With ACWithout AC
Very efficient4.17–7.920.84–1.67
Efficient7.92–12.081.67–2.5
Quite efficient12.08–14.58-
A bit wasteful14.58–19.17-
Wasteful19.17–23.752.5–3.34
Very wasteful23.75–37.753.34–4.17
Table 2. Profile of the Building under study.
No.Criteria (Unit)Quantity
1Building age (year)26
2Building area (m2)27,338
3Building height (m)62.9
4Number of floors18
5Power capacity (kVA)2500
6Electricity tariff (IDR/kWh)1035.78
Table 3. Cooling tower and CWP pump electricity consumption and cost before replacement.
No.ItemVolumePower (kW)Energy Consumption (kWh/Year)Cost (IDR/Year)
1Cooling tower255457,600473,972,928
2CWP pump337461,760478,281,773
Total919,360952,254,701
Table 4. Cooling tower and CWP pump electricity consumption and cost after replacement.
No.ItemVolumePower (kW)Energy Consumption (kWh/Year)Cost (IDR/Year)
1Cooling tower245374,400387,796,032
2CWP pump248399,360413,649,101
Total773,760801,445,133
Table 5. Investment cost of replacing cooling tower and CWP pump.
No.ItemUnit Price (Millions IDR)VolumeTotal
(Millions IDR)
1Brand new cooling tower165 2330
3Brand new motor CWP56 2112
4Project manager27 127
5Supervisor18.2 118.2
7Labor12.3 673.8
8Installation cost35 135
9Work safety equipment18.4 118.4
10Clearing18 118
11Trash disposal6.75 16.75
Grand total639.15
Table 6. Recapitulation of investment components.
No.Component (Unit)Value
1Investment cost (IDR)639,150,000
2Maintenance cost (IDR/year)44,200,000
3Cost saving (IDR/year)150,809,568
4Project duration (year)20
5Discount rate (%/year)8
6Performance deterioration (%/year) *1
7Maintenance costs increment rate (%/year)5
* based on [41,42].
Table 7. Central AC energy consumption before BAS installation.
No.EquipmentVolumePower (kW)Energy Consumption (kWh/Year)Cost
(IDR/Year)
1Cooling tower255457,600473,972,928
2WCPU34202,828,8002,930,014,464
3CWP337461,760478,281,773
Total3,748,1603,882,269,165
Table 8. Central AC energy consumption after BAS installation.
No.EquipmentVolumePower (kW)Daily Utilization (%)Energy Consumption (kWh/Year)Cost (IDR/Year)
05:00–07:0007:00–16:0016:00–21:00
1Cooling tower255309050320,320331,781,050
2Water cooled package unit34203090501,980,1602,051,010,125
3CWP pump337309050323,232334,797,241
Total2,623,7122,717,588,415
Table 9. Investment cost of BAS installation for AC system.
NoItem (Unit)Unit Price (IDR)VolumeTotal Price (IDR)
1BAS server (Ls)309,480,000 1309,480,000
2Client PC (Ls)27,400,000 127,400,000
3Direct digital control (unit)15,262,504 34518,925,136
4Modul DI (unit)6,980,000 2181,521,640,000
5Modul DO (unit)5,384,615 150807,692,250
6Modul AI (unit)5,230,461 145758,416,845
7Modul AO (unit)4,715,384 111523,407,624
8Air flow sensor (unit)1,384,615 3447,076,910
9Water pressure sensor (unit)5,721,846 34194,542,764
10Water level switch (unit)7,500,000 34255,000,000
11Duct temperature (unit)3,250,000 1755,250,000
12Room temperature sensor (unit)2,288,715 1738,908,155
13Cable ITC 2 × 2 × 0.6 (m)32,000 5000160,000,000
14Cable 18 AWG 1 pair (m)21,000 350073,500,000
15Cable Utp cat 6 (m)16,000 150024,000,000
16BAS software license (Ls)130,000,000 1130,000,000
17Control panel (Ls)75,000,000 175,000,000
Grand Total5,520,239,684
Table 10. Recapitulation of BAS air system installation investment components.
No.Component (Unit)Value
1Investment cost (IDR)5,520,239,684
2Maintenance cost (IDR/year)170,000,000
3Cost saving (IDR/year)1,164,680,749
4Project age (year)20
5Discount rate (%/year)8
6Performance deterioration (%/year) *5
7Increased maintenance cost (%/year)5
* Based on [43].
Table 11. Energy consumption before LED down light replacement.
No.Operational HoursPower (kW)VolumeUsage (Hour)Energy Consumption
(kWh/Year)
Cost (IDR/Year)
100:00–24:000.02129824161,990167,786,417
204:00–21:000.02318317281,377291,444,876
Grand Total443,368459,231,293
Table 12. Energy consumption after LED down light replacement.
No.Operational HourPower (kW)VolumeUsage (Hour)Energy Consumption (kWh/Year)Cost (IDR/Year)
105:00–07:000.021298267506,991,101
207:00–16:000.0248818182,745189,283,243
316:00–20:000.024881450,76252,578,679
420:00–05:000.0212981067506,991,101
Grand Total247,006255,844,123
Table 13. Investment cost of LED dim light.
No.ItemUnit Price (IDR)VolumeTotal Cost (IDR)
1Light sensor150,000 17025,500,000
2Keypad sensor scheme250,000 1704,250,000
3Power light sensor installation1,800,000 170306,000,000
4Control light sensor installation50,000 4881244,050,000
5LED dimmable 20 Watt180,000 4881878,580,000
Grand Total1,458,380,000
Table 14. Recapitulation of investment components for replacing LED down light.
No.Investment Component (Unit)Value
1Investment cost (IDR)1,458,380,000
210th Year investment cost (IDR)878,580,000
3Cost saving (IDR/year)203,387,169
4LED dim light life (year)10
5Sensor age (year)20
6Discount rate (%/year)8
Table 15. Regulation of the Minister of Energy and Mineral Resources on rooftop solar plant.
No.ProvisionsRegulation of the Minister of Energy and Mineral Resources Regarding Rooftop Solar Power PlantObject Condition
No. 49 of 2018 [44]No. 26 of 2021 [45]
1The provisions to export the generated electricity to the greet (kilowatt-hours)0.651The Building’s annual energy demand is approximately 500 MWh, while the estimated output generated by solar panels is 50 MWh. Therefore, there is no surplus electricity available to export
2Availability of export-import kWh meterNo later than 15 days after receiving SLO from PLN Adjusted
3Accumulated surplus/deficit bill difference eliminatedUp to 3 monthsUp to 6 monthsNo surplus output
4Timeframe for rooftop solar power plant applicationNo later than 15 days5 days without adjustment of the Power Purchase Agreement (PPA) and 12 days with the PPA agreementAdjusted
5Consumer provisionsFor PLN customers onlyFor both PLN customers and customers in non-PLN Business Areas (IUPTLU).Entitled because they are PLN B3 customers
Table 16. Solar panel installation investment costs.
No.Part (Unit)Unit Price (IDR)VolumeTotal Price (IDR)
1PV cable—inverter 6 mm (meter)22,000 6000132,000,000
2Inverter cable—AC combiner (set)320,000 10,0003,200,000,000
3AC combiner cable—LVCB tie in (meter)87,000 6000522,000,000
4Ground system 1 (bundle)10,000,000 15150,000,000
5Monitoring system cable (meter)5500 10005,500,000
6Cable accessories (pcs)12,500 1001,250,000
7DC tray cable & accessories (pcs) 650,000 300195,000,000
8AC tray cable & accessories (pcs) 1,250,000 300375,000,000
9Controller (unit)20,000,000 360,000,000
10Installation & testing costs 1st (kWp)100,000383.7638,376,000
11SLO cost (lot)20,500,000 120,500,000
12Installation kit (kWp)100,000 383.7638,376,000
13Installation & testing costs 2nd (kWp) 900,000 383.76345,384,000
14Monocrystalline solar panel 410 kWp (unit)1,800,000 9361,684,800,000
16Lightweight steel canopy construction cost (m2)300,000 2310693,000,000
17Grounding system 2 (bundle) 10,000,000 12120,000,000
18String inverter (unit)15,000,000 19285,000,000
19AC combiner panel 150 kW (set)7,000,000 321,000,000
20AC combiner panel 75 kW (set)5,000,000 15,000,000
21Tie-in panel 150 kW (unit)15,000,000 345,000,000
22Tie-in panel 75 kW (unit)21,000,000 121,000,000
Grand Total7,958,186,000
Table 17. Solar panel installation maintenance costs.
No.Item (Unit)Unit Price (IDR/Year)VolumeTotal Price (IDR/Year)
1Manpower (person)9,000,00012108,000,000
2Spare part & maintenance (package)7,958,18617,958,186
Grand Total115,958,186
Table 18. Summary of investment components of solar panel installation.
No.Investment Component (Unit)Value
1Investment cost (IDR)7,958,186,000
2Project age (year)20
3Maintenance cost (IDR/year)115,958,186
4Cost savings (IDR/year)523,753,928
5Discount rate (%/year)8
6Performance deterioration (%/year) *1
7Maintenance cost increment rate (%/year)5
* Based on [46].
Table 19. Combination results of alternative investment scenarios.
No.Project CombinationIKECategoryEmission Reduction (ton CO2)Investment Cost (IDR)NPV (IDR)Project Status
1A15.78A bit wasteful116.0655,347,754183,580,999Feasible
2B12.80Quite efficient899.565,520,239,68472,165,340Feasible
3C15.62A bit wasteful157.091,458,380,000161,697,308Feasible
4D14.68A bit wasteful404.537,958,186,0004,824,831,009Infeasible
5A + B12.36Quite efficient1015.566,175,587,438176,312,254Feasible
6A + C15.18A bit wasteful273.092,133,030,000353,186,547Feasible
7A + D14.24Quite efficient520.538,613,533,7545,812,462,263Infeasible
8B + C12.20Quite efficient1056.656,978,619,684346,208,844Feasible
9B + D11.26Efficient1304.0913,478,425,6844,442,725,422Infeasible
10C + D14.09A bit wasteful561.629,416,566,0004,563,289,440Infeasible
11A + B + C11.76Efficient1172.657,633,967,438437,853,822Feasible
12A + B + D10.81Efficient1420.0914,133,773,4384,648,518,755Infeasible
13B + C + D10.66Efficient1461.1814,936,805,6844,478,622,165Infeasible
14A + B + C + D10.22Efficient1577.1815,592,153,4384,386,977,187Infeasible
Legend: A: replacing cooling tower and CWP pump, B: Installing BAS, C: Installing the LED dim light, D: Installing solar panels.
Disclaimer/Publisher’s Note: The statements, opinions and data contained in all publications are solely those of the individual author(s) and contributor(s) and not of MDPI and/or the editor(s). MDPI and/or the editor(s) disclaim responsibility for any injury to people or property resulting from any ideas, methods, instructions or products referred to in the content.