Abstract
Against the backdrop of the green transformation of the national economy, this paper takes Jiangsu Province as a case study to explore spatiotemporal characteristics of cultivated land utilization green transformation (CLUGT) and its impact on agricultural economic growth (AEG). In this study, a composite index method and a panel regression model are employed, and the findings of this study indicate that: (1) From 2001 to 2021, the CLUGT index exhibited a modest upward trend, registering an average annual growth rate of 7.12%. (2) The CLUGT displayed significant spatial heterogeneity in the study area. High and medium-high-level areas demonstrated significant clustering, primarily concentrated in the central and northern regions of Jiangsu, while low and medium-low-level areas were primarily located in the southern part of the province. (3) The CLUGT exerted a positive impact on AEG. Specifically, for each one-unit increase in the CLUGT index, the AEG index rose by 0.575. Further analysis indicated that for every one unit of increase in the functional and mode transformation dimensions of CLUGT, the AEG index increased by 0.391 and 0.368, respectively, whereas a one-unit increase in the spatial transformation dimension of CLUGT was associated with a 0.169 decrease in the AEG index. Based on these findings, the study advocates for policies that champion the functional and pattern transformation of CLUGT and prioritize the spatial governance of cultivated land to enhance the contribution of CLUGT to AEG.
1. Introduction
Cultivated land, as a fundamental pillar of agricultural systems, is essential for ensuring national food security and driving progress in agriculture and rural development [1]. However, increasing population, disordered consumption, and unsustainable land management practices have given rise to a myriad of issues, including the degradation of cultivated land systems, soil contamination, and ecological damage [2]. Accordingly, these challenges hinder the responsible and sustainable utilization of cultivated land resources [3,4]. In light of ongoing efforts to cultivate ecological civilization and a green paradigm shift in agriculture and rural areas, the academic community is increasingly interested in strategies for achieving green cultivated land resource utilization. Meanwhile, agricultural economic growth is also gaining significant attention. Therefore, cultivated land utilization green transformation (CLUGT), as a critical component of agricultural green transformation, represents a critical measure and safeguard for sustainable cultivated land use, agricultural economic growth, and environmental protection [5]. In contrast to conventional cultivated land use transformations, CLUGT prioritizes environmental protection and the advancement of sustainable agricultural development. This approach enhances cultivated land productivity and emphasizes maintaining a healthy and resilient cultivated land system. In addition, it encourages the dissemination of sustainable cultivated land utilization practices, such as natural and organic agriculture. By cultivating the intensive use of cultivated land, technological innovation, and shifting towards green production patterns, CLUGT can facilitate spatial and functional transformations in cultivated land utilization.
Currently, the studies primarily focus on the concepts, connotations, indicator system design, measurement methodologies, and driving mechanisms of CLUGT, establishing a foundation for more comprehensive analyses [6,7,8]. Moreover, as the research discourse becomes more comprehensive and pluralistic, scholars’ focus has shifted to the relationship between CLUGT and socio-economic advancement [9]. The relevant research mainly concentrates on cultivated land utilization, urban-rural development, the evolution of cultivated land utilization, and agricultural economic growth [7,10,11,12]. A review of the existing literature indicates limited exploration into the effect of CLUGT on AEG. In addition, from a geographical standpoint, existing studies mainly concentrate on the entire nation and major grain-producing regions in China, including but not limited to Henan, Hubei, Shandong, and other grain-producing provinces, as well as the northeastern black soil region [13,14,15,16].
Jiangsu Province, situated as an economically advanced region in eastern coastal China, maintains its status as a critical grain-producing area nationally despite its limited cultivated land area. In 2021, the region had a grain yield of 37.461 million tons and an agricultural economic gross output value reaching CNY 1.05 trillion, securing its position among the nation’s leaders [17]. In contrast to other grain-producing provinces, Jiangsu faces challenges where a large population possesses relatively limited cultivated land. This constraint and a high degree of industrialization and urbanization present a unique set of issues and challenges for cultivated land utilization. These include shifts in rural land resource utilization methods and peasant employment patterns, land quality degradation due to over-exploitation of cultivated land, and agricultural contamination resulting from the intensive use of pesticides, fertilizers, and other chemicals [18,19]. Therefore, assessing CLUGT in Jiangsu Province and its implications for AEG carries significant practical implications. This understanding is crucial for informing the utilization, protection, and sustainable development of cultivated land and agriculture in economically developed regions.
Overall, this study attempts to introduce the concept of green development in the framework of cultivated land utilization transformation (CLUGT), and the objectives of this study are stated as follows: Firstly, this study seeks to establish a measurement indicator system for CLUGT and analyze its temporal and spatial characteristics. Secondly, this study aims to construct a reasoned and comprehensive mechanism between CLUGT and AEG; hence, we employ a panel regression model to quantitatively analyze the impact of CLUGT on AEG. Lastly, this study strives to offer decision-making insights for the synergistic optimization of CLUGT and AEG in this rapidly developing and changing socio-economic backdrop.
2. Theoretical Framework
The transformation of cultivated land utilization represents a significant research area in the broader field of land utilization transformation. It primarily comprises the numerical structure, spatial form, and functional utilization of cultivated land [20,21,22]. Green transformation is an economic growth and social development paradigm that prioritizes harmony, environmental protection, and sustainability [23,24]. This concept consists of two aspects: firstly, “Green” signifies a shift away from agricultural production practices characterized by high input, high consumption, and high pollution towards prioritization of resource conservation and environmental protection. Secondly, “Transformation” emphasizes the changes in cultivated land’s spatial structure, function, and utilization patterns [4,5].
In contrast to traditional forms of cultivated land utilization transformation, CLUGT places a greater emphasis on “Green Development”. This involves enhancing the efficiency of cultivated land utilization and promoting its intensive and efficient use through technological advancement while upholding the principles of resource conservation and environmental friendliness [11,25]. Therefore, this paper defines the concept and connotation of CLUGT as follows: driven by advancements in natural geographical conditions and socio-economic factors, CLUGT refers to the process of transformation in the spatial form, functional utilization, and production models in a regional cultivated land utilization system. According to this definition, CLUGT involves three interconnected subsystems of cultivated land utilization, pertaining to space, function, and mode. Spatial transformation represents the most readily observable aspect, while both functional transformation and mode transformation reflect the requirements of cultivated land utilization.
This paper analyzes the impact of CLUGT on AEG from three perspectives: spatial transformation, functional transformation, and mode transformation (Figure 1). The spatial transformation in cultivated land utilization is primarily evident in the numerical representation of cultivated land resources and shifts in cultivated land landscape patterns [26]. Numerically, increasing the amount of cultivated land can, to some degree, strengthen regional AEG. In terms of landscape patterns, this transformation manifests as fragmented and agglomerative changes in cultivated land [14]. It is appropriate to reduce cultivated land fragmentation through policy-driven and technical interventions, thereby facilitating the spatial transformation of cultivated land. This allows for the concentrated distribution and large-scale utilization of cultivated land resources, finally enhancing cultivated land production efficiency and boosting AEG [10,27,28].
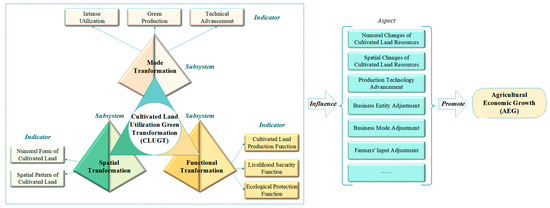
Figure 1.
The Impact Mechanism of CLUGT on AEG.
The impact of functional transformation in cultivated land utilization on AEG is primarily observed in three aspects of cultivated land functions: production, livelihood security, and ecological conservation [29,30]. Cultivated land’s production function is directly reflected in grain production capacity, which benefits local AEG. Employing agglomerative and mechanized production methods, utilizing cutting-edge technology to enhance soil quality, cultivating new crop varieties, and implementing similar methods can improve cultivated land utilization efficiency and grain yield, thereby promoting AEG [20]. The livelihood security function primarily focuses on the capacity of cultivated land to ensure food security, farmer employment, and farmer incomes. By adjusting the business entities, modes, and scope of cultivated land, local farmer employment can be stimulated, social stability maintained, and residents’ incomes increased. The ecological conservation function encompasses the carrying capacity of cultivated land in relation to the ecological environment. Through responsible land utilization and effective protection measures, the productivity of cultivated land and its ecological carrying capacity can be effectively preserved. These measures include enhancing production methods, increasing soil organic matter content, implementing crop rotation and fallowing, and reducing using fertilizers, pesticides, and other chemicals. Consequently, improving and maintaining the ecological conservation function of cultivated land is crucial for the sustainable utilization of relevant resources and can, to a certain extent, simultaneously promote the sustainable growth of the agricultural economy.
As a key aspect of CLUGT, the mode transformation of cultivated land includes intensive land use, green production, and technical advancement [31,32]. Intensive land use is a hallmark of modern agriculture. Firstly, a more concentrated distribution of cultivated land can be achieved by implementing fragmentation control measures, such as cultivated land transfer, ownership adjustments, and land resource integration. Accordingly, this offers the foundation for large-scale, intensive management practices. Secondly, the continuous optimization of agricultural industry structure and increases in production inputs can shift cultivated land utilization from traditional, low-yield models to a more sustainable and intensive approach. This shift is instrumental in enhancing land-use productivity and driving the growth of regional agricultural economies [33,34].
Green production in cultivated land primarily focuses on optimizing the application of inputs such as fertilizers, pesticides, mulch films, and other production materials while minimizing pollutant emissions. The transition to green production models further upholds the ecological conservation function of cultivated land, which is crucial for both the health and sustainable utilization of this valuable resource. Technical advancements in cultivated land production are evident in areas such as modern agricultural machinery, irrigation infrastructure, and the expertise of agricultural science and technology professionals. These advancements effectively address the needs of irrigation, drainage, and scientific cultivation, ultimately contributing to increased productivity and the advancement of the AEG.
3. Methodology
3.1. Study Area and Data Source
Jiangsu Province, situated in the Yangtze River Delta on the eastern coast of mainland China, comprises 107,200 square kilometers (Figure 2). It is home to 13 prefecture-level cities and has one of China’s most rapidly expanding economies, as evidenced by its GDP per capita and associated livelihood index. Data from the Third National Land Resource Survey indicates that Jiangsu has 68.75 million mu of cultivated land, primarily concentrated in its central, northern, and coastal regions, whereas cultivated land resources are relatively scarce in the southern part of the province, particularly in economically thriving areas such as Nanjing and Suzhou. Moreover, the province’s rapid urbanization has led to a decline in cultivated land due to the expanding footprint of urban construction, significantly altering the patterns and methods of cultivated land use. Agriculture is an essential pillar in Jiangsu’s sustainable development strategy, and cultivated land represents a crucial factor in agricultural production. Therefore, achieving CLUGT is key for advancing agricultural progress and cultivating high-quality development in Jiangsu Province.
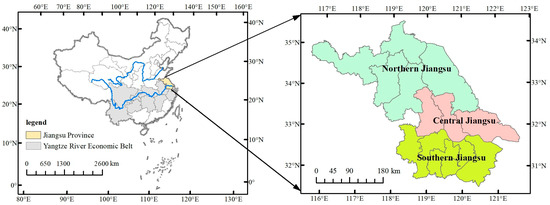
Figure 2.
The location of the study area.
This paper aims to appraise the spatiotemporal characteristics of CLUGT across three scales: provincial, regional, and municipal. At the regional level, Jiangsu Province is broadly categorized into three regions: Southern Jiangsu, Central Jiangsu, and Northern Jiangsu. Southern Jiangsu, situated on the southern bank of the Yangtze River, comprises five cities: Nanjing, Suzhou, Zhenjiang, Changzhou, and Wuxi. Central Jiangsu, nestled between the Yangtze River and the Huaihe River, consists of three cities: Taizhou, Yangzhou, and Nantong. Northern Jiangsu, located north of the Huaihe River, comprises five cities: Suqian, Lianyungang, Huaian, Yancheng, and Xuzhou. Considering the availability of relevant data, this study employs panel data between 2001 and 2022 for these 13 cities, primarily sourced from the Statistical Yearbook of Jiangsu (2002–2022) and statistical documents of the respective prefecture-level cities. To address missing data points, an interpolation method can be utilized, capitalizing on the strong correlation and minimal fluctuations observed between different indicators. Finally, this foundational data will be compiled and structured in Excel 2019, forming a comprehensive dataset for measuring CLUGT and its implications for AEG in Jiangsu Province from 2001 to 2021.
3.2. Design of Indicator System for CLUGT
Combining existing research [13,20,30] and the connotation analysis of CLUGT, this paper establishes an indicator system of CLUGT, including three target levels: spatial transformation, functional transformation, and mode transformation (Table 1).

Table 1.
Evaluation indicator system for CLUGT.
The spatial transformation of cultivated land utilization involves two primary characteristics: the numerical form of cultivated land resources and changes in the spatial pattern of cultivated land. The attribute of the numerical form denotes the fluctuations in the quantity and area of cultivated land, represented by per capita cultivated land area and land reclamation rate. The attribute of the spatial pattern is conveyed by the landscape fragmentation of cultivated land, illustrating the degree of disruption to the cultivated land landscape attributed to human activities. The functional transformation of cultivated land utilization is associated with production function, livelihood function, and ecological function. The production function is directly observed in the food production capacity of cultivated land, depicted by the grain yield per unit area and replanting index. The livelihood function is primarily demonstrated in the capacity of cultivated land to ensure food security, employment levels, and technological progress. It is measured by the following indicators: per capita guaranteed quantity of food, the proportion of agricultural employees, and per capita total mechanical power.
The ecological function centers on the carrying capacity of cultivated land for the ecological environment, embodied by the ratio of cultivated land to ecological land. The transformation of cultivated land utilization is demonstrated through intensive utilization, green production, and the level of technical advancement. Intensive utilization is defined by the ratio of facility agriculture area, green production is defined by the ratio of effectively irrigated area, and technical advancement is the crucial mechanism to advance modernized agricultural production, defined by the number of agricultural technicians per capita. Among these, the descriptive statistics of CLUGT in Jiangsu Province are presented in Table 2. It should be pointed out that the coefficients of variation given were calculated as an indicator of descriptive statistics, i.e., the ratio of standard deviation to the average value.
Table 2.
Descriptive Statistics of Evaluating Indicators for CLUGT.
3.3. Comprehensive Index Method
In this paper, the comprehensive index method is adopted to measure CLUGT with the following formula:
In the above formula, the represents the green transformation index of cultivated land utilization, and denotes the standardized value of the -th indicator and indicates the weight value of the -th indicator.
The entropy value method is chosen in this study to determine the weight value of indicators [35]. The entropy weight method calculates the entropy value of each index based on its numerical changes and subsequently determines the weight. This approach can eliminate the deviation in results caused by subjective human assignment, thereby improving the accuracy and objectivity of the evaluation results. The specific calculation process is demonstrated below:
(1) The raw data are processed by the range normalization method with the following formula:
where represents measuring indicators, denotes each evaluation unit, indicates the raw data value of each indicator, depicts the maximum value of , and refers to the minimum value of .
(2) Calculate the entropy value, the formula is:
where represents the information entropy of each indicator , where if = 0, then = 0.
(3) Calculate the coefficient of variation (information entropy redundancy) with the formula:
where represents the coefficient of variation of each indicator .
(4) Calculate the weight with the formula:
3.4. Panel Regression Model
This study constructs a panel regression model to evaluate the effect of CLUGT on AEG. As a combination of time series and cross-sectional regression models, panel regression integrates the characteristics and advantages of both. It can more clearly illustrate the spatial-temporal pattern of CLUGT and its impacts on AEG, which aligns with the objectives of this study.
The general form of the model, drawing upon the work [36,37], is presented below:
where represents the AEG index, which is dependent variable; indicates the index of CLUGT, depicts the coefficient to be estimated, and refers to the random disturbance term.
To enhance understanding of the effects of three levels of cultivated land utilization transformation—spatial, functional, and mode—on AEG in Jiangsu Province, as well as in Southern Jiangsu, Central Jiangsu, and Northern Jiangsu, the corresponding regression models are constructed as follows:
where , and represent the functional transformation index, the spatial transformation index and the mode transformation index of cultivated land utilization, respectively; , , , and represent assessment coefficients, denotes the regional number ( = 1, 2, …, 13), indicates the year (t = 2001, 2002, …, 2021), and depicts the random disturbance term.
Panel regression models are typically reflected in three forms: mixed estimation model (POOL), fixed effects model (FE), and random effects model (RE). This study employs the F-test to determine the suitability of the POOL model over the FE model. The Breusch–Pagan test is utilized to evaluate the appropriateness of the RE model in comparison to the POOL model, while the Hausman test guides the selection between the RE and FE models. The results obtained from these different forms of the panel model will be compared. If the F-test for each model proves significant, the significance of the assessment coefficients will be considered to determine the most suitable panel model.
Moreover, this paper adopts the GDP growth rate of the primary sector as a proxy for the AEG index. To accurately express the AEG corresponding to the growth of the cultivated land planting industry, a correction factor (the ratio of the sown area of grain to the sown area of crops) is applied.
4. Results and Analysis
4.1. Measurement Results of CLUGT
Utilizing the established index system and model for quantifying CLUGT, this paper presents the calculated values of CLUGT for Jiangsu Province from 2001 to 2021, as illustrated in Table 3. Throughout the analysis period, the CLUGT index for the entire province exhibited fluctuations ranging from 0.2145 to 0.5975 while generally trending upwards. Specifically, the average index values for Suqian (0.5039), Lianyungang (0.5032), Huaian (0.5030), Yancheng (0.4607), and Xuzhou (0.4325) are comparatively higher, positioning them at the forefront of the province. These cities are primarily situated in the northern region of Jiangsu. In contrast, the average index values for Wuxi (0.2632), Suzhou (0.2670), Nanjing (0.3415), Nantong (0.3652), and Changzhou (0.3759) are lower, placing them in a less advantageous position. These cities are mainly concentrated in the southern region of Jiangsu. From a temporal perspective, the CLUGT indexes for Nanjing, Suzhou, Wuxi, Changzhou, and Zhenjiang demonstrate a fluctuating yet declining trend. In contrast, the CLUGT indexes for Yangzhou, Taizhou, Nantong, Xuzhou, Lianyungang, Suqian, Huaian, and Yancheng exhibit an increasing trend. This suggests that the overall level of CLUGT in Northern Jiangsu has experienced a significant increase from 2001 to 2021, indicating that the green transformation in these regions is progressing steadily and continuously improving. However, the overall level of CLUGT in Central Jiangsu displays a decreasing trend with no significant change. A plausible explanation for this discrepancy is that rapid economic advancement in Central Jiangsu has driven the continuous expansion of urban areas and the consequent reduction of cultivated land and crop sowing areas. This has not only resulted in a decline in per capita cultivated land area and land reclamation ratios but has also contributed to a decrease in grain yield per unit area, replanting index, and the proportion of cultivated land dedicated to ecological purposes. Cumulatively, these factors have contributed to the lower CLUGT levels observed in this region.
Table 3.
Measurement Results of CLUGT Index in Jiangsu Province, 2001–2021.
In contrast, Northern Jiangsu has experienced relatively slower economic development, resulting in less encroachment upon cultivated land resources during industrialization and urbanization. This region is characterized by its vast expanse, abundant cultivated land resources, higher per capita cultivated land area, and higher land reclamation ratios. Therefore, Northern Jiangsu exhibits high levels of production, livelihood sustainability, and ecological functionality, contributing to its leading position in CLUGT. Central Jiangsu, with its moderate levels of economic development, industrialization, and urbanization, falls between Northern Jiangsu and Southern Jiangsu in terms of these metrics, and its CLUGT level reflects this intermediate position.
4.2. Spatio-Temporal Pattern of CLUGT
To further illustrate the characteristics of the temporal evolution of CLUGT in Jiangsu, Figure 3 presents index evolution trend charts. These charts depict the spatial transformation, functional transformation, mode transformation, and green transformation of cultivated land utilization in Southern Jiangsu, Central Jiangsu, Northern Jiangsu, and the entire province, based on the calculation results.
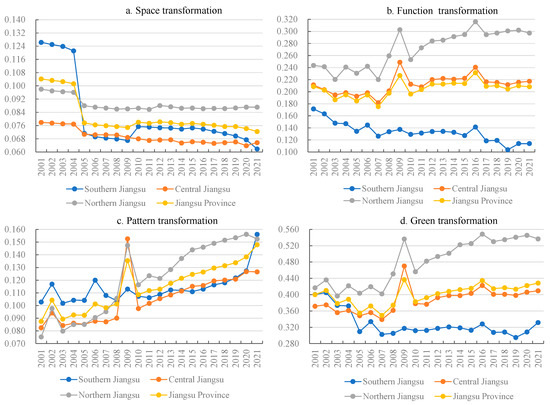
Figure 3.
Time evolution trend of the level of CLUGT in Jiangsu Province, 2001–2021.
It is observed that the index of spatial transformation of cultivated land utilization in Jiangsu Province exhibits a general decline from 2001 to 2021, with the average index decreasing from 0.1042 to 0.0724, representing a cumulative decline of 30.52%. Regarding sub-regions, the indexes of Southern Jiangsu, Central Jiangsu, and Northern Jiangsu all display a fluctuating decline, with Southern Jiangsu experiencing the most significant decrease. The level of spatial transformation follows the order: Northern Jiangsu > Central Jiangsu > Southern Jiangsu.
The index of functional transformation in cultivated land utilization displays no significant change in Jiangsu Province; its evolution trend is characterized by a wave-like pattern. At the sub-regional level, the level of functional transformation in cultivated land utilization has been increasing in a fluctuating manner in Northern Jiangsu, while the change in its central counterpart is insignificant. The level in Southern Jiangsu has been decreasing in a wave-like pattern. The overall levels are as follows: Northern Jiangsu > Central Jiangsu > Southern Jiangsu.
The index of mode transformation for cultivated land utilization in Jiangsu Province exhibited significant changes between 2001 and 2021, demonstrating an upward trend characterized by wave-like fluctuations. The index average rose from 0.0875 to 0.1478, reflecting a cumulative increase of 69.03%. Regionally, Southern Jiangsu, Central Jiangsu, and Northern Jiangsu all exhibited similar wave-like increases in their mode transformation levels. Specifically, the level in Southern Jiangsu fluctuated between 0.1018 and 0.1561, Central Jiangsu between 0.0825 and 0.1526, and Northern Jiangsu between 0.0753 and 0.1562. These fluctuations ultimately resulted in a mode transformation level ranking of Northern Jiangsu > Southern Jiangsu > Central Jiangsu.
The index of CLUGT also displayed an upward trend from 2001 to 2021. The average index increased from 0.4001 to 0.4286, representing a cumulative increase of 7.12%. The overall evolutionary trend of the CLUGT index can be characterized by a wavy, zigzag pattern, progressing through three stages: fluctuating rise (2001–2009), decline after surge (2009–2010), and small fluctuating rise (2010–2021). Specifically, the small surge observed in 2009 is primarily attributed to significant improvements in both functional and mode transformations in Central Jiangsu and Northern Jiangsu, leading to an increase in the green transformation index. Regionally, northern and central regions exhibited wave-like increases, while southern regions demonstrated wave-like decreases. The level in Southern Jiangsu fluctuated between 0.1018 and 0.4052, Central Jiangsu between 0.3393 and 0.4072, and Northern Jiangsu between 0.3968 and 0.5363. Finally, the CLUGT level is ranked as Northern Jiangsu > Central Jiangsu > Southern Jiangsu.
To better illustrate the spatial patterns of CLUGT in Jiangsu Province, measurement results were input into ArcGIS 10.2. Five time nodes—2001, 2005, 2010, 2015, and 2020—were selected to generate a spatiotemporal difference map of CLUGT. Index values were then classified into five levels using the Jenks method, as depicted in Figure 4. In general, the spatial distribution of CLUGT in Jiangsu Province is uneven, exhibiting a unique clustering pattern. Medium-high and high-level zones are primarily concentrated in Central and Northern Jiangsu, while medium-low and low-level zones are generally found in Southern Jiangsu. Specifically, between 2001 and 2005, Jiangsu Province witnessed significant shifts in the CLUGT index. Changzhou transitioned from a high to medium level, while Yancheng, Huai’an, Suqian, and Lianyungang all rose to a high level. From 2005 to 2010, the CLUGT level increased significantly, with changes concentrated in Northern Jiangsu. Suqian’s index rose from medium to high, while Lianyungang and Huai’an both moved from medium to medium-high. Between 2010 and 2015, the upward trend in Northern Jiangsu persisted, with index increases observed in Xuzhou, Lianyungang, Huai’an, and Yancheng. Nantong, a city in Central Jiangsu, also experienced a notable jump from medium-low to medium level. Finally, from 2015 to 2020, Yancheng in Northern Jiangsu transitioned from a medium-high to a high level, while Changzhou in Southern Jiangsu saw a decline from medium to medium-low.
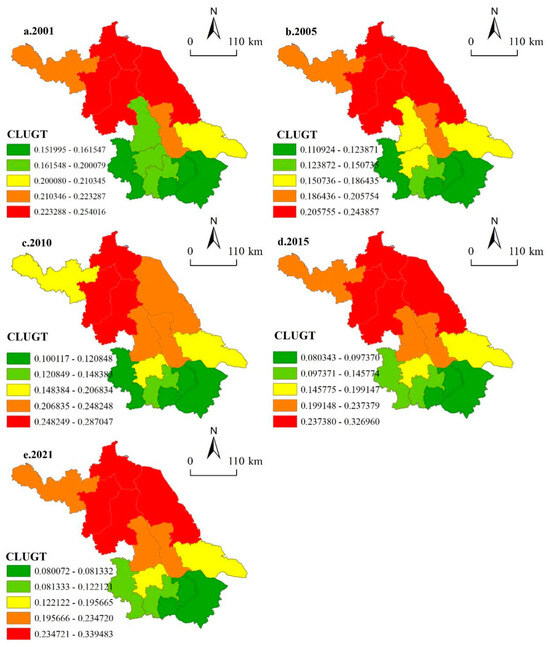
Figure 4.
Spatial distribution of CLUGT in Jiangsu Province, 2001–2021.
4.3. Impacts of the CLUGT on the AEG
To determine the optimal model for this analysis, three tests were conducted.
Firstly, an F-test was employed to evaluate the null hypotheses of both constant coefficients with a fixed intercept and a variable intercept model. The result of the F-test led to the rejection of both null hypotheses for the panel data, suggesting the suitability of a variable coefficient model. Secondly, a Breusch–Pagan test was conducted, which resulted in the rejection of the null hypothesis of a POOL model, indicating its significance. Thirdly, a Hausman test was performed utilizing SPSS 24. With a p-value less than 0.05 at the 0.05 level of significance, the null hypothesis of a random effects model was rejected. Based on the results of the three tests above, a variable coefficient regression model with fixed effects was considered most appropriate for analyzing the effects of CLUGT on AEG in Jiangsu Province (Table 4).
Table 4.
Provincial panel regression model selection.
Table 5 presents the results of model selection for the effects of CLUGT on AEG across four regions: Southern Jiangsu, Central Jiangsu, Northern Jiangsu, and the entire Jiangsu Province. The results, derived from F-tests, Breusch–Pagan tests, and Hausman tests, indicate that a random effects model was selected for the whole province, Central Jiangsu, and Northern Jiangsu, while a fixed effects model was chosen for Southern Jiangsu.
Table 5.
Regional panel regression model selection.
Table 6 displays the results of the effects of CLUGT on AEG in Jiangsu Province. Specifically, the model demonstrates a moderate degree of fit, as indicated by an R2 value of 0.412. The significance of the regression equation is confirmed by a p-value below 0.05. Table 7 presents the regression analysis results for Southern Jiangsu, Central Jiangsu, Northern Jiangsu, and the entire province. The R2 values of 0.524, 0.513, 0.552, and 0.621, respectively, suggest that the models exhibit a reasonable degree of suitability. Moreover, all regression equations are significant, as evidenced by p-values less than 0.05.
Table 6.
Provincial-level model regression results.
Table 7.
Regional-level model regression results.
As depicted in Table 6, the coefficient for the effect of CLUGT on AEG in Jiangsu Province is positive. This positive coefficient suggests that CLUGT significantly and positively affects AEG. Specifically, for every unit increase in the CLUGT index, the AEG index exhibits a corresponding increase of 0.575 units.
As presented in Table 7, the spatial transformation of cultivated land utilization negatively affects AEG. Specifically, for every one-unit increase in the spatial transformation index, the AEG index decreases by 0.169 units. However, the effects of spatial transformation of cultivated land utilization on AEG vary across regions: Northern Jiangsu exhibits a positive effect, where a one-unit increase in the spatial transformation index corresponds to a 0.16-unit increase in the AEG index. In contrast, Central and Southern Jiangsu exhibit negative effects, with Central Jiangsu experiencing the most significant impact (−0.368). In terms of the functional transformation of cultivated land utilization, Central and Northern Jiangsu demonstrate positive effects on AEG, with effect coefficients of 0.038 and 0.022, respectively.
In contrast, Southern Jiangsu exhibits a negative effect, where each one-unit increase in the functional transformation index corresponds to a 0.3-unit decrease in the AEG index. Regarding the mode transformation of cultivated land utilization, Southern, Central, and Northern Jiangsu all exhibit positive effects. Specifically, Central Jiangsu experiences the most significant effect, with a coefficient of 0.391. Southern Jiangsu demonstrates the least positive effect, with every one-unit increase in the mode transformation index resulting in a 0.251 unit decrease in the AEG index.
These varying impacts of CLUGT on AEG can be attributed to the unique natural geographical conditions and socio-economic development levels observed across the north-south axis of Jiangsu Province. Northern Jiangsu, characterized by lower levels of industrialization and urbanization compared to other areas in the province, experiences less significant encroachment and deterioration of cultivated land resources. The agricultural workforce constitutes a larger proportion of the total labor force in this region, resulting in a more prominent primary industry relative to other provincial areas. Additionally, Northern Jiangsu benefits from stricter enforcement of policies pertaining to cultivated land utilization and protection, coupled with more robust comprehensive land improvement initiatives. These factors contribute to enhanced farmland infrastructure, successful reclamation of abandoned rural settlements, and a steady expansion of cultivated land area. Consequently, the contribution of CLUGT to AEG in Northern Jiangsu ranks among the highest in the province.
Central Jiangsu, despite having the smallest land area and population, maintains a high rank in grain production. Data from the Statistical Yearbook of Jiangsu (2022) indicate that Central Jiangsu’s grain yield in 2021 reached 9.08 million tonnes, surpassing twice the output of Southern Jiangsu, a region with a larger population and cultivated land area. This high agricultural productivity can be primarily attributed to the advanced level of agricultural modernization in Central Jiangsu. The region excels in three key aspects: intensive land utilization, green production practices, and technological advancements. As a result, Central Jiangsu’s advantage lies in its transformed approach to cultivated land utilization. Southern Jiangsu stands out for its rapid industrialization and urbanization, having the fastest development in the entire province. The region’s thriving economy is evident in its three southern cities—Nanjing, Suzhou, and Wuxi—which recorded a GDP per capita exceeding CNY 18,000 in 2021. However, this rapid socio-economic progress has come at a cost. The expansion of urban construction has led to a shrinkage of cultivated land area, a decline in the proportion of agricultural employment, and mounting pressure on existing cultivated land resources. Moreover, the extensive use of production inputs such as chemical fertilizers, pesticides, and mulch film poses a significant threat to the cultivated land ecosystem and its sustainable utilization. Consequently, the CLUGT level in Southern Jiangsu remains relatively low compared to other provincial areas, resulting in a weaker promotional effect on AEG.
5. Conclusions and Policy Implications
5.1. Conclusions
This paper employs Jiangsu Province as a case study to explore the spatial and temporal evolution of CLUGT levels, both province-wide and in specific regions, based on a theoretical analysis of CLUGT’s impact on AEG. The study further assesses the influence of CLUGT on AEG using a panel regression model. The main findings are summarized below.
(1) From 2001 to 2021, the provincial CLUGT index ranged from 0.2145 to 0.5975, demonstrating an overall upward trend despite some fluctuations. The average index value increased from 0.4001 to 0.4286, representing a cumulative rise of 7.12%. The spatial transformation index exhibited a general decline across Jiangsu, while the mode transformation index displayed a wave-like increase. The functional transformation index remained relatively stable.
(2) The spatial patterns of CLUGT in Jiangsu Province show significant differences. Areas with higher CLUGT indices cluster in Northern Jiangsu, particularly in regions such as Xuzhou, Lianyungang, and Suqian, and exhibit a wave-like increasing trend over time. In contrast, areas with lower CLUGT indices are primarily concentrated in Southern Jiangsu, including cities such as Nanjing, Suzhou, and Wuxi, and demonstrate a wave-like decreasing trend.
(3) Generally, CLUGT appears to have a positive impact on AEG in Jiangsu. For each one-unit increase in the CLUGT index, the AEG index rises by 0.575 units. Both functional and mode transformation significantly affect AEG, with functional transformation having a more substantial impact. Spatial transformation, however, demonstrates a somewhat negative influence on AEG.
5.2. Policy Implications
From the observed impacts of CLUGT on AEG, it is evident that functional transformation and mode transformation are critical drivers. Regarding the functional transformation of cultivated land utilization, authorities in Jiangsu Province should prioritize enhancing and integrating production, livelihood, and ecological functions to propel regional agricultural economic advancement. While maintaining the quantity and quality of cultivated land resources, measures should be adopted to incentivize greater participation in agricultural production and enhance cultivated land productivity through diverse agricultural subsidy policies. For the mode transformation of cultivated land utilization, Jiangsu Province should advocate intensive utilization, green production, and technological progress.
Firstly, within reasonable limits, a measured increase in production factor input can be implemented, coupled with controlled application of chemical inputs such as fertilizers and pesticides. The use of green organic fertilizer should be encouraged, and approaches to reduce carbon dioxide emissions, and pollution should be actively facilitated. These efforts will contribute to a more sustainable and intensive level of cultivated land utilization. Secondly, Jiangsu should prioritize the advancement of agricultural production technologies, including large-scale operations, modernized irrigation, and optimized fertilizer application and cultivation methods. Elevating the modernization of agricultural production will facilitate the transformation of cultivated land utilization towards a high-quality, low-pollution, and environmentally sound model, ultimately fostering high-quality growth in the agricultural economy.
The CLUGT stands as a significant initiative in furthering the rural revitalization strategy and advancing high-quality agricultural development. This initiative is crucial for enhancing national food security, championing sustainable agricultural advancement, and propelling the construction of an ecological civilization. CLUGT effectively elevates the production efficiency of cultivated land and stimulates rural economic growth by transforming cultivated land spatial patterns, optimizing land utilization structures, enhancing farmland infrastructure, increasing scientific and technological inputs in agriculture, and mitigating agricultural non-point source pollution. Simultaneously, it plays a vital role in preserving the equilibrium and stability of cultivated land ecosystems, ultimately enhancing ecosystem quality, and promoting environmental protection.
This paper focuses on Jiangsu Province as a case study to conduct an in-depth analysis of the impacts and mechanisms of CLUGT on AEG. This analysis represents a valuable reference for protecting cultivated land and realizing regional agricultural green development in this new era. Future research will evaluate the system design of CLUGT, its driving mechanisms, and its relationship with rural revitalization in China.
Author Contributions
Methodology, X.Y. and Q.W.; Software, M.T.; Data curation, A.J.; Writing—review & editing, X.Y.; Project administration, Q.W.; Funding acquisition, Q.W. All authors have read and agreed to the published version of the manuscript.
Funding
This research was supported by the National Social Science Fund of China (Grant No. 22CZZ048), Jiangsu Province Social Science Fund (Grant No. 22ZZC002), and The Project of Philosophy and Social Science Research in Jiangsu Universities (Grant No. 2022SJYB1137).
Institutional Review Board Statement
Not applicable.
Informed Consent Statement
Not applicable.
Data Availability Statement
The data presented in this study are available on request from the corresponding author.
Conflicts of Interest
The authors declare no conflict of interest.
References
- Liu, Y.; Zhou, Y. Reflections on China’s food security and land use policy under rapid urbanization. Land Use Policy 2021, 109, 105699. [Google Scholar] [CrossRef]
- Foley, J.A.; Ramankutty, N.; Brauman, K.A.; Cassidy, E.S.; Gerber, J.S.; Johnston, M.; Mueller, N.D.; O’Connell, C.; Ray, D.K. Solution for a cultivated planet. Nature 2011, 478, 10452. [Google Scholar] [CrossRef] [PubMed]
- Cao, W.; Zhou, W.; Wu, T.; Wang, X.; Xu, J. Spatial-temporal characteristics of cultivated land use eco-efficiency under carbon constraints and its relationship with landscape pattern dynamics. Ecol. Indic. 2022, 141, 109140. [Google Scholar] [CrossRef]
- Chai, C.; Zhang, B.; Li, Y.; Niu, W.; Zheng, W.; Kong, X.; Yu, Q.; Zhao, M.; Xia, X. A new multi-dimensional framework considering environmental impacts to assess green development level of cultivated land during 1990 to 2018 in China. Environ. Impact Assess. Rev. 2023, 98, 106927. [Google Scholar] [CrossRef]
- Xie, H.; Chen, Q.; Wang, W.; He, Y. Analyzing the green efficiency of arable land use in China. Technol. Forecast. Soc. Change 2018, 133, 15–28. [Google Scholar] [CrossRef]
- He, N.; Zhou, Y.; Wang, L.; Li, Q.; Zuo, Q.; Liu, J.; Li, M. Spatiotemporal evaluation and analysis of cultivated land ecological security based on the DPSIR model in Enshi autonomous prefecture, China. Ecol. Indic. 2022, 145, 109619. [Google Scholar] [CrossRef]
- Yang, B.; Wang, Y.; Li, Y.; Mo, L.Z. Empirical Investigation of Cultivated Land Green Use Efficiency and Influencing Factors in China, 2000–2020. Land 2023, 12, 1589. [Google Scholar] [CrossRef]
- Hou, X.; Liu, J.; Zhang, D.; Zhao, M.; Xia, C. Impact of urbanization on the eco-efficiency of cultivated land utilization: A case study on the Yangtze River Economic Belt, China. J. Clean. Prod. 2019, 238, 117916. [Google Scholar] [CrossRef]
- Lambin, E.A.; Meyfroidt, P. Land use transitions: Socio-ecological feedback versus socio-economic change. Land Use Policy 2010, 27, 108–118. [Google Scholar] [CrossRef]
- Fu, J.; Ding, R.; Zhu, Y.Q.; Du, L.Y.; Shen, S.W.; Peng, L.N.; Zou, J.; Hong, Y.X.; Liang, J.; Wang, K.X.; et al. Analysis of the spatial-temporal evolution of Green and low carbon utilization efficiency of agricultural land in China and its influencing factors under the goal of carbon neutralization. Environ. Res. 2023, 237, 116881. [Google Scholar] [CrossRef]
- Liu, Y.; Zou, L.; Wang, Y. Spatial-temporal characteristics and influencing factors of agricultural eco-efficiency in China in recent 40 years. Land Use Policy 2020, 97, 104794. [Google Scholar] [CrossRef]
- Yang, B.; Chen, X.; Wang, Z.; Li, W.; Zhang, C.; Yao, X. Analyzing land use structure efficiency with carbon emissions: A case study in the Middle Reaches of the Yangtze River, China. J. Clean. Prod. 2020, 274, 123076. [Google Scholar] [CrossRef]
- Kuang, B.; Lu, X.; Zhou, M.; Chen, D. Provincial cultivated land use efficiency in China: Empirical analysis based on the SBM-DEA model with carbon emissions considered. Technol. Forecast. Soc. Change 2020, 151, 119874. [Google Scholar] [CrossRef]
- Li, H.; Song, W. Spatial transformation of changes in global cultivated land. Sci. Total Environ. 2023, 859, 160194. [Google Scholar] [CrossRef]
- Wang, J.; Su, D.; Wu, Q.; Li, G.; Cao, Y. Study on eco-efficiency of cultivated land utilization based on the improvement of ecosystem services and emergy analysis. Sci. Total Environ. 2023, 882, 163489. [Google Scholar] [CrossRef] [PubMed]
- Li, X.; Wu, K.; Yang, Q.; Hao, S.; Feng, Z.; Ma, J. Quantitative assessment of cultivated land use intensity in Heilongjiang Province, China, 2001–2015. Land Use Policy 2023, 125, 106505. [Google Scholar] [CrossRef]
- Zang, Y.; Hu, S.; Liu, Y. Rural transformation and its links to farmland use transition: Theoretical insights and empirical evidence from Jiangsu, China. Habitat Int. 2024, 149, 103094. [Google Scholar] [CrossRef]
- Gu, Z.; Jin, X.; Liang, X.; Liu, J.; Han, B.; Zhou, Y. Diversification of food production in rapidly urbanizing areas of China, evidence from southern Jiangsu. Sustain. Cities Soc. 2024, 101, 105121. [Google Scholar] [CrossRef]
- Cudjoe, D.; Nketiah, E.; Obuobi, B.; Adjei, M.; Zhu, B.; Adu-Gyamfi, G. Predicting waste sorting intention of residents of Jiangsu Province, China. J. Clean. Prod. 2022, 366, 132838. [Google Scholar] [CrossRef]
- Song, X.; Wang, X.; Hu, S.; Xiao, R.; Scheffran, J. Functional transition of cultivated ecosystems: Underlying mechanisms and policy implications in China. Land Use Policy 2022, 119, 106195. [Google Scholar] [CrossRef]
- Wang, Z.; Yang, H.; Hu, Y.; Peng, Y.; Liu, L.; Su, S.; Wang, W.; Wu, J. Multifunctional trade-off/synergy relationship of cultivated land in Guangdong: A long time series analysis from 2010 to 2030. Ecol. Indic. 2023, 154, 110700. [Google Scholar] [CrossRef]
- Zhao, W.; Li, Y.; Wang, Q.; Shao, J.A. Evolutionary characteristics of sloping cultivated land under functional diversification in mountain areas: A case of Fengjie County, China. Glob. Ecol. Conserv. 2024, 50, e02854. [Google Scholar] [CrossRef]
- Alabdali, M.A.; Yaqub, M.Z.; Agarwal, R.; Alofaysan, H.; Mohapatra, A.K. Unveiling green digital transformational leadership: Nexus between green digital culture, green digital mindset, and green digital transformation. J. Clean. Prod. 2024, 450, 141670. [Google Scholar] [CrossRef]
- Chen, D.; Hu, H.; Wang, N.; Chang, C.-P. The impact of green finance on transformation to green energy: Evidence from industrial enterprises in China. Technol. Forecast. Soc. Change 2024, 204, 123411. [Google Scholar] [CrossRef]
- Bianchi, M.; Valle, I.D.; Tapia, C. Measuring eco-efficiency in European regions: Evidence from a territorial perspective. J. Clean. Prod. 2020, 276, 123246. [Google Scholar] [CrossRef]
- Xiao, J.; Qiao, J.; Han, D.; Ma, Y.; Zhu, Q.; Wang, W. Spatial distribution and transformation mechanism of specialized villages in typical agricultural areas: Case study of Henan province, China. Habitat Int. 2024, 146, 103034. [Google Scholar] [CrossRef]
- Yin, Y.; Hou, X.; Liu, J.; Zhou, X.; Zhang, D. Detection and attribution of changes in cultivated land use ecological efficiency: A case study on Yangtze River Economic Belt, China. Ecol. Indic. 2022, 137, 108753. [Google Scholar] [CrossRef]
- Zhang, W.; Ma, L.; Wang, X.; Chang, X.; Zhu, Z. The impact of non-grain conversion of cultivated land on the relationship between agricultural carbon supply and demand. Appl. Geogr. 2024, 162, 103166. [Google Scholar] [CrossRef]
- Liang, X.; Li, Y. Identification of spatial coupling between cultivated land functional transformation and settlements in Three Gorges Reservoir Area, China. Habitat Int. 2020, 104, 102236. [Google Scholar] [CrossRef]
- Ye, S.; Ren, S.; Song, C.; Du, Z.; Wang, K.; Du, B.; Cheng, F.; Zhu, D. Spatial pattern of cultivated land fragmentation in mainland China: Characteristics, dominant factors, and countermeasures. Land Use Policy 2024, 139, 107070. [Google Scholar] [CrossRef]
- Liang, X.; Jin, X.; Sun, R.; Han, B.; Liu, J.; Zhou, Y. A typical phenomenon of cultivated land use in China’s economically developed areas: Anti-intensification in Jiangsu Province. Land Use Policy 2021, 102, 105223. [Google Scholar] [CrossRef]
- Liu, J.; Jin, X.; Lin, J.; Liang, X.; Zhang, X.; Zhou, Y. Identification and characteristic analysis of semi-natural habitats in China’s economically developed areas: New insights to inform cultivated land system ecological conservation. J. Environ. Manag. 2024, 351, 119804. [Google Scholar] [CrossRef] [PubMed]
- Hou, X.; Yin, Y.; Zhou, X.; Zhao, M.; Yao, L.; Zhang, D.; Wang, X.; Xia, C. Does economic agglomeration affect the sustainable intensification of cultivated land use? Evidence from China. Ecol. Indic. 2023, 154, 110808. [Google Scholar] [CrossRef]
- Zhang, J.; Zhang, P.; Liu, Y.; Lu, S.; Wu, G. An analysis of the spatiotemporal evolution and driving force of cultivated land green utilization in karst region of southwest China. J. Clean. Prod. 2024, 434, 140002. [Google Scholar] [CrossRef]
- Li, Y.; Zhang, J.; He, Y.; Li, Z. Suitability evaluation method for preventive maintenance of asphalt pavement based on interval-entropy weight-TOPSIS. Constr. Build. Mater. 2023, 409, 134098. [Google Scholar] [CrossRef]
- Uddin, M.K.; Pan, X.; Saima, U.; Zhang, C. Influence of financial development on energy intensity subject to technological innovation: Evidence from panel threshold regression. Energy 2022, 239, 122337. [Google Scholar] [CrossRef]
- Zhe, D.; Su, N.; Zhu, X.; Mahmoud, H.A.; Akhtar, T. Non-linear relationship between FinTech, natural resources, green innovation and environmental sustainability: Evidence from panel smooth transition regression model. Resour. Policy 2024, 91, 104902. [Google Scholar] [CrossRef]
Disclaimer/Publisher’s Note: The statements, opinions and data contained in all publications are solely those of the individual author(s) and contributor(s) and not of MDPI and/or the editor(s). MDPI and/or the editor(s) disclaim responsibility for any injury to people or property resulting from any ideas, methods, instructions or products referred to in the content. |
© 2024 by the authors. Licensee MDPI, Basel, Switzerland. This article is an open access article distributed under the terms and conditions of the Creative Commons Attribution (CC BY) license (https://creativecommons.org/licenses/by/4.0/).