Abstract
Forest soil acidification is a global environmental problem, and forest ecosystems play an important role in terrestrial ecosystems. To provide a theoretical basis for the sustainable development of areas, this study selected Daluoshan and Wuyanling National Nature Reserve, Wenzhou, Zhejiang Province, China and determined the characteristics of soil acidification in the two forested areas and the relationship between forest soil acidification and soil physicochemical properties. The forest soil pH value of Daluoshan was 4.25–5.40, and that of Wuyanling was 4.14–5.71. There was a significant difference between the mean soil pH values of the two woodlands (p < 0.01). The two forest soils were dominated by strongly acidic soils, and the top layer of the soils was susceptible to disturbances by environmental factors. With the increase in altitude, different layers of soil in the forests in the two woodland areas showed deepening acidification. Regarding the different plant types and slope directions, the soils under trees in the forests showed the most serious acidification, followed by the soils under shrubs and herbs. Compared with the soils on the leeward slopes, the soils of the forest sites on the windward slopes showed a more severe situation of soil acidification. Redundancy analysis between forest soil acidity indicators and soil physicochemical properties in the two forest sites showed that the main environmental factor affecting soil acidity indicators was salt base saturation, and soil pH and active state Cr, Ni, and Pb showed negative correlations in both forest sites.
1. Introduction
Forest ecosystems are important components of terrestrial ecosystems and play roles in material cycling and energy flow. Forest soil acidification is a slow process in its natural state and a global environmental problem. Although the rate of forest soil acidification is inhibited by the combined effects of soil mineral weathering [1], organic matter [2], and other factors, soil acidification is accelerated by acid deposition and anthropogenic factors [3,4,5]. Zhang et al. [6] found that from 1980 to 2019, the pH of the forest surface layer in China significantly decreased from 5.64 to 5.08. Forest soil acidification has also been observed in the northeastern United States [7], northern Belgium [8], and South Korea [9], among which the forest soil pH in northern Belgium was concentrated between 4.2 and 5.5 when soil depth was considered. Monitoring data from 22 forest sites in Switzerland demonstrated that the majority of forested soils had a pH of less than 4.2 [10]. Considering the soil depth, the soil pH in Japanese cedar plantations was mainly 4.4–4.7 [11]. A survey of soil pH in Austrian forests found that the majority of soils had pH values less than 5.3 [12].
Acidification of forest soil may cause problems in ecosystems, such as Al3+ toxicity to plants, cations loss (e.g., Ca2+, Mg2+, K+, Na+), and reduced soil fertility [13]. Low pH values inhibit soil respiration in strongly acidic forest soils [14]. Forest soil acidification also affects the growth of plants within the forest ecosystem [15], the abundance of soil fauna [16], and microbial diversity [17]. Liao et al. [18] showed that a decrease in the pH of forest soils leads to an increase in the mobility of Cd, Cu, and Zn in the soils. Therefore, soil acidification may exacerbate contamination by certain heavy metals, leading to an increase in the ecological hazards of heavy metals and impeding the sustainable development of forest ecosystems.
In China, forest soil acidification is widespread in the southern region, including Zhejiang, southwestern Chongqing, and parts of Guangdong. The soil pH of Tieshanping Forest Park in Chongqing, located in the subtropical region of Southwest China, ranged from 3.80 to 4.54 [19]. Mao et al. [20] found that the mean pH of the studied forest surface soil from the Dinghushan Forest Reserve, Guangdong Province, South China was 3.98. A 10-year pH monitoring study of moso bamboo forest soils in Anji, Zhejiang Province, China found that the natural rate of soil acidification was 0.011 pH/year [21]. Additionally, monitoring of soil pH in Leizhu, Lin’an, Zhejiang, China found that soil pH decreased from 4.54 to 3.32 over a 10-year period [22].
Therefore, this study selected two typical forest lands in Wenzhou City, Zhejiang Province as the study objects to comprehensively understand the acidification characteristics of the forest lands in terms of different elevations, plant types, and slope directions by exploring forest soil acidification at different spatial scales. We further explored the relationship between forest soil acidification and soil physicochemical properties to provide a theoretical basis for the stable development of forest ecosystems. Most studies have focused on acidification on a small scale, forgoing comparative analysis of acidification in different areas of the whole forest land. In this study, we conducted a systematic analysis and research on a wide range of scales, including different depths, elevations, plant types, slope directions, and the differences in acidification in the forest to provide a realistic basis for the study of forest soil acidification in woodlands.
2. Materials and Methods
2.1. Overview of the Study Area
Two forest lands of Daluoshan (DLS) (120°42′ E, 27°54′ N) and Zhejiang Wuyanling National Nature Reserve (WYL) (119°37′ E–119°50′ E, 27°20′ N–27°48′ N) were selected as the study areas. This subtropical area has abundant rainfall. In DLS, the average annual temperature is 17.7 °C, and the average precipitation over the years is 1745.8 mm. In WYL, the average annual temperature and precipitation values are 15.2 °C and 2195 mm, respectively. The highest elevations of the two woodlands are 707.4 and 1611.1 m, respectively, and they are rich in species, with yellow and red soils dominating.
2.2. Sample Collection and Analysis
2.2.1. Sample Collection
Soil samples were collected in March, April, and July 2023 according to different elevations, plant types, and slope directions. Among all samples, 54 samples were collected at different altitudes, plant types, and slope directions in DLS; three soil profiles were collected from each of the sampling sites, which were dominated by yellow and red soils with a relatively soft texture. In WYL, 24 samples were collected from different altitudes and slope directions; 27 samples were collected from different plant types. Three soil profiles were collected from each sampling point; the main soil was yellow soil with a relatively soft texture (Supplementary Figure S1). One soil profile was obtained at each sampling site. Sampling was conducted from top to bottom according to the soil profile. After removing plant debris and stones, the surface layer soil of 0–20 cm was collected, followed by 20–40 and 40–60 cm, based on differences of soil color. Soil samples from the different layers were placed in sealed bags and transported to the laboratory for processing, where each soil sample (approximately 5 kg) was collected.
2.2.2. Sample Analysis
The collected soil samples were air-dried, homogenized through 2 and 0.15 mm sieves, and stored for physicochemical analysis [23]. The experimental reagent blanks and standard samples were used to fulfill quality control and national standards. All the measurements were conducted with duplicates.
pH (Active Acidity)
Soil pH was determined using potentiometry in a 2.5:1 water/soil suspension with a PB-10 pH detector (Sartorius, Göttingen, Germany). Before each measurement, the detector was calibrated using a standard buffer of pH at 4.00, 6.86, and 9.18, separately.
Hydrolytic Acidity
Briefly, 5.0 g soil sample was placed in a funnel lined with filter paper. The soil samples were washed several times with 1 mol/L sodium acetate solution in small amounts, and the filtrate was collected in a 250 mL volumetric bottle. Then, 100 mL filtrate was transferred into a 250 mL conical bottle and then subject to the titration procedure using 0.02 mol/L sodium hydroxide solution [24].
Exchangeable Acidity, Exchangeable H+, and Exchangeable Al3+
The 5.0 g soil samples in a funnel lined with filter paper were washed several times with 1 mol/L potassium chloride solution in a small amount. The filtrate was placed in a 250 mL volumetric bottle, and 1 mol/L potassium chloride solution was used for volume determination when near the scale. Then, 100 mL filtrate was placed into a 250 mL conical bottle and boiled for 5 min. Then, the titration procedure was performed with 0.02 mol/L sodium hydroxide solution. Another 100 mL filtrate was placed in a 250 mL conical bottle, and 1 mL of excess 35 g/L sodium fluoride solution was added. Then, the sample was titrated with 0.02 mol/L sodium hydroxide standard solution. A blank measurement was obtained at the same time.
Cation Exchange Capacity (CEC)
CEC was determined using ammonium hexachloride cobalt leaching spectrophotometry. The soil sample was leached with ammonium hexachloride cobalt solution at (20 ± 2) °C, shaken for 60 min, mixed, and centrifuged for 10 min. The supernatant was collected in a colorimetric tube. The absorbance was determined using a 10 mm colorimetric dish at a wavelength of 475 nm (VPF19D0157, V-1000 Visible Spectrophotometer, UK) with water as the reference [25].
Total Exchangeable Base (TEB) and Base Saturation (BS)
TEB was obtained by subtracting exchangeable H+ and Al3+ with CEC, and BS was obtained as the ratio of the TEB to CEC.
Soil Organic Matter (SOM)
SOM was determined using low-temperature exothermic potassium dichromate oxidation colorimetry. The organic carbon in the soil was oxidized with potassium dichromate at a certain temperature (100 °C, 90 min), and the absorbance was measured at 590 nm to calculate the organic carbon in the soil and convert it to organic matter content.
Active Heavy Metals
Active heavy metals were determined using a method described in the Technical Provisions on Methods for Analyzing and Testing Soil Samples for Detailed Investigation of National Soil Pollution Status, and calcium chloride was used for extraction. Soil samples with a particle size of 0.15 mm were mixed and extracted by shaking at a soil:liquid ratio of 1:10 (m/V) with a concentration of 0.01 mol/L CaCl2 solution at a temperature of (20 ± 2) °C for 120 min and then filtered through a 0.45 μm filter membrane after centrifugation of the shocked extraction. The appropriate amount of the filtrate was collected for the determination of the elements using inductively coupled plasma mass spectrometry (ICP-MS, 2107754S, Thermo Fisher, Waltham, MA, USA). The instrument was calibrated at each measurement using a standard heavy metal mixing solution and can achieve an accuracy of 95% and above.
2.2.3. Data Processing
Excel was used for data organization. SPSS was used for the analysis of variance data. Origin2021 and GraphPad Prism9 were used for graphing. Canoco 5 was used for redundancy analysis between soil acidity indicators and soil physicochemical properties.
3. Results
3.1. Acidification of Forest Soils in Different Layers of the Study Area
The results of the soil pH measurements in the two study areas are shown in Figure 1. The data showed that there was a significant difference between the mean soil pH values of the two woodlands (p < 0.01). The pH of forest soil in DLS (Supplementary Table S1) and WYL (Supplementary Table S2) ranged from 4.25 to 5.40 and 4.14 to 5.71, respectively. The pH of the two forest areas was approximately 4.5–5.5, indicating a strongly acidic soil. The soils of the two woodlands were generally acidic to very acidic (Table 1).
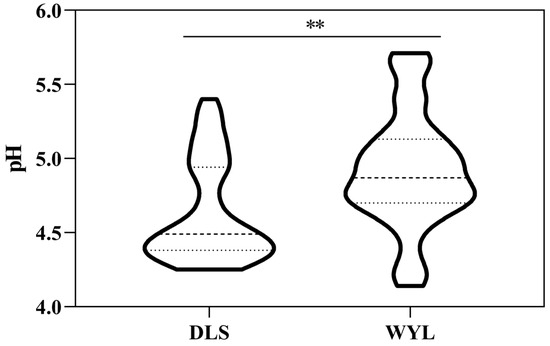
Figure 1.
Distribution of forest soil pH in DLS and WYL forests. Note: The middle dotted line represents the median; the upper and lower dotted lines represent the upper and lower quartiles, respectively. ** indicates a significant difference at the 0.01 level.

Table 1.
Classification of forest soil acidity.
The forest soil pH at the two forest sites showed different changes at different soil depths (Figure 2). The pH of DLS showed a decreasing trend with an increase in soil depth, indicating by mean soil pH values of 4.77, 4.60, and 4.53 at 0–20, 20–40, and 40–60 cm, respectively. A significant difference was observed between the mean values of soil pH at 0–20 and 40–60 cm (p < 0.05). The pH of the WYL forest soil did not change significantly with increasing soil depth. The mean pH values of the 0–20, 20–40, and 40–60 cm soils were 4.81, 4.82, and 4.86, respectively.
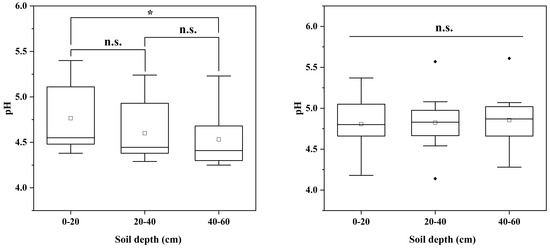
Figure 2.
Relationship between forest soil pH and soil depth in DLS (left) and WYL (right). * indicates a significant difference at the 0.05 level; n.s. indicates no significant difference.
Regarding exchangeable and hydrolytic acidities (Figure 3) (Supplementary Tables S3 and S5), the mean values of exchangeable acidity in 0–20, 20–40, and 40–60 cm soils were 6.77, 5.77, and 6.61 cmol/kg, respectively, and the mean values of hydrolytic acidity in 0–20, 20–40, and 40–60 cm soils were 8.98, 7.45, and 8.32 cmol/kg, respectively. There was no significant difference between the mean values of the various layers of DLS soil; however, in general, the surface layer had a larger content of exchangeable and hydrolytic acidities.
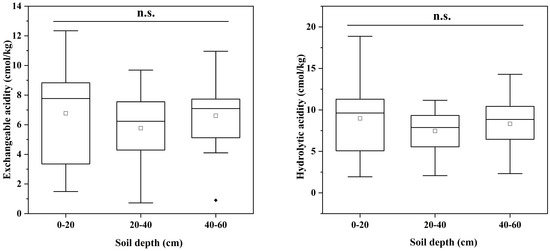
Figure 3.
Relationship between exchangeable and hydrolytic acidities of forest soils and soil depth in DLS. n.s. indicates no significant difference.
For WYL soil (Figure 4), the mean values of exchangeable acidity (Supplementary Tables S4 and S6) for 0–20, 20–40, and 40–60 cm soils were 5.62, 4.64, and 3.86 cmol/kg, respectively, with no significant difference noted between the mean values in each layer. However, the mean values of hydrolytic acidity of 0–20, 20–40, and 40–60 cm soils were 11.68, 9.33, and 8.24 cmol/kg, respectively, with a significant difference (p < 0.05) noted between the mean values of 0–20 and 40–60 cm soils.
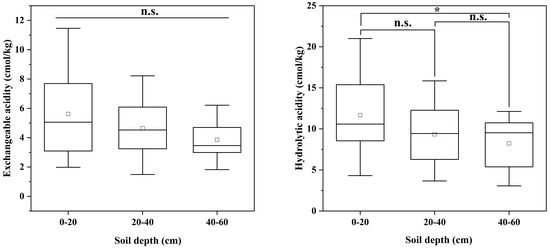
Figure 4.
Relationship between exchangeable and hydrolytic acidities of forest soils and soil depth in WYL. * indicates a significant difference at the 0.05 level; n.s. indicates no significant difference.
These results showed that the forest soils of DLS and WYL exhibited severe surface soil acidification, and the pH of the surface soil of DLS was lower than that of WYL. Regarding exchangeable and hydrolytic acidity content, the surface soil was more seriously acidified. Moreover, with the increase in soil depth, the pH value and exchangeable and hydrolytic acidities of the soil tended to stabilize, indicating that the surface soil of the two forests was more susceptible to disturbances by environmental factors than the other layers.
3.2. Forest Soil Acidification at Different Elevations in the Study Area
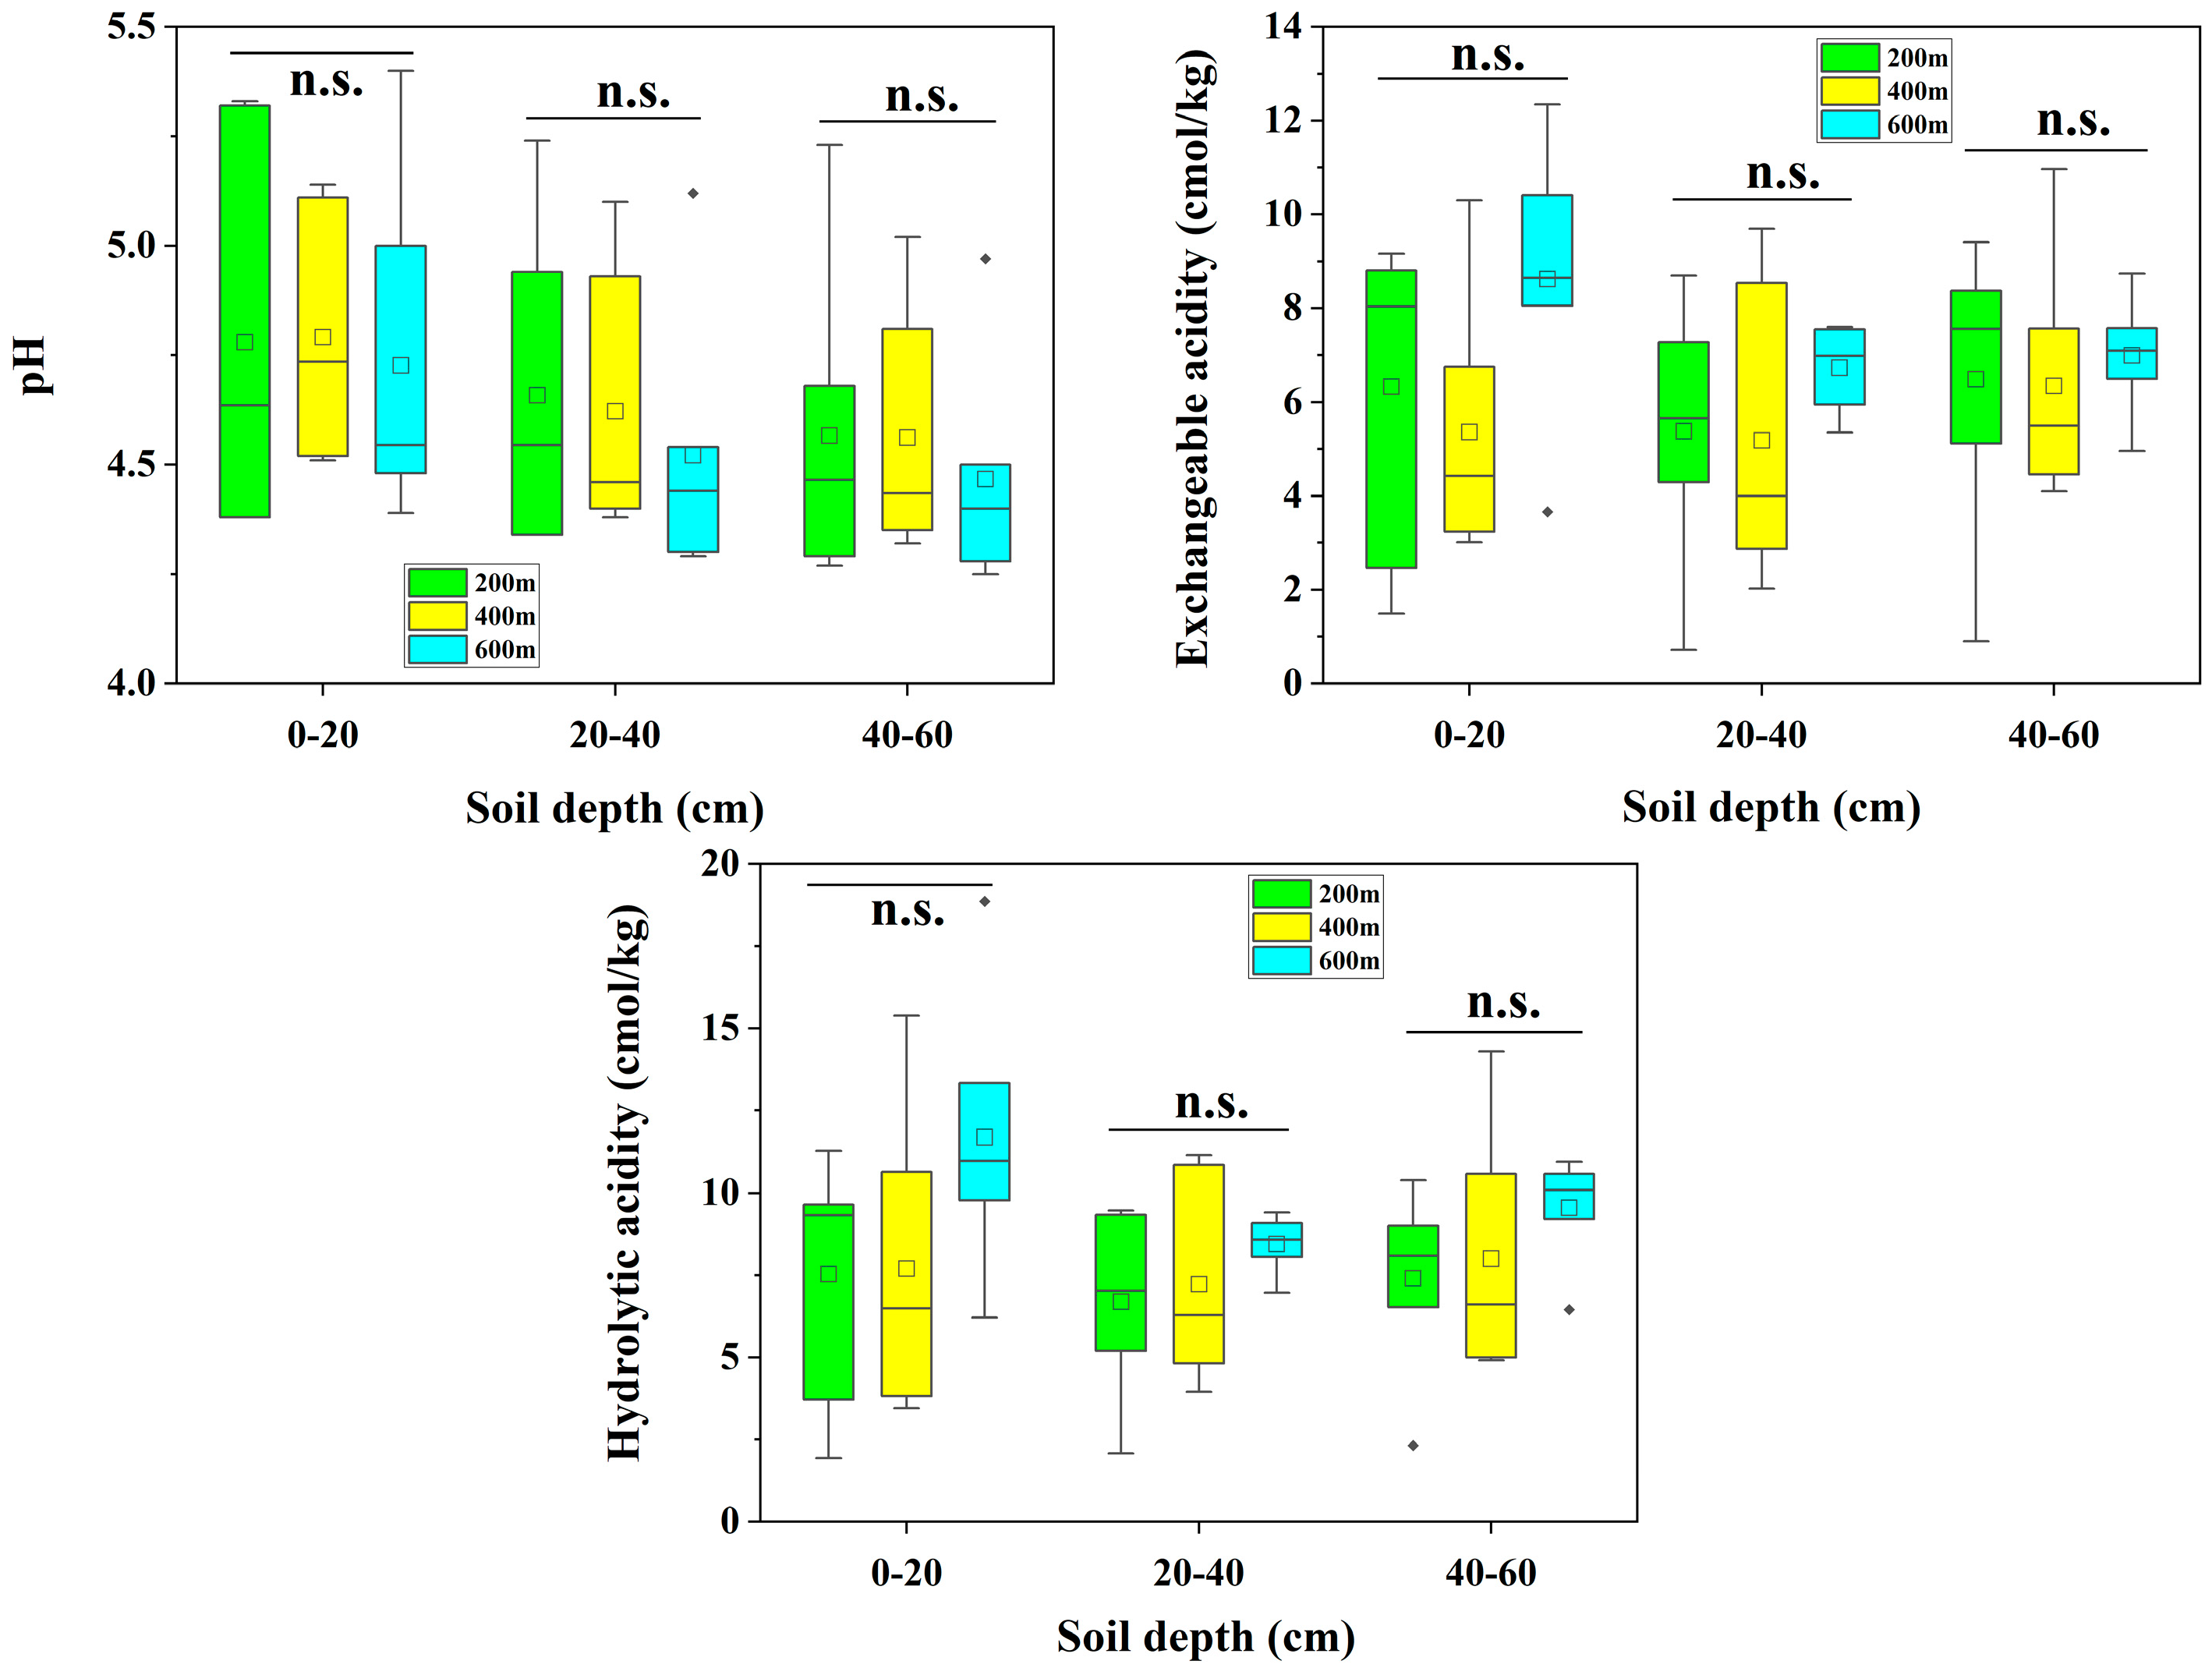
For different soil depths in DLS, with the increase in altitude, the mean soil pH values of 0–20, 20–40, and 40–60 cm soils were 4.78, 4.79, and 4.73 (200, 400, and 600 m); 4.66, 4.62, and 4.52 (200, 400, and 600 m); and 4.57, 4.56, and 4.47 (200, 400, and 600 m), respectively. With the increase in altitude, the mean values of exchangeable acidity of 0–20, 20–40, and 40–60 cm soils were 6.34, 5.36, and 8.62 (200, 400, and 600 m); 5.38, 5.18, and 6.74 (200, 400, and 600 m); and 6.49, 6.35, and 7.00 cmol/kg (200, 400, and 600 m), respectively. With the increase in altitude, the mean values of hydrolytic acidity of 0–20, 20–40, and 40–60 cm soils were 7.54, 7.71, and 11.69 (200, 400, and 600 m); 6.69, 7.23, and 8.45 (200, 400, and 600 m); and 7.41, 8.00 and 9.56 cmol/kg (200, 400, and 600 m), respectively. For the mean soil pH, exchangeable acidities, and hydrolytic acidities, there were no significant differences at different altitudes (200, 400, and 600 m) (Figure 5).
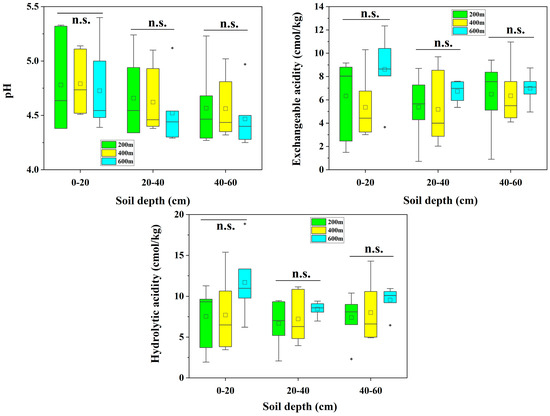
Figure 5.
Relationships among pH, exchangeable acidities, and hydrolytic acidities of forest soils of different layers and altitudes in DLS. Note: 200 m, 400 m, and 600 m represent different altitudes. n.s. indicates no significant difference. Same as below.
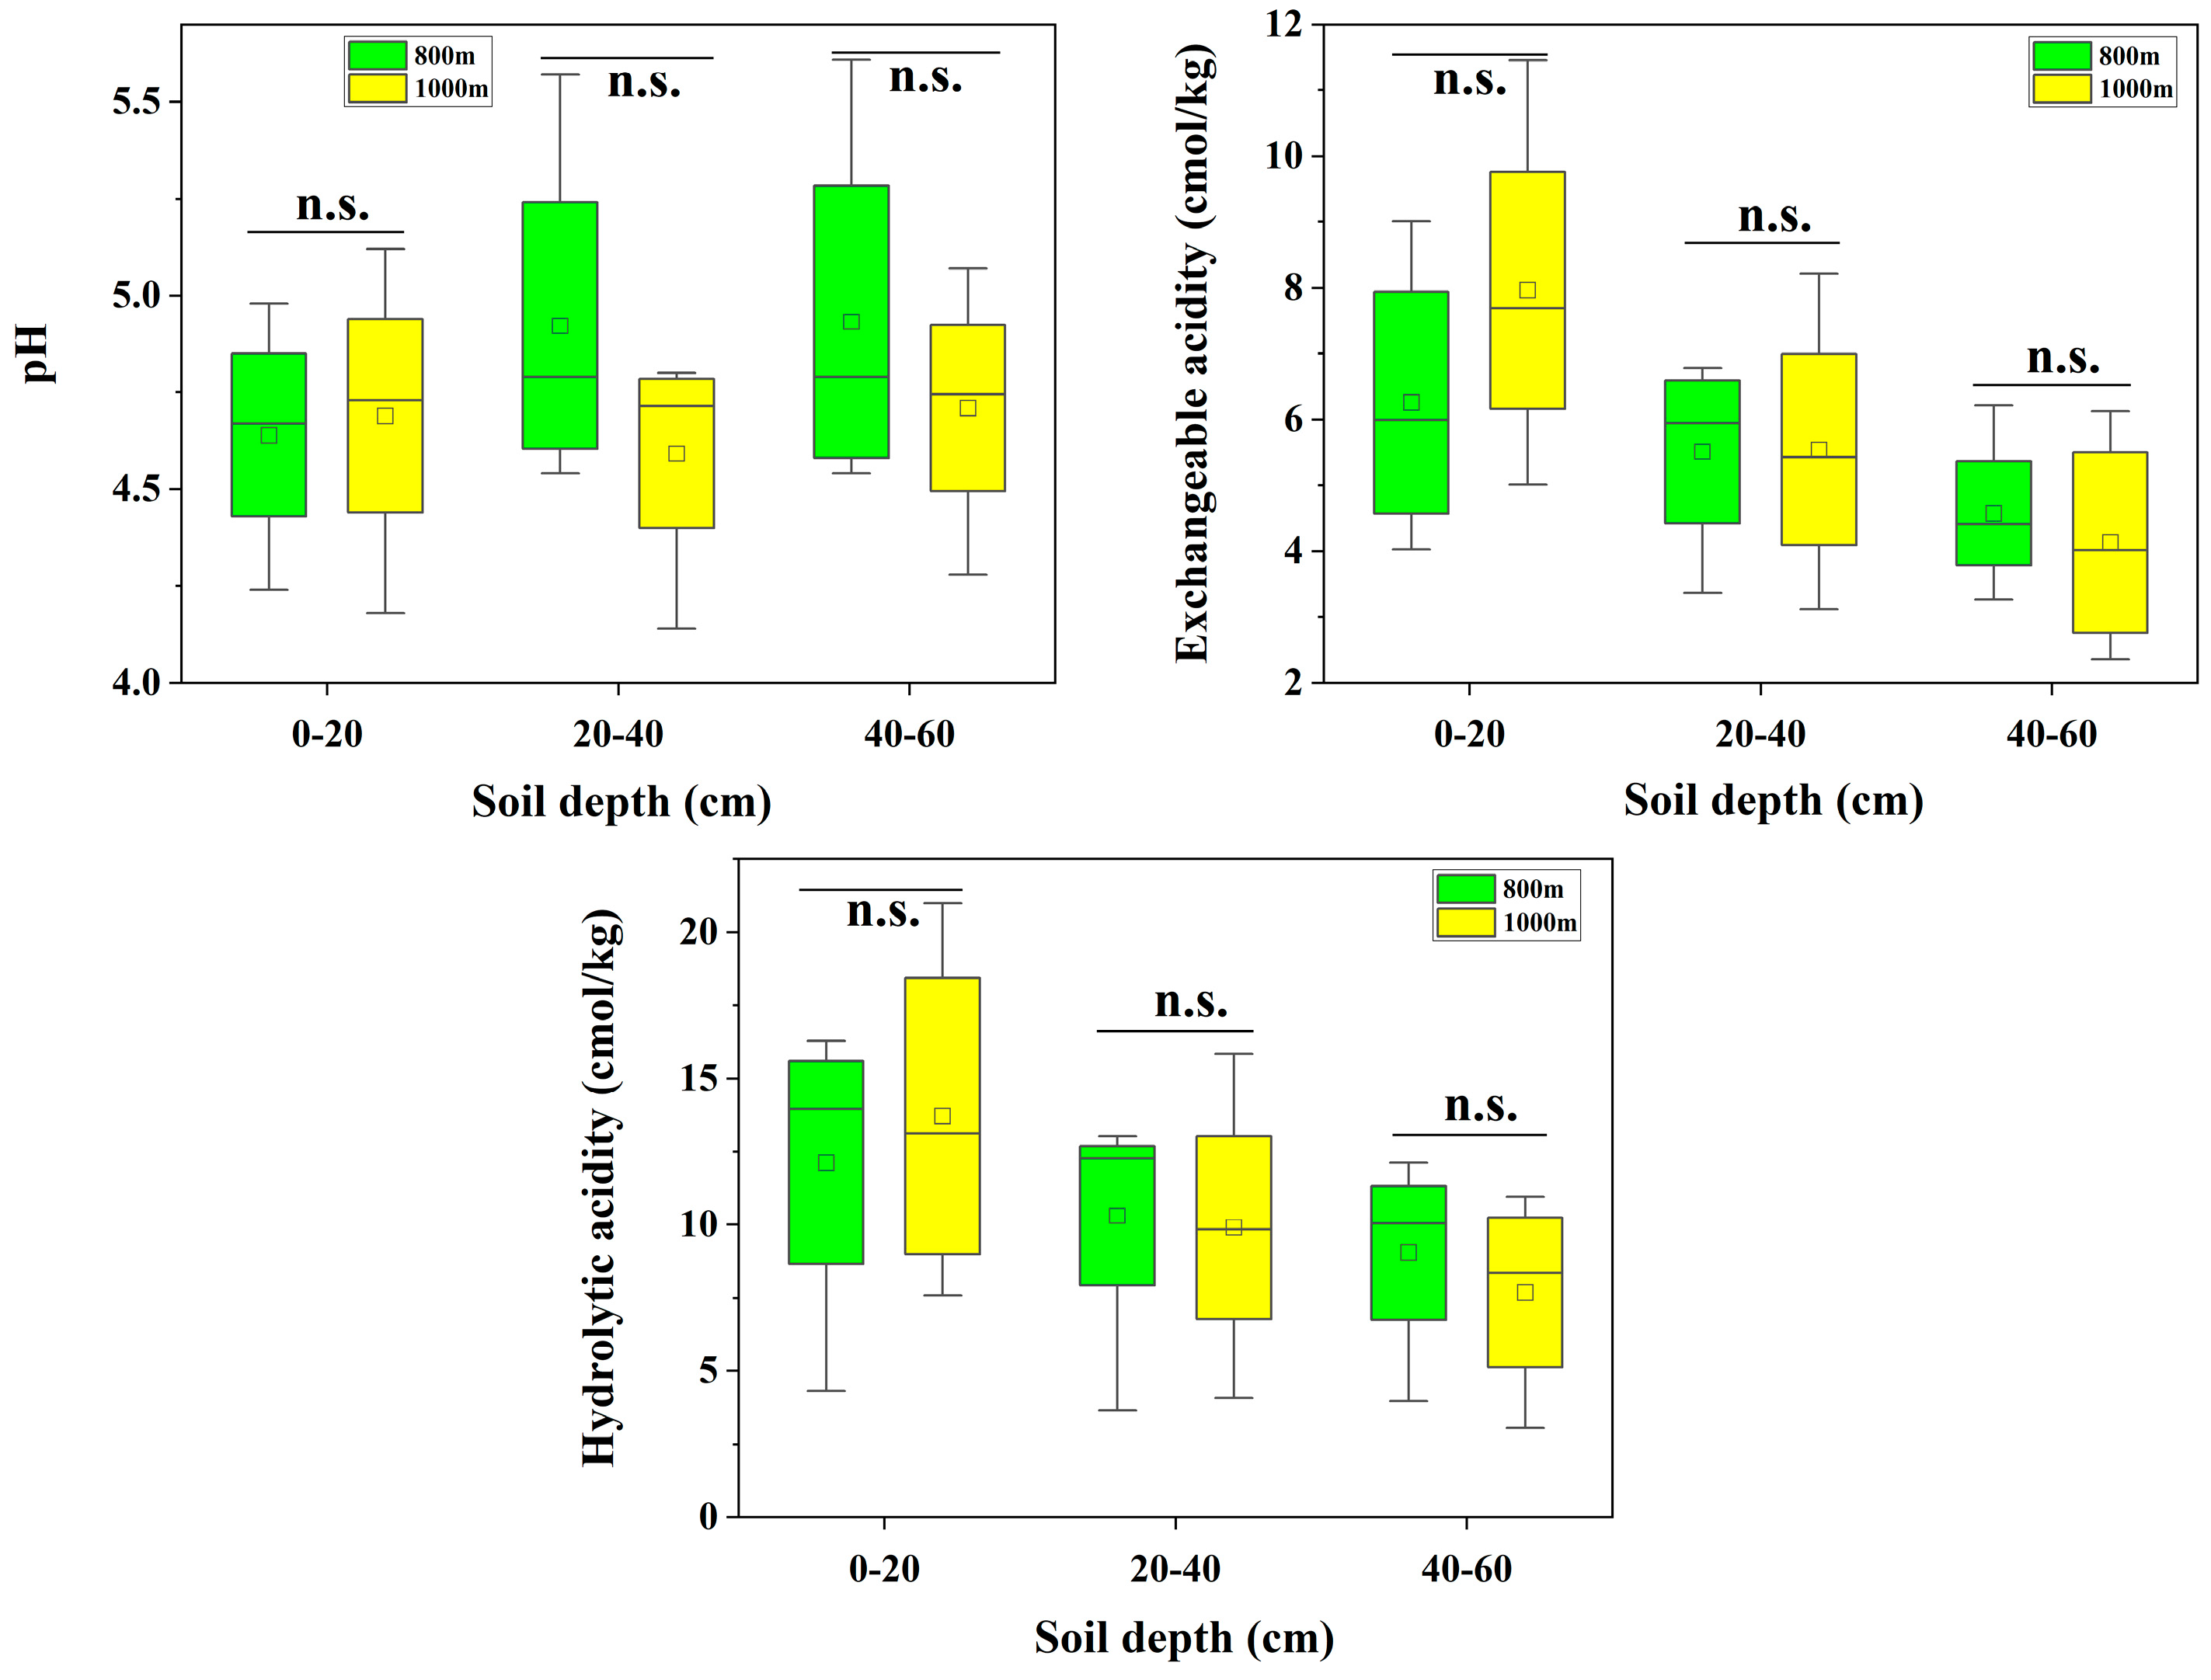
Additionally, for the different depth soils in WYL, with the increase in altitude, the mean values of soil pH were 4.64 and 4.69 (800 and 1000 m) for 0–20 cm, 4.92 and 4.59 (800 and 1000 m) for 20–40 cm, and 4.93 and 4.71 (800 and 1000 m) for 40–60 cm. With the increase in altitude, the mean exchangeable acidity of 0–20, 20–40, and 40–60 cm soils were 6.26 and 7.96 (800 and 1000 m), 5.51 and 5.54 (800 and 1000 m); and 4.58 and 4.13 cmol/kg (800 and 1000 m), respectively. With increasing altitude, the mean values of hydrolytic acid of 0–20, 20–40, and 40–60 cm soils were 12.13 and 13.71 (800 and 1000 m), 10.31 and 9.91 (800 and 1000 m), and 9.04 and 7.69 cmol/kg (800 and 1000 m), respectively. Similar to the forest soil of DLS, there were no significant differences in the mean soil pH and exchangeable and hydrolytic acidities at different altitudes (800 and 1000 m) (Figure 6).
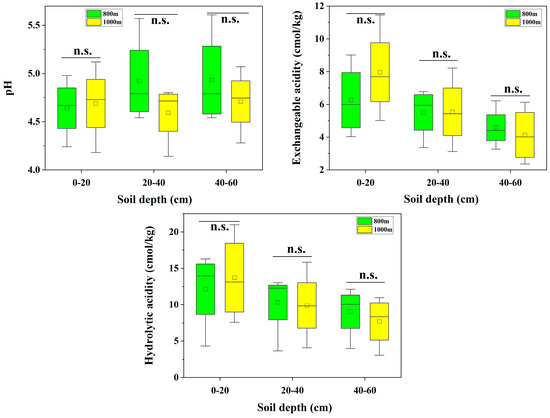
Figure 6.
Relationships among pH, exchangeable acidities, and hydrolytic acidities of forest soils of different layers and altitudes in WYL. n.s. indicates no significant difference.
3.3. Soil Acidification in Forest Soils of Different Plant Types in the Study Area
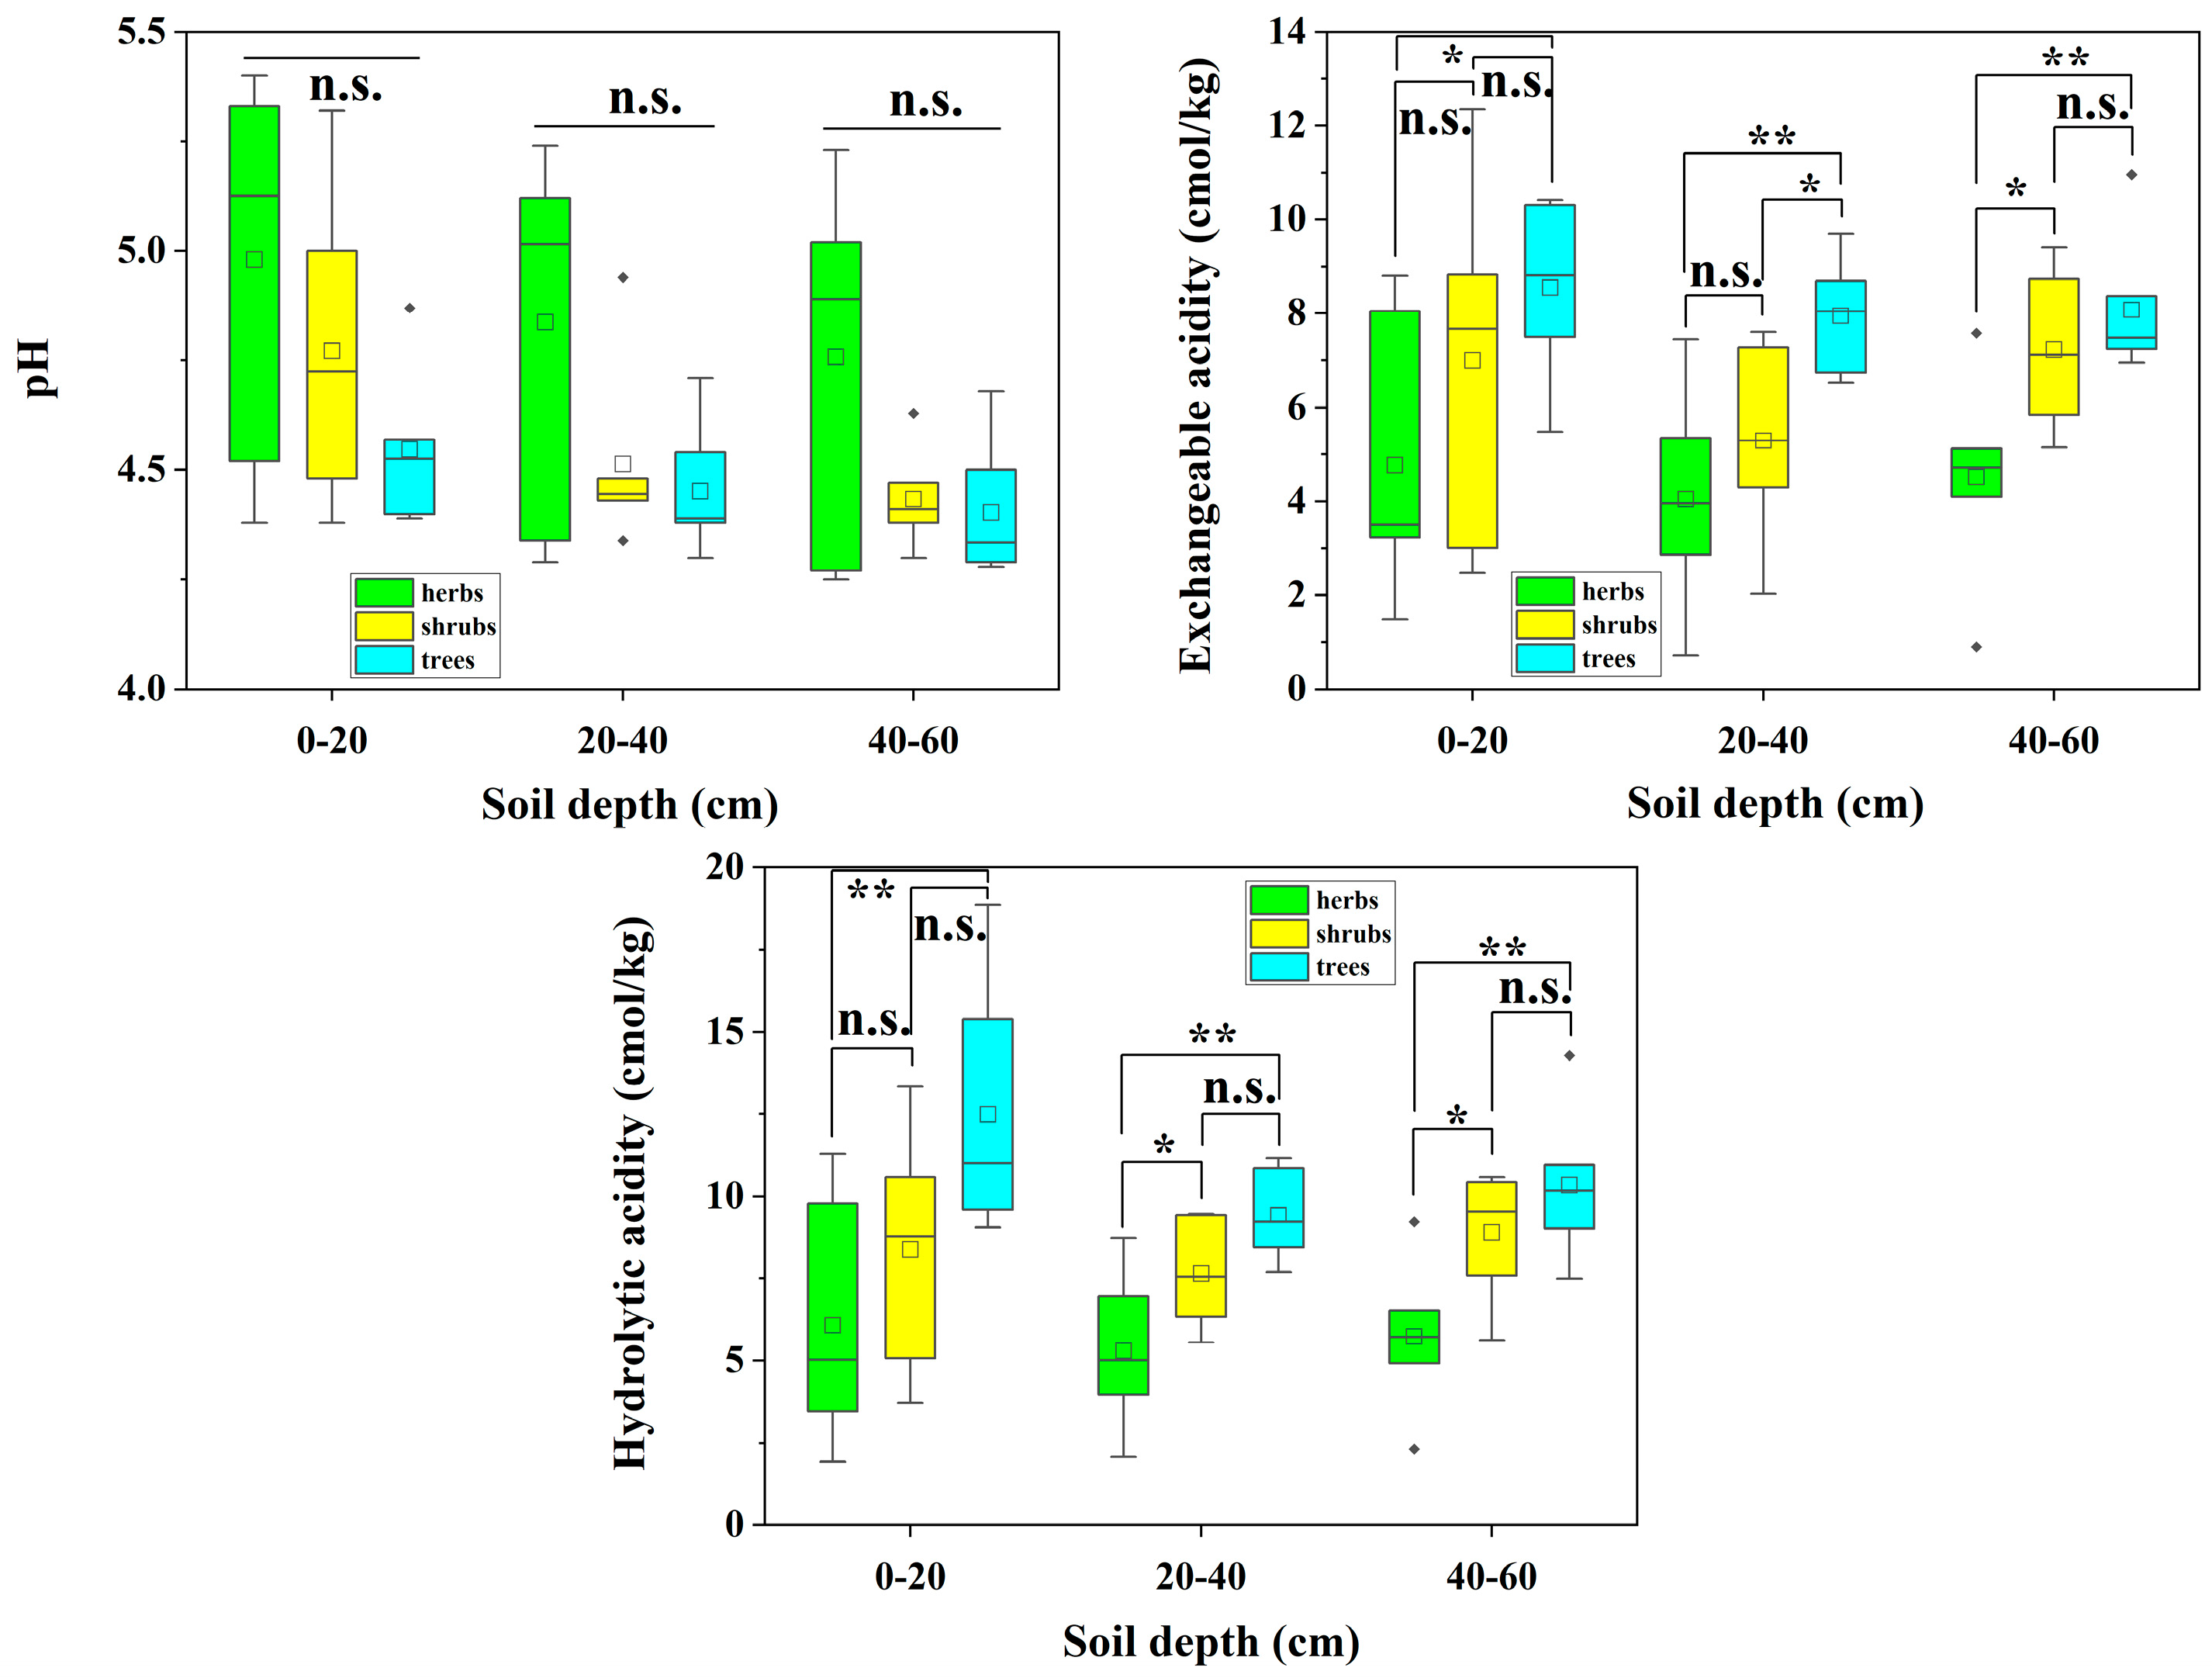
For DLS, the mean soil pH values under herbs, shrubs, and trees were 4.98, 4.77, and 4.55 at 0–20 cm; 4.84, 4.51, and 4.45 at 20–40 cm; and 4.76, 4.43, and 4.40 at 40–60 cm, respectively. There were no significant differences in the mean soil pH values among the plant types (i.e., herbs shrubs, and trees). Combined with the median and upper and lower quartiles, the soil pH was the highest under herbaceous conditions, second highest under shrubs, and lowest under trees. The mean values of soil exchangeable acidity under herbs, shrubs, and trees were 4.77, 7.00, and 8.55 cmol/kg, respectively, at soil depths of 0–20 cm; 4.05, 5.30, and 7.96 cmol/kg, respectively, at 20–40 cm; and 4.52, 7.23, and 8.08 cmol/kg, respectively, at 40–60 cm. At 0–20 cm soil depth, there was a significant difference (p < 0.05) between herbs and trees but no significant difference between herbs and shrubs and between shrubs and trees. There were highly significant differences (p < 0.01) between herbs and trees at 20–40 and 40–60 cm soil depths. However, there were no significant differences between herbs and shrubs. Significant differences were noted between shrubs and trees at 20–40 cm soil depth (p < 0.05), and significant differences were noted between herbs and shrubs at 40–60 cm soil depth (p < 0.05). However, no significant difference was noted between shrubs and trees. Regarding hydrolytic acidity, the mean values of soil hydrolytic acidity under herbs, shrubs, and trees were 6.08, 8.38, and 12.49 cmol/kg, respectively, at 0–20 cm; 5.29, 7.64, and 9.43 cmol/kg, respectively, at 20–40 cm; and 5.73, 8.89, and 10.35 cmol/kg, respectively, at 40–60 cm. At 0–20 cm soil depth, there was a highly significant difference (p < 0.01) between herbs and trees but no significant difference between herbs and shrubs or between shrubs and trees. At soil depths 20–40 and 40–60 cm, there were highly significant differences (p < 0.01) between herbs and trees and significant differences (p < 0.05) between herbs and shrubs, but no significant differences between shrubs and trees (Figure 7).
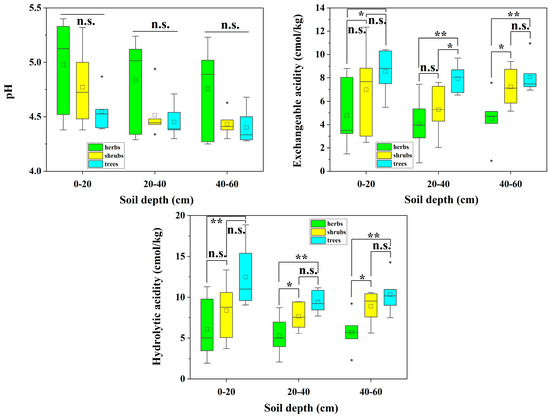
Figure 7.
Relationships among soil pH, exchangeable and hydrolytic acidities, and plant types in different layers of forest soils in DLS. * indicates a significant difference at the 0.05 level; ** indicates a significant difference at the 0.01 level; n.s. indicates no significant difference.
Regarding the mean pH as well as the exchangeable and hydrolytic acidities of at different depth soils in WYL, there were significant differences between plant types. In general, soil acidity was significantly stronger in soils under trees than soils under herbs and shrubs (Table 2).
Table 2.
Relationships among soil pH, exchangeable and hydrolytic acidities, and plant types in different layers of forest soils in WYL.
3.4. Soil Acidification in Forest Soils from Different Slope Orientations in the Study Area
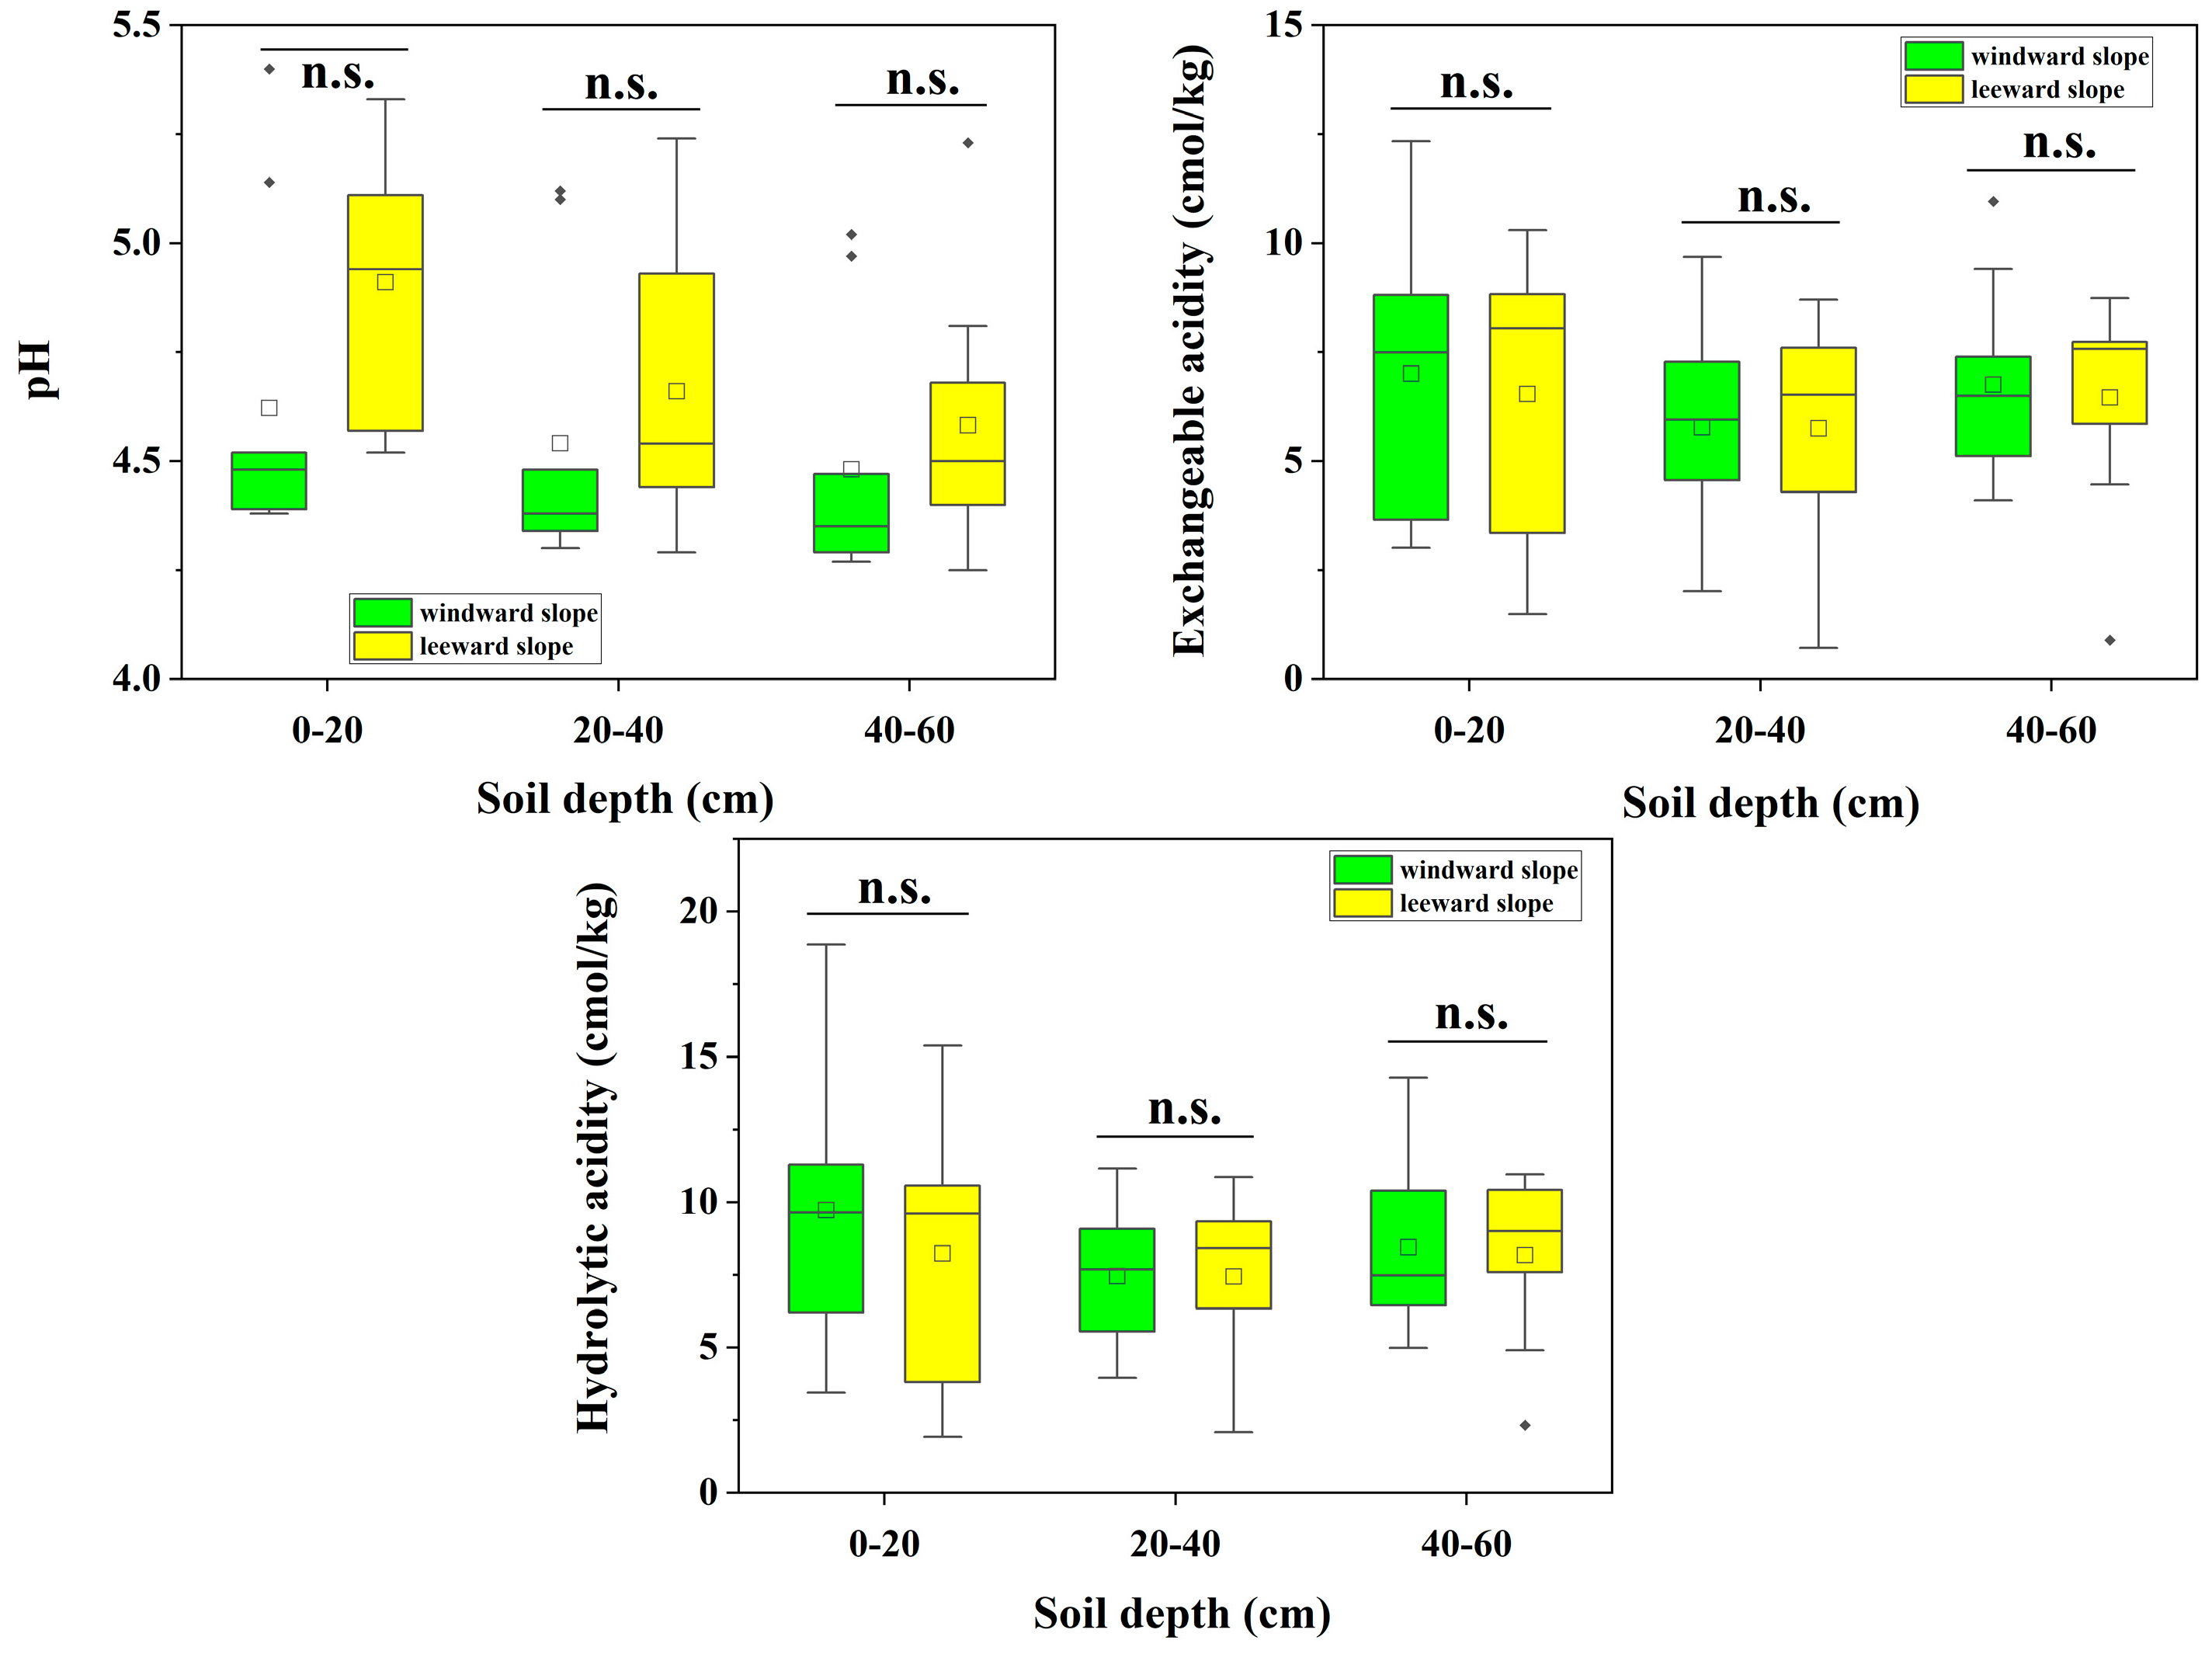
For the different depth soils in DLS, the mean values of pH for the windward slope and leeward slope soils were 4.62 and 4.91 at 0–20 cm; 4.54 and 4.66 at 20–40 cm; and 4.48 and 4.58 at 40–60 cm, respectively. The mean values of exchangeable acidity for the windward and leeward slopes by soil depth were 7.00 and 6.54 cmol/kg at 0–20 cm; 5.78 and 5.76 cmol/kg at 20–40 cm; and 6.76 and 6.46 cmol/kg at 40–60 cm, respectively. The mean values of hydrolytic acidity for the windward and leeward slopes by soil depth were 9.73 and 8.24 cmol/kg at 0–20 cm; 7.46 and 7.45 cmol/kg at 20–40 cm; and 8.46 and 8.19 cmol/kg at 40–60 cm, respectively. There were no significant differences in mean soil pH, mean exchangeable acid, and hydrolytic acidity between different slope directions (windward and leeward slopes). However, for mean values, soil pH was lower on windward slopes than on leeward slopes, and the contents of exchangeable and hydrolytic acidities were higher on windward slopes than on leeward slopes (Figure 8).

Figure 8.
Relationships among soil pH, exchangeable and hydrolytic acidities, and slope orientation in different layers of forest soils in DLS. n.s. indicates no significant difference.
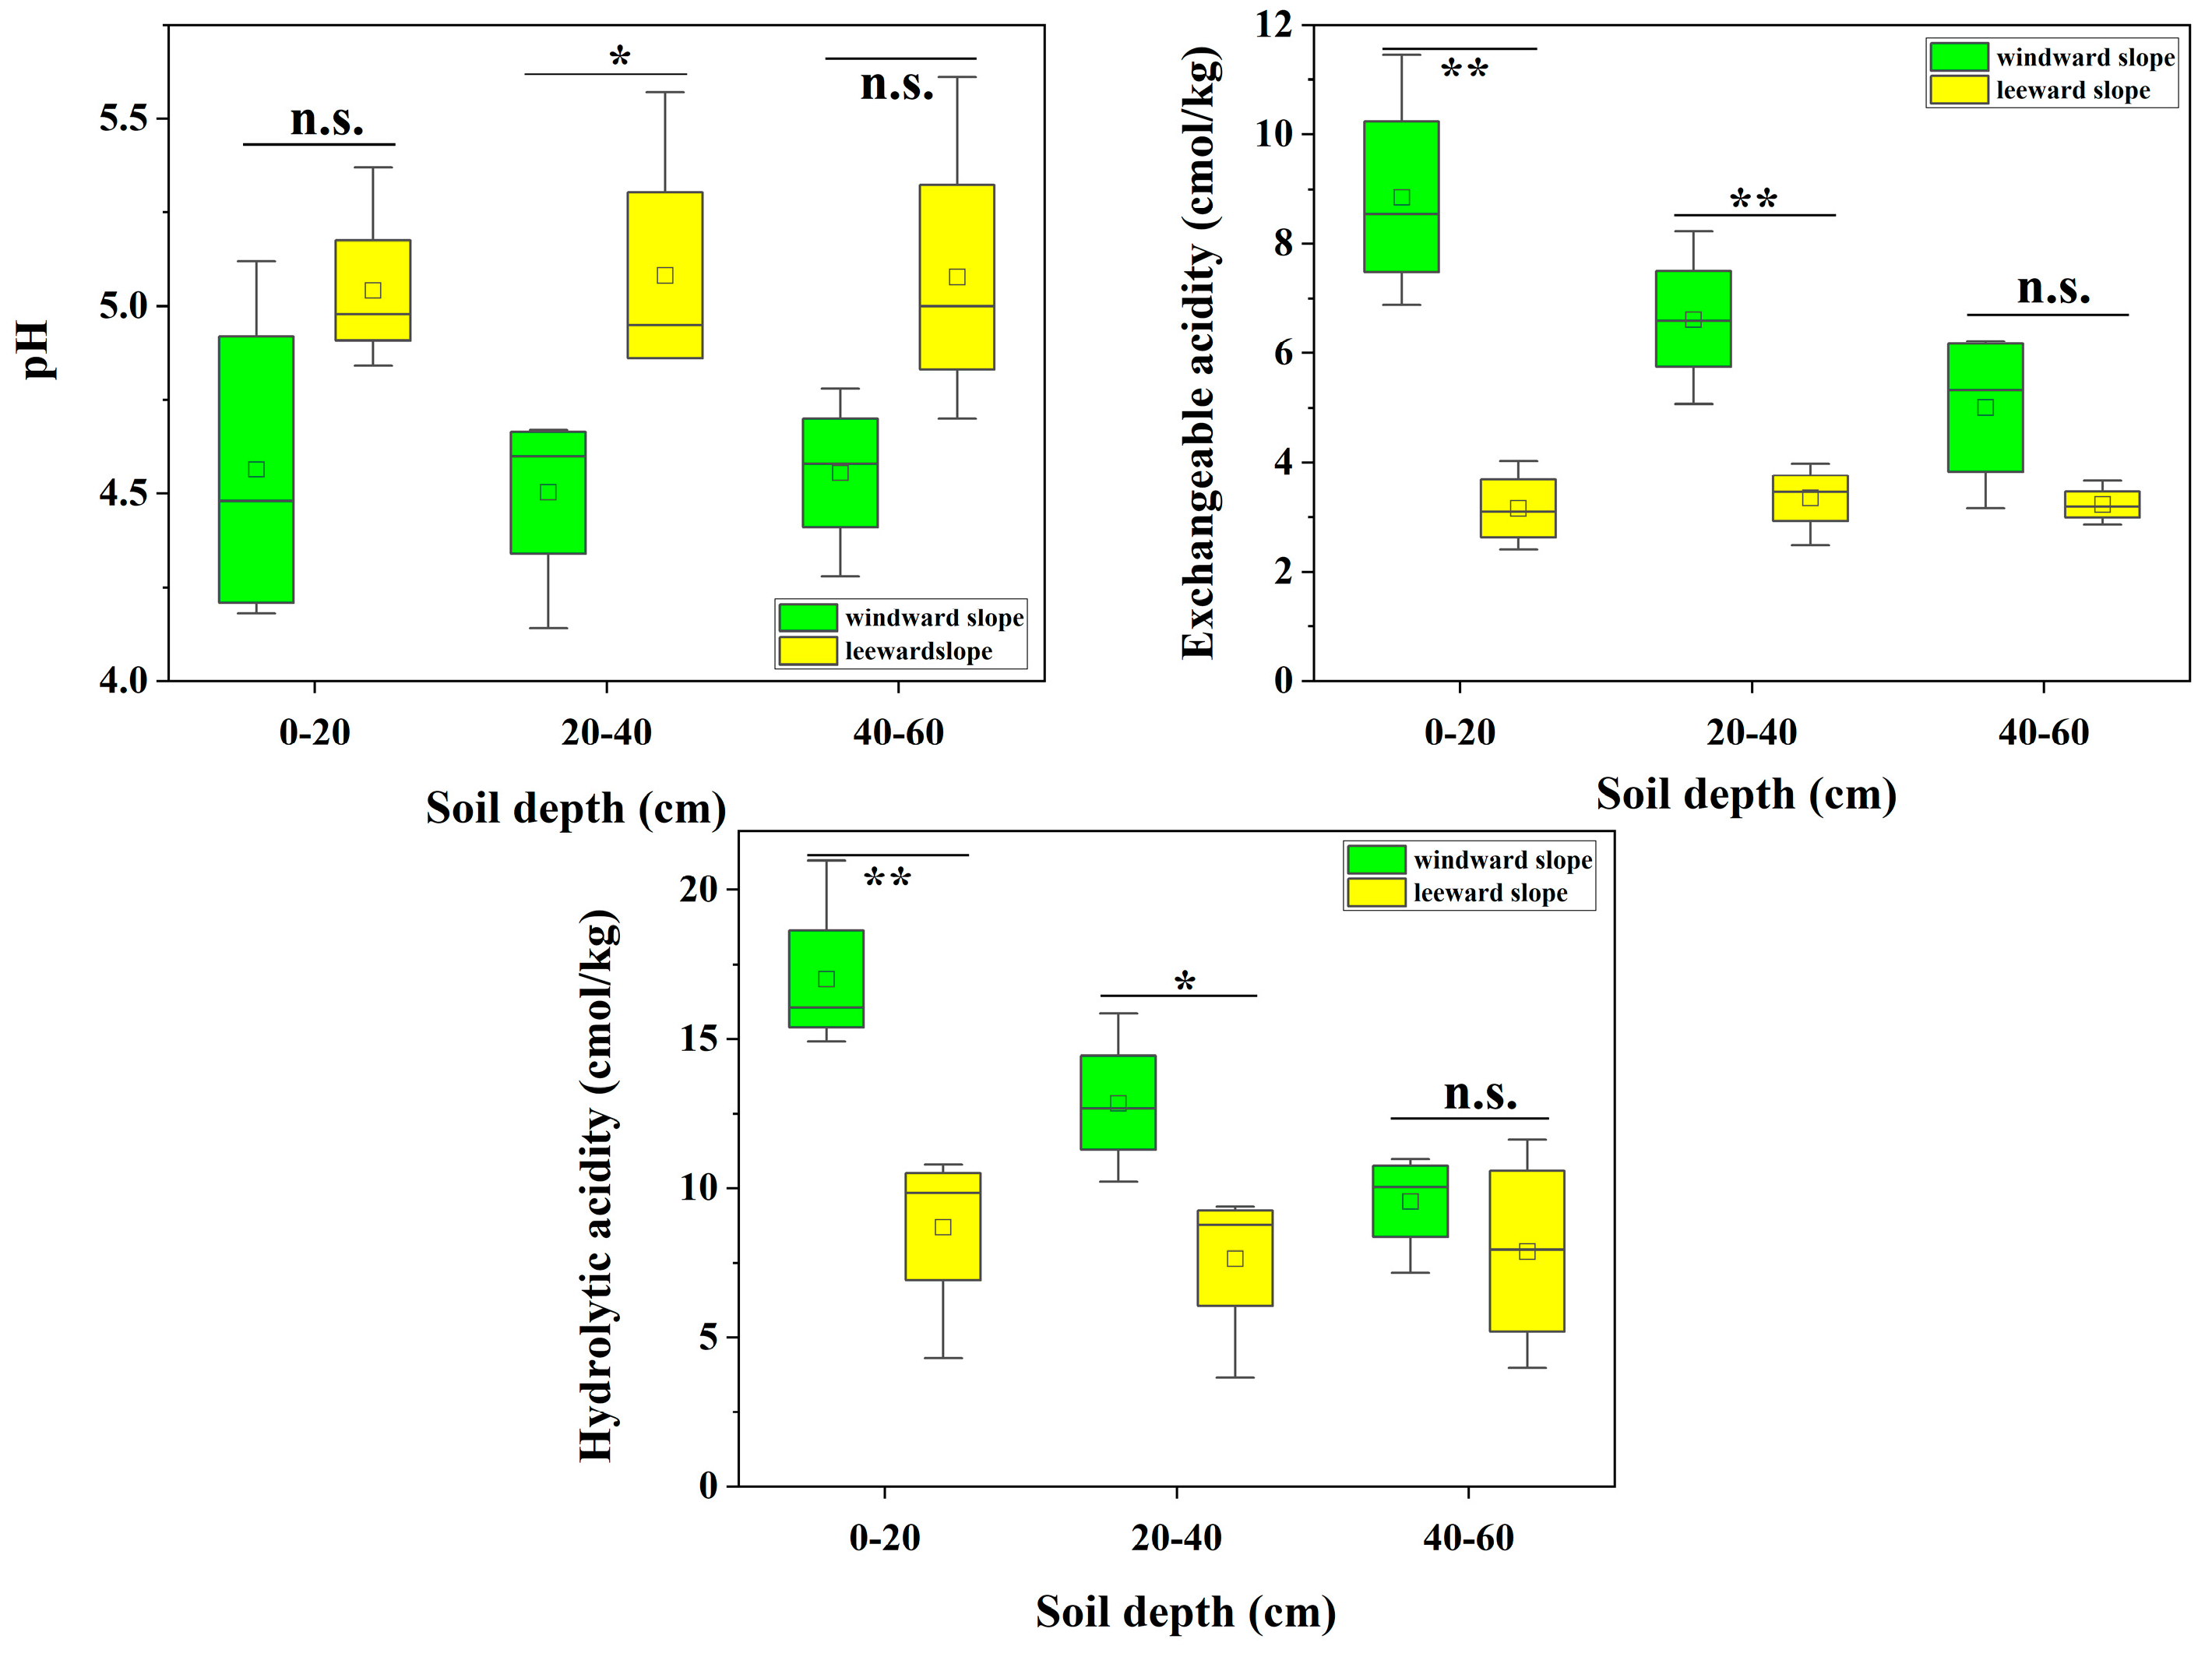
In WYL, the mean pH values under windward and leeward slopes were 4.56 and 5.04 at 0–20 cm; 4.50 and 5.08 at 20–40 cm; and 4.56 and 5.08 at 40–60 cm, respectively. The mean values of exchangeable acidity under windward and leeward slopes by soil depth were 8.86 and 3.16 cmol/kg at 0–20 cm; 6.62 and 3.34 cmol/kg at 20–40 cm; and 5.00 and 3.22 cmol/kg at 40–60 cm, respectively. The mean values of hydrolytic acidity under windward and leeward slopes by soil depth were 17.02 and 8.70 cmol/kg at 0–20 cm; 12.86 and 7.65 cmol/kg at 20–40 cm; and 9.56 and 7.88 cmol/kg at 40–60 cm, respectively. For the soils at depths of 0–20 and 40–60 cm in WYL, there was no significant difference between the windward and leeward slopes, but the difference between the windward and leeward slopes was significant (p < 0.05) at soil depth 20–40 cm. For exchangeable acid, there was a highly significant difference (p < 0.01) between the windward and leeward slopes at soil depths of 0–20 and 20–40 cm soils, and there was no significant difference between the windward and leeward slopes at 40–60 cm soil depth. For hydrolytic acid, there was a highly significant difference (p < 0.01) between the windward and leeward slopes at 0–20 cm soil depth, a significant difference (p < 0.05) between the windward and leeward slopes at 20–40 cm soil depth, and no significant difference between the windward and leeward slopes at 40–60 cm soil depth (Figure 9).
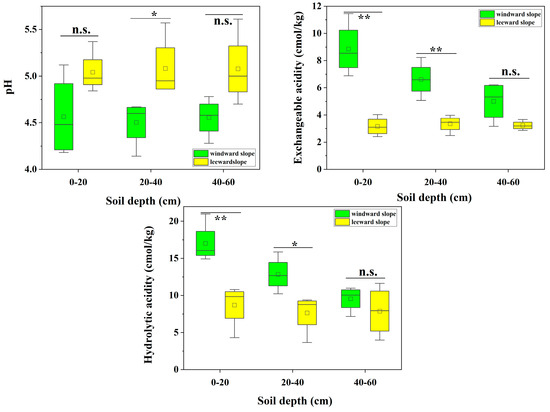
Figure 9.
Relationships among soil pH, exchangeable and hydrolytic acidities, and slope orientation in different layers of forest soils in WYL. * indicates a significant difference at the 0.05 level; ** indicates a significant difference at the 0.01 level; n.s. indicates no significant difference.
3.5. Relationship between Forest Soil Acidity Indexes and Soil Physicochemical Properties
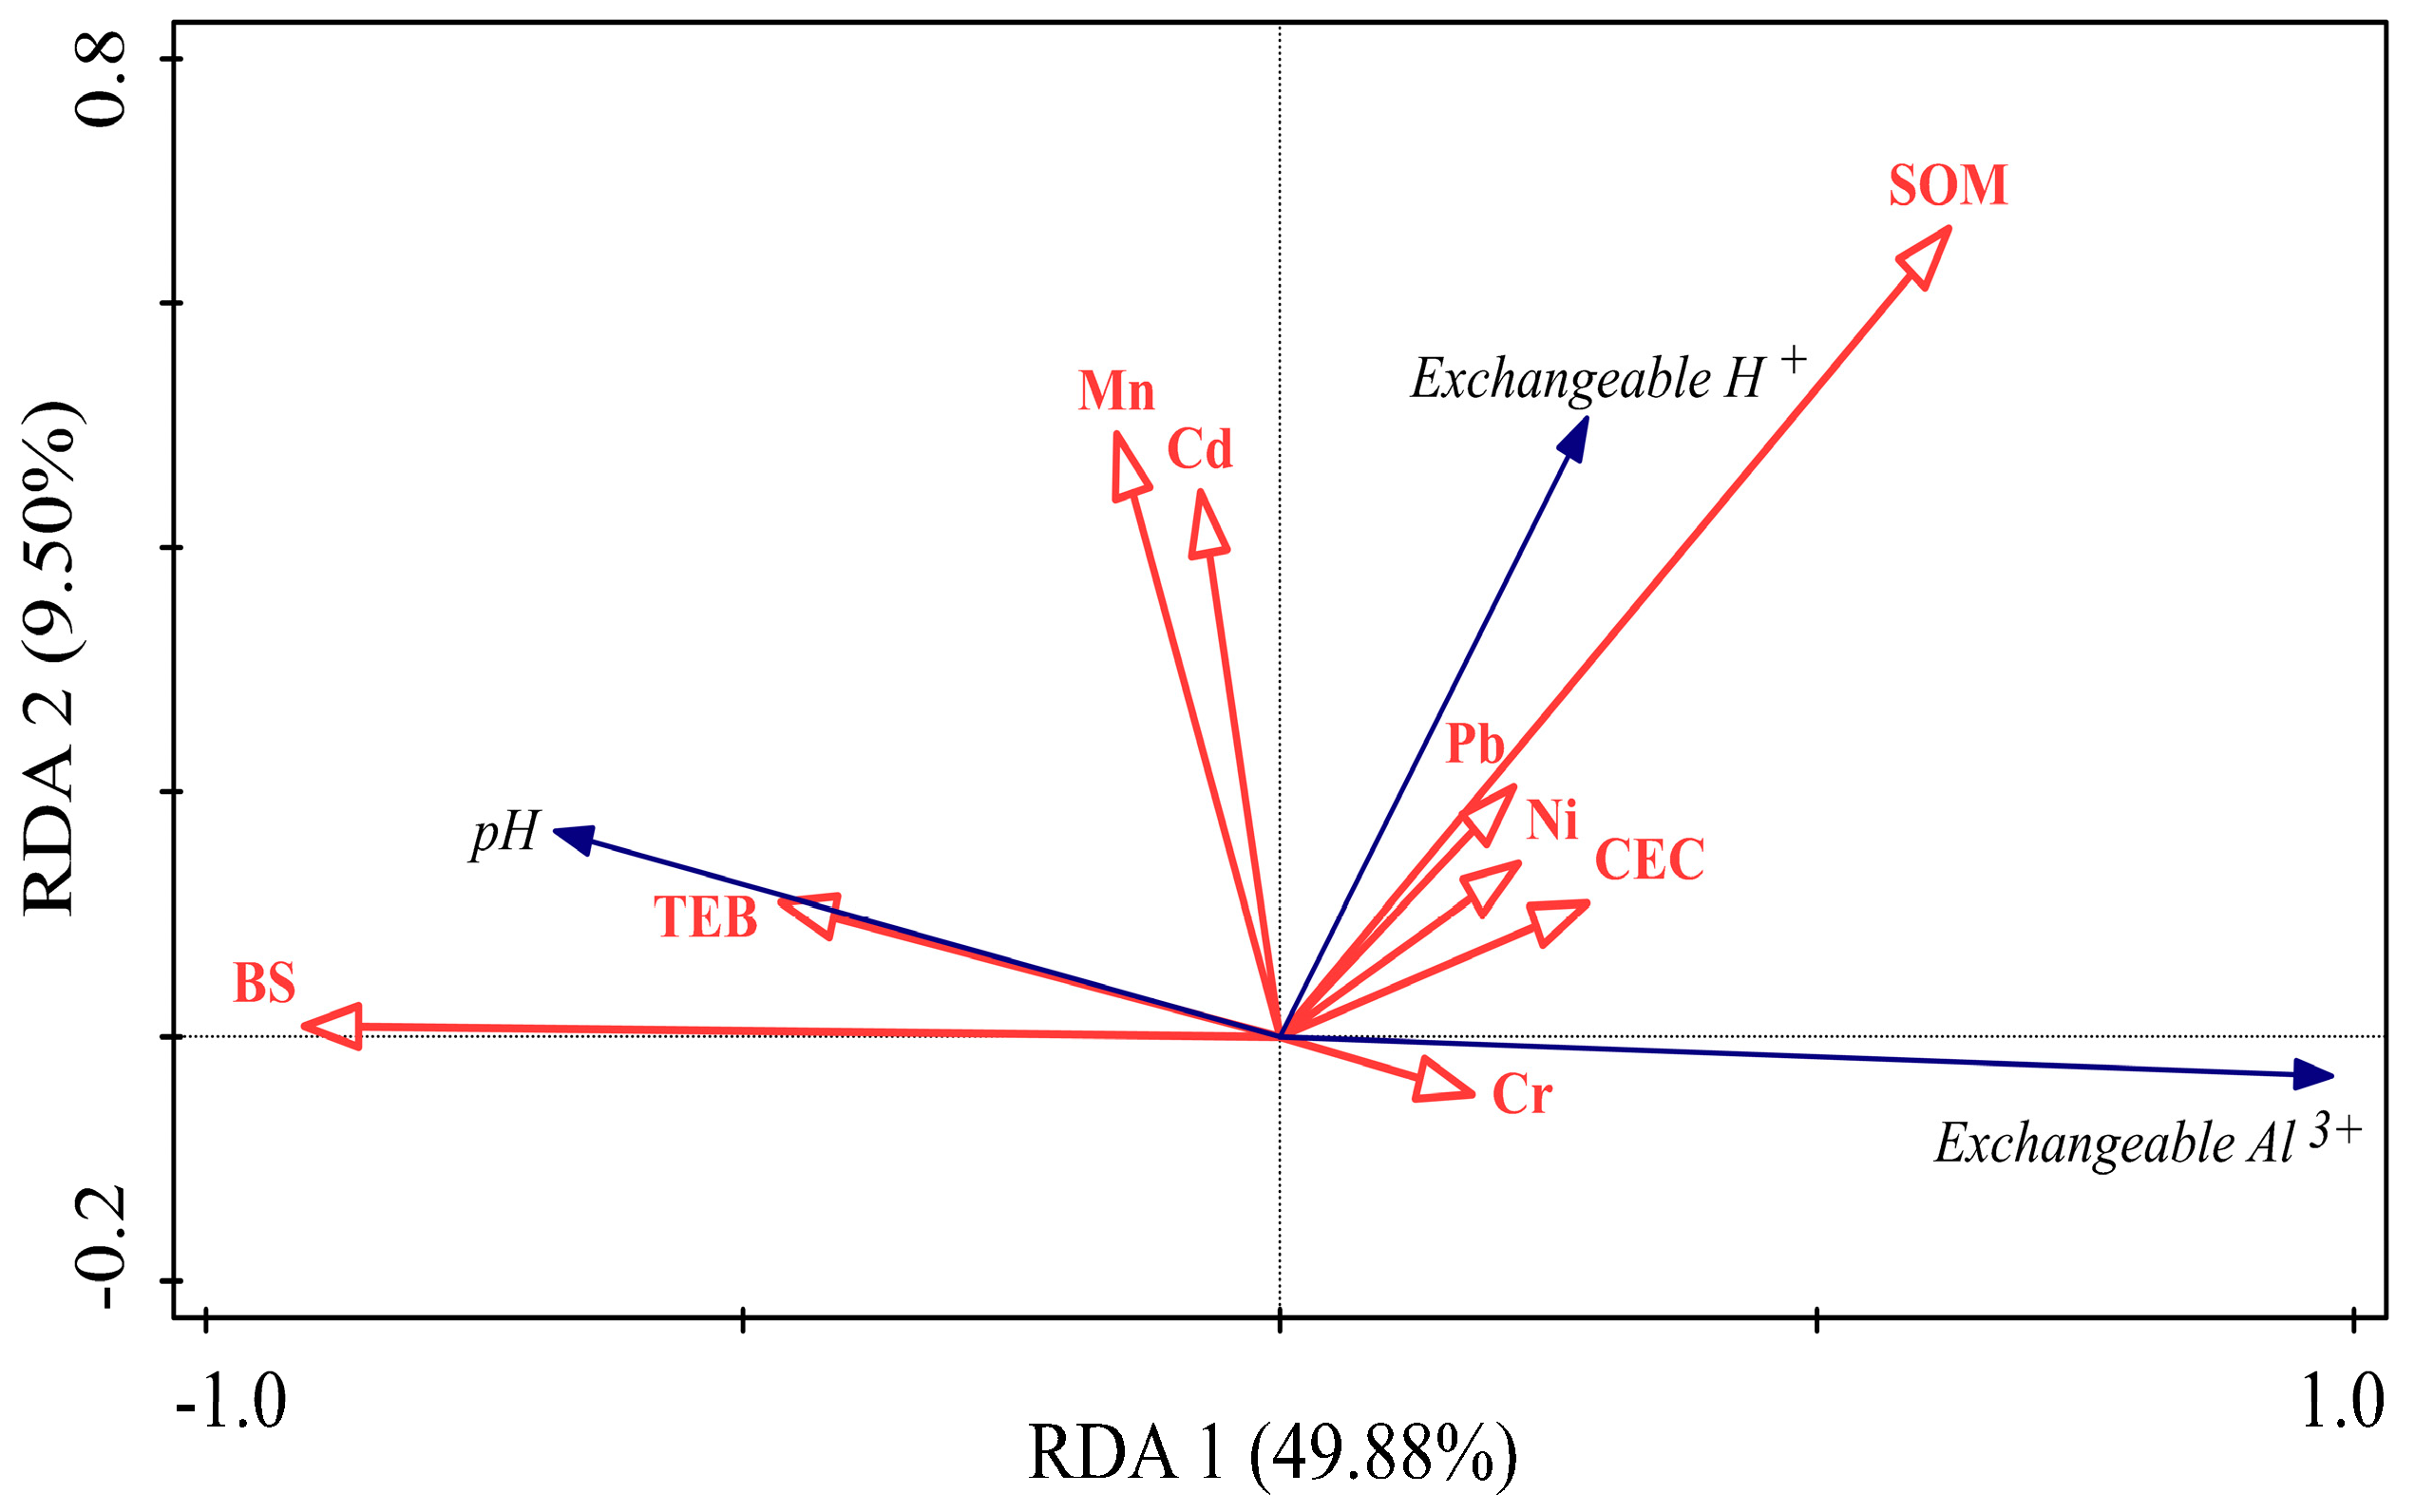
Redundancy analysis (RDA) was used to study the relationship between soil acidity indexes and soil physicochemical properties. The DLS data showed that the cumulative explained variances of the first and second axes were 49.88% and 9.50%, respectively, and the total explained variance was 59.38%. The main environmental factors affecting soil acidity index were BS and SOM. Soil pH showed a strong positive correlation with BS. Soil pH showed negative correlations with active state Cr, Ni, and Pb and positive correlations with the remaining metals (Supplementary Table S7) (Figure 10).

Figure 10.
Relationship between soil acidity indexes (blue lines) and soil physicochemical properties (red lines) in DLS.
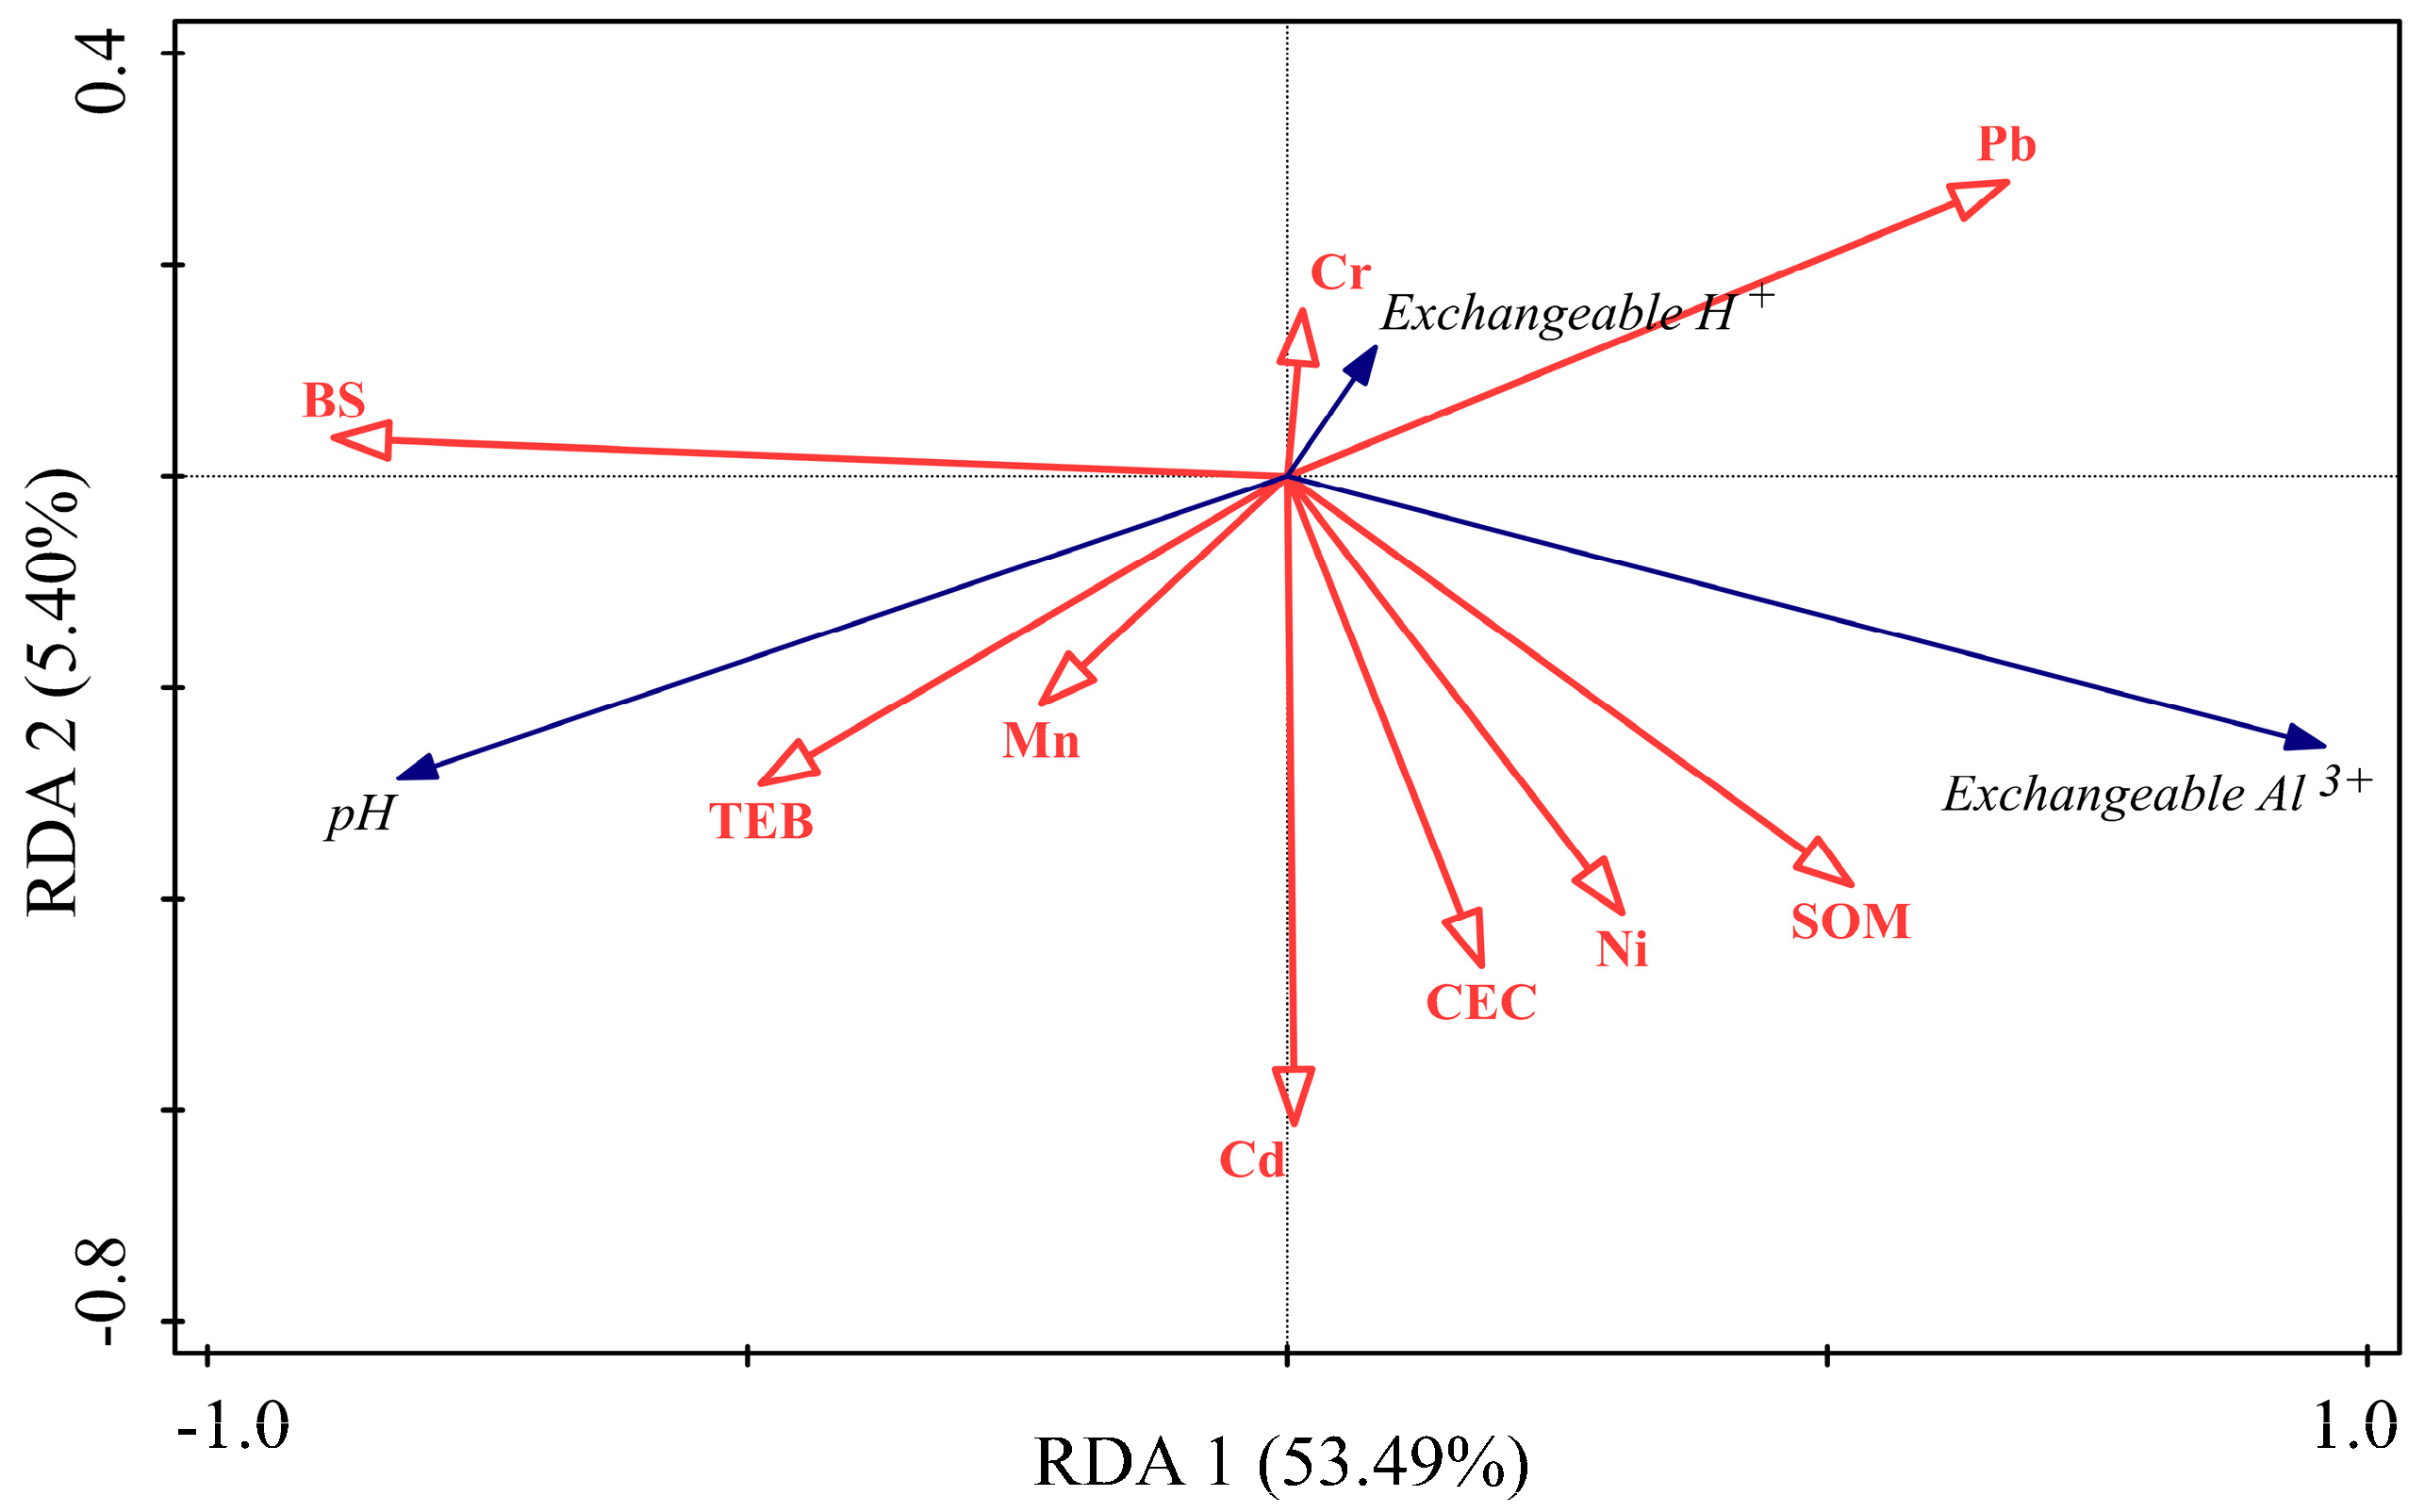
For WYL, the data showed that the cumulative explained variance of the first and second axes were 53.49% and 5.40%, respectively, and the total explained variance was 58.89%. The main environmental factors affecting soil acidity indexes were BS and TEB. Similar to the DLS soil, the pH of the WYL soil showed a strong positive correlation with the degree of BS. Soil pH showed negative correlations with active state Cr, Ni, and Pb and positive correlations with the remaining metals (Supplementary Table S8) (Figure 11).
Figure 11.
Relationship between soil acidity indexes (blue lines) and soil physicochemical properties (red lines) in WYL.
4. Discussion
4.1. Differential Analysis of Soil Acidification in Different Layers of Forest Soil in Two Forest Sites
For soil pH, exchangeable, and hydrolytic acidities, with an increase in soil depth, the degree of soil acidification in the two forested areas tended to decrease, and the pH of the DLS soil decreased with soil depth. Overall, the surface soil was more acidified, as indicated in most studies [26,27]. The reason may be that topsoil is more susceptible to the disturbance of acid deposition, hastening the loss of salt-based ions and deepening the acidification [6]. The difference in acidification between the two forested areas was relatively small in soil pH, with a relatively large range of soil pH for DLS and a more concentrated pH for WYL. For the same area, the difference of soil acidification may be due to the differences in tree species. Studies have shown that the degree of forest soil acidification differs for different tree species [28]. This phenomenon has also been demonstrated in related studies, where the pH of the top soil in deciduous forests was significantly higher than that in spruce forests [26]. Additionally, forest ecosystems and anthropogenic factors, among others, may contribute to differences in the acidification of forest soils. The disturbance of forest soils by human activities, such as logging and clearing, can lead to soil erosion and degradation, which can reduce the organic matter content in soil [29] and decrease the acid-buffering capacity of forest soils [30]. An explanation for the two forest lands showing different acidification trends might be that there are more intense anthropogenic activities (e.g., agricultural cultivation) in DLS than in WYL, and the latter is in a more natural state and less affected by anthropogenic activities.
4.2. Differential Analysis of Forest Soils at Different Elevations and with Different Plant Types and Slope Orientations in Two Forest Sites
Acidification showed different trends at different altitudes, considering different soil depths; however, soil acidification was higher at higher altitudes than at lower altitudes. At lower altitudes, there was an increase in acidification with increasing altitude. This may be because the reduction in tall trees with increasing altitude leads to an increase in the leaching effect of acid rain. Additionally, the canopy of tall trees generally has a better buffering effect on acid rain. As altitude increases and the number of tall trees decrease, the buffering effect of the canopy weakens, leading to soil acidification increasing with altitude. Researchers have shown that the presence of a mature spruce forest canopy can reduce atmospheric acid deposition by 27–28% [31]. Regarding different plant types, forest soil acidification was most severe under trees, followed by shrubs and herbs. Trees generally have a more developed root system than shrubs and herbs, and the root system of trees continuously absorbs salt-based cations. The root secretion contains a large number of acidic substances, resulting in the most serious acidification of forest soils under trees. The plant root system is an important source of organic acids in forest soils [32,33]; in the process of nutrient uptake by certain plants, the plant root system can be utilized to release additional organic acids into the forest soil, balancing the uptake of excessive salt-based ions (e.g., Ca2+, Mg2+, and K+) [2]. This process increases the depletion of salt-based ions in the forest soil and increases the concentration of exchangeable H+ in the forest soil, intensifying the acidification of the forest soil [34]. Simultaneously, trees produce more dead leaves, and the decay of dead leaves produces more organic acids, which can also lead to enhanced acidification. Although the canopy of tall trees has a buffering effect on acid rain, the buffering effect of the canopy is limited compared with the large amount of acid rain and organic acids. Regarding different slope orientations, windward slopes generally receive more precipitation than leeward slopes, leading to enhanced acid rain leaching. A related study showed that under conditions of heavy precipitation in southwestern Japan, the chemical properties of cedar forest soils changed markedly, with a significant decrease in pH and exchangeable cations in the topsoil layer over time [35]. Moreover, the windward slopes were relatively lush with plants, producing more organic acids.
Different elevations, plant types, and slope orientations exhibited this variation; however, whether acidification changes over larger time scales than those investigated in this study remains poorly understood.
4.3. Analysis of the Relationship between Forest Soil pH and Soil Physicochemical Properties
For both woodlands, forest soil pH had a greater effect on exchangeable Al3+ than on exchangeable H+, mainly affecting the amount of exchangeable Al3+. In the long term, the growth of trees within woodlands may be seriously threatened because Al toxicity affects the growth and development of trees, which may lead to the death of trees within the woodland [36]. The reason for acidification of forest soils is related to the high or low level of salinity ions. This phenomenon can lead to a large amount of leaching of salinity ions under the action of acid deposition [13], which can lead to acidification of forest soils. Thus, the stronger the acidification, the lower the total exchangeable salt base, which leads to lower salt base saturation. Soil organic matter makes an important contribution to the acid-buffering capacity of the soil. Soil organic matter plays an important role in cation exchange and the complexation of metal cations, and the accumulation of soil organic matter becomes critical for acid buffering.
Much of the research on the effects of forest soil acidification on active heavy metal has used simulation experiments to explore how active heavy metals change with increasing acidification by enhancing acid concentrations. Soil acidification increases the potential mobility and bioavailability of Cu and Pb [21]. Few studies have explored the relationship between soil pH and active heavy metals in forest soils not stimulated by external acidification. However, based on the relationship between soil pH and active heavy metals in the two forest sites, the two forest sites showed the same trend. The active states of Cr, Ni, and Pb decreased with an increase in soil pH. These findings indicate that with an increase in acidification intensity, the activities of the active states of Cr, Ni, and Pb were enhanced, and there was a highly significant difference between the soil pH and the active state Pb values of the WYL forest. The active states of Mn and Cd increased with increasing pH, and there was a significant difference between forest soil pH and the active state of Mn in DLS.
5. Conclusions
This study considered different elevations, plant types, slope directions, and spatial scales in DLS and WYL. The results showed that forest soil acidification was more serious in DLS than in WYL, with forest soil pH ranging from 4.10 to 6.00 in DLS and from 4.14 to 5.71 in WYL. The two forested soils were dominated by strongly acidic soils. The surface soils were more susceptible to disturbances from environmental factors. In general, the two forests had severe surface soil acidification.
With the increase in altitude, the soil of the different forest layers in the two woodlands showed deepening acidification. This study combined different plant types and slope directions. The results showed that the most serious acidification was in the soil of forests under trees, followed by shrubs and herbs, and the severity of acidification of the soil of forests on windward slopes was greater than that on leeward slopes.
RDA results between forest soil acidity indicators and soil physicochemical properties in the two forest sites showed that the main environmental factor affecting soil acidity indicators was BS, and soil pH and active state Cr, Ni, and Pb showed negative correlations in both forest sites. The study of forest soil acidification in the two woodlands is of substantial significance to the woodland flora and fauna, contributing to the sustainable development of the forest ecosystem.
Supplementary Materials
The following supporting information can be downloaded at: https://www.mdpi.com/article/10.3390/su16167051/s1, Figure S1: Photographs of soil profiles of portions of DLS (left) and WYL (right); Tables S1–S8: pH value of each point in DLS; pH value of each point in WYL; Exchangeable acidity at each point of DLS; Exchangeable acidity at each point of WYL; Hydrolytic acidity at each point of DLS; Hydrolytic acidity at each point of WYL; Active heavy metal data of different samples from DLS; Active heavy metal data of different samples from WYL.
Author Contributions
Conceptualization, H.C. and J.Z.; methodology, H.C.; software, Y.Z.; validation, H.C., J.Z. and H.R.; formal analysis, Y.Z.; investigation, Y.Z.; resources, H.C.; data curation, Y.Z.; writing—original draft preparation, Y.Z.; writing—review and editing, Y.Z.; visualization, Y.Z.; supervision, H.C., J.Z. and H.R.; project administration, H.C.; funding acquisition, H.C. All authors have read and agreed to the published version of the manuscript.
Funding
This study was funded by Science and Technology Department of Zhejiang Province (No. 2019C54002) and supported by the Master’s Innovation Foundation of Wenzhou University (No. 3162024004094).
Institutional Review Board Statement
The study did not require ethical approval.
Informed Consent Statement
Not applicable.
Data Availability Statement
Data on the results of the study were provided in the Supporting File and were marked in the article.
Conflicts of Interest
The authors declare no conflict of interest.
References
- Huang, J.; Mo, J.; Zhang, W.; Lu, X. Research on acidification in forest soil driven by atmospheric nitrogen deposition. Acta Ecol. Sin. 2014, 34, 302–310. [Google Scholar] [CrossRef]
- Gruba, P.; Mulder, J. Tree species affect cation exchange capacity (CEC) and cation binding properties of organic matter in acid forest soils. Sci. Total Environ. 2015, 511, 655–662. [Google Scholar] [CrossRef] [PubMed]
- Zhu, Q.; De Vries, W.; Liu, X.; Zeng, M.; Hao, T.; Du, E.; Zhang, F.; Shen, J. The contribution of atmospheric deposition and forest harvesting to forest soil acidification in China since 1980. Atmos. Environ. 2016, 146, 215–222. [Google Scholar] [CrossRef]
- Fujii, K.; Kanetani, S.; Tetsuka, K. Effects of volcanic parent materials on the acid buffering capacity of forest soils on Yakushima Island, Japan. Soil Sci. Plant Nutr. 2020, 66, 680–692. [Google Scholar] [CrossRef]
- Cecchini, G.; Andreetta, A.; Marchetto, A.; Carnicelli, S. Soil solution fluxes and composition trends reveal risks of nitrate leaching from forest soils of Italy. CATENA 2021, 200, 105175. [Google Scholar] [CrossRef]
- Zhang, Q.; Zhu, J.; Wang, Q.; Xu, L.; Li, M.; Dai, G.; Mulder, J.; Xi, Y.; He, N.; Dai, H. Soil acidification in China’s forests due to atmospheric acid deposition from 1980 to 2050. Sci. Bull. 2022, 67, 914–917. [Google Scholar] [CrossRef] [PubMed]
- Zarfos, M.R.; Dovciak, M.; Lawrence, G.B.; McDonnell, T.C.; Sullivan, T.J. Plant richness and composition in hardwood forest understories vary along an acidic deposition and soil-chemical gradient in the northeastern United States. Plant Soil 2019, 438, 461–477. [Google Scholar] [CrossRef]
- De Schrijver, A.; Mertens, J.; Geudens, G.; Staelens, J.; Campforts, E.; Luyssaert, S.; De Temmerman, L.; De Keersmaeker, L.; De Neve, S.; Verheyen, K. Acidification of forested podzols in North Belgium during the period 1950–2000. Sci. Total Environ. 2006, 361, 189–195. [Google Scholar] [CrossRef] [PubMed]
- Yang, J.E.; Lee, W.Y.; Ok, Y.S.; Skousen, J. Soil nutrient bioavailability and nutrient content of pine trees (Pinus thunbergii) in areas impacted by acid deposition in Korea. Environ. Monit. Assess. 2009, 157, 43–50. [Google Scholar] [CrossRef] [PubMed]
- Hopf, S.-E.; Tresch, S.; Belyazid, S.; Sverdrup, H.; Augustin, S.; Kurz, D.; Rihm, B.; Braun, S. Dendrochemical indicators of tree rings reveal historical soil acidification in Swiss forest stands. Dendrochronologia 2023, 81, 126099. [Google Scholar] [CrossRef]
- Fujii, K.; Funakawa, S.; Kosaki, T. Effects of forest management on soil acidification in cedar plantation. Geoderma 2022, 424, 115967. [Google Scholar] [CrossRef]
- Jandl, R.; Leitgeb, E.; Englisch, M. Decadal changes of organic carbon, nitrogen, and acidity of Austrian forest soils. Soil Syst. 2022, 6, 28. [Google Scholar] [CrossRef]
- Zhu, H.; Chen, C.; Xu, C.; Zhu, Q.; Huang, D. Effects of soil acidification and liming on the phytoavailability of cadmium in paddy soils of central subtropical China. Environ. Pollut. 2016, 219, 99–106. [Google Scholar] [CrossRef]
- Wu, J.; Liang, G.; Hui, D.; Deng, Q.; Xiong, X.; Qiu, Q.; Liu, J.; Chu, G.; Zhou, G.; Zhang, D. Prolonged acid rain facilitates soil organic carbon accumulation in a mature forest in Southern China. Sci. Total Environ. 2016, 544, 94–102. [Google Scholar] [CrossRef] [PubMed]
- Li, Z.; Dai, P.; Wang, Y.; Li, T.; Webb, A.A.; Wang, Y.; Li, Z.; Kou, T.; Shi, G.; Zhang, B. Effects of liming on health and growth of young Schima superba trees under canopy of a Pinus massoniana stand damaged by soil acidification in Chongqing, China. New For. 2016, 47, 801–813. [Google Scholar] [CrossRef]
- Chen, D.; Lan, Z.; Bai, X.; Grace, J.B.; Bai, Y. Evidence that acidification-induced declines in plant diversity and productivity are mediated by changes in below-ground communities and soil properties in a semi-arid steppe. J. Ecol. 2013, 101, 1322–1334. [Google Scholar] [CrossRef]
- Ni, Y.; Yang, T.; Ma, Y.; Zhang, K.; Soltis, P.S.; Soltis, D.E.; Gilbert, J.A.; Zhao, Y.; Fu, C.; Chu, H. Soil pH determines bacterial distribution and assembly processes in natural mountain forests of eastern China. Glob. Ecol. Biogeogr. 2021, 30, 2164–2177. [Google Scholar] [CrossRef]
- Liao, B.; Guo, Z.; Probst, A.; Probst, J.-L. Soil heavy metal contamination and acid deposition: Experimental approach on two forest soils in Hunan, Southern China. Geoderma 2005, 127, 91–103. [Google Scholar] [CrossRef]
- Chen, Z.; Wang, Y.; Chen, R.; Ni, X.; Cao, J. Effects of forest type on nutrient fluxes in throughfall, stemflow, and litter leachate within acid-polluted locations in Southwest China. Int. J. Environ. Res. Public Health 2022, 19, 2810. [Google Scholar] [CrossRef] [PubMed]
- Mao, Q.; Lu, X.; Zhou, K.; Chen, H.; Zhu, X.; Mori, T.; Mo, J. Effects of long-term nitrogen and phosphorus additions on soil acidification in an N-rich tropical forest. Geoderma 2017, 285, 57–63. [Google Scholar] [CrossRef]
- Zhang, F.; Jin, Q.; Peng, H.; Zhu, T. Soil acidification in moso bamboo (Phyllostachys edulis) forests and changes of soil metal ions (Cu, Pb) concentration. Arch. Agron. Soil Sci. 2021, 67, 1799–1808. [Google Scholar] [CrossRef]
- Renyi, G.U.I.; Yuyan, H.U.; Qiang, L.I.; Zhuang, S. Effect of cultivation time on soil heavy metal accumulation and bioavailability in Phyllostachys praecox stands. Pedosphere 2020, 30, 810–816. [Google Scholar]
- Lu, R. Methods of Agricultural Chemical Analysis of Soils; China Agricultural Science and Technology Press: Beijing, China, 2000. (In Chinese) [Google Scholar]
- Forestry Research Institute of China Academy of Forestry Sciences. Determination of Hydrolyzable Total Acidity of Forest Soil: LY/T1241-1999; China Standard Press: Beijing, China, 1999. (In Chinese) [Google Scholar]
- Renault, P.; Cazevieille, P.; Verdier, J.; Lahlah, J.; Clara, C.; Favre, F. Variations in the cation exchange capacity of a ferralsol supplied with vinasse, under changing aeration conditions: Comparison between CEC measuring methods. Geoderma 2009, 154, 101–110. [Google Scholar] [CrossRef]
- Verstraeten, G.; Baeten, L.; De Frenne, P.; Vanhellemont, M.; Thomaes, A.; Boonen, W.; Muys, B.; Verheyen, K. Understorey vegetation shifts following the conversion of temperate deciduous forest to spruce plantation. For. Ecol. Manag. 2013, 289, 363–370. [Google Scholar] [CrossRef]
- Lu, X.; Mao, Q.; Gilliam, F.S.; Luo, Y.; Mo, J. Nitrogen deposition contributes to soil acidification in tropical ecosystems. Glob. Chang. Biol. 2014, 20, 3790–3801. [Google Scholar] [CrossRef]
- Clesse, M.; Legout, A.; Ranger, J.; Zeller, B.; van der Heijden, G. Soil chemical fertility change over four decades in the Morvan Mountains and influence of tree species (Burgundy, France). For. Ecosyst. 2022, 9, 100043. [Google Scholar] [CrossRef]
- Mo, J.; Brown, S.; Peng, S.; Kong, G. Nitrogen availability in disturbed, rehabilitated and mature forests of tropical China. For. Ecol. Manag. 2003, 175, 573–583. [Google Scholar] [CrossRef]
- Fang, K.; Kou, D.; Wang, G.; Chen, L.; Ding, J.; Li, F.; Yang, G.; Qin, S.; Liu, L.; Zhang, Q.; et al. Decreased soil cation exchange capacity across northern China’s grasslands over the last three decades. J. Geophys. Res. Biogeosci. 2017, 122, 3088–3097. [Google Scholar] [CrossRef]
- Křeček, J.; Palán, L.; Stuchlík, E. Impacts of land use policy on the recovery of mountain catchments from acidification. Land Use Policy 2019, 80, 439–448. [Google Scholar] [CrossRef]
- Fujii, K.; Hayakawa, C.; Panitkasate, T.; Maskhao, I.; Funakawa, S.; Kosaki, T.; Nawata, E. Acidification and buffering mechanisms of tropical sandy soil in northeast Thailand. Soil Tillage Res. 2017, 165, 80–87. [Google Scholar] [CrossRef]
- Fujii, K.; Shibata, M.; Kitajima, K.; Ichie, T.; Kitayama, K.; Turner, B.L. Plant–soil interactions maintain biodiversity and functions of tropical forest ecosystems. Ecol. Res. 2018, 33, 149–160. [Google Scholar] [CrossRef]
- Clarholm, M.; Skyllberg, U. Translocation of metals by trees and fungi regulates pH, soil organic matter turnover and nitrogen availability in acidic forest soils. Soil Biol. Biochem. 2013, 63, 142–153. [Google Scholar] [CrossRef]
- Yamada, T.; Takenaka, C.; Yoshinaga, S.; Hirai, K. Long-term changes in the chemical properties of Japanese cedar (Cryptomeria japonica) forest soils under high precipitation in southwest Japan. J. For. Res. 2013, 18, 466–474. [Google Scholar] [CrossRef]
- Zhang, J.; Lyu, Z.; Shao, S.; Li, F.; Yang, S.; Song, W.; Li, W.; Li, S. Effects of aluminum toxicity induced by acid deposition on pine forest ecosystem in Longli of Guizhou Province, Southwestern China. Chin. Geogr. Sci. 2016, 26, 495–507. [Google Scholar] [CrossRef]

Disclaimer/Publisher’s Note: The statements, opinions and data contained in all publications are solely those of the individual author(s) and contributor(s) and not of MDPI and/or the editor(s). MDPI and/or the editor(s) disclaim responsibility for any injury to people or property resulting from any ideas, methods, instructions or products referred to in the content. |
© 2024 by the authors. Licensee MDPI, Basel, Switzerland. This article is an open access article distributed under the terms and conditions of the Creative Commons Attribution (CC BY) license (https://creativecommons.org/licenses/by/4.0/).