Article

Adapting Harvests: A Comprehensive Study of Farmers’ Perceptions, Adaptation Strategies, and Climatic Trends in Dera Ghazi Khan, Pakistan

by
Syed Ali Asghar Shah
1,†,
Muhammad Sajid Mehmood
2,3,4,*,†,
Ihsan Muhammad
5,
Muhammad Irfan Ahamad
2,* and
Huixin Wu
6
1
School of Economics and Management, Northeast Agricultural University, Harbin 150030, China
2
College of Geography and Environmental Science, Henan University, Kaifeng 475001, China
3
Key Laboratory of Geospatial Technology for Middle and Lower Yellow River Regions, Ministry of Education, Henan University, Kaifeng 475001, China
4
INTI International University, Nilai 71800, Malaysia
5
Guangxi Key Laboratory of Forest Ecology and Conservation, State Key Laboratory for Conservation and Utilization of Agro-Bioresources, College of Forestry, Guangxi University, Nanning 530004, China
6
School of Marxism Studies, Northeast Agricultural University, Harbin 150030, China
*
Authors to whom correspondence should be addressed.
These authors contributed equally to this work.
Sustainability 2024, 16(16), 7070; https://doi.org/10.3390/su16167070
Submission received: 9 May 2024 / Revised: 13 June 2024 / Accepted: 19 June 2024 / Published: 17 August 2024

Abstract

:
Understanding farmers’ perceptions, attitudes, and adaptation strategies toward climate change is important for developing effective policies that support agricultural development and food security in rural communities. This study aimed to understand climatic trends over the past two decades (2003–2022), farmers’ perceptions, and adaptation strategies regarding climate change in Dera Ghazi Khan, Pakistan. The Mann–Kendall trend test identified a significant decrease in average minimum temperature (τ = −0.357, p < 0.05) and an increase in rainfall patterns (τ = 0.337, p < 0.05). A mixed-method approach is employed, utilizing a survey of 180 randomly selected farmers, focus group discussions, and climate data analysis. Ordinal and binary logistic regression models were used to analyze the influence of sociodemographic factors on farmers’ perceptions of climate change and their choice of adaptation strategies. The results indicate that farmers primarily rely on religious beliefs/prayers (65.6%) to cope with climate change, followed by seeking off-farm jobs (50%) and changing fertilizer use (42.2%). The result of the binary logistic regression indicates that among the different demographic characteristics, education, and land size significantly influence farmers’ decisions in taking adaptation measures against climate change. This study emphasizes the need for climate policies that integrate farmer knowledge with meteorological data and sociodemographic analysis to ensure a sustainable agricultural sector in Pakistan. Further research is necessary to explore more effective adaptation methods.

1. Introduction

Climate change leads to shifts in temperature and precipitation patterns, which can alter growing seasons and reduce crop yields [1]. Increased temperatures can exacerbate heat stress in crops and livestock, while changing precipitation patterns can result in either droughts or excessive rainfall, both of which are detrimental to agricultural productivity [2]. Climate change directly affects farmers’ livelihoods by lowering crop yields [3]. Recent studies reported that farmers have observed the emergence of novel pests, decreased crop productivity, and post-harvest losses due to climate change [4].
Pakistan is among the top ten nations of the world affected by extreme climatic events [5]. It is anticipated that Pakistan’s susceptibility to droughts and floods will rise due to more intensive rainfall in northern regions, flooding of the Indus River system, and droughts in the southern region [6]. The country experienced the highest rainfall in August 2022 since 1961. Sindh and Balochistan had an exceptional amount of rainfall, which exceeded the typical monthly precipitation levels by six and seven times, respectively. The floods occurred after an intense heatwave, considered a rare event with a chance of 1 in 1000 years. The heatwave was followed by a drought defined by continuously high temperatures over 45 °C in the area, which caused substantial agricultural damages, interruptions in electricity supply, and the occurrence of forest fires [7]. The floods in August of 2022 in Pakistan had a significant impact, affecting an estimated 33 million individuals, resulting in the loss of nearly 1500 lives and causing extensive damage to infrastructure, agriculture, and residences [8]. In August 2022, Balochistan witnessed a precipitation level that exceeded the monthly average by 590%. On the other hand, Sindh province received rainfall that increased by 726% compared to a similar interval in the previous year [7].
According to Fussel and Klein [9], adaptation appears to be the most effective tool for mitigating the negative impacts of climate change. Without effective adaptation, climate change could seriously affect the welfare of many people in developing countries [10,11]. Many farmers have undertaken adaptation techniques through the modification of their agricultural practices. However, the level of intensity and the particular strategies employed for adaptation exhibit significant differences among farming communities, which are influenced by various factors such as climatic conditions, social dynamics, economic considerations, perception of climate change, knowledge and information, psychological issues, and institutional frameworks [12,13,14,15,16].
Farmers can respond and adjust to the effects of climate change through various strategies and approaches. For example, farmers can adopt new crop varieties, introduce diversity in their cropping systems, incorporate a variety of livestock breeds, make use of crop insurance, transition to no-till farming practices, employ cover crops, relocate their farming operations, adjust the timing of their activities, adopt innovative water management techniques, expand their sources of farm income, and use soil conservations techniques [17,18,19].
Previous studies have extensively explored farmers’ perceptions and adaptation strategies to climate change in Pakistan. Usman et al. [20] conducted a study in Punjab, Pakistan, exploring farmers’ understanding of the impacts of climate change, their adaptation strategies, the determinants of these strategies, and the benefits to agriculture. Ahmad and Afzal [21] examined flood hazards and the factors influencing household flood perception and mitigation strategies. However, there is still a lack of knowledge regarding how rural communities in Pakistan can adapt to climate change, specifically in the flood-prone areas of the Indus Plain. This study presents empirical findings regarding the correlation between the socio-economic characteristics of farmers and their attitudes toward climate change adaptations in Dera Ghazi Khan, a highly vulnerable region in the Indus Plain that confronts numerous climate change-induced hazards, such as floods. This study addresses the following research questions: (1) What are the climatic trends in the study area? (2) What are the perceptions of farmers regarding climate change? (3) How much damage has climate change caused to farmers? (4) What adaptation strategies do farmers apply to adjust to the effects of climate change? (5) What is the relationship between different demographic factors and adaptation measures? (6) How do demographic factors affect adaptation measures?

2. Materials and Methods

2.1. Study Area

The research was conducted in Dera Ghazi Khan, Pakistan, a region known for its long-term exposure to catastrophic floods and hot, humid weather. The average high temperature during summer is about 46 °C, while the average low temperature in winter falls around 4 °C. D.G. Khan has an average annual precipitation of approximately 22.18 mm and an average humidity of 40–60%. D.G. Khan is around 30.0489° N latitude and 70.6455° E longitude. The region has an average elevation of 124 m above sea level [22]. District D.G. Khan encompasses four Tehsils, namely DG Khan (Figure 1), Taunsa, Kot Chuta, and Koh-e-Suleman, spanning an approximate area of 13,018 square kilometers. During the recent flood of August 2022 in the D.G. Khan District, 342 villages experienced significant damage, while 80 union councils were subjected to flooding, directly impacting a population of 699,502 individuals [23].

2.2. Data Collection

The study utilizes a mixed-methods methodology, integrating quantitative surveys with qualitative focus group discussions and key informant interviews.

2.2.1. Climate Data

Climate data, including monthly records of precipitation and minimum and maximum temperatures, were obtained from the Pakistan Meteorological Department for the period from 2003 to 2022.

2.2.2. Survey Data

This study, conducted between April and June 2023, investigated farmers’ perceptions of climate change impacts and their adaptation strategies using a structured field survey questionnaire. The questionnaire was developed following a comprehensive review of climate-related studies in general, with a specific focus on past climate-related research conducted in Pakistan [24]. The questionnaire was improved through focus group discussions and key informant interviews with various stakeholders.
The questionnaire covered demographic and socio-economic characteristics, perceptions of recent climatic events, socio-economic impacts of climate change, and adaptation strategies. The questions were designed based on a 5-point Likert scale to identify varying degrees of an individual’s subjective risk assessment [21,25]. Questions were asked in local languages Saraiki and Urdu to obtain farmer’s views. We employed a simple random sampling technique to obtain a representative sample of farmers, selecting 180 participants. This involved the following steps:
  • Selection of the District Dera Ghazi Khan, Punjab, Pakistan as the study area.
  • Selection of two tehsils, D.G. Khan and Taunsa (sub-administrative unit), from the study area.
  • Selection of three union councils (smallest administrative unit in the country) from each chosen tehsil.
  • Selection of three villages from each chosen union council using simple random sampling.
  • A sample of 10 farmers from each village was taken randomly for interview.
Focus group discussions and interviews: Two focus group discussions and twelve key informant interviews were conducted to enrich the quantitative data. Participants included community members, local political leaders, and district agriculture officers. These discussions aimed to gather in-depth insights into local perceptions and experiences related to climate change. After summarizing the focus group findings, the focus group discussion results are shown in Figure 2.

2.3. Data Analysis

2.3.1. Descriptive Statistics

The collected data were subjected to descriptive statistical analysis to summarize the frequencies, means, and percentages of the variables.

2.3.2. Mann–Kendall Trend Test

The Mann–Kendall (MK) test was used to assess the trends in temperature and rainfall over two decades (2003–2022). It is a non-parametric test that does not require the data to follow a normal distribution [26]. Sen’s slope estimate provides a measure of the rate of change over time. Monthly records of precipitation and minimum and maximum temperatures were obtained from the Pakistan Meteorological Department, ensuring consistency and reliability of the dataset. We calculated annual average rainfall and minimum and maximum temperatures from the monthly data to analyze the data. The data were normalized to handle missing values and outliers, ensuring accurate trend detection. MK trend and Sen’s slope estimation analysis was carried out using XLSTAT 2019 software.

2.3.3. Ordinal Logistic Regression

The ordinal logistic regression model estimates the probability that an observation falls into one of the ordered categories of the dependent variable, which in our study are the farmers’ perceptions of climate change. Ordinal logistic regression allowed for the analysis of the impact of socio-demographic characteristics on farmers’ perceptions regarding climate change [27,28]. Because the Likert scale data are ordinal (Table 1), they are suitable for ordinal logistic regression, which considers the ordered response variables and discrete characters [27,28]. Model diagnostics, including the Hosmer–Lemeshow goodness-of-fit test, were performed to ensure the adequacy and reliability of the regression model. The equation of the ordinal logistic regression is as follows:
logit(P(Y ≤ j)) = log(P(Y ≤ j)/1 − P(Y ≤ j)) = αj + β1 X1 + β2 X2 + ⋯ + βk Xk
where Y is the ordinal outcome variable (e.g., perception of weather uncertainty, floods, and drought), j represents the threshold for each category, αj are the intercepts, β are the coefficients, and X are the independent variables (e.g., age, education, land size, and farming experience).

2.3.4. Binary Logistic Regression

We employed a binary logistic regression (BLR) model to analyze the factors influencing farmers’ adaptations to climate change due to the binary nature of the data.
logit(P(Y = 1)) = log(P(Y = 1)/1 − P(Y = 1)) = β0 + β1X1 + β2X2 + ⋯ + βkXk
where Y is the binary outcome variable (1 = adopted; 0 = not adopted), β0 is the intercept, β represents the coefficients, and X represents the independent variables (e.g., age, education, land size, and farming experience). The odds ratio for each independent variable X is given by: OR = eβi.
This represents the change in the odds of adopting the adaptation strategy for a one-unit increase in the independent variable.
This study employed ordinal logistic regression for analyzing ordered categorical responses and binary logistic regression for binary outcomes, ensuring appropriate model application based on the nature of the dependent variables. Ordinal and binary logistic regression analyses were performed using XLSTAT 2019 and Smart PLS 4 software.

3. Results

3.1. Climate Change Trends

The results presented in Figure 3 demonstrate the trends in temperature and precipitation from 2003 to 2022. The annual average maximum temperature was recorded at 33 °C in 2022. The Mann–Kendall trend test (τ = 0.005, p = 1.000) and Sen’s slope analysis (slope = 0.000) reveal no significant trend, indicating little to no change in maximum temperature over time. The annual minimum temperature was 17.9 °C in 2020, as shown in Figure 3. The analysis indicates a significant decreasing trend in minimum temperatures (p-value = 0.034), as found by the Mk test (τ = −0.357) and Sen’s slope analysis (slope = −0.065).
The data presented in Figure 3 identified that maximum rainfall occurred in 2022, followed by 2008, which was 497.1 mm and 474.8 mm, respectively. The floods of 2008, 2010, and 2022 caused damage to agriculture and infrastructure in Pakistan [8]. The Mann–Kendall trend test conducted on annual rainfall (Table 2) reveals a positive trend (τ = 0.337, p-value = 0.041), indicating a notable increase in rainfall over time. Sen’s slope analysis provides additional insights with an estimated slope of 6.592, showing the annual rate of growth. In contrast, the 95% confidence interval for the slope (ranging from 0.781 to 13.950) and intercept (ranging from −13035.227 to −7185.921) offers a measure of uncertainty.

3.2. Demographic Characteristics of Farmers

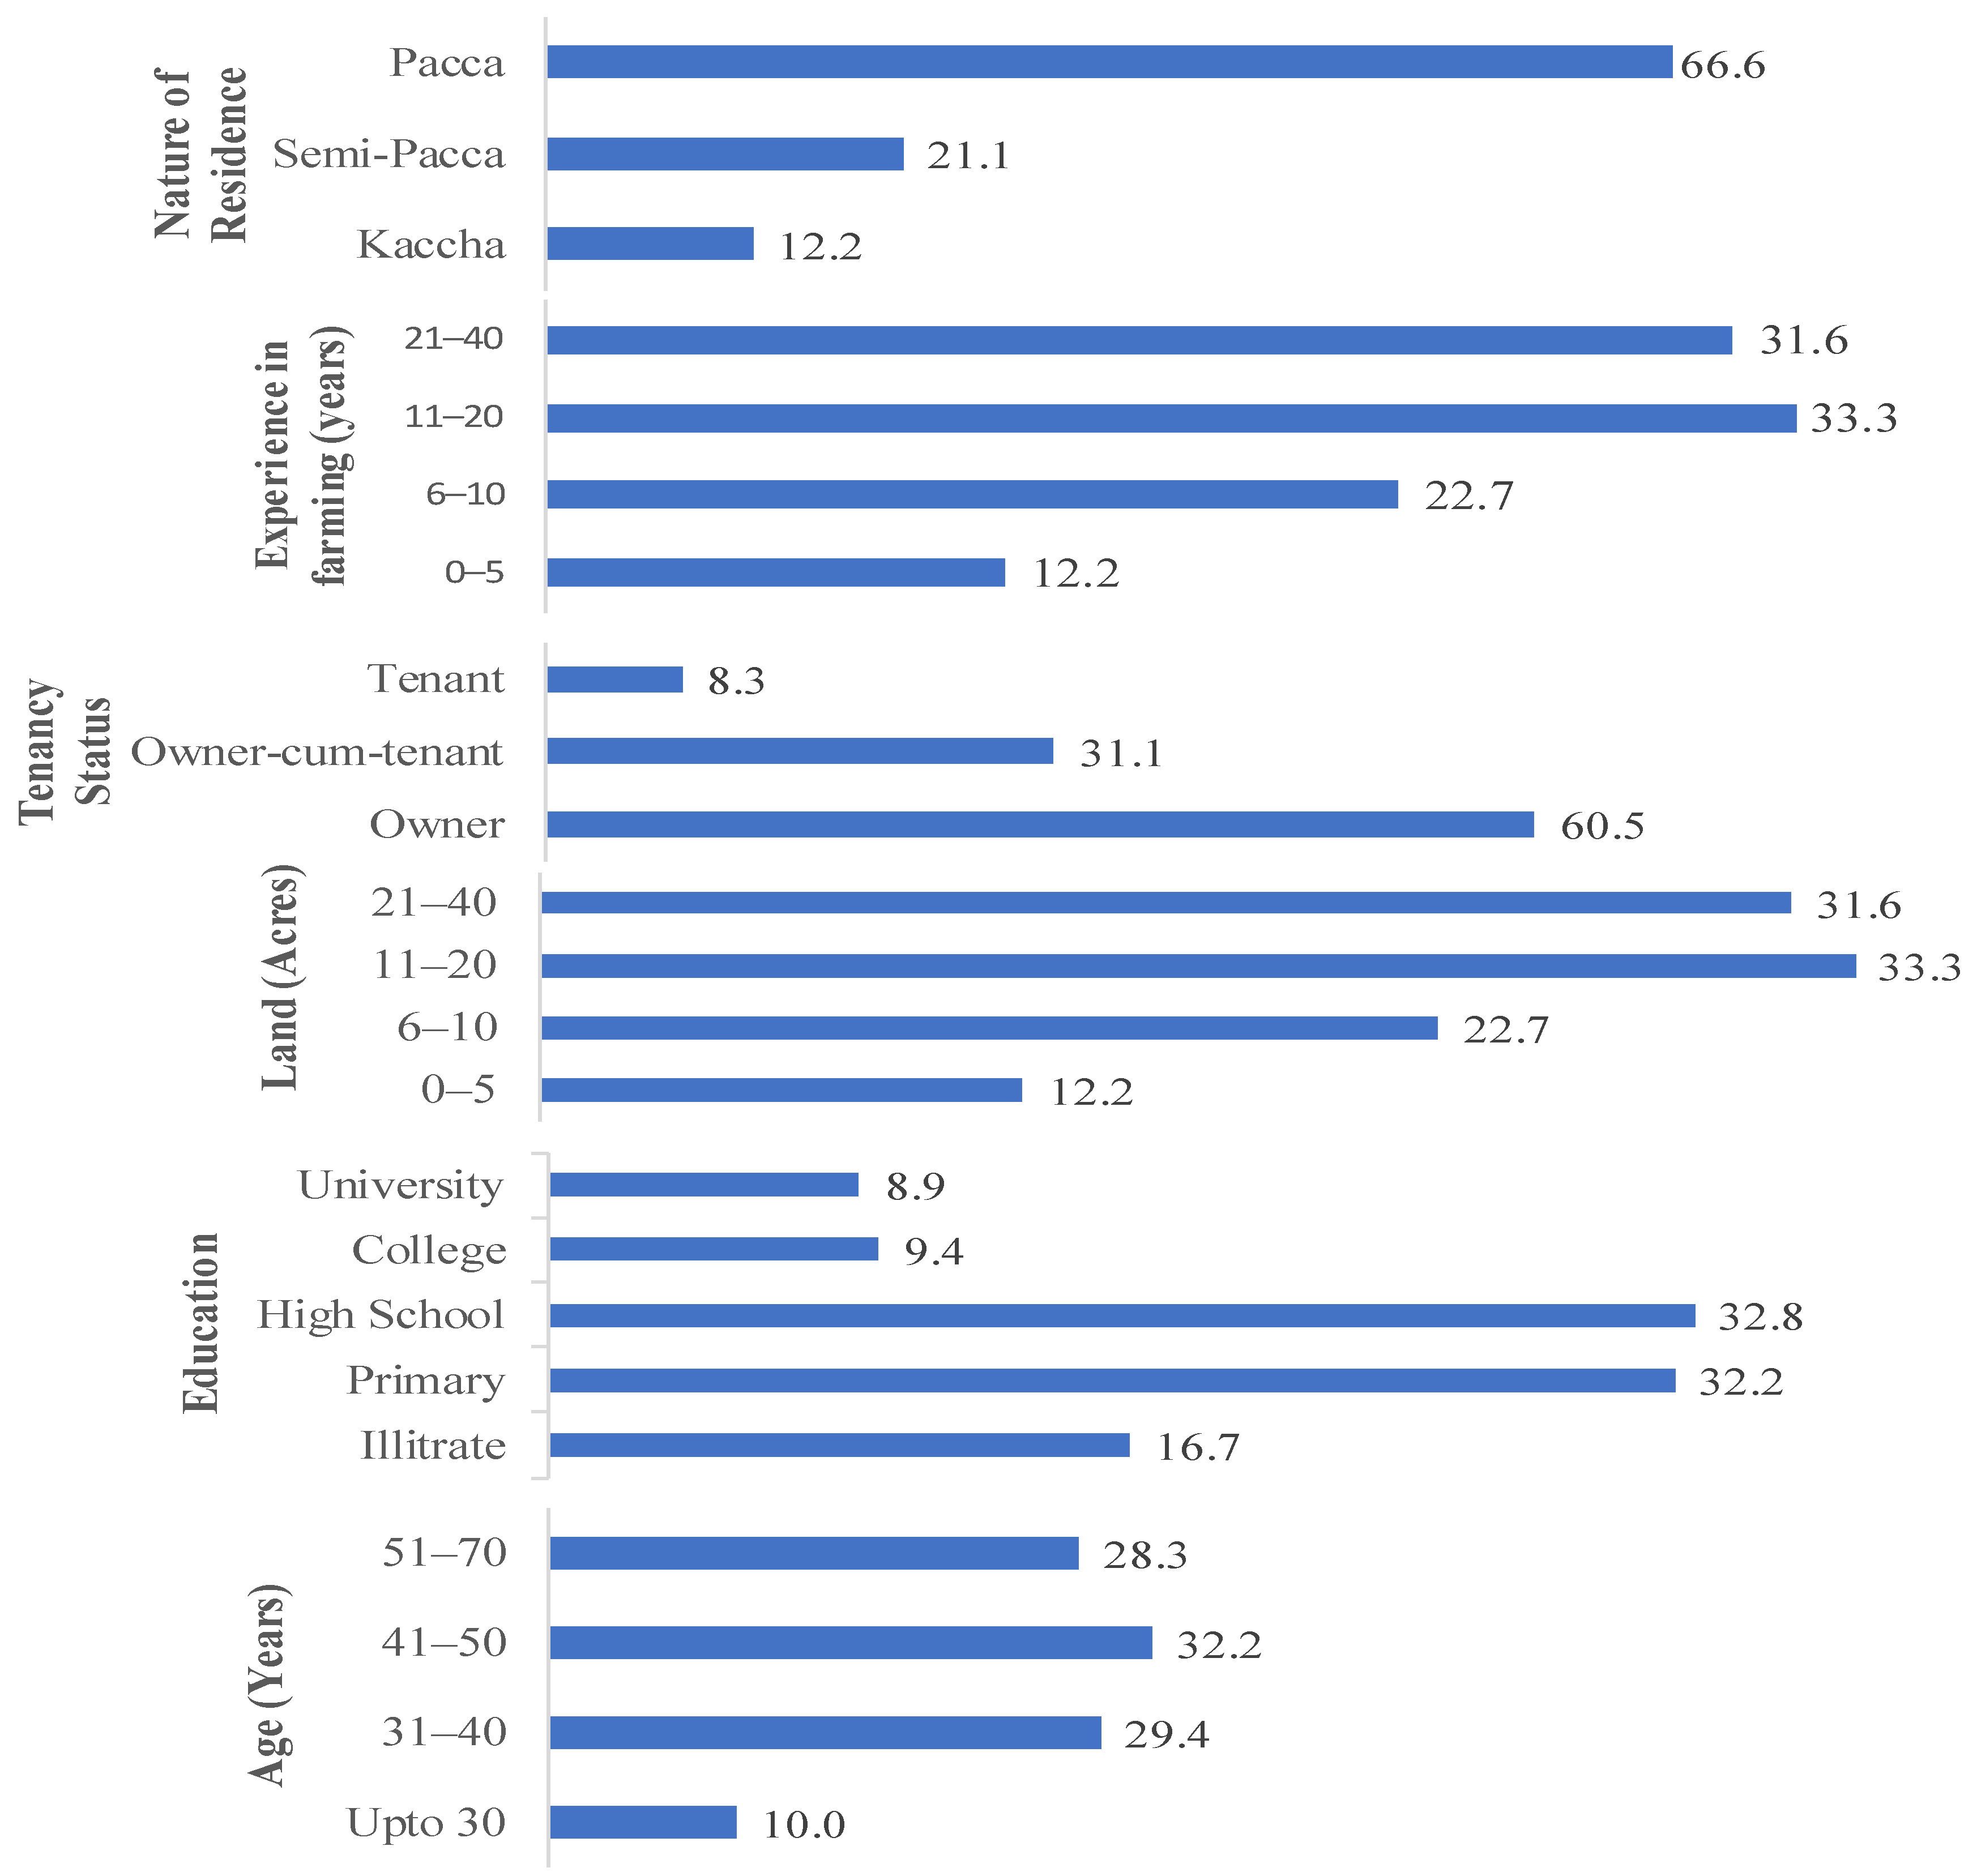
The data plotted in Figure 4 represent the demographic characteristics of respondents. Among the 180 respondents, the majority (32.2%) fall within the 41–50 age category, followed by 31–40 (29.4%). In terms of education, a significant percentage (32.8%) completed high school education, while 16.7% are illiterate. An equal percentage of respondents (29.4%) hold 0–5 acres and 6–10 acres of land, while a small number (13.3%) have 21–40 acres for farming. A vast majority of the respondents (60.6%) have land ownership. Regarding agricultural experience, the largest group (33.3%) of respondents has 11–20 years of experience in farming, and the vast majority (66.7%) live in pucca houses.

3.3. Farmers’ Perceptions of Climate Change

Farmers’ perceptions of climate change are influenced by their previous experiences with climatic extremes. As a result, farmers improve their ability to respond and make decisions about local adaptation [29,30]. The data presented in Table 3 reflect the perception of farmers on various climatic issues based on their experience in the last 20 years, which is measured on a Likert scale. Notably, floods are a prominent concern among the farming community, with the vast majority (38.9%) of the farmers considering it a moderate issue and 27.8% rating it as high. However, unpredictable rains are also considered a prominent issue, with approximately half (43.9%) of the farmers rating it as high. A considerable portion (37.2%) of farmers perceive drought as a moderate issue, with a small portion (20.6%) considering it a high concern. Regarding soil erosion, most of the farmers perceive it as very low (25.6%) and low (22.8%). Heatwaves were rated moderate by a substantial portion (35%) of farmers, while 29.4% rated it as a low issue. Regarding weather uncertainty, most farmers have moderate (27.2%) to high (22.2%) perceptions.

3.4. Socio-Economic Factors Affecting Farmers’ Perceptions Regarding Climate Change

Education plays a significant role in how farmers perceive weather uncertainty. Farmers with higher education levels report greater odds of having a higher perception of weather uncertainty (Estimate = 0.226, p < 0.001, OR = 1.254). In contrast, age, land size, and experience do not appear to significantly influence farmers’ perceptions (p-value > 0.05). Ordinal logistic regression analysis revealed a significant positive effect of education on farmers’ perceptions of both drought (Estimate = 0.220, p < 0.001, OR = 1.246) and rainfall changes (Estimate = 0.180, p < 0.001, OR = 1.197). Additionally, experience significantly predicted drought perception (Estimate = 0.072, p < 0.001, OR = 1.075), with each year of farming experience associated with a 9.7% increase in the odds of higher drought perception. However, experience had a negative impact on rainfall perception (Estimate = −0.066, p = 0.002, OR = 0.936), decreasing the odds of higher rainfall concern by 6.4% per additional year of experience (Table 4).
The analysis revealed a significant negative effect of age (Estimate = −0.193, p < 0.001, OR = 0.825) on farmers’ perception of recent heatwaves, indicating that older farmers are less likely to be in a higher perception category. In contrast, education exhibited a statistically significant positive impact (Estimate = 0.272, p < 0.001, OR = 1.313), suggesting that for each unit increase in education level, the odds of farmers being in a higher perception category increase by 31.3%. The impact of education on the perception regarding soil erosion is statistically significant (Estimate value = 0.109, p = 0.003, OR = 1.115). The analysis shows that land size also strongly impacts farmers’ perception of soil erosion. Specifically, with the increase in land size, there is a 32.1% increase in the probability of being in a higher perception category (Estimate value = 0.279, p < 0.001, OR = 1.321). Education has a significant positive impact on farmers’ perception regarding floods. The estimated value is 0.326, with a p-value of less than 0.001 and an odds ratio of 1.386. The analysis reveals that land size (Table 4) has a notable positive impact on farmers perception of floods (Estimated value = 0.117, p < 0.001, OR = 1.124), identifying that for every unit increase in land size, the likelihood of being in a higher perception category increase by around 12.4%.

3.5. Climate Change Effects on Farmer’s Life and Income Sources

Recent data published by the government of Pakistan indicates that around 20 million people were directly affected by the floods, which destroyed livelihoods, property, and infrastructure [31]. The data in Figure 5 represent the form of flood damages faced by the farmers during the last 10 years. All the respondents were affected by the floods in the previous 10 years. Floods destroyed their home crop and caused the death of livestock. Machinery and transportation sources were also affected by the recent floods.
The results show that the impact of floods on crops was higher, with a mean value of 3.01, as 35.6% of the farmers experienced severe damage (76–100%). The floods had a severe impact on agricultural production in Pakistan, resulting in a significant decline in the yields of wheat, maize, and sugarcane [32]. One of the respondents expressed that “their crop is consistently devastated by floods every year, rendering their investments and efforts futile. As a result, their economic status has worsened, leaving them unable to maintain their family financially; the authorities need to take action on our issue”. Nearly half (48.3%) of the farmers reported that their livestock was also affected very badly due to floods, falling in the range of 51–75% with a mean value of 2.82. The floods of 2010 in Pakistan resulted in the demise of millions of livestock, with around 200,000 casualties. In the floods of 2022, almost 70% of livestock, or 500,000 animals, were washed away in the southwestern region of Balochistan, followed by northeastern Punjab, where over 200,000 animals died [8]. A considerable percentage of farmers reported significant flood-related destruction to their homes, with 36.7% indicating damage falling within the 51–75% range (mean = 2.32). The floods in 2022 caused damage to 6579 km of highways, 246 bridges, and about 1.7 million houses [8]. Conversely, the damage to food stock was minimal, as 48.9% of farmers reported damage ranging from 26% to 50% (mean = 2.14). The farmer’s machinery had relatively minor damage, with 52.8% of farmers reporting damage of up to 25% (mean = 1.71). Moreover, regarding transportation, a significant proportion of farmers (37.8%) encountered minimal flood-related damage (mean = 2.20). The floods and heavy rains in Pakistan have adversely affected crops, animals, and forests and caused significant damage to crucial infrastructure, including tube wells, home water storage facilities, private seed inventories/pesticides, animal shelters, and agricultural equipment [32].

3.6. Farmer’s Adaptation Strategies to Climate Change

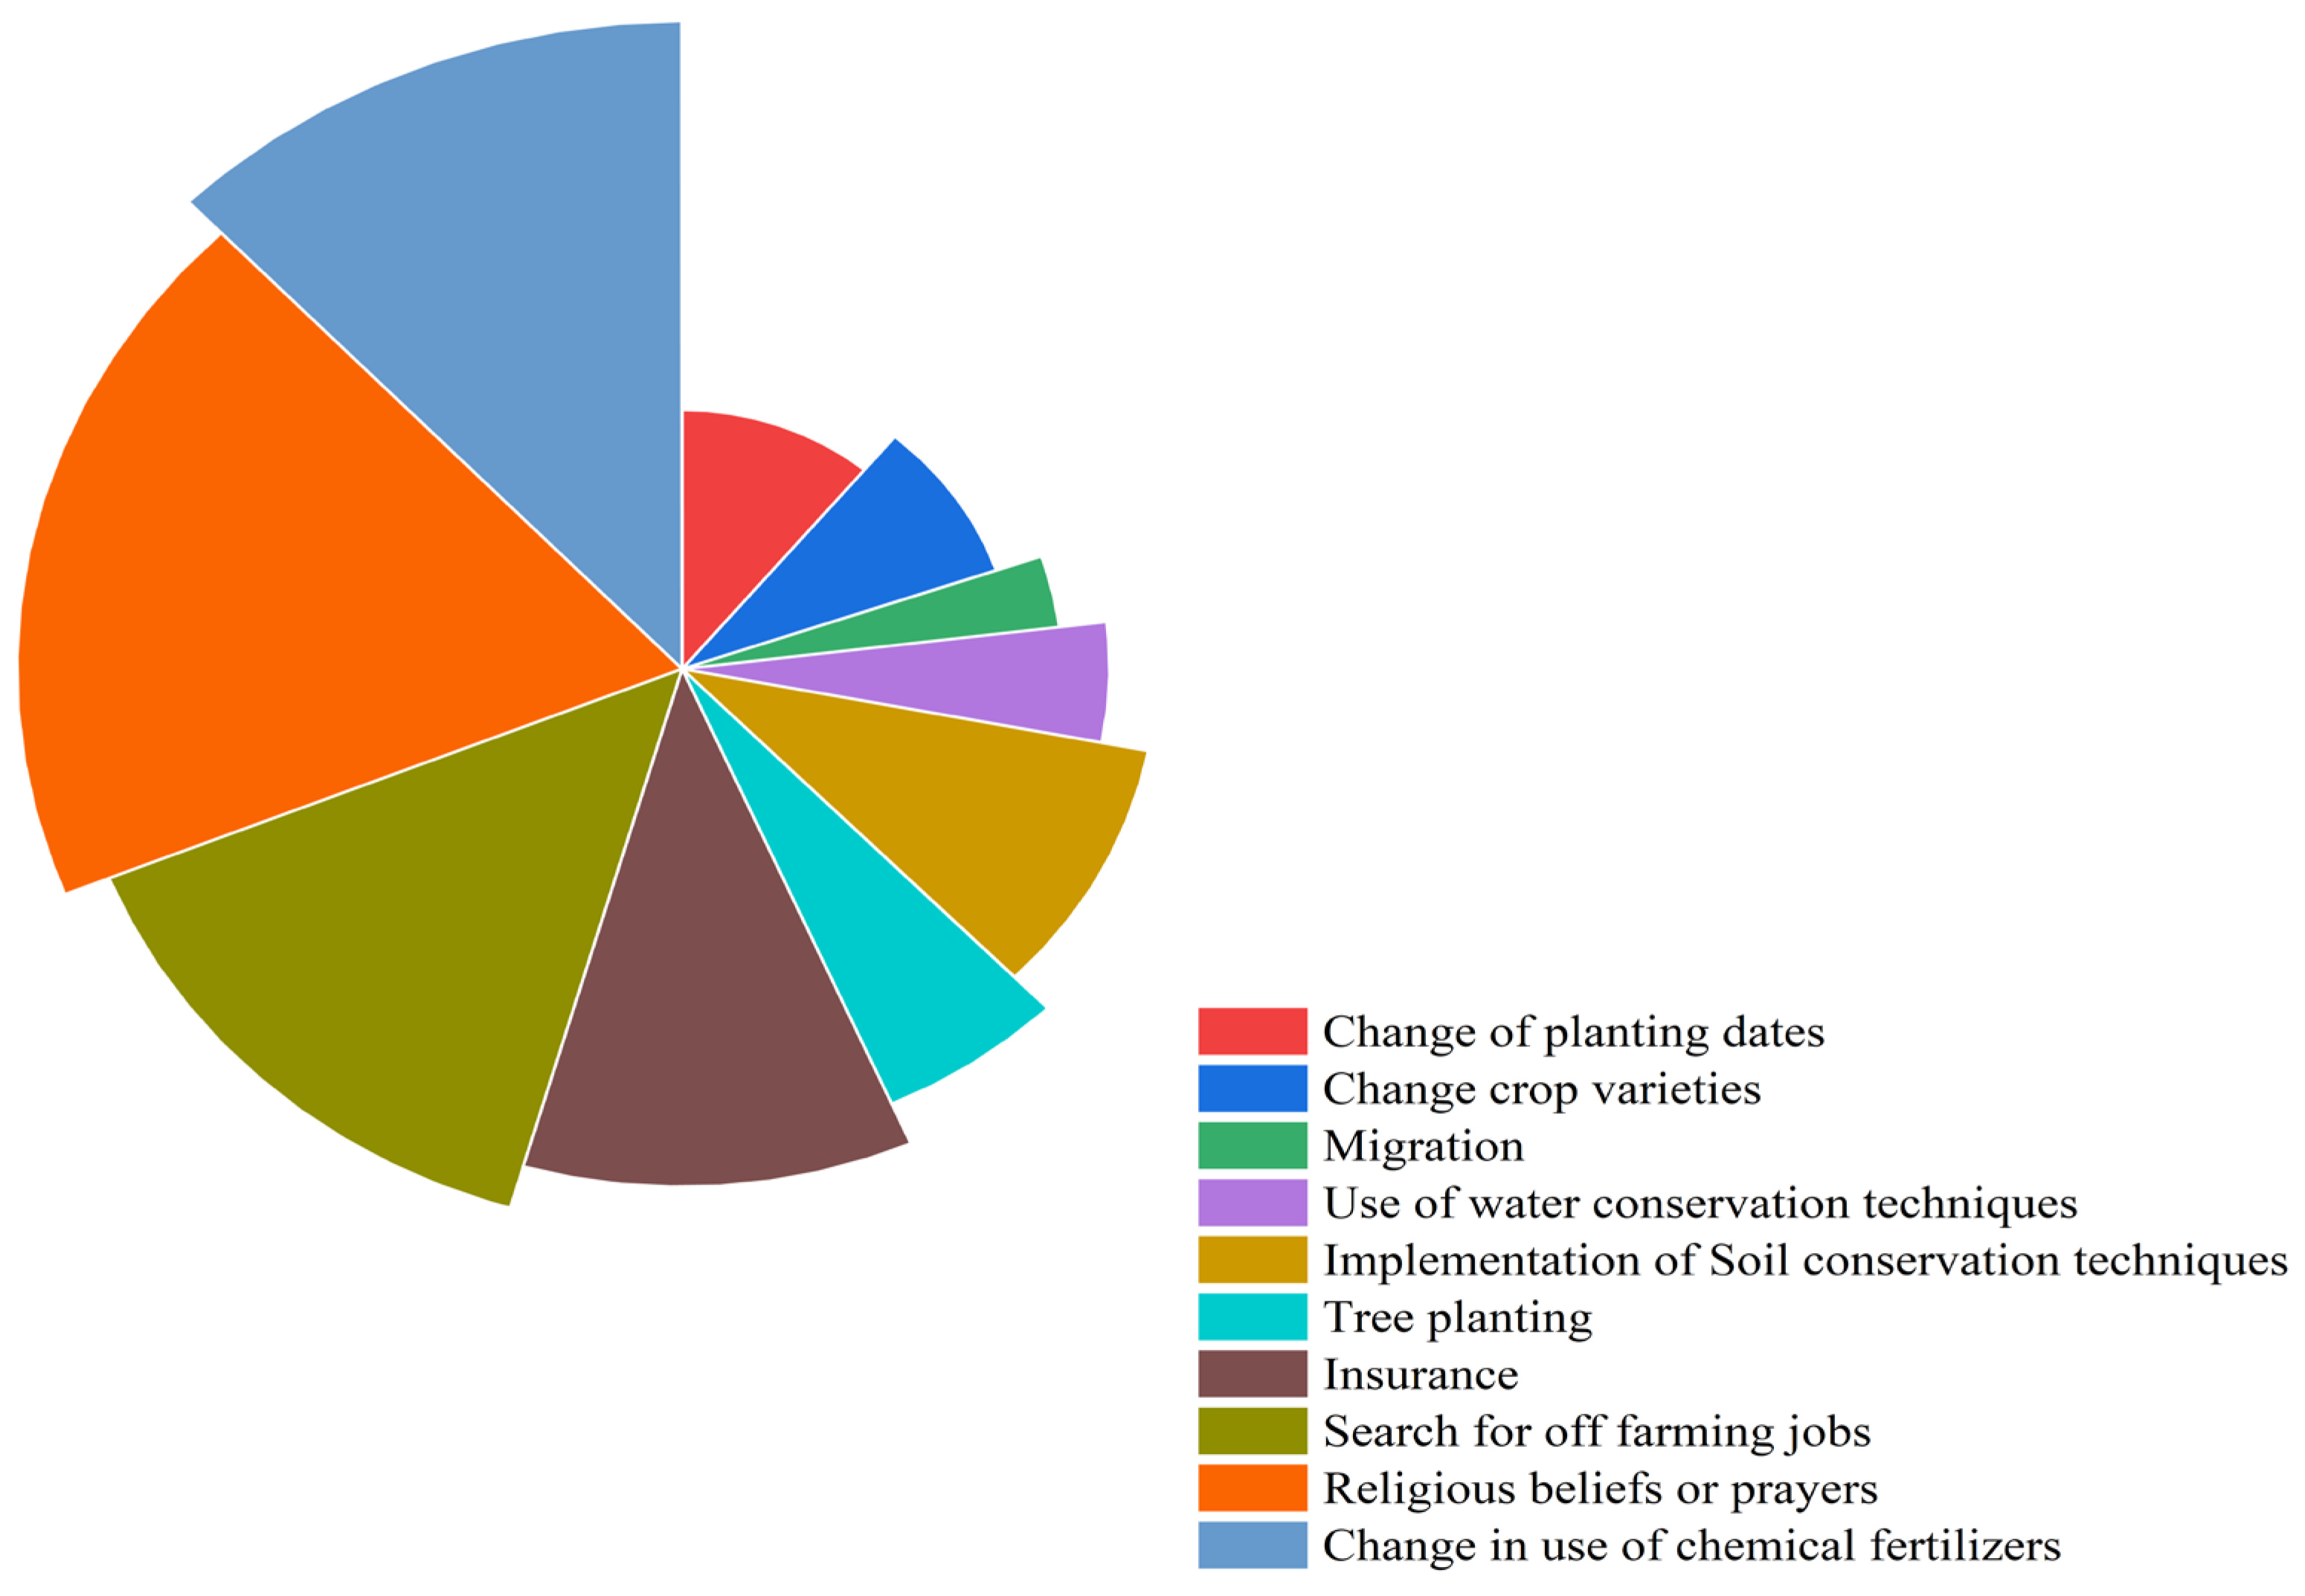
Adaptation exhibits variability in terms of its duration (either short-term or long-term), its scope ranging from the farm to the regional and national levels, and the different types of adaptations that can be implemented. The study’s findings showed that farmers employed various adaptation strategies in reaction to climate change, as shown in Figure 6.
Changing weather patterns can alter the geographical range and behavioral patterns of pests and diseases, increasing certain regions’ susceptibility to outbreaks. Farmers can modify their pesticide and insecticide use to address these new challenges. A vast majority (42.2%) of farmers adopted “change in the use of chemical fertilizers, pesticides, and insecticides” to address the negative effects of climate change. The implementation of adaptation strategies, such as enhancing crop diversification, implementing water and soil conservation practices, utilizing improved crop varieties, and applying fertilizers, has positively impacted the food security of specific households in West African nations, including Burkina Faso, Senegal, and Ghana [33,34]. Climate change can cause increasing weather variability and altering growth seasons, making agricultural revenue less predictable and more prone to shocks. In response to climate change, around 50% of farmers expand their sources of income by pursuing off-farm jobs, such as establishing businesses, engaging in other sectors, or migrating. Only 11.7% of farmers chose migration as an adaptation option, preferring regions with a better climate and more chances for employment (Figure 6). Drought frequency needs increased water accessibility for farmers as a result of expected climate change [35,36]. However, only 17.2% of farmers implement water conservation methods because changing weather patterns, such as reduced rainfall and rising temperatures, lead to water scarcity and worsen drought situations. According to studies, adaptation techniques are crucial for ensuring the reliability, resilience, and long-term viability of agricultural water resource systems [37,38]. To ensure the long-term viability of agriculture, it is necessary to implement comprehensive policies that focus on soil and water conservation. These policies should include the promotion of micro-irrigation, rainwater harvesting structures, and the enhancement of soil moisture contents [39]. Approximately 33.3% of farmers implemented soil conservation methods in response to the changing climatic conditions. These practices aim to mitigate the adverse effects of increased rainfall frequency and erosion risks, leading to protecting soil quality and agricultural output. A majority (38.3%) of farmers modify their planting dates as a means of adaptation. This strategy seeks to align crop cycles with the changing climatic conditions (Figure 6), hence reducing risks such as frost, heat stress, and drought that may occur during crucial growth stages. Changing planting dates is an important adaptation strategy that has been recognized by previous researchers [40,41]. Pakistani farmers prefer this strategy because it is simple to apply and requires minimum costs. The selection of cultivars is influenced by the geographical region. In areas with limited water supplies, it is critical to use cultivars that are more resistant to high temperatures and drought [42]. To adapt to changing climate, nearly a third (30%) of farmers adopted different crop varieties. A similar study by Atube et al. [43] identified that planting different crop varieties was farmers’ most commonly used adaptation strategy. The data in Figure 6 identify that tree planting is utilized by 20% of respondents, aligning with findings in Ethiopia’s Nile Basin. This method helps mitigate wind impacts linked with climate change [44]. The government of Punjab, Pakistan, has recently implemented a crop insurance policy to minimize the production losses experienced by farmers. More than one-third (38.3%) of farmers utilize insurance as a means to adjust to the impacts of climate change (Figure 6). This strategy provides them with economic stability by reducing the impact of climate-related risks, such as severe weather events, prolonged periods of drought, and crop losses. Crop insurance protects farmers from unexpected disasters, ensuring working capital, loan repayments, and business continuity [45]. The results identified that more than half (65.6%) of the farmers believed in religious activities as an adaptation strategy to tackle climate change. As the majority of the farmers belong to Muslim communities, farmers may rely on religious beliefs or prayers as a coping mechanism rather than employing a practical adaptation approach to climate change. These beliefs may offer emotional relief and resilience in the face of challenges. However, these beliefs do not directly address the physical or practical aspects of climate change adaptation.

3.7. Factors Affecting Farmers’ Adaptation Strategies

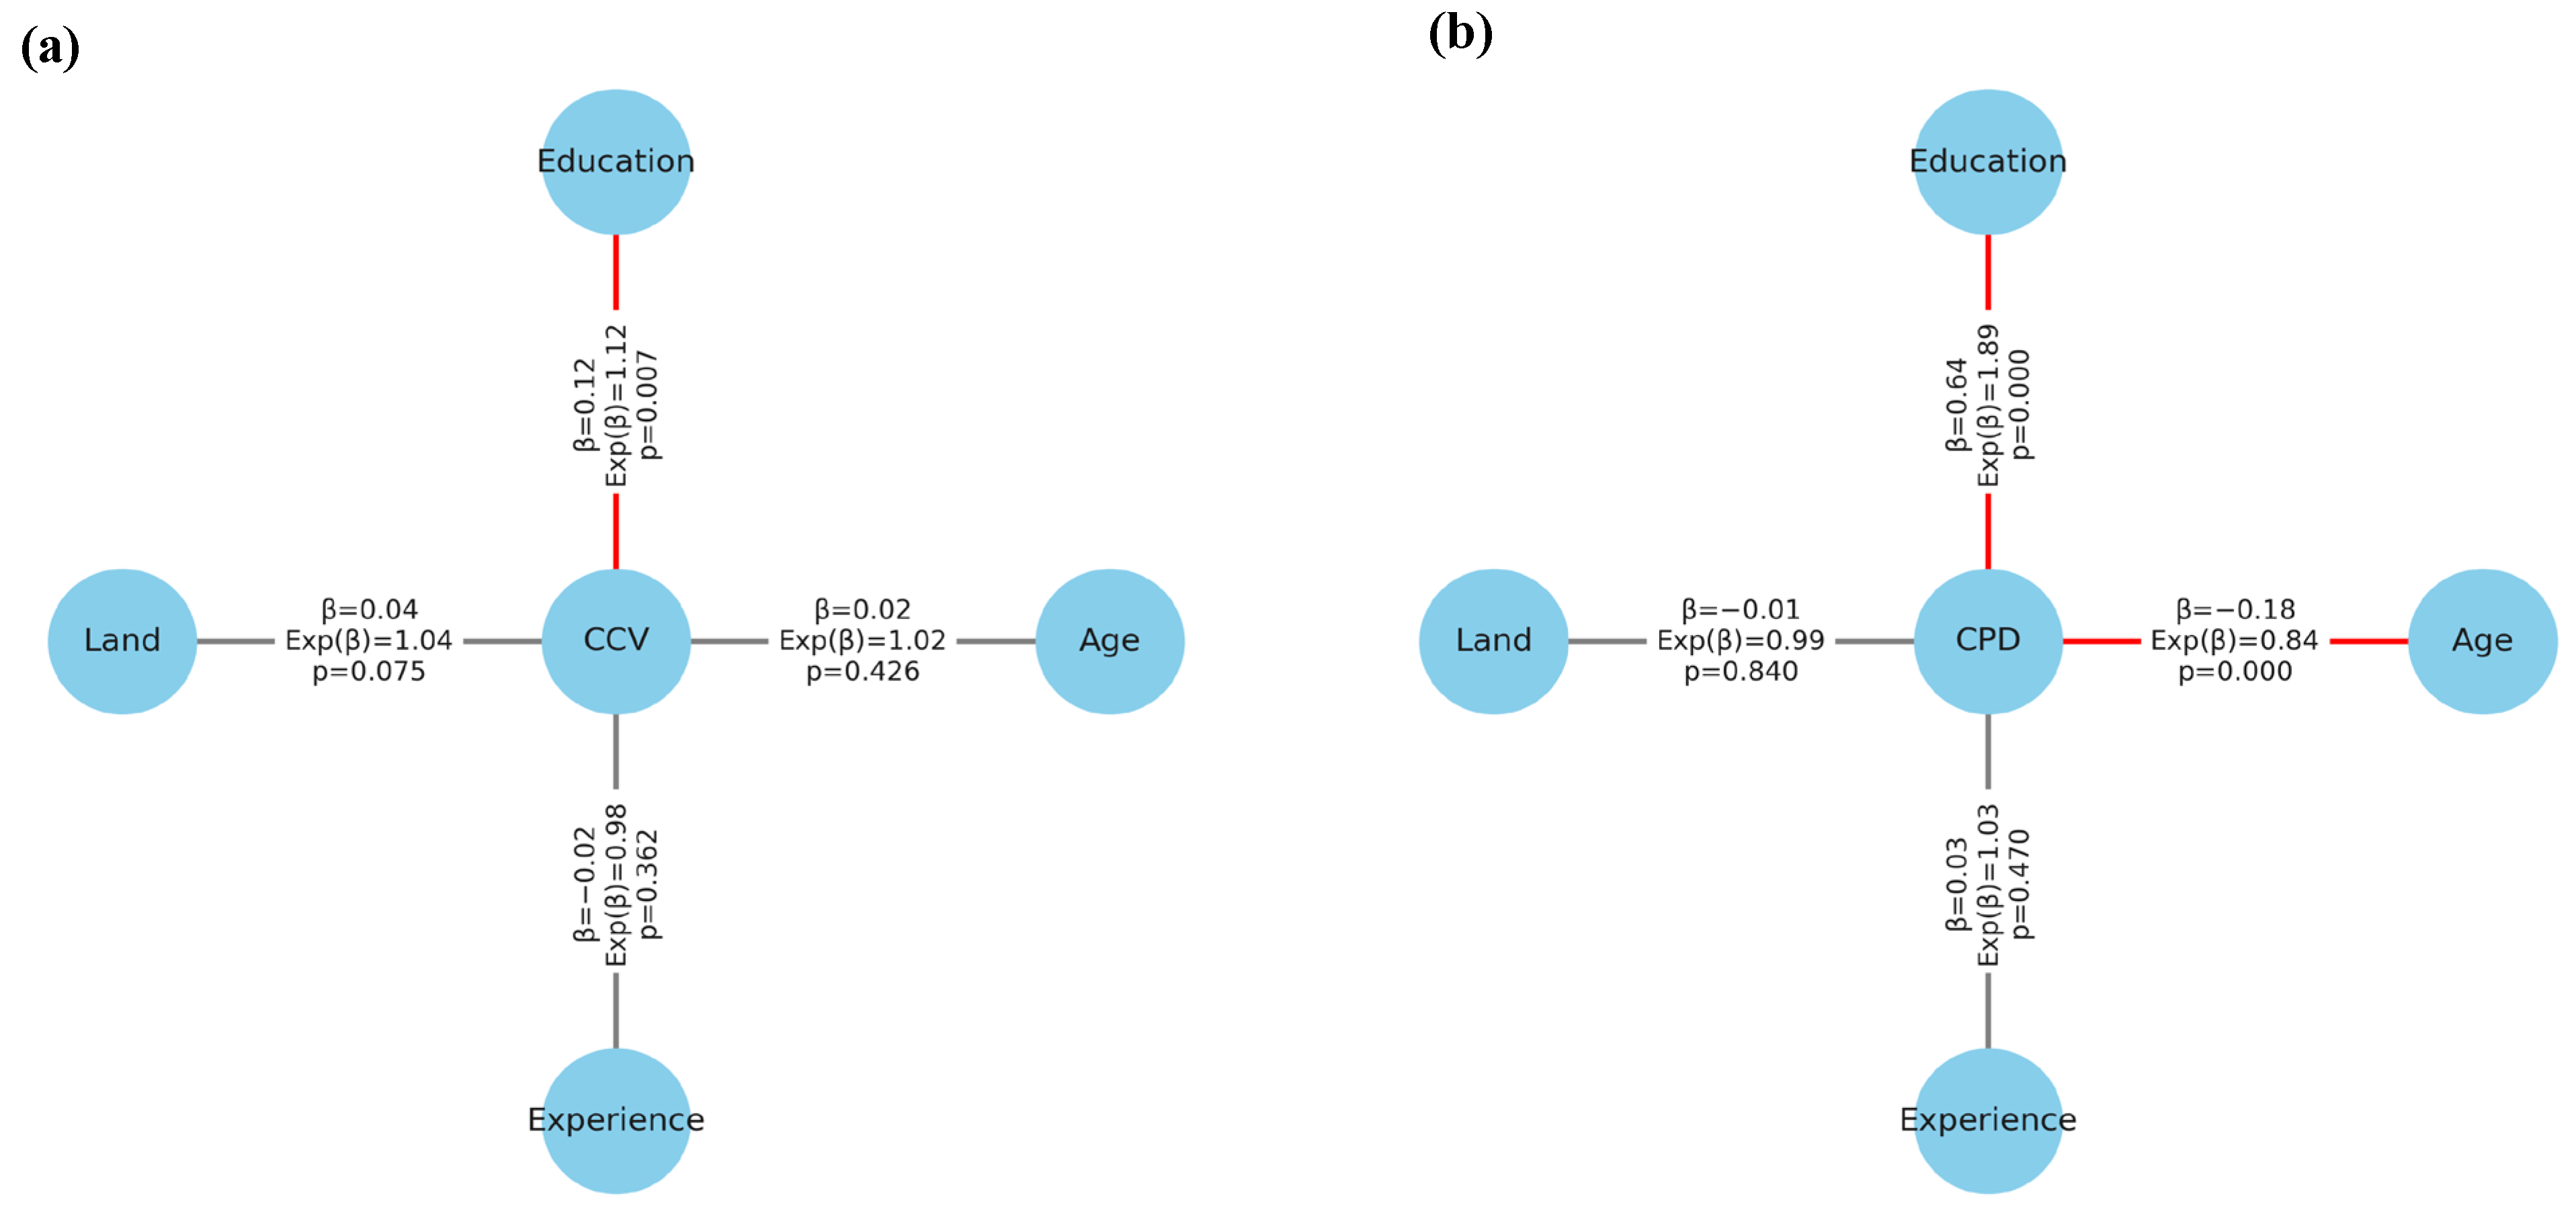
The result of the study indicates that age and education are significant (p < 0.05) predictors of farmers’ adaptation strategy of changing planting dates with age having a negative coefficient of −0.180, suggesting that for each unit increase in age (years), the odds of adapting to changes in planting dates (Figure 7b) decrease by a factor of 0.84 (95% CI: 0.769 to 0.908). Education has a significant positive influence (β = 0.64, p < 0.05) on adapting to changing planting dates, suggesting that with the increase in the level of education, the odds of adapting increase by 1.89 times (95% CI: 1.532 to 2.326). The result of the study further indicates that among the factors considered for adapting to changing crop variety, only education demonstrated a significant association (β = 0.12, p < 0.05), identifying that with the increase in the years of education, chances of adaptation to changing crop variety increase by 1.12 times (95% CI: 1.027 to 1.215). Farmers with a higher level of education were more likely to adjust planting dates and implement soil conservation measures as a method of climate change adaptation [46].
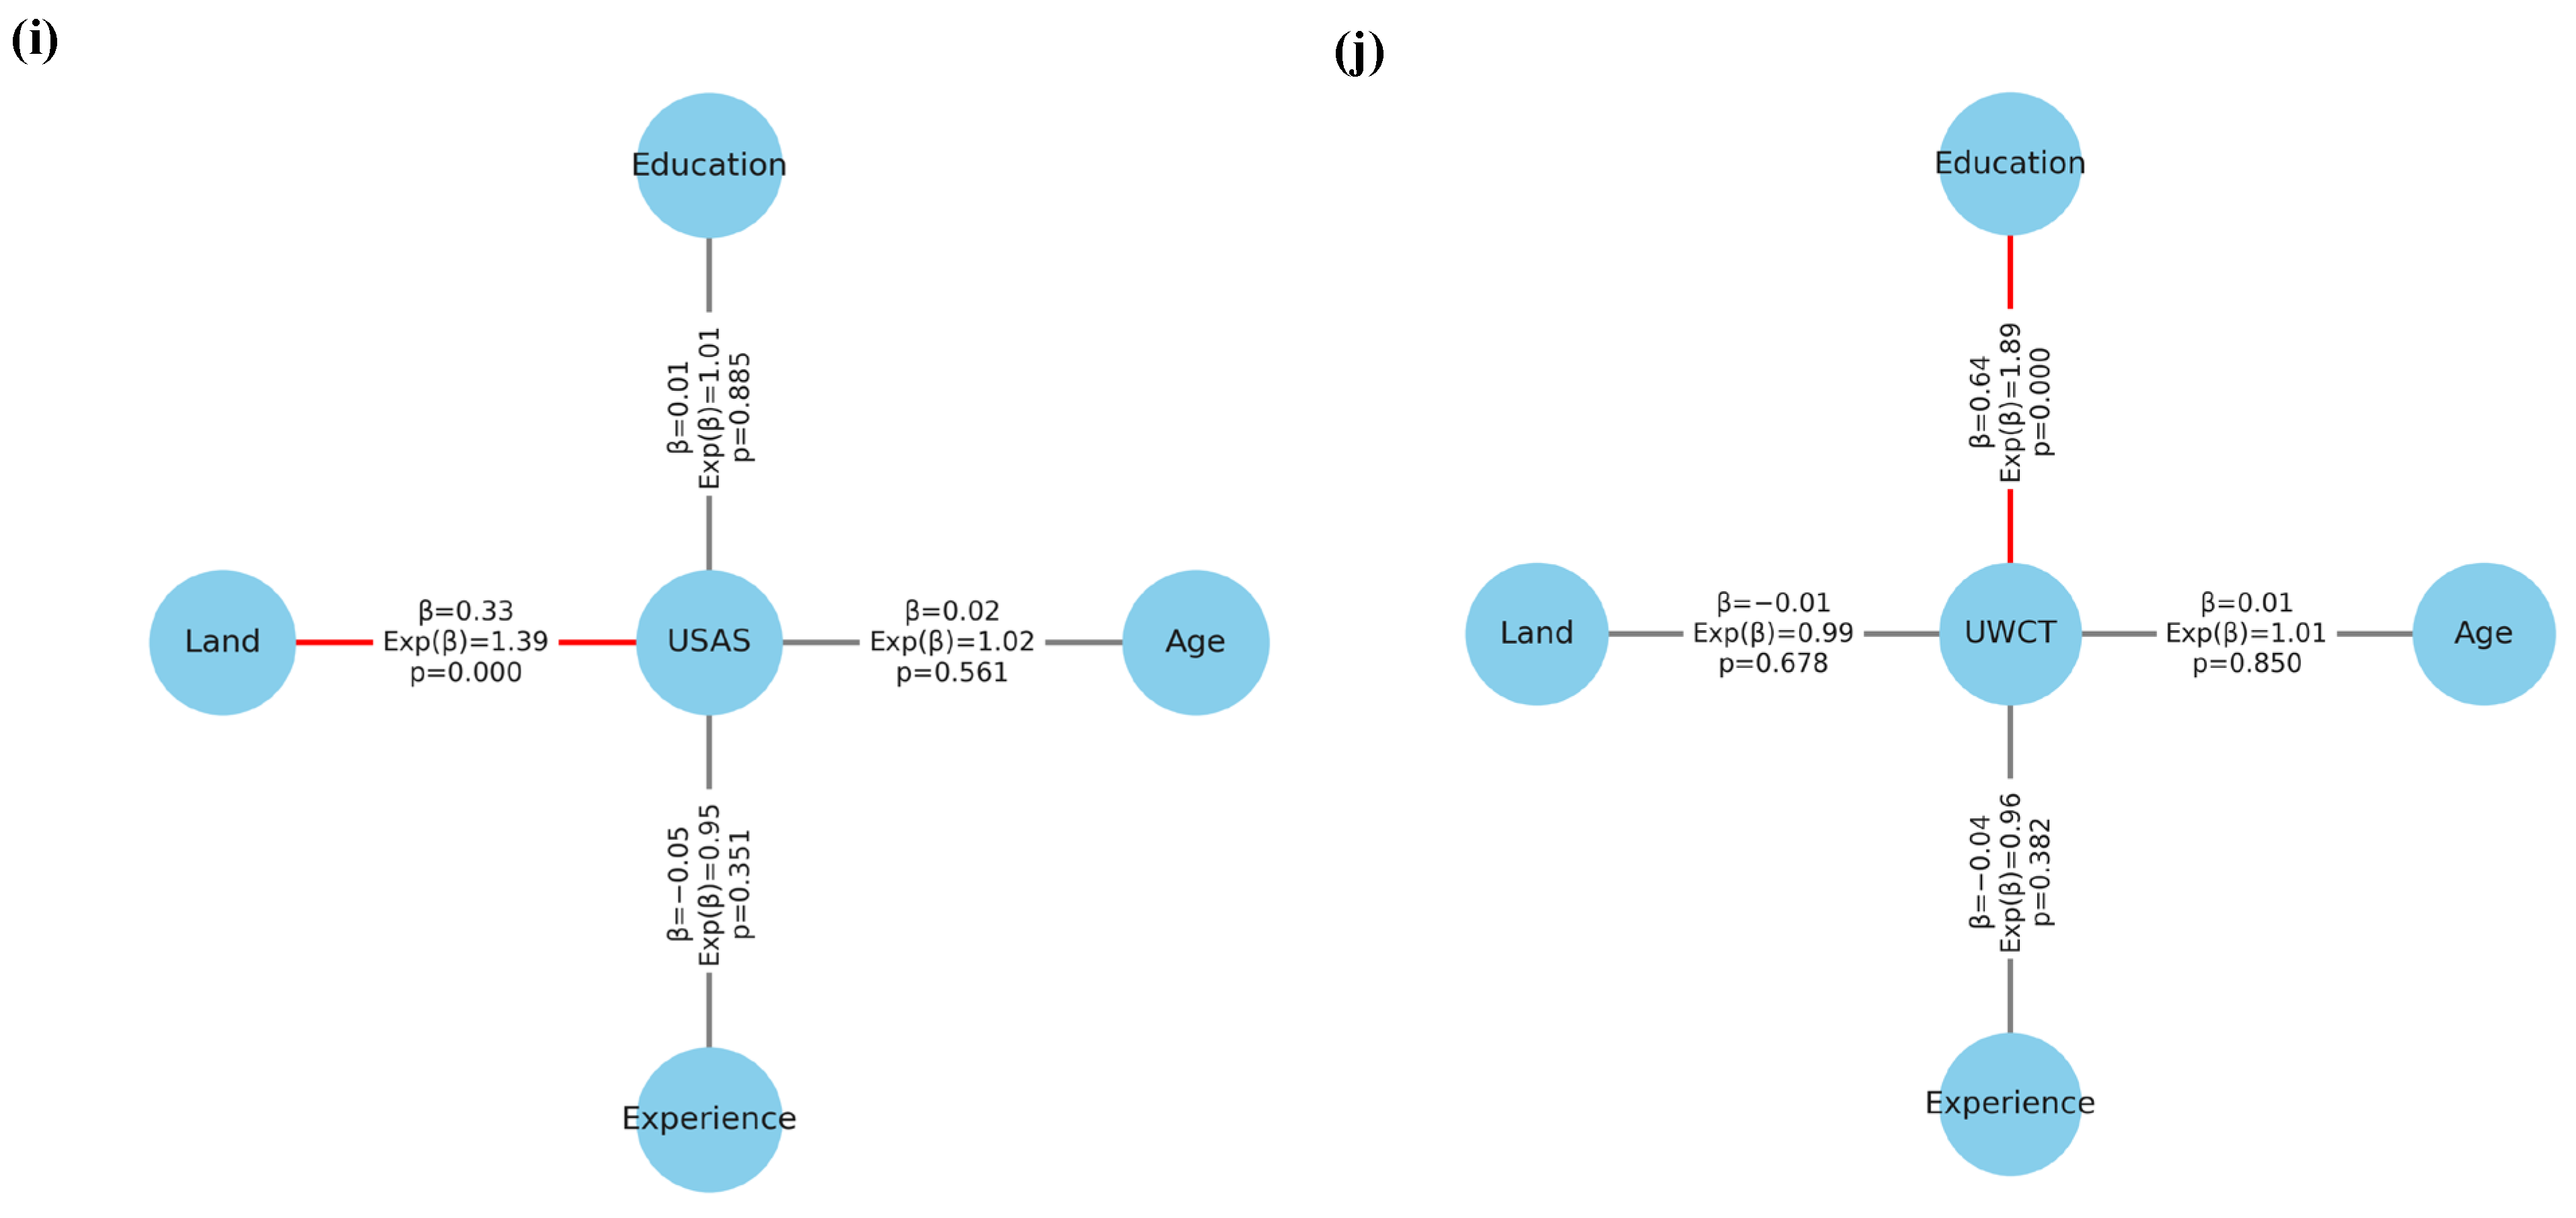
The results indicate that education has a significant positive effect on the likelihood of farmers adopting water conservation techniques (β = 0.64, p < 0.05), suggesting that higher education levels significantly increase the odds of adopting water conservation techniques (Exp(β) = 1.89, 95% CI: 1.484 to 2.416). There was no statistically significant impact of sociodemographic factors, such as age, experience, and land size, on the adaption of techniques for water conservation by farmers (Figure 7d). However, land size positively impacted the use of soil conservation techniques (β = 0.24, p < 0.05). Larger landholdings were associated with a 1.27 times greater likelihood of employing soil conservation practices (95% CI: 1.181 to 1.374). Similar to soil conservation, the use of shades and shelters was positively influenced by the size of the land (β = 0.33, Exp(β) = 1.389, p < 0.05). Farmers with larger land sizes were more inclined to use climate change adaptation measures than small-scale farmers. This aligns with previous research that identifies land size as a crucial factor influencing farmers’ adaptation choices [47,48,49]. The findings show that land size and experience significantly impact farmers’ willingness to use insurance (Figure 7h) as a climate change adaptation strategy. Specifically, having higher land (Exp(β) = 1.09, p < 0.05, 95% CI: 1.035 to 1.142) and more agricultural experience (Exp(β) = 1.16, p < 0.05, 95% CI: 1.093 to 1.234) are related to a higher likelihood of selecting insurance as a means of adaptation. Crop insurance can help farmers deal with the financial effects of unexpected crop loss caused by extreme weather events such as droughts and floods [50].
The findings further indicate that age and land size have a significant impact on the probability of farmers’ decisions to engage in off-farm jobs as an adaptation strategy for climate change (Figure 7g). More precisely, the study found that older farmers (Exp(β) = 0.73, p < 0.05, 95% CI: 0.657 to 0.808) and those with larger land size (Exp(β) = 0.84, p < 0.05, 95% CI: 0.779 to 0.911) are less inclined to seek off-farm job opportunities.
The results further indicate that land size (β = −0.31, p < 0.05) and experience (β = −0.15, p = 0.005) have significant effects on the likelihood of farmers opting for migration as an adaptation strategy (Figure 7e). Specifically, larger land holdings (Exp(β) = 0.73, p < 0.001, 95% CI: 0.608 to 0.880) and higher farming experience (Exp(β) = 0.86, 95% CI: 0.769 to 0.954) are associated with a decreased probability of migration. Migration can be regarded as a viable strategy for adjusting to unusual circumstances, particularly regarding the mobility of labor. It enables individuals to support their families by sending remittances which can be used to meet basic needs such as food during periods of economic crisis [51].
The religious beliefs of farmers as an adaptation strategy to climate change are strongly influenced by age and education. The results suggest that older farmers exhibit a greater likelihood to utilize prayers as a means of adapting to the impacts of climate change (β = 0.31, p < 0.05). The likelihood of farmers believing in prayers (Figure 7f) increases by 1.36 times as age increases (95% CI:1.224 to 1.507). There is a negative correlation between education and the adoption of religious beliefs or prayers as a strategy for adapting to climate change (β= −0.14, p < 0.05).

4. Discussion

This study examines farmers’ perceptions, attitudes, and adaptation strategies regarding climate change in Dera Ghazi Khan, Pakistan. A mixed-methods approach was employed, utilizing climate data from the Pakistan Meteorological Department alongside a survey of 180 randomly selected farmers and focus group discussions. The primary data collection utilized a descriptive cross-sectional design to explore farmers’ perceptions of climate change, the factors influencing their adaptation strategies, and the relationship between socio-economic characteristics and their attitudes towards adaptation measures. Secondary data analysis included climate data to assess trends using the Mann–Kendall test. Ordinal and binary logistic regression models were used to analyze the factors influencing farmers’ perceptions and adaptation strategies.
This study reveals a significant decrease in average minimum temperature and an increase in rainfall patterns over the past two decades (2003–2022) in Dera Ghazi Khan, Pakistan. These trends suggest potential impacts on farmers’ livelihoods and agricultural productivity. Consistent with these findings, a similar study by Abid et al. [29] in Punjab found a slight increase in average temperature during the winter and summer seasons between 1990 and 2010. Their study also revealed a marginal decrease in winter and summer precipitation over the same period. The study results revealed that most farmers perceived floods and unexpected rains as a primary climatic concern in recent years. Similar studies across Pakistan also identify floods, rainfall variability, and weather uncertainty as major concerns for farmers [52,53,54]. The logit model results suggest that education positively impacts farmers’ perception of all the study’s climatic variables. According to recent research findings, farmers’ perceived impacts of climate change are greatly influenced by their educational background, which is thought to influence their level of understanding, farming experience, income level, land ownership, and soil fertility in a variety of ways [55,56]. Farmers with higher education levels are more likely to have better access to information and possess the necessary analytical abilities to comprehend and adjust to expected weather changes [57]. The study results reveal that the extent of damage caused by floods is remarkably higher on crops and livestock in District Dera Ghazi Khan. The result of the study is similar to the findings of other researchers; for example, Saeed [58] reported that the 2010 floods in the district of Swat, Pakistan, increased farmers’ difficulties by destroying 60% of agricultural land. Similarly, Ali et al. [59] found that floods in Pakistan’s northern areas significantly impacted agricultural output, farm infrastructure, livestock, and business operations.
The study identified various adaptation strategies employed by farmers to adjust to the effects of climate change, such as changes in planting dates, crop varieties, migration, water conservation techniques, soil conservation techniques, use of shades and shelters, insurance, religious beliefs or prayers, and changes in the use of fertilizers, pesticides, and insecticides. Among the various strategies used, a substantial majority (65.6%) of farmers utilize religious beliefs/prayers to address the effects of climate change. The adaptation of a person in religious communities can be influenced by their religious beliefs [60,61]. In addition to prayers, farmers are actively involved in changing their agricultural practices. Specifically, farmers are modifying their planting dates: 30% of the farmers are choosing certain crop varieties, and 42.2% are using fertilizer management strategies. Similar studies conducted by other researchers in Pakistan identify that changing planting dates is a significant adaptation strategy by Pakistani farmers because it is easy to implement and needs no extra cost [40,41,62]. Farmers in Pakistan have implemented changes in fertilizer use, pesticide, and insecticide management to improve soil fertility and enhance plant health [63,64,65,66]. To diversify income sources and reduce their dependency on farming income, half of the farmers prefer off-farming jobs as an adaptation strategy to climate change. A similar study by Amir et al. [41] reveals that some households engage in non-agricultural livelihood options, including trade, migration, forestation, and government-to-private employment, both on and off the farm, to mitigate the risks associated with climate variability and extreme weather events. Migration was the least adopted strategy by farmers in the study area.
Socio-economic factors such as gender, age, education level, farm size, and experience have been found to affect adaptation strategies to climatic variability [67,68,69]. The results of binary logistic regression underscore that education has a significant positive influence on farmers’ adaptation strategies, such as changing planting dates, crop varieties, and water conservation techniques. The findings of the study correlate with research indicating that a greater level of education can enhance farmers’ level of information and understanding regarding climate change, their inclination to implement adaptation strategies, and their involvement in various development and natural resource management activities [14,21,70]. Additionally, land size is pivotal in farmers adopting soil conservation techniques, tree planting, and insurance as adaptation strategies. Farmers who possess substantial land holdings are more inclined to have the capacity to explore and allocate resources toward measures aimed at mitigating climate risks [71]. Similar studies conducted by other researchers in Pakistan identify that larger landholding size exerts a favorable and substantial impact on the likelihood of implementing adaptation strategies, including modifying crop types, crop varieties, irrigation techniques, and switching from crops to livestock [29,72]. Moreover, age showed a significant negative correlation with changing planting dates and pursuing off-farming jobs. Younger farmers tend to receive off-farm jobs to raise the income level of households due to uncertainty caused by climatic events. The study conducted by Jamil et al. [73] found that farmer age had a negative relation with farmers’ adaptations to climate change. Meanwhile, age shows a significant positive relation with prayers as a coping strategy against climate change, and this likely reflects the spiritual and psychological coping mechanisms some farmers employ in the face of climate uncertainty [61]. In recent years, many studies have investigated the relationship between religion and climate change adaptation [60,74,75].
The study’s results indicate that farming experience showed a significant positive relation with insurance and a negative association with migration as a coping strategy for climate change. According to Abid et al. [29], farmers with more farming experience implemented a more significant number of adaptation approaches compared to those with lesser education and expertise. Furthermore, the research conducted by Khatri-Chhetri et al. [76] revealed that experienced farmers have shown a greater capacity to adapt to climatic susceptibility. The study combines quantitative surveys, focus group discussions, and key informant interviews with climate data analysis. This comprehensive approach provides a deeper understanding of farmers’ perceptions and adaptation strategies to climate change. The study primarily concentrates on Dera Ghazi Khan, a location that has been greatly impacted by climate-induced risks such as floods and extreme weather events. The results of the study provide valuable case-specific insights that can be used to develop localized adaptation strategies and policies that address the needs of vulnerable communities.

5. Conclusions and Implications

This study investigates the farmers’ perceptions of climate change and their strategies for adaptation. The survey results confirm that farmers’ perceptions of temperature and rainfall align with meteorological data from the past two decades (2003–2022). Climate data indicates a substantial rise in precipitation in recent years. Farmers have also observed an increased frequency of floods and rains, resulting in extensive damage to their crops, livestock, and residences. The result of the ordinal logistic regression identified that among the different socio-demographic characteristics, education has most significantly influenced farmers’ perception regarding climate change. Farmers use numerous adaptation strategies to cope with the adverse effects of climate change. A majority of the farmers were Muslim, so they believed more in religious beliefs/prayers to overcome the negative impacts of climate change. Due to uncertainty caused by climate change, young farmers prefer leaving agriculture and going for off-farm jobs as an adaptation strategy. Among the other adaptation strategies, most farmers adopt a change in chemical fertilizers and pesticides because of regular visits by pesticide sales staff in the area influencing this strategy. The study uses binary logistic regression to assess the relationship between farmers’ adaptation strategies and demographic factors (age, education, land size, and experience). The result of the study indicates that education and land size significantly influence most of the adaptation strategies. If farmers have more education and larger land holdings, they tend to adopt more adaptation strategies to overcome climatic damage. Resource limitations restricted the sample size, but random sampling was employed to enhance the representativeness and reliability of the results. This study was only limited to Dera Ghazi Khan, Punjab Pakistan; therefore, this study recommends that such studies need to be conducted in other parts of the region which are more prone to climatic disasters. The results of this study have various potential policy implications.
Develop and execute educational initiatives that raise knowledge about climate change and promote adaptation strategies, explicitly focusing on farmers with limited educational backgrounds.
Strengthen community resilience against extreme weather events by establishing local disaster preparedness initiatives. This includes training on early warnings, evacuation plans, and infrastructure improvements to mitigate floods and other climate disasters.
In order to facilitate the sustainability of agriculture as the main occupation for smallholder farmers, with a special focus on the younger farmers, it is important to recognize and address their financial constraints. Policies such as the implementation of low-interest loans, support for renewable resources, and measures that promote income diversification can be implemented.
Improving research is essential for understanding the impact of climate change in Pakistan. Continuous monitoring of meteorological data, along with farmer knowledge, promotes a comprehensive and early approach to responding to climate change.
These recommendations must be implemented jointly by government agencies, NGOs, local communities, and other relevant stakeholders to achieve a comprehensive and successful response to the problems posed by climate change in agriculture.

Author Contributions

Conceptualization, S.A.A.S. and M.S.M.; methodology, S.A.A.S.; software, I.M.; validation, S.A.A.S.; formal analysis, M.S.M.; investigation, H.W.; resources, S.A.A.S.; data curation, S.A.A.S.; writing—original draft preparation, M.I.A.; writing—review and editing, I.M.; visualization, I.M.; supervision, H.W.; project administration, M.S.M. All authors have read and agreed to the published version of the manuscript.

Funding

This research was funded by the Postdoctoral Startup Research Fund of Henan University, number (CJ3050A0671293), This work was supported by the grants from the Second Tibetan Plateau Scientific Expedition and Research Program (2019QZKK0903).

Institutional Review Board Statement

The Research Ethics Committee of School of Economics and Management, Northeast Agricultural University, Harbin, China, approved the study (approval no 2023035).

Informed Consent Statement

The study was conducted according to the criteria set by the Declaration of Helsinki, and informed consent was obtained from participants and their parents/legal guardians in the case of minors under 18 years before participating.

Data Availability Statement

Data will be made available on request.

Conflicts of Interest

The authors declare no conflicts of interest.

References

  1. Lobell, D.B.; Schlenker, W.; Costa-Roberts, J. Climate trends and global crop production since 1980. Science 2011, 333, 616–620. [Google Scholar] [CrossRef] [PubMed]
  2. Schmidhuber, J.; Tubiello, F.N. Global food security under climate change. Proc. Natl. Acad. Sci. USA 2007, 104, 19703–19708. [Google Scholar] [CrossRef]
  3. Zeleke, T.; Beyene, F.; Deressa, T.; Yousuf, J.; Kebede, T. Vulnerability of Smallholder Farmers to Climate Change-Induced Shocks in East Hararghe Zone, Ethiopia. Sustainability 2021, 13, 2162. [Google Scholar] [CrossRef]
  4. Arsene, M.B.; Nkulu Mwine Fyama, J. Potential threats to agricultural food production and farmers’ coping strategies in the marshlands of Kabare in the Democratic Republic of Congo. Cogent Food Agric. 2021, 7, 1933747. [Google Scholar] [CrossRef]
  5. Eckstein, D.; Künzel, V.; Schäfer, L. The Global Climate Risk Index 2021; Germanwatch: Bonn, Germany, 2021. [Google Scholar]
  6. Aslam, A.Q.; Ahmad, S.R.; Ahmad, I.; Hussain, Y.; Hussain, M.S. Vulnerability and impact assessment of extreme climatic event: A case study of southern Punjab, Pakistan. Sci. Total Environ. 2017, 580, 468–481. [Google Scholar] [CrossRef] [PubMed]
  7. Qamer, F.M.; Abbas, S.; Ahmad, B.; Hussain, A.; Salman, A.; Muhammad, S.; Nawaz, M.; Shrestha, S.; Iqbal, B.; Thapa, S. A framework for multi-sensor satellite data to evaluate crop production losses: The case study of 2022 Pakistan floods. Sci. Rep. 2023, 13, 4240. [Google Scholar] [CrossRef] [PubMed]
  8. Government of Pakistan. Pakistan Economic Survey 2022–23; Finance and Economic Affairs Division, Ministry of Finance, Government of Pakistan: Islamabad, Pakistan, 2023.
  9. Füssel, H.-M.; Klein, R.J.T. Climate Change Vulnerability Assessments: An Evolution of Conceptual Thinking. Clim. Change 2006, 75, 301–329. [Google Scholar] [CrossRef]
  10. Nelson, E.; Mendoza, G.; Regetz, J.; Polasky, S.; Tallis, H.; Cameron, D.; Chan, K.M.; Daily, G.C.; Goldstein, J.; Kareiva, P.M.; et al. Modeling multiple ecosystem services, biodiversity conservation, commodity production, and tradeoffs at landscape scales. Front. Ecol. Environ. 2009, 7, 4–11. [Google Scholar] [CrossRef]
  11. Robinson, S.-A. Climate change adaptation in SIDS: A systematic review of the literature pre and post the IPCC Fifth Assessment Report. WIREs Clim. Change 2020, 11, e653. [Google Scholar] [CrossRef]
  12. Grothmann, T.; Patt, A. Adaptive capacity and human cognition: The process of individual adaptation to climate change. Glob. Environ. Change 2005, 15, 199–213. [Google Scholar] [CrossRef]
  13. Gbetibouo, G.A.; Hassan, R.M.; Ringler, C. Modelling farmers’ adaptation strategies for climate change and variability: The case of the Limpopo Basin, South Africa. Agrekon 2010, 49, 217–234. [Google Scholar] [CrossRef]
  14. Deressa, T.T.; Hassan, R.M.; Ringler, C. Perception of and adaptation to climate change by farmers in the Nile basin of Ethiopia. J. Agric. Sci. 2011, 149, 23–31. [Google Scholar] [CrossRef]
  15. Below, T.B.; Mutabazi, K.D.; Kirschke, D.; Franke, C.; Sieber, S.; Siebert, R.; Tscherning, K. Can farmers’ adaptation to climate change be explained by socio-economic household-level variables? Glob. Environ. Change 2012, 22, 223–235. [Google Scholar] [CrossRef]
  16. Marie, M.; Yirga, F.; Haile, M.; Tquabo, F. Farmers’ choices and factors affecting adoption of climate change adaptation strategies: Evidence from northwestern Ethiopia. Heliyon 2020, 6, e03867. [Google Scholar] [CrossRef]
  17. Wheeler, S.; Zuo, A.; Bjornlund, H. Farmers’ climate change beliefs and adaptation strategies for a water scarce future in Australia. Glob. Environ. Change 2013, 23, 537–547. [Google Scholar] [CrossRef]
  18. Menike, L.M.C.S.; Arachchi, K.A.G.P.K. Adaptation to Climate Change by Smallholder Farmers in Rural Communities: Evidence from Sri Lanka. Procedia Food Sci. 2016, 6, 288–292. [Google Scholar] [CrossRef]
  19. Tesfaye, W.; Seifu, L. Climate change perception and choice of adaptation strategies. Int. J. Clim. Change Strateg. Manag. 2016, 8, 253–270. [Google Scholar] [CrossRef]
  20. Usman, M.; Ali, A.; Bashir, M.K.; Radulescu, M.; Mushtaq, K.; Wudil, A.H.; Baig, S.A.; Akram, R. Do farmers’ risk perception, adaptation strategies, and their determinants benefit towards climate change? Implications for agriculture sector of Punjab, Pakistan. Environ. Sci. Pollut. Res. 2023, 30, 79861–79882. [Google Scholar] [CrossRef] [PubMed]
  21. Ahmad, D.; Afzal, M. Climate change adaptation impact on cash crop productivity and income in Punjab province of Pakistan. Environ. Sci. Pollut. Res. 2020, 27, 30767–30777. [Google Scholar] [CrossRef]
  22. Government of Punjab. Climate of Dera Ghazi Khan. Available online: https://dgkhan.punjab.gov.pk/climate (accessed on 5 May 2023).
  23. Saleem, M.; Arfan, M.; Ansari, K.; Hassan, D. Analyzing the Impact of Ungauged Hill Torrents on the Riverine Floods of the River Indus: A Case Study of Koh E Suleiman Mountains in the DG Khan and Rajanpur Districts of Pakistan. Resources 2023, 12, 26. [Google Scholar] [CrossRef]
  24. Mahmood, N.; Arshad, M.; Mehmood, Y.; Faisal Shahzad, M.; Kächele, H. Farmers’ perceptions and role of institutional arrangements in climate change adaptation: Insights from rainfed Pakistan. Clim. Risk Manag. 2021, 32, 100288. [Google Scholar] [CrossRef]
  25. Visschers, V.H.M. Public Perception of Uncertainties Within Climate Change Science. Risk Anal. 2018, 38, 43–55. [Google Scholar] [CrossRef] [PubMed]
  26. Pohlert, T. Non-Parametric Trend Tests and Change-Point Detection. CRAN Repository. 2016. Available online: https://CRAN.R-project.org/package=trend (accessed on 5 May 2023).
  27. Prokopy, L.S.; Arbuckle, J.G.; Barnes, A.P.; Haden, V.R.; Hogan, A.; Niles, M.T.; Tyndall, J. Farmers and Climate Change: A Cross-National Comparison of Beliefs and Risk Perceptions in High-Income Countries. Environ. Manag. 2015, 56, 492–504. [Google Scholar] [CrossRef] [PubMed]
  28. Robitzsch, A. Why Ordinal Variables Can (Almost) Always Be Treated as Continuous Variables: Clarifying Assumptions of Robust Continuous and Ordinal Factor Analysis Estimation Methods. Front. Educ. 2020, 5, 589965. [Google Scholar] [CrossRef]
  29. Abid, M.; Scheffran, J.; Schneider, U.A.; Ashfaq, M. Farmers’ perceptions of and adaptation strategies to climate change and their determinants: The case of Punjab province, Pakistan. Earth Syst. Dynam. 2015, 6, 225–243. [Google Scholar] [CrossRef]
  30. Ayanlade, A.; Radeny, M.; Morton, J.F. Comparing smallholder farmers’ perception of climate change with meteorological data: A case study from southwestern Nigeria. Weather Clim. Extrem. 2017, 15, 24–33. [Google Scholar] [CrossRef]
  31. Pakistan Meteorological Department. Pakistan’s Monthly Climate Summary: August 2022; Pakistan Meteorological Department: Islamabad, Pakistan, 2022.
  32. Iqbal, S.; Khan, A.N.; Jadoon, M.A.; Alam, I. Effects of Flood-2010 on Agricultural Sector in Khyber Pakhtunkhwa: A Case of District Charsadda. Sarhad J. Agric. 2018, 34, 1–224. [Google Scholar] [CrossRef]
  33. Douxchamps, S.; Van Wijk, M.T.; Silvestri, S.; Moussa, A.S.; Quiros, C.; Ndour, N.Y.B.; Buah, S.; Somé, L.; Herrero, M.; Kristjanson, P.; et al. Linking agricultural adaptation strategies, food security and vulnerability: Evidence from West Africa. Reg. Environ. Change 2016, 16, 1305–1317. [Google Scholar] [CrossRef]
  34. Kosoe, E.A.; Ahmed, A. Climate change adaptation strategies of cocoa farmers in the Wassa East District: Implications for climate services in Ghana. Clim. Serv. 2022, 26, 100289. [Google Scholar] [CrossRef]
  35. Wang, D.; Hejazi, M.; Cai, X.; Valocchi, A.J. Climate change impact on meteorological, agricultural, and hydrological drought in central Illinois. Water Resour. Res. 2011, 47, W09527. [Google Scholar] [CrossRef]
  36. Church, S.P.; Dunn, M.; Babin, N.; Mase, A.S.; Haigh, T.; Prokopy, L.S. Do advisors perceive climate change as an agricultural risk? An in-depth examination of Midwestern U.S. Ag advisors’ views on drought, climate change, and risk management. Agric. Hum. Values 2018, 35, 349–365. [Google Scholar] [CrossRef]
  37. Nam, W.-H.; Choi, J.-Y.; Hong, E.-M. Irrigation vulnerability assessment on agricultural water supply risk for adaptive management of climate change in South Korea. Agric. Water Manag. 2015, 152, 173–187. [Google Scholar] [CrossRef]
  38. Iglesias, A.; Garrote, L. Adaptation strategies for agricultural water management under climate change in Europe. Agric. Water Manag. 2015, 155, 113–124. [Google Scholar] [CrossRef]
  39. Bhattacharyya, P.; Pathak, H.; Pal, S. Water Management for Climate-Smart Agriculture. In Climate Smart Agriculture: Concepts, Challenges, and Opportunities; Bhattacharyya, P., Pathak, H., Pal, S., Eds.; Springer: Singapore, 2020; pp. 57–72. [Google Scholar]
  40. Abid, M.; Scheffran, J.; Schneider, U.A.; Elahi, E. Farmer Perceptions of Climate Change, Observed Trends and Adaptation of Agriculture in Pakistan. Environ. Manag. 2019, 63, 110–123. [Google Scholar] [CrossRef]
  41. Amir, S.; Saqib, Z.; Khan, M.I.; Ali, A.; Khan, M.A.; Bokhari, S.A.; Zaman ul, H. Determinants of farmers’ adaptation to climate change in rain-fed agriculture of Pakistan. Arab. J. Geosci. 2020, 13, 1025. [Google Scholar] [CrossRef]
  42. Debaeke, P.; Pellerin, S.; Scopel, E. Climate-smart cropping systems for temperate and tropical agriculture: Mitigation, adaptation and trade-offs. Cah. Agric. 2017, 26, 34002. [Google Scholar] [CrossRef]
  43. Atube, F.; Malinga, G.M.; Nyeko, M.; Okello, D.M.; Alarakol, S.P.; Okello-Uma, I. Determinants of smallholder farmers’ adaptation strategies to the effects of climate change: Evidence from northern Uganda. Agric. Food Secur. 2021, 10, 6. [Google Scholar] [CrossRef]
  44. Deressa, T.T.; Hassan, R.M.; Ringler, C.; Alemu, T.; Yesuf, M. Determinants of farmers’ choice of adaptation methods to climate change in the Nile Basin of Ethiopia. Glob. Environ. Change 2009, 19, 248–255. [Google Scholar] [CrossRef]
  45. Suarez, P.; Linnerooth-Bayer, J.; Mechler, R. Feasibility of Risk Financing Schemes for Climate Adaptation: The Case of Malawi; World Bank: Washington, DC, USA, 2007. [Google Scholar]
  46. Gebru, G.W.; Ichoku, H.E.; Phil-Eze, P.O. Determinants of smallholder farmers’ adoption of adaptation strategies to climate change in Eastern Tigray National Regional State of Ethiopia. Heliyon 2020, 6, e04356. [Google Scholar] [CrossRef]
  47. Ashraf, M.; Routray, J.K.; Saeed, M. Determinants of farmers’ choice of coping and adaptation measures to the drought hazard in northwest Balochistan, Pakistan. Nat. Hazards 2014, 73, 1451–1473. [Google Scholar] [CrossRef]
  48. Asfaw, S.; McCarthy, N.; Lipper, L.; Arslan, A.; Cattaneo, A. What determines farmers’ adaptive capacity? Empirical evidence from Malawi. Food Secur. 2016, 8, 643–664. [Google Scholar] [CrossRef]
  49. Trinh, T.Q.; Rañola, R.F.; Camacho, L.D.; Simelton, E. Determinants of farmers’ adaptation to climate change in agricultural production in the central region of Vietnam. Land Use Policy 2018, 70, 224–231. [Google Scholar] [CrossRef]
  50. Salvatore Di, F.; Marcella, V. How Can African Agriculture Adapt to Climate Change? A Counterfactual Analysis from Ethiopia. Land Econ. 2013, 89, 743. [Google Scholar] [CrossRef]
  51. Barnett, J.; O’neill, S. maladaptation. Glob. Environ. Change 2010, 20, 211–213. [Google Scholar] [CrossRef]
  52. Hussain, S.S.; Mudasser, M. Prospects for wheat production under changing climate in mountain areas of Pakistan—An econometric analysis. Agric. Syst. 2007, 94, 494–501. [Google Scholar] [CrossRef]
  53. Atta ur, R.; Khan, A.N. Analysis of flood causes and associated socio-economic damages in the Hindukush region. Nat. Hazards 2011, 59, 1239–1260. [Google Scholar] [CrossRef]
  54. Ahmad, H.; Öztürk, M.; Ahmad, W.; Khan, S.M. Status of Natural Resources in the Uplands of the Swat Valley Pakistan. In Climate Change Impacts on High-Altitude Ecosystems; Öztürk, M., Hakeem, K.R., Faridah-Hanum, I., Efe, R., Eds.; Springer International Publishing: Cham, Switzerland, 2015; pp. 49–98. [Google Scholar]
  55. Raza, A.; Ahrends, H.; Habib-Ur-Rahman, M.; Gaiser, T. Modeling Approaches to Assess Soil Erosion by Water at the Field Scale with Special Emphasis on Heterogeneity of Soils and Crops. Land 2021, 10, 422. [Google Scholar] [CrossRef]
  56. Shah, A.A.; Shaw, R.; Ye, J.; Abid, M.; Amir, S.M.; Kanak Pervez, A.K.M.; Naz, S. Current capacities, preparedness and needs of local institutions in dealing with disaster risk reduction in Khyber Pakhtunkhwa, Pakistan. Int. J. Disaster Risk Reduct. 2019, 34, 165–172. [Google Scholar] [CrossRef]
  57. Mamun, A.A.; Roy, S.; Islam, A.R.M.T.; Alam, G.M.M.; Alam, E.; Chandra Pal, S.; Sattar, M.A.; Mallick, J. Smallholder Farmers’ Perceived Climate-Related Risk, Impact, and Their Choices of Sustainable Adaptation Strategies. Sustainability 2021, 13, 11922. [Google Scholar] [CrossRef]
  58. Saeed Khan, K. Analysing local perceptions of post-conflict and post-floods livelihood interventions in Swat, Pakistan. Dev. Policy Rev. 2019, 37, O274–O292. [Google Scholar] [CrossRef]
  59. Ali, A.; Rana, I.A.; Ali, A.; Najam, F.A. Flood risk perception and communication: The role of hazard proximity. J. Environ. Manag. 2022, 316, 115309. [Google Scholar] [CrossRef] [PubMed]
  60. Bergmann, S. Climate Change Changes Religion. Stud. Theol. Nord. J. Theol. 2009, 63, 98–118. [Google Scholar] [CrossRef]
  61. Hulme, M. Climate Change and the Significance of Religion. Econ. Political Wkly. 2017, 52, 14–17. [Google Scholar]
  62. Rahman, M.H.U.; Ahmad, A.; Wang, X.; Wajid, A.; Nasim, W.; Hussain, M.; Ahmad, B.; Ahmad, I.; Ali, Z.; Ishaque, W.; et al. Multi-model projections of future climate and climate change impacts uncertainty assessment for cotton production in Pakistan. Agric. For. Meteorol. 2018, 253–254, 94–113. [Google Scholar] [CrossRef]
  63. Amin, A.; Nasim, W.; Mubeen, M.; Ahmad, A.; Nadeem, M.; Urich, P.; Fahad, S.; Ahmad, S.; Wajid, A.; Tabassum, F.; et al. Simulated CSM-CROPGRO-cotton yield under projected future climate by SimCLIM for southern Punjab, Pakistan. Agric. Syst. 2018, 167, 213–222. [Google Scholar] [CrossRef]
  64. Anser, M.K.; Hina, T.; Hameed, S.; Nasir, M.H.; Ahmad, I.; Naseer, M.A.U.R. Modeling Adaptation Strategies against Climate Change Impacts in Integrated Rice-Wheat Agricultural Production System of Pakistan. Int. J. Environ. Res. Public Health 2020, 17, 2522. [Google Scholar] [CrossRef]
  65. Ali, M.F.; Rose, S. Farmers’ perception and adaptations to climate change: Findings from three agro-ecological zones of Punjab, Pakistan. Environ. Sci. Pollut. Res. 2021, 28, 14844–14853. [Google Scholar] [CrossRef]
  66. Shahid, R.; Shijie, L.; Shahid, S.; Altaf, M.A.; Shahid, H. Determinants of reactive adaptations to climate change in semi-arid region of Pakistan. J. Arid Environ. 2021, 193, 104580. [Google Scholar] [CrossRef]
  67. Dang, H.L.; Li, E.; Nuberg, I.; Bruwer, J. Factors influencing the adaptation of farmers in response to climate change: A review. Clim. Dev. 2019, 11, 765–774. [Google Scholar] [CrossRef]
  68. Ojo, T.O.; Baiyegunhi, L.J.S. Determinants of climate change adaptation strategies and its impact on the net farm income of rice farmers in south-west Nigeria. Land Use Policy 2020, 95, 103946. [Google Scholar] [CrossRef]
  69. Thinda, K.T.; Ogundeji, A.A.; Belle, J.A.; Ojo, T.O. Understanding the adoption of climate change adaptation strategies among smallholder farmers: Evidence from land reform beneficiaries in South Africa. Land Use Policy 2020, 99, 104858. [Google Scholar] [CrossRef]
  70. Kibue, G.W.; Pan, G.; Joseph, S.; Xiaoyu, L.; Jufeng, Z.; Zhang, X.; Li, L. More than two decades of climate change alarm: Farmers knowledge, attitudes and perceptions. Afr. J. Agric. Res. 2015, 10, 2617–2625. [Google Scholar]
  71. Bryan, E.; Ringler, C.; Okoba, B.; Roncoli, C.; Silvestri, S.; Herrero, M. Adapting agriculture to climate change in Kenya: Household strategies and determinants. J. Environ. Manag. 2013, 114, 26–35. [Google Scholar] [CrossRef] [PubMed]
  72. Sardar, A.; Kiani, A.K.; Kuslu, Y. Does adoption of climate-smart agriculture (CSA) practices improve farmers’ crop income? Assessing the determinants and its impacts in Punjab province, Pakistan. Environ. Dev. Sustain. 2021, 23, 10119–10140. [Google Scholar] [CrossRef]
  73. Jamil, I.; Jun, W.; Mughal, B.; Waheed, J.; Hussain, H.; Waseem, M. Agricultural Innovation: A comparative analysis of economic benefits gained by farmers under climate resilient and conventional agricultural practices. Land Use Policy 2021, 108, 105581. [Google Scholar] [CrossRef]
  74. Gifford, R. The dragons of inaction: Psychological barriers that limit climate change mitigation and adaptation. Am. Psychol. 2011, 66, 290–302. [Google Scholar] [CrossRef] [PubMed]
  75. McNeeley, S.M.; Lazrus, H. The Cultural Theory of Risk for Climate Change Adaptation. Weather Clim. Soc. 2014, 6, 506–519. [Google Scholar] [CrossRef]
  76. Khatri-Chhetri, A.; Aggarwal, P.K.; Joshi, P.K.; Vyas, S. Farmers’ prioritization of climate-smart agriculture (CSA) technologies. Agric. Syst. 2017, 151, 184–191. [Google Scholar] [CrossRef]
Figure 1. Map of the study area.
Sustainability 16 07070 g001
Figure 2. Major findings of focus group discussion. Source: Own calculation through the interview.
Sustainability 16 07070 g002
Figure 3. Climate change trends in the study area (2003–2022) based on the Mann–Kendall trend test. This figure illustrates the climate change trends in Dera Ghazi Khan from 2003 to 2022, analyzed using the Mann–Kendall trend test. The graphs display the annual trends for key climatic parameters. Source: Calculations based on Metrological Department Pakistan.
Sustainability 16 07070 g003
Figure 4. Distribution of farmers (%) by land size, education level, tenancy status, and age. Source: Own calculation through the interview about climate change (n = 180).
Sustainability 16 07070 g004
Figure 5. Climate change impact on farmers’ socio-economic status. Source: Own calculation through the interview (n = 180).
Sustainability 16 07070 g005
Figure 6. Farmers’ adaptation strategies in response to climate change. This figure depicts the distribution of farmers (n = 180) in Dera Ghazi Khan, Pakistan, according to their reliance on various adaptation strategies to cope with climate change impacts. Source: Own calculation through the interview (n = 180).
Sustainability 16 07070 g006
Figure 7. (aj) The partial least square (PLS) path diagram represents the relation between independent variables (age, education, land, and experience) and dependent variables. Nodes (circles) represent variables in the model; red line indicates a statistically significant association, and the p-value is less than or equal to 0.05. Gray line indicates an association that is not statistically significant, with a p-value greater than 0.05. This suggests that the evidence for a relationship in the data is weak or that there is no strong effect. β (coefficient): logistic regression coefficient, represents the magnitude and direction of the relationship between variables. A positive value suggests a positive association, while a negative value (indicated by a clearer negative sign “−”) suggests a negative association. Exp(β) (odds ratio) represents the change in odds for a one-unit increase in the independent variable. CCV = changing crop variety, CPD = changing planting dates, CUCFP = change in use of chemical fertilizers and pesticides, ISCT = implementation of soil conservation techniques, M = migration, RBP = religious beliefs and prayers, SOFJ = search for off-farming jobs, UI = use of insurance, USAS = use of shades and shelters, and UWCT = use of water conservation techniques.
Sustainability 16 07070 g007aSustainability 16 07070 g007bSustainability 16 07070 g007c
Table 1. Description of variables used in ordinal and logit models.
Variable NameVariable Description
Dependent Variables (Ordinal)
Perceived weather uncertaintyLikert Scale: ranges from 1 (Very low) to 5 (Very High)
Perceived pollutionLikert Scale: ranges from 1 (Very low) to 5 (Very High)
Perceived soil erosionLikert Scale: ranges from 1 (Very low) to 5 (Very High)
Perceived floodsLikert Scale: ranges from 1 (Very low) to 5 (Very High)
Perceived heatwaveLikert Scale: ranges from 1 (Very low) to 5 (Very High)
Perceived rainLikert Scale: ranges from 1 (Very low) to 5 (Very High)
Perceived droughtLikert Scale: ranges from 1 (Very low) to 5 (Very High)
Dependent Variables (Logit)
Change in planting dates1 = Adopted, 0 = Not adopted
Change crop varieties1 = Adopted, 0 = Not adopted
Use of water conservation techniques1 = Adopted, 0 = Not adopted
Implementation of soil conservation techniques1 = Adopted, 0 = Not adopted
Use of shades and shelters1 = Adopted, 0 = Not adopted
Migration1 = Adopted, 0 = Not adopted
Insurance1 = Adopted, 0 = Not adopted
Search for off-farming jobs1 = Adopted, 0 = Not adopted
Religious beliefs or prayers1 = Adopted, 0 = Not adopted
Change the use of chemical fertilizers, pesticides, and insecticides1 = Adopted, 0 = Not adopted
Independent Variables
AgeContinuous
EducationContinuous
Land in acresContinuous
ExperienceContinuous
Table 2. Trends in climatic parameters (2003–2022).
Climatic ParametersSum of RanksKendall’s Taup-Value (Two-Tailed)Var (S)Sen’s SlopeHypothesis
Annual Rainfall640.3370.0419506.592Ha Accept
Annual Maximum Temperature10.0051.0009330Ho Accept
Annual Minimum Temperature−66−0.3570.034938.6−0.065Ha Accept
Alpha = 0.05. The alpha level is set at 0.05, the chosen significance level. This table summarizes the Mann–Kendall trend test results for annual rainfall, maximum temperature, and minimum temperature in Dera Ghazi Khan, Pakistan, over the period 2003–2022. Source: Calculations based on Metrological Department Pakistan.
Table 3. Farmer perception regarding climate change impacts.
Environmental IssuesPerception (%)Mean
Very LowLowModerateHighVery High
Weather Uncertainty15.027.827.222.27.82.80
Floods3.324.438.927.85.63.07
Rain1.115.628.343.911.13.48
Drought7.832.837.220.61.72.75
Heat waves9.429.435.021.15.02.82
Soil erosion25.622.828.318.94.42.53
This table summarizes farmer perceptions of various environmental issues related to climate change in the study area. Source: Own calculation through the interview (n = 180).
Table 4. Logistic regression analysis: Factors influencing farmer perceptions of climate change.
VariablesPerceived Weather UncertaintyPerceived RainPerceived Soil ErosionPerceived FloodsPerceived HeatwavePerceived Drought
EstimateOREstimateOREstimateOREstimateOREstimateOREstimateOR
Age−0.017 **0.9840.007 **1.007−0.026 **0.9740.006 **1.006−0.193 *0.825−0.031 **0.969
Education0.226 *1.2540.180 *1.1970.109 *1.1150.326 *1.3860.272 *1.3130.220 *1.246
Land−0.016 **0.9840.002 **1.0020.279 *1.3210.117 *1.1240.000 **1.0000.005 **1.005
Experience in farming−0.012 **0.988−0.066 *0.936−0.012 **0.9880.041 *1.0420.025 **1.0250.072 *1.075
Link function: Logit. This parameter is set to zero because it is redundant; * = significance p < 0.05; ** = non-significance p > 0.05. OR = odds ratio; Source: Own calculation through the interview about climate change (n = 180).
Disclaimer/Publisher’s Note: The statements, opinions and data contained in all publications are solely those of the individual author(s) and contributor(s) and not of MDPI and/or the editor(s). MDPI and/or the editor(s) disclaim responsibility for any injury to people or property resulting from any ideas, methods, instructions or products referred to in the content.