Abstract
Although piped water is a safely managed water source, many people prefer drinking packaged/bottled water, which undermines environmental sustainability by creating waste plastics. Thus, to encourage drinking tap water, this study aimed to identify and fill the discrepancy between consumers’ perception of and the actual quality of the municipal water supply in Indonesia. Through questionnaire surveys in three cities, i.e., Malang, Bogor, and Semarang cities, we found that the majority of the residents, namely, 82%, 58%, and 66%, respectively, drank packaged water. Although the piped water supply from Perusahaan Daerah Air Minum (PDAM) has a good appearance, color, taste, and water quality, sporadic microbial contamination was detected due to the depletion of residual chlorine. However, packaged water was also contaminated by indicator bacteria owing to storage methods. There was a notable discrepancy between the residents’ perceptions of tap water safety and their choices of drinking water sources. The residents perceived spring water as a clean source, which influenced their selection of water sources more than the costs of water. Public drinking stations installed by PDAM helped to win consumers’ trust in PDAM water, indicating that installing more public drinking stations will encourage more people to drink piped water.
1. Introduction
Many households worldwide rely on packaged drinking water as their main source of drinking water [1,2,3]. The USA, China, and Indonesia combined comprise half of the global market for packaged drinking water, while per capita sales and consumption are high in Singapore and Australia [3]. In developing countries, packaged drinking water consumption is a response to the lack of publicly provided safe drinking water, even though the piped water supply in these areas is expanding [2,4]. Nevertheless, the high consumption of packaged drinking water persists, even in European countries, including Germany, France, and Belgium, where the piped water coverage is high, and the citizens trust the piped water quality [5,6,7]. Moreover, the higher cost of packaged water, ranging from hundreds to thousands of times more expensive per unit volume than tap water, exacerbates water inequality, particularly impacting marginalized communities [8]. In Quezon City, the Philippines, income disparity and socioeconomic factors such as legal status and property ownership contribute to the unequal access to safely managed water sources, with the poorest quintile frequently lacking access to piped water and, instead, depending on expensive vended water for drinking [9]. In the US, bottled water consumption and spending, as well as the distrust and avoidance of tap water, are significantly higher and growing faster among low-income households, exacerbating the already substantial economic and racial inequalities [8].
Despite efforts to extend piped water coverage, many people do not drink tap water because of negative perceptions and a preference for the taste of packaged drinking water [7]. However, studies have found no association between public perception and the actual drinking water quality [10,11]. Previous studies have reported that multiple factors influence the public perception of tap water, including organoleptic properties (especially flavor and color), risk perception, previous experience, contextual indicators in the water supply, the fear of chemicals, trust in water companies, environmental impacts, cost and price value, and demography [12,13,14]. Easy access to commercialized packaged water is another reason for not drinking tap water [15]. Lifestyle shifts, the decline in meals consumed at home, and demands for more convenience have led to the increasing consumption of single-serve beverages [16]. Additionally, the diversity of the types, prices, and distribution channels of bottled water contributes to attracting various types of customers [6].
Packaged drinking water is available in different packaging: disposable packaging such as bottles, cups, and sachets; refillable bulk containers, for example, polycarbonate bottled drinking water produced and refilled by manufacturers; and refilled water from drinking water depots [17]. The consumption of packaged drinking water is associated with environmental impacts from manufacturing to consumption, stemming from the raw materials and energy inputs required for production, transportation energy often derived from fossil fuels, and the disposal of used plastic bottles [18]. Producing one liter of packaged water requires 2000 times more energy than the same amount of tap water [19]. A life cycle analysis revealed that the raw materials required for bottle manufacturing accounted for the major impact of bottled mineral water, namely, approximately 90% of the impact on the indicators of abiotic depletion, acidification, eutrophication, global warming, ozone layer depletion, and photochemical oxidation [20]. The environmental impact of packaged drinking water is considerably higher than that of tap water with additional boiling and reverse osmosis treatment [20,21]. Furthermore, the recycling rates of used packages are low at 52% in Europe, 29% in the US, and 26% in Southeast Asia, resulting in large amounts of waste packages being discarded in landfills or the environment [22,23,24]. The weathering of plastics eventually leads to fragmentation and the creation of microplastics [25]. Exposure to sunlight degrades plastic packaging, with heavy metals leaching into the water and posing a health risk [26]. The presence of microplastics has been found in packaged drinking water worldwide [27]. Aside from source water contamination, studies have indicated that the packaging itself may release microparticles into the water, as the particles in the water consist of materials similar to those of the packaging [28,29]. Therefore, reducing packaged water consumption by promoting piped water for drinking is a global issue for environmental sustainability.
The high reliance of wealthy households in developing countries on packaged drinking water, instead of tap water, reduces demands for safe tap water and reinforces the association of bottled water with high social status [2]. Meanwhile, the increased consumption of packaged drinking water by low-income residents indicates inequality in access to good quality water [30]. Water utility performance can be improved by understanding customers’ preferences and perception of water quality [31]. Promoting the use of potable piped water not only garners public support for water utilities but also mitigates the environmental impacts associated with packaged water consumption [31].
In Indonesia, packaged drinking water consumption has steadily increased, with a growth rate of 1.24% per year from 2000 to 2020. Projections suggest that, by 2026, half of the Indonesian population will rely on packaged drinking water [32]. This trend is primarily fueled by the challenges associated with piped water supply, characterized by poor quality and the degradation of groundwater and surface water sources [33]. Consequently, only 9% of the population utilized piped water for drinking in 2022, despite a piped water coverage of 35% [34,35]. The high consumption of packaged water, coupled with an inadequate solid waste management infrastructure, exacerbates environmental burdens by exacerbating plastic pollution and strains on waste management systems, as evidenced by the generation of 3.22 million metric tons of mismanaged plastic waste annually [36]. In Jakarta, the PET bottle recycling rate was estimated at 69%, with 18% disposed of in landfills and 13% leaking into the environment, whereas the national estimate was considerably lower at 22% due to a lower waste collection coverage [22]. This condition causes plastic pollution in coastal and marine environments, as it was found that plastic bottle fragments make up 22.9% of the plastic pollution in Cilacap Coast, Central Java [15]. Therefore, it is crucial to encourage people in Indonesia to drink tap water instead of packaged water in order to reduce plastic pollution and expenditure for water consumption, as well as to ease the burden on waste management systems.
This study aims to promote the use of the potable municipal water supply by filling the discrepancy between consumers’ perceptions of and the actual water quality of the municipal water supply in Indonesia. We analyze customers’ perceptions of piped water supply and other water sources using a questionnaire survey in three cities in Indonesia, and we also analyze the actual water quality of the piped water supply to determine the discrepancy between consumer’s perceptions and the actual water quality. Based on the findings, we propose approaches for promoting the use of the potable piped water supply.
2. Materials and Methods
2.1. Study Areas
The study areas were three cities in Indonesia, i.e., Bogor, Malang, and Semarang cities (Figure 1a). These cities are located on Java Island, which is the most populous island in Indonesia. These cities have a high population density and service area coverage of municipal piped water supplied by the municipal water supply company PDAM (Perusahaan Daerah Air Minum) in Indonesia. Table 1 shows the details of the study areas. These three cities were selected for their geographical diversity, socioeconomic variation, water supply infrastructure, and environmental challenges. Bogor City is a part of the Jakarta metropolitan area of West Java, with a population of approximately 1.05 million; the average temperature is 26 °C, and it has a high annual rainfall of 3400 mm. The service coverage in Bogor City is 91%, with raw water taken from rivers (81%) and springs (19%). Bogor City faces water supply and management challenges due to rapid urbanization and industrial growth. Malang City is located in East Java, and it is known for its relatively cool climate, with an average temperature of 25 °C. It has a population of approximately 0.86 million, with a moderately high population density. The service coverage is high at 100%, with raw water taken from springs (80%) and amended with groundwater (20%). Semarang City, the capital of Central Java, has a population of around 1.69 million, and, among the three cities, it has the lowest service coverage at 60%. The average temperature is 28 °C, and the water sources are rivers (76%), deep wells (15%), and springs (9%). Semarang is a coastal city that experiences groundwater salinization and surface water pollution.
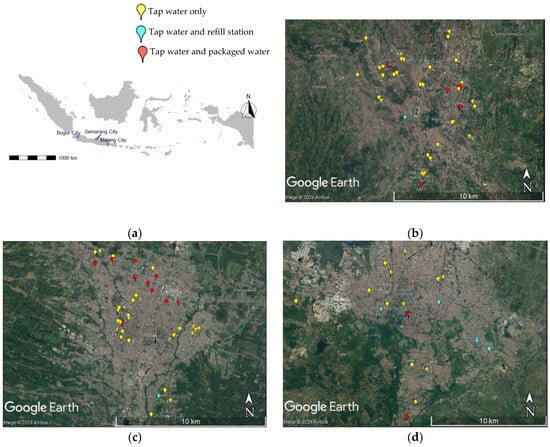
Figure 1.
Study areas. (a) Locations of the study areas: (b) Bogor City, (c) Malang City, and (d) Semarang City. Yellow points indicate the sampling sites for tap water only; light blue points indicate sampling sites for tap water and refill stations; and red points indicate sampling sites for tap water and packaged water. Some dots are overlapped due to close proximity.

Table 1.
Area, population, and water supply systems in the study areas.
2.2. Questionnaire Survey
We selected 50 households connected to the PDAM water supply in each city, totaling 150 households. The survey was conducted in August–September 2023, during the dry season. The households were selected randomly from various parts of the cities to obtain representative results across different areas of the water supply. Figure 1b–d shows the locations of the households in each city. The respondents were either the heads of the households (41) or their wives (109). The answers were made anonymous following the research ethics guidelines of the University of Tokyo (Approval No. KE23-49). The questionnaire was composed of six sections. The first section was about the respondents’ background information, including gender, house ownership, household size, and family income. The second section was about water sources for drinking, cooking, and other daily activities (bathing, washing, etc.). If the households used multiple sources for each purpose, the most frequently used source was selected. The third section comprised questions about tap water quality, including color, odor, and taste, and perceptions of tap water safety for drinking, cooking, and other uses. The fourth section was about their perception of the safety of packaged water and refill station water, as well as their knowledge of water sources. The fifth section asked their thoughts on bottled water prices and water tariffs. The last section comprised questions asking about the possibility of shifting from drinking packaged water to drinking tap water.
2.3. Water Quality Analyses
A total of 189 samples were collected from 150 households in the three cities during the same periods as the questionnaire survey: 150 samples from tap water, 30 samples from packaged drinking water, and 9 samples from refill stations. The tap water samples were taken from either water meter taps and taps inside the house or the average of both depending on accessibility. Because of the limitations of sampling, packaged water or refill station water samples were not collected in all households. Eight water quality parameters, i.e., pH, turbidity, total dissolved solids (TDS), color, residual free chlorine, residual total chlorine, E. coli, and total coliforms, were analyzed. The pH and TDS were measured using a compact pH meter (Apera instrument Zentest PC60-Z, Shanghai, China). Turbidity was measured using a portable turbidimeter (Thermo Scientific Eutech TN-100, Landsmeer, The Netherlands). Color was measured using a portable color checker (Hanna, Smithfield, VA, USA). Residual free chlorine and residual total chlorine were measured using a portable calorimeter (DR900 HACH LANGE ®, Loveland, CO, USA). E. coli and the total coliform were measured using the membrane filtration method (Method 10029, USEPA, Washington, DC, USA).
2.4. Cost Analysis
The monthly costs of packaged water, piped water supplied by PDAM, and refill station water were compared. As it is a common habit to boil PDAM water before drinking, the cost of boiling was also included. The costs of two boiling options were calculated: stovetop and electric kettle boiling. For stovetop boiling, the cost included the monthly expenditure on LPG (liquid petroleum gas) used for boiling water, and, for the electric kettle alternative, the cost included the monthly expenditure on electricity used for boiling water. We assumed that the proportion of cooking fuel used for boiling drinking water was 13.9% [46] and that the monthly demand for fuels in typical urban Indonesian households was 12 kg [46]. The retail price for LPG in 2023 was IDR 17,500 (USD 1.2) per kg; a kettle volume of 1 L, a power of 0.6 kW, and an electrical tariff of IDR 1444/kWh (USD 0.09) were used for this calculation. The water consumption, water tariff, and costs of the packaged water and refill station water were obtained through the questionnaire survey.
2.5. Public Drinking Water Tap
Malang City PDAM installed public drinking water taps in schools, universities, and public areas as a program to communicate to the residents that their supplied water is safe to drink. To determine whether the public drinking taps have affected people’s perception of tap water, we interviewed 30 users of the public drinking taps. The interview survey consists of both open and closed-end questions on how the respondents found the public drinking taps, whether they thought the public drinking taps were safe, what factors made them think that the public drinking taps were safe, and whether the public drinking taps improved their trust in the municipal piped water.
2.6. Data Analysis
A statistical analysis was performed using R (v. 4.3) to compare the water quality data and the respondents’ answers. The Kruskal–Wallis test was used for an analysis of the differences among more than two sample groups. The Chi-squared test was used to examine associations between categorical data. The statistical test results were considered significant at p-values < 0.05.
3. Results
3.1. Perception of Water Quality
Figure 2 shows the water sources for drinking and cooking in the three cities. The majority of the respondents in the three cities use packaged water for drinking (Figure 2a), namely 82% in Bogor, 58% in Malang, and 66% in Semarang. Most of the households use 19-L polycarbonate packaged water and store them in a water dispenser or use a mini-water pump to serve the water for drinking. Additionally, 14% of the respondents in Bogor, 40% of the respondents in Malang, and only 8% of the respondents in Semarang use PDAM water as their drinking water source, while 26% of Semarang residents use refill station water. Water refill stations are small businesses that sell treated water. Customers bring their own containers (usually a 19-L polycarbonate bottle), and the stations clean the bottles and fill them. Some stations offer to pick up empty bottles and deliver refilled ones to the customers’ homes. The total percentage of households who drink PDAM water in the three cities is 21%. Households that use PDAM as their drinking water source always boil the water before consumption. The majority of the households in Bogor (72%) use PDAM water for cooking, while 26% use packaged water (Figure 2b). Furthermore, 92% of the households in Malang and 60% of the households in Semarang use PDAM water for cooking, while 26% use refill station water, and 14% use packaged water.
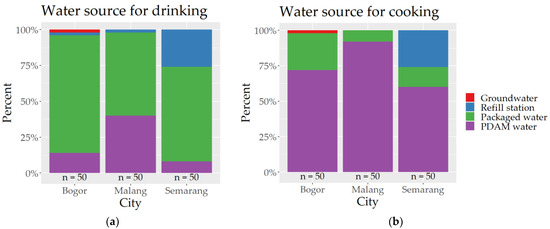
Figure 2.
Water sources of households in three cities for (a) drinking and (b) cooking.
To determine whether the respondents’ perception of water quality had an influence on their selection of water sources, we asked, “Do you think PDAM water is safe for drinking?” (Figure 3a) or “for cooking?” (Figure 3b). The percentage of respondents who answered “Safe” and “Safe if boiled” for drinking is higher in Malang (80%) than in Bogor (42%) and Semarang (50%), which is in line with the highest percentage of households drinking PDAM water in Malang (Figure 2a); however, the percentage of households actually drinking PDAM water is 40%, namely, only half of those who answered “Safe” and “Safe if boiled”, indicating a large discrepancy between their perception and the actual selection of water sources. The percentages of households answering “Not safe” and “I don’t know” are high in Bogor (58%) and Semarang (50%), leading to a lower percentage of households drinking PDAM water in these cities than in Malang. As for the question “Do you think the PDAM water is safe for cooking?” (Figure 3b), the percentage of households answering “Safe” is larger than that for drinking water: 68% in Bogor, 96% in Malang, and 76% in Semarang. This is probably because cooking involves heating the water. However, we should note that boiling alone may not eliminate physicochemical contaminants, and its effectiveness in reducing microbial contamination could be compromised by storage and hygiene practices [47]. The selection of boiling as a method for household water treatment over alternative methods, e.g., filtration, may also have been influenced by the residents’ primary concern about microbial contamination rather than physicochemical contamination. Still, the percentage of households answering “Safe” for cooking is higher than the percentage of households answering “Safe” and “Safe if boiled” combined for drinking water. There is a misconception about water safety for drinking and cooking. When water is used for cooking, it is often mixed with other ingredients, which makes the water quality, especially taste, less noticeable. In addition, people ingest drinking water directly, whereas cooking water is not directly ingested but rather ingested via cooked food, which may influence people’s perception of water safety. Moreover, when people use water for cooking, it is mostly heated in the process of cooking, e.g., cooking rice and making soups, which makes people feel that it is safe to use water for cooking.
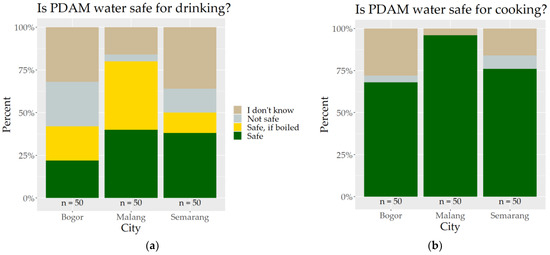
Figure 3.
Households’ answers to the questions (a) “Is PDAM water safe for drinking?” and (b) “Is PDAM water safe for cooking?”.
Figure 4 shows the respondents’ knowledge about the water sources of packaged water and PDAM water. The percentage of respondents knowing the water source of PDAM water is lower than that for packaged water in Bogor and comparable to that in Semarang; however, the percentage of respondents knowing the water source of PDAM water is higher than that for packaged water in Malang. Although the percentage of households who knew the water sources of PDAM water and packaged water is the lowest in Malang among the three cities (44%, 52%, and 64% for PDAM sources and 26%, 60%, and 66% for packaged water sources in Malang, Bogor, and Semarang, respectively), the largest percentage of households use PDAM water for drinking (40%) and cooking (92%). This might be because those who knew PDAM water sources answered correctly with “spring” or “spring and groundwater”, whereas the majority of those who knew the PDAM water sources in Bogor and Semarang answered correctly with “river”. These results indicate that, while many households do not know the water sources, those who do know the water sources think that spring and groundwater are cleaner sources and are more suitable for drinking than river sources. This is in agreement with the result showing that the majority of those who knew the source of packaged water answered “spring water”, which influenced their selection of packaged water for drinking.
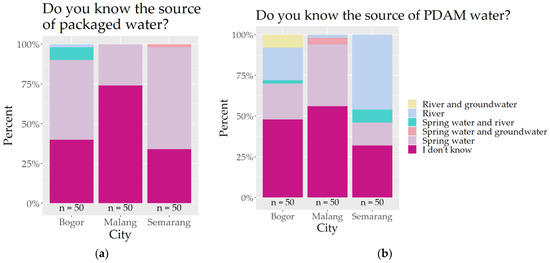
Figure 4.
Households’ knowledge of water sources of (a) packaged water and (b) PDAM water.
Although the selection of correct answers to questions on water sources and the choice of drinking water sources has no significant correlation (Chi-squared test, p > 0.05), water source knowledge seems to have a significant association with the selection of PDAM water for drinking. The answers to the question “Do you know the source of PDAM water?” are significantly associated with the answers to “Is PDAM water safe to drink?” (Chi-squared test, p < 0.01). Although water quality problems arise occasionally, PDAM water generally has a good appearance, color, and taste, as reported by the respondents. Most respondents describe safe water as “water with no color, no smell, and no distinguishable taste”, which means that their perception of safety is influenced by organoleptic qualities, primarily color/appearance, taste, and smell.
3.2. Water Quality
All the samples of PDAM water met the standard set by the Ministry of Health Regulation in terms of a pH of 6.5–8.5 and a turbidity of less than 3 NTU, and the color of all samples was less than the detection limit of 10 TCU. The TDS concentration was also below the standard of 300 mg/L, with some outliers in Malang City (Figure 5a). The TDS in the PDAM water was lower in Bogor than in Semarang, and this is because the main water sources are river water and spring water, respectively. However, the TDS in the PDAM water in Semarang was high and comparable to the TDS in Malang, indicating that we took more samples from households receiving piped water from spring sources than from households receiving piped water from river sources. The TDS in packaged water varied extensively compared to the TDS in PDAM water and refill water, which indicates that the packaged water was taken from not only spring and groundwater but also from different sources, as opposed to people’s perceptions (Figure 4a). In general, the TDS in river water is lower than in groundwater and spring water. In Bogor, the median value of the TDS in PDAM water was lower than in packaged water, indicating that the majority of packaged water was sourced from groundwater or springs. However, the TDS in PDAM water was significantly higher than in packaged water in Semarang and Malang, which indicates that the packaged water was sourced from river water as opposed to people’s perceptions (Figure 4a). These results indicate that people select packaged water for drinking (Figure 2a) based on their misconception that packaged water is sourced from springs and groundwater. A study found that people do not discriminate between waters when the difference in the TDS is less than 150 mg/L [48]. In Malang and Semarang, the difference in the TDS between PDAM water and packaged water could be as high as 150 mg/L or even greater than refill station water; therefore, people might notice a difference in the taste. While taste is one of the factors, noticeable taste could also be linked to odor [49].
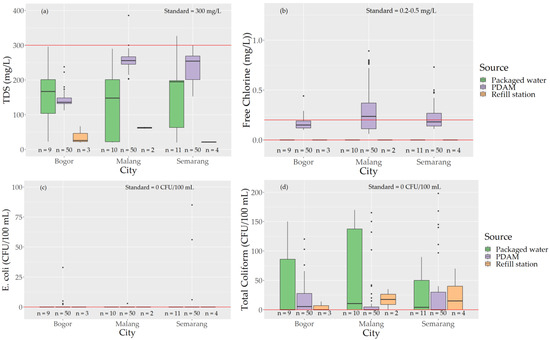
Figure 5.
Water quality of three water sources in three cities. (a) TDS; (b) residual free chlorine; (c) E. coli; and (d) total coliform in different water sources. Black dots indicate outliers below or above the interquartile range (IQR).
Figure 5b shows the residual free chlorine concentration in the tap water. While the standard for residual free chlorine is 0.2–0.5 mg/L, 76% of the samples from Bogor fell below 0.2 mg/L. In Malang, the concentration of residual chlorine ranged from 0.06 to 0.89 mg/L, with 44% of the samples being below the standard, while in Semarang, the value ranged from 0.11 to 0.73 mg/L, with 52% of the samples being below the standard. Malang may have had the highest median value of residual free chlorine because the water was sourced from spring water, while river water was the main source in Bogor and Semarang; river water contains more contaminants that consume chlorine than groundwater and spring water.
It was found that the free residual chlorine concentration in the tap water was significantly different among the households who drink PDAM water, packaged water, and refill station water (Kruskal–Wallis test, p < 0.05). Similarly, the residual free chlorine in the tap water was significantly different among the households that use different water sources for cooking (Kruskal–Wallis test, p < 0.05), indicating that households using packaged water for drinking and cooking tend to have higher residual chlorine and avoid using PDAM water due to the chlorine smell. However, there was no significant difference in the residual free chlorine levels between the respondents who answered yes and no to the question “Is PDAM water safe for drinking?” (Kruskal–Wallis test, p > 0.05), which indicates that the chlorine smell is only unpleasant and is not linked to water safety.
Figure 5c shows the E. coli counts of different water sources. In tap water, E. coli was detected in 5 samples in Bogor, 1 sample in Malang, and 5 samples in Semarang, and total coliforms were detected in 62 samples in the three cities. The fact that a higher number of E. coli-positive samples were taken from the taps in Bogor and Semarang than in Malang is in agreement with the observation of a lower residual chlorine concentration in Bogor and Semarang than in Malang, indicating the importance of maintaining the residual chlorine concentration within the standard. It should also be noted that E. coli was not detected in any of the samples taken from packaged water and refill stations. Thus, compared with packaged water and refill stations, the microbial safety of PDAM water is compromised because the residual chlorine is lower than the standard, which is an issue that needs to be rectified in order to win the confidence of the customers in the safety of PDAM water. The free chlorine concentration was slightly higher in the tap water samples of households who answered “Safe” and “Safe if boiled” to the question “Do you think PDAM water is safe to drink?” (see Figure A1 in the Appendix A).
Figure 5d shows the total coliforms in the water samples. As opposed to the E. coli results, a large number of total coliforms were detected in the packaged water, followed by the refill station water and PDAM water. High numbers of total coliforms indicate microbial growth during storage in households, which poses a potential risk of microbial contamination. Total coliforms and E. coli were still detected in samples with residual free chlorine ranging from 0.1 to 0.3 mg/L. The national standard for residual chlorine is 0.2–0.5 mg/L. In our study, 12 of the 62 PDAM water samples that were found to contain total coliforms had residual chlorine above 0.2 mg/L (See Figure A2 in the Appendix A). Total coliforms were detected in 15 out of 30 samples from household drinking water dispensers for packaged water, which is comparable to previous findings where total coliforms were detected in 66% of electric dispensers in Kathmandu Valley, Nepal [47]. This finding is not in agreement with customers’ perception of the superior safety of packaged water to PDAM water, refill station water, or private borehole water. Although 46% of the households answered that PDAM water is “Safe” and “Safe, if boiled” and had tap water meeting the standard for total coliforms and E coli, only 5% of them actually drank PDAM water. Thus, there are discrepancies among the actual water quality, customers’ perceptions of water safety, and their choices of drinking water sources. However, the total coliforms and E. coli were mostly found in the households that answered “Not safe” and “I don’t know” (See Figure A3 and Figure A4 in the Appendix A).
3.3. Cost Comparison of Different Water Sources for Drinking
From the questionnaire survey, we found that, on average, a household with four members consumed 2.5 packages of 19 L packaged water per week. The price range for packaged water was IDR 17,000–50,000 (USD 1.1–3.2) per package, while the price range for refill station water was IDR 6000–20,000 (USD 0.4–1.2) per 19 L. Table 2 shows the monthly costs of PDAM water, packaged water, and refill station water.

Table 2.
Monthly cost of drinking water.
PDAM water costs are generally lower than packaged water and refill station water costs. Boiling using an electric kettle is considerably cheaper than using a kettle, but electric kettles are not commonly used in households in the study areas. Although packaged water costs much more than PDAM and refill station water, most respondents think that the price is appropriate. This is probably because 54% of the respondents have a family income above IDR 5,000,000 (USD 333) per month; this makes their expenditure on drinking water not more than 3.4%, which is within the World Bank’s suggested range of 3–5% [50]. However, household income did not seem to significantly influence the selection of water sources. Among the low-income households earning less than IDR 2,000,000/USD 133 per month, 7% of the households had the highest expenditure on drinking water, at 9% of their monthly income.
3.4. Public Drinking Stations
An interview survey was conducted in Malang City with individuals who use the public drinking taps installed by PDAM. The majority of the respondents (67%) discovered these drinking stations by passing by them, underscoring the importance of physical presence and visibility in raising awareness. Additionally, 40% of the respondents reported drinking from the public taps 5–7 times a week, indicating a consistent reliance on these facilities for hydration. Because most users found the drinking stations by passing by them or through word of mouth from friends and family, the influence of public drinking taps as a safe drinking water source is limited to those who live or work nearby.
The respondents generally had positive impressions of the PDAM drinking stations, with 67% answering that they are “Safe” to drink. Their first impressions of the drinking stations were “good or neutral taste” (36%) and “convenient” (24%). However, three respondents (10%) noted a foreign taste, indicating potential concerns about the water quality.
Among those who consumed PDAM water at home, their opinions on the taste of tap water and the drinking station water varied; while 50% of the respondents answered that there was no difference (50%), others preferred the taste of the water from the drinking stations (37%), although there is no water cooling. The majority of the respondents (67%) reported that PDAM drinking stations improved their trust in PDAM water quality. Interestingly, even among those who did not switch to drinking PDAM water at home, there was an increase in trust in PDAM water quality, suggesting that the presence of public drinking stations positively influences public perception of the quality of PDAM water, regardless of their behavior. When asked “Which factors make you think the water from the drinking stations are safe to drink?”, most respondents answered organoleptic qualities such as appearance, taste, and smell (Table 3). Four respondents (13%) referred to the collective experience, noting that they observed their friends consuming the water without becoming sick.

Table 3.
Factors influencing drinking water users’ perception of water safety.
The interviews with the respondents revealed that social influence and family preferences play crucial roles in water source selection. Three respondents mentioned switching from tap water to packaged water to align with the preferences of their spouse or children. This indicates that household dynamics and the desire for harmony can drive water consumption choices. In an interview with a PDAM officer, they said that the goal of installing public drinking stations in schools was to give the message to school children that PDAM water is safe to drink, hoping that they will inspire behavior change in their families. Although public drinking taps have improved trust in PDAM water, PDAM staff reported that people mistake the drinking stations for water treatment units and, thus, drink only from drinking stations. Public drinking stations, despite providing the same water as household taps, are perceived differently due to their modern appearance and dedicated purpose. This highlights the role of presentation and context in shaping consumer perceptions of water quality. Public education and assurance of water quality are important to rectify the misconceptions about tap water.
4. Discussion
Public perception and actual water quality. Although nearly half of the households’ perceptions of water safety were correct based on microbiological water quality analyses, only 5% of the households actually drank PDAM water. This shows that the perception of safety is not the sole factor influencing households’ selection of water sources, which indicates a discrepancy between the perception of water safety and the actual selection of water sources. A study in Canada also found existing disconnectedness between public perceptions of drinking water quality and the actual quality, where differing opinions persisted in communities supplied from the same water sources, despite efforts by the provincial government to make the water quality reports available on its website [10]. A study in Uganda found discrepancies between perceived and measured tap water quality, where its quality was perceived as lower than the actual measured quality, resulting in unnecessary additional treatment [51].
Although the sporadic detection of E. coli in PDAM water in this study was not reported to the households, it is important to note that we found that all of the households boil piped water before drinking, which implies their perception of the microbial risks of piped water for drinking. In this study, the percentage of samples contaminated with total coliforms was higher for packaged water samples (50%) than for PDAM water samples (41%). Ikhsan et al. [32] also found that packaged drinking water is not always safe, although people often perceive it to be of good quality. Puspita et al. [17] suggested that households often buy bottled water because of its perceived superior quality and health benefits. This preference persists even though packaged water is not entirely free from microbial contamination [10] Etale et al. [52] suggested that psychological factors such as affect, social norms, and the image associated with bottled water consumption significantly influence consumer choices. Bottled water is often perceived as a status symbol or a healthier option, creating a positive affective response, which tap water lacks. Packaged water is associated with spring water which is perceived to be a clean water source; however, the TDS variation suggests that it is taken from different sources. Most packaged water company advertisements suggest that their raw water originates from springs in remote forests, promoting an image of purity. This marketing strategy relies on the assumption that everything from nature is inherently pure and healthy [33]. Nastiti et al. [53] found that spring water is highly regarded because some spring water entrepreneurs and refill station owners test their water and share the results with the community; this creates a positive reputation, even though locals do not test the water themselves. Contrarily, even though the PDAM tests water regularly, people worry about the water sources and recontamination in the distribution network [53]. A study in Mexico City found that inhabitants of Mexico City do not drink tap water despite information on water quality provided by the company; apparently, they are not interested in ascertaining water quality details and would rather continue their habit of drinking bottled water [54].
Water sources. In Malang, the percentage of households using PDAM water was the highest among the three cities; this was mainly because the water source of Malang PDAM is spring water that is clean enough to be delivered as piped water without treatment. The questionnaire survey revealed that households perceived spring water and groundwater to be clean sources of water suitable for drinking and cooking, whereas they perceived river water to be unsuitable for drinking; therefore, the percentages of households drinking PDAM water were low in Bogor and Semarang, where PDAM takes raw water mainly from rivers. Because Bogor PDAM depends on river water as a major source of water supply, it requires more investment for water treatment processes than Malang PDAM. Because of the low service coverage and history of intermittent supply, many households have shifted to privately owned water suppliers or refill stations. In Semarang, the percentage of households who used refill stations for drinking and cooking was higher than in the other two cities because refill stations are more popular, owing to their easy availability and lower price.
Residual chlorine. One critical factor contributing to the selection of drinking water is the presence of residual chlorine in the water. Chlorine smells are often reported in water utilities around the world. The threshold for chlorine smell varies between North Americans and Europeans; the French, who normally drink water with no or low concentrations of chlorine, have a lower threshold for chlorine smell detection than Americans [55,56]. Residual chlorine is necessary for microbial disinfection, ensuring the safety of drinking water by preventing the growth of harmful pathogens. However, the downside is the chlorine smell, which many people associate with unclean or unsafe water. This aversion to the chlorine smell leads to a preference for alternative water sources, such as packaged water and water from refill stations, which are perceived to be cleaner despite the lack of significant evidence to support this belief. The dual nature of residual chlorine—essential for safety but unpleasant in terms of odor—plays a significant role in shaping people’s perception and their subsequent selection of drinking water sources, often overshadowing the objective quality and safety of PDAM water. Even though households seemed to have knowledge of the purpose of chlorination to disinfect water, aversion to the chlorine smell persisted. This aversion is also reinforced by the message conveyed by bottled water brands that their product is processed by nature [33]. Therefore, it is important to enhance the operation and management of the water treatment plants and the pipelines to maintain high pressure and residual chlorine concentration in the distribution networks at levels between the standards and below the threshold for chlorine smell detection.
Microbial contamination. Microbiological contamination is a concern with PDAM water, with 7% of the samples contaminated with E. coli and 41% of the samples contaminated with total coliforms. However, total coliforms were also detected in the packaged water (50%) and refill station water (44%), indicating that microbial growth in storage tanks in households might be a cause of contamination. PDAM must protect the whole water supply network from microbial contamination. There was a significant difference in the total coliform presence between those who answered “Not safe” and “I don’t know” and those who answered “Safe” and “Safe if boiled” (Chi-squared, p < 0.05). Additionally, E. coli was detected in 7% of the samples, which also corresponds to the percentage of respondents who answered “Not safe” and “I don’t know, and there was a significant difference (binomial test, p < 0.05), even though the majority of the respondents (78%) had never tested their water, and none reported experiencing illness from contaminated water. Microbial contamination was found even in samples containing residual free chlorine above the standard of 0.2 mg/L, which indicates the need to increase the concentration of residual free chlorine to prevent microbial contamination. However, higher doses of chlorine may increase the chlorine smell. If PDAM succeeds in convincing the residents about the safety of piped water for drinking, then consumers would stop boiling, save costs, and reduce the environmental burden. Therefore, improved maintenance and operation of the water treatment plants and the pipelines, as mentioned before, is necessary to ensure that the supplied piped water is 100% free from E. coli.
Cost of water. Cost is not a factor for selecting drinking water sources because 60% of the respondents found the prices of both packaged water and PDAM water to be appropriate. Purwandari et al. (2021) found that 64% of surveyed households spent more than 4% of their monthly income on water, and the highest percentage of expenditure on water was 24.7% for packaged water [57]. Prayoga et al. (2021) found that water expenditures for low-income, middle-income, and high-income households were 3.4, 2.69, and 1.64% of their income, respectively [58]. Becoming accustomed to high expenditures on drinking water is probably one of the reasons for finding the high price of packaged water to be appropriate. Drinking packaged water may have become a trend and habit that has normalized the expense of packaged water. It has become common for every house to have a water dispenser. Moreover, people may not realize that drinking packaged water is much more expensive than drinking PDAM water because it can be bought in smaller quantities, and delivery is usually included. The price of paying for packaged water also comes with the convenience of having water anytime without the need for boiling. A study in Jakarta found that low-income individuals viewed refilled water as the most affordable, safe, and easily accessible drinking water source [17], even though it was more expensive than PDAM water. A study in the US found that the economic consequences of household perceptions of drinking water as being unsafe are borne disproportionately by already disadvantaged minority groups because it creates reliance on more expensive bottled water [59]. The cost of boiling using an LPG stove accounted for 50–60% of the total cost and using an electric kettle could reduce the cost by up to 50%. Electric kettles could also alleviate the inconvenience of boiling water; thus, electric kettles should be recommended for residents accustomed to boiling water. At the same time, PDAM should improve its service to supply bacteria-free water that is safe to drink without boiling. This approach would reduce the cost and alleviate the inconvenience associated with boiling water. Additionally, it would reduce the environmental impact of the energy used for boiling water and decrease the consumption of packaged water.
5. Conclusions
This study revealed discrepancies between consumer perceptions and actual water quality, particularly in the use of municipal water (PDAM) for drinking and cooking in Malang, Bogor, and Semarang cities, Indonesia. People prefer drinking packaged water, even when the PDAM water meets the national water quality standards. This preference persists even though packaged water is not entirely free from microbial contamination, driven by perceptions of superior quality, based on their misconception that packaged water is always sourced from spring water; however, the TDS variation suggests that it is taken from various sources.
PDAM water is more trusted for cooking than for drinking, possibly owing to the heating process involved in cooking and the indirectness of the consumption of cooking water. Concerns regarding the safety of PDAM water for drinking persist, and thus, people boil it before drinking it, which is inconvenient for some and increases the cost. Additionally, the chlorine smell of PDAM water influences households’ perception and selection of drinking water. The association of the chlorine smell with impure water diverts many from PDAM water to packaged water, even if PDAM water meets water quality standards. Combining disinfection with other methods could be beneficial in reducing microbial contamination and the chlorine odor. Cost is not a factor in the selection of drinking water sources. However, the lower cost of PDAM water could be an opportunity to attract people, as shown by the people drinking from public drinking stations. Boiling water using an electric kettle was found to be the most affordable method to guarantee water safety; thus, even though the practice is uncommon, we should encourage the use of electric kettles. Lower-income households spend a higher percentage of their income on drinking packaged water than higher-income households. If PDAM could supply water without the need for boiling before consumption, it would lower the cost of drinking water, lessen the financial burden on households, and reduce the plastic waste arising from the use of packaged water.
The presence of public drinking stations has positively influenced users’ trust in PDAM water quality, whereas misconceptions about the purpose of chlorination and the safety of chlorinated water remain prevalent. Therefore, it is recommended to increase the number of drinking water stations and to raise their visibility and accessibility in order to promote drinking PDAM water.
Author Contributions
Conceptualization, S.T. and S.K.; methodology, S.T. and M.N.Z.; validation, S.T., M.N.Z. and S.K.; formal analysis, M.N.Z.; investigation, M.N.Z.; writing—original draft preparation, M.N.Z.; writing—review and editing, B.S., S.K. and S.T.; supervision, B.S., S.K. and S.T.; project administration, S.T. and S.K.; funding acquisition, S.T. All authors have read and agreed to the published version of the manuscript.
Funding
This research was supported by the Japan International Cooperation Agency (JICA) through a collaborative program with the University of Tokyo and a scholarship provided to Masayu Nadiya Zikrina for her graduate studies. This study was also supported by a Grant-in-Aid for Scientific Research (No. 22H01621) provided by the Japan Society for the Promotion of Sciences (JSPS).
Institutional Review Board Statement
This study was conducted in accordance with the Declaration of Helsinki and approved by the Research Ethics Committee of the University of Tokyo (KE21-28).
Informed Consent Statement
Informed consent was obtained from all the subjects involved in the study.
Data Availability Statement
The research data are available upon request.
Acknowledgments
The authors would like to express their gratitude for the assistance provided by Perumda Tirta Pakuan Kota Bogor, Perumda Tirta Moedal Kota Semarang, and Perumda Tugu Tirta Kota Malang.
Conflicts of Interest
The authors declare no conflicts of interest.
Appendix A
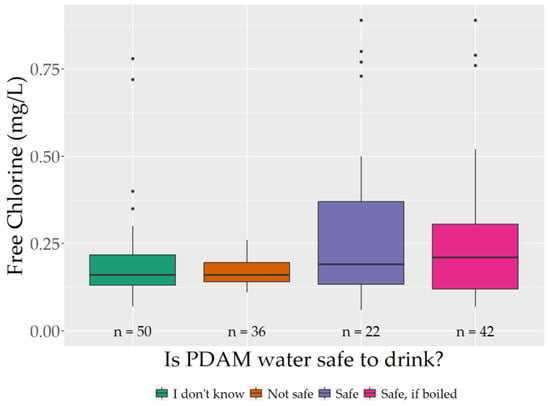
Figure A1.
Free chlorine concentration and perceived safety.
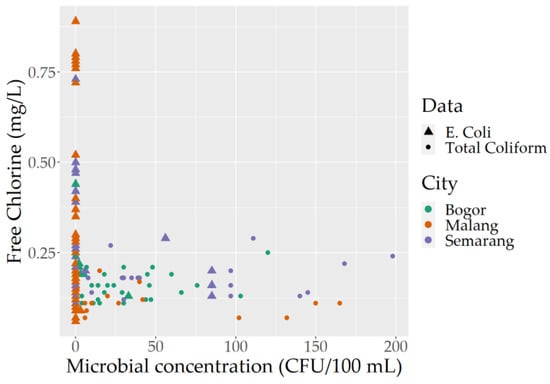
Figure A2.
Microbial concentrations and free chlorine concentrations.
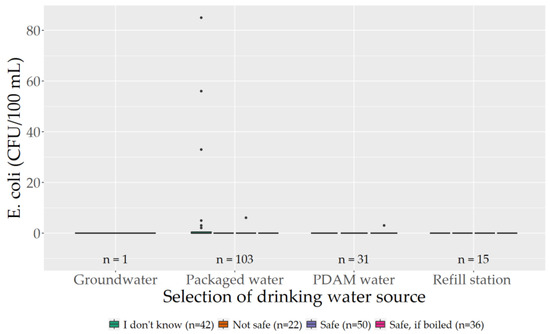
Figure A3.
E. coli and perceived safety.
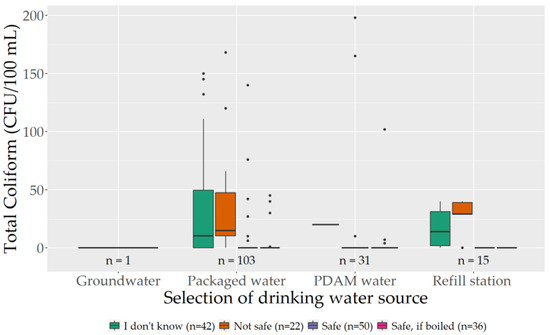
Figure A4.
Total coliform and perceived safety.
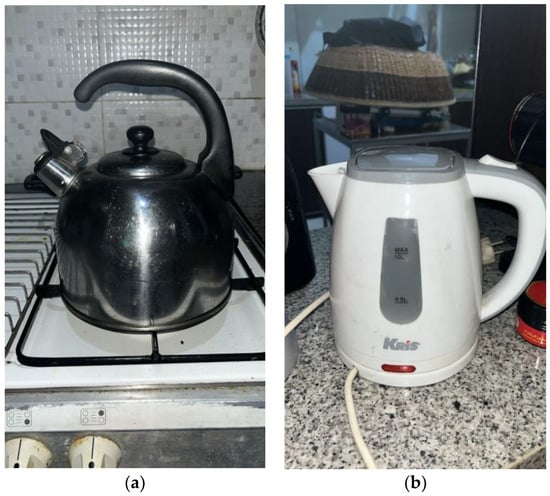
Figure A5.
Boiling methods: (a) stovetop boiling and (b) electric kettle.
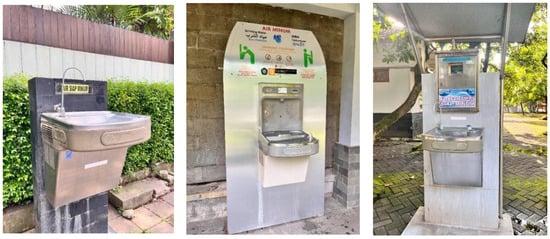
Figure A6.
Public drinking stations.
References
- Greene, J. Bottled Water in Mexico: The Rise of a New Access to Water Paradigm. Wiley Interdiscip. Rev. Water 2018, 5, e1286. [Google Scholar] [CrossRef]
- Cohen, A.; Ray, I. The Global Risks of Increasing Reliance on Bottled Water. In Nature Sustainability; Nature Publishing Group: Berlin, Germany, 2018; pp. 327–329. [Google Scholar] [CrossRef]
- Bouhlel, Z.; Köpke, J.; Mina, M.; Smakhtin, V. Global Bottled Water Industry: A Review of Impacts and Trends; University Institute for Water, Environment and Health: Hamilton, ON, Canada, 2023. [Google Scholar]
- Foster, T.; Priadi, C.; Kotra, K.K.; Odagiri, M.; Rand, E.C.; Willetts, J. Self-Supplied Drinking Water in Low- and Middle-Income Countries in the Asia-Pacific. NPJ Clean Water 2021, 4, 37. [Google Scholar] [CrossRef]
- Tosun, J.; Scherer, U.; Schaub, S.; Horn, H. Making Europe Go from Bottles to the Tap: Political and Societal Attempts to Induce Behavioral Change. Wiley Interdiscip. Rev. Water 2020, 7, e1435. [Google Scholar] [CrossRef]
- Brei, V.A. How Is a Bottled Water Market Created? Wiley Interdiscip. Rev. Water 2018, 5, e1220. [Google Scholar] [CrossRef]
- Geerts, R.; Vandermoere, F.; Van Winckel, T.; Halet, D.; Joos, P.; Van Den Steen, K.; Van Meenen, E.; Blust, R.; Borregán-Ochando, E.; Vlaeminck, S.E. Bottle or Tap? Toward an Integrated Approach to Water Type Consumption. Water Res. 2020, 173, 115578. [Google Scholar] [CrossRef]
- Jaffee, D. Unequal Trust: Bottled Water Consumption, Distrust in Tap Water, and Economic and Racial Inequality in the United States. Wiley Interdiscip. Rev. Water 2024, 11, e1700. [Google Scholar] [CrossRef]
- Alfonso, S.M.; Kazama, S.; Takizawa, S. Inequalities in Access to and Consumption of Safely Managed Water Due to Socio-Economic Factors: Evidence from Quezon City, Philippines. Curr. Res. Environ. Sustain. 2021, 4, 100117. [Google Scholar] [CrossRef]
- Ochoo, B.; Valcour, J.; Sarkar, A. Association between Perceptions of Public Drinking Water Quality and Actual Drinking Water Quality: A Community-Based Exploratory Study in Newfoundland (Canada). Environ. Res. 2017, 159, 435–443. [Google Scholar] [CrossRef] [PubMed]
- Dianty, F.R.; Martono, D.N.; Priadi, C.R. Public Perception of Drinking Water Quality in Bekasi City, Indonesia. J. Penelit. Pendidik. IPA 2022, 8, 2551–2555. [Google Scholar] [CrossRef]
- de França Doria, M. Factors Influencing Public Perception of Drinking Water Quality. Water Policy 2009, 12, 1–19. [Google Scholar] [CrossRef]
- Hopland, A.O.; Kvamsdal, S.F. Tap Water Quality: In the Eye of the Beholder. J. Water Health 2022, 20, 1436–1444. [Google Scholar] [CrossRef]
- Delpla, I.; Legay, C.; Proulx, F.; Rodriguez, M.J. Perception of Tap Water Quality: Assessment of the Factors Modifying the Links between Satisfaction and Water Consumption Behavior. Sci. Total Environ. 2020, 722, 137786. [Google Scholar] [CrossRef] [PubMed]
- Lestari, P.; Trihadiningrum, Y. The Impact of Improper Solid Waste Management to Plastic Pollution in Indonesian Coast and Marine Environment. Mar. Pollut. Bull. 2019, 149, 110505. [Google Scholar] [CrossRef] [PubMed]
- Jaffee, D.; Newman, S. A Bottle Half Empty: Bottled Water, Commodification, and Contestation. Organ. Environ. 2013, 26, 318–335. [Google Scholar] [CrossRef]
- Puspita, T.; Dharmayanti, I.; Tjandrarini, D.H.; Zahra, Z.; Anwar, A.; Irianto, J.; Rachmat, B.; Yunianto, A. Packaged Drinking Water in Indonesia: The Determinants of Household in the Selection and Management Process. J. Water Sanit. Hyg. Dev. 2023, 13, 508–519. [Google Scholar] [CrossRef]
- Horowitz, N.; Frago, J.; Mu, D. Life Cycle Assessment of Bottled Water: A Case Study of Green2O Products. Waste Manag. 2018, 76, 734–743. [Google Scholar] [CrossRef] [PubMed]
- Gleick, P.H.; Cooley, H.S. Energy Implications of Bottled Water. Environ. Res. Lett. 2009, 4, 014009. [Google Scholar] [CrossRef]
- Garfí, M.; Cadena, E.; Sanchez-Ramos, D.; Ferrer, I. Life Cycle Assessment of Drinking Water: Comparing Conventional Water Treatment, Reverse Osmosis and Mineral Water in Glass and Plastic Bottles. J. Clean. Prod. 2016, 137, 997–1003. [Google Scholar] [CrossRef]
- Garcia-Suarez, T.; Kulak, M.; King, H.; Chatterton, J.; Gupta, A.; Saksena, S. Life Cycle Assessment of Three Safe Drinking-Water Options in India: Boiledwater, Bottledwater, Andwater Purified with a Domestic Reverse-Osmosis Device. Sustainability 2019, 11, 6233. [Google Scholar] [CrossRef]
- Circular, G.A. Accelerating the Circular Economy for Post-Consumer PET Bottles in Southeast Asia; EcoKnights: Singapore, 2019. [Google Scholar]
- Pinter, E.; Welle, F.; Mayrhofer, E.; Pechhacker, A.; Motloch, L.; Lahme, V.; Grant, A.; Tacker, M. Circularity Study on Pet Bottle-to-Bottle Recycling. Sustainability 2021, 13, 7370. [Google Scholar] [CrossRef]
- Smith, R.L.; Takkellapati, S.; Riegerix, R.C. Recycling of Plastics in the United States: Plastic Material Flows and Polyethylene Terephthalate (PET) Recycling Processes. ACS Sustain. Chem. Eng. 2022, 10, 2084–2096. [Google Scholar] [CrossRef]
- Andrady, A.L. The Plastic in Microplastics: A Review. Mar. Pollut. Bull. 2017, 119, 12–22. [Google Scholar] [CrossRef]
- Umoafia, N.; Joseph, A.; Edet, U.; Nwaokorie, F.; Henshaw, O.; Edet, B.; Asanga, E.; Mbim, E.; Chikwado, C.; Obeten, H. Deterioration of the Quality of Packaged Potable Water (Bottled Water) Exposed to Sunlight for a Prolonged Period: An Implication for Public Health. Food Chem. Toxicol. 2023, 175, 113728. [Google Scholar] [CrossRef]
- Akhbarizadeh, R.; Dobaradaran, S.; Schmidt, T.C.; Nabipour, I.; Spitz, J. Worldwide Bottled Water Occurrence of Emerging Contaminants: A Review of the Recent Scientific Literature. J. Hazard. Mater. 2020, 392, 122271. [Google Scholar] [CrossRef]
- Schymanski, D.; Goldbeck, C.; Humpf, H.U.; Fürst, P. Analysis of Microplastics in Water by Micro-Raman Spectroscopy: Release of Plastic Particles from Different Packaging into Mineral Water. Water Res. 2018, 129, 154–162. [Google Scholar] [CrossRef]
- Oßmann, B.E.; Sarau, G.; Holtmannspötter, H.; Pischetsrieder, M.; Christiansen, S.H.; Dicke, W. Small-Sized Microplastics and Pigmented Particles in Bottled Mineral Water. Water Res. 2018, 141, 307–316. [Google Scholar] [CrossRef] [PubMed]
- Kooy, M.; Walter, C.T. Towards a Situated Urban Political Ecology Analysis of Packaged Drinking Water Supply. Water 2019, 11, 225. [Google Scholar] [CrossRef]
- Ko, S.H.; Sakai, H. Perceptions of Water Quality, and Current and Future Water Consumption of Residents in the Central Business District of Yangon City Myanmar. Water Supply 2022, 22, 1094–1106. [Google Scholar] [CrossRef]
- Ikhsan, A.N.; Thohira, M.C.; Daniel, D. Analysis of Packaged Drinking Water Use in Indonesia in the Last Decades: Trends, Socio-Economic Determinants, and Safety Aspect. Water Policy 2022, 24, 1287–1305. [Google Scholar] [CrossRef]
- Prasetiawan, T.; Nastiti, A.; Muntalif, B.S. ‘Bad’ Piped Water and Other Perceptual Drivers of Bottled Water Consumption in Indonesia. Wiley Interdiscip. Rev. Water 2017, 4, e1219. [Google Scholar] [CrossRef]
- Indonesia Statistics Agency. Percentage Distribution of Households by Province and Source of Drinking Water, 2021; Indonesia Statistics Agency: Jakarta, Republic of Indonesia, 2021. Available online: https://www.bps.go.id/id/statistics-table/3/YzBaMlduSlFVbTVrUnpWeU9YRTJka0pVTTFkU1FUMDkjMw==/distribusi-persentase-rumah-tangga-menurut-provinsi-dan-sumber-air-minum.html?year=2021 (accessed on 2 April 2024).
- Ministry of Public Works and Housing (Indonesia). PDAM Capacity and Services. Ministry of Public Works and Housing, Indonesia. Available online: https://data.pu.go.id/dataset/kapasitas-dan-layanan-pdam (accessed on 29 April 2024).
- Jambeck, J.R.; Geyer, R.; Wilcox, C.; Siegler, T.R.; Perryman, M.; Andrady, A.; Narayan, R.; Law, K.L. Plastic Waste Inputs from Land into the Ocean. Mar. Pollut. 2015, 347, 768–771. [Google Scholar] [CrossRef] [PubMed]
- Bogor City Statistics Agency. Bogor City Rainfall (Curah Hujan Kota Bogor—In Bahasa Indonesia). Available online: https://bogorkota.bps.go.id/indicator/151/153/1/jumlah-curah-hujan.html (accessed on 28 June 2024).
- Malang City Statistics Agency. Malang City Rainfall (Curah Hujan Kota Malang—In Bahasa Indonesia). Available online: https://malangkota.bps.go.id/indicator/151/508/1/jumlah-curah-hujan-di-kota-malang.html (accessed on 28 June 2024).
- Semarang City Statistics Agency. Semarang City Rainfall (Curah Hujan Kota Semarang—In Bahasa Indonesia). Available online: https://semarangkota.bps.go.id/indicator/151/79/1/curah-hujan-kota-semarang.html (accessed on 28 June 2024).
- Bogor City Statistics Agency. Bogor City Population Based on Age and Gender Groups 2014–2021 (Penduduk Kota Bogor Berdasarkan Kelompok Umur dan Jenis Kelamin, 2014–2021—In Bahasa Indonesia). Available online: https://bogorkota.bps.go.id/indicator/12/31/1/penduduk-kota-bogor-berdasarkan-kelompok-umur-dan-jenis-kelamin.html (accessed on 13 May 2024).
- Malang City Statistics Agency. Malang City Population Density 2019–2021 (Kepadatan Penduduk Kota Malang—In Bahasa Indonesia). Available online: https://malangkota.bps.go.id/indicator/12/304/1/kepadatan-penduduk-menurut-kecamatan.html (accessed on 13 May 2024).
- Semarang City Government. Semarang City Population (Jumlah Penduduk Kota Semarang—In Bahasa Indonesia). Available online: https://data.semarangkota.go.id/elemendata/cari?cari=penduduk&tahunAwal=2021&tahunAkhir=2021 (accessed on 13 May 2024).
- Bogor City Government. Bogor City Water Utility Company Targets 97% Service Coverage in 2019 (PDAM Tirta Pakuan Targetkan Cakupan Layanan 97 Persen di 2019—In Bahasa Indonesia). Available online: https://kotabogor.go.id/index.php/show_post/detail/11460 (accessed on 13 May 2024).
- Malang City Water Utility Company (PDAM Tugu Tirta Kota Malang. Water Utility Statistics (Statistik PDAM Kota Malang—In Bahasa Indonesia). Available online: https://perumdatugutirta.co.id/info/statistik (accessed on 13 May 2024).
- Semarang City Water Utility Company (PDAM Tirta Moedal Kota Semarang). Production Infrastructure (Infrastruktur Produksi—In Bahasa Indonesia). Available online: https://pdamkotasmg.co.id/page/instalasi_pengolahan_air (accessed on 13 May 2024).
- Nastiti, A.; Sudradjat, A.; Geerling, G.W.; Smits, A.J.M.; Roosmini, D.; Muntalif, B.S. The Effect of Physical Accessibility and Service Level of Water Supply on Economic Accessibility: A Case Study of Bandung City, Indonesia. Water Int. 2017, 42, 831–851. [Google Scholar] [CrossRef]
- Khanal, S.; Kazama, S.; Benyapa, S.; Takizawa, S. Performance Assessment of Household Water Treatment and Safe Storage in Kathmandu Valley, Nepal. Water 2023, 15, 2305. [Google Scholar] [CrossRef]
- Devesa, R.; Dietrich, A.M. Guidance for Optimizing Drinking Water Taste by Adjusting Mineralization as Measured by Total Dissolved Solids (TDS). Desalination 2018, 439, 147–154. [Google Scholar] [CrossRef]
- Shuai, Y.; Zhang, K.; Zhu, H.; Lou, J.; Zhang, T. Toward the Upgrading Quality of Drinking Water from Flavor Evaluation: Taste, Feeling, and Retronasal Odor Issues. ACS ES T Eng. 2023, 3, 308–321. [Google Scholar] [CrossRef]
- Fankhauser, S.; Tepic, S. Can Poor Consumers Pay for Energy and Water? An Affordability Analysis for Transition Countries. Energy Policy 2007, 35, 1038–1049. [Google Scholar] [CrossRef]
- Prouty, C.; Zhang, Q. How Do People’s Perceptions of Water Quality Influence the Life Cycle Environmental Impacts of Drinking Water in Uganda? Resour. Conserv. Recycl. 2016, 109, 24–33. [Google Scholar] [CrossRef]
- Etale, A.; Jobin, M.; Siegrist, M. Tap versus Bottled Water Consumption: The Influence of Social Norms, Affect and Image on Consumer Choice. Appetite 2018, 121, 138–146. [Google Scholar] [CrossRef]
- Nastiti, A.; Muntalif, B.S.; Roosmini, D.; Sudradjat, A.; Meijerink, S.V.; Smits, A.J.M. Coping with Poor Water Supply in Peri-Urban Bandung, Indonesia: Towards a Framework for Understanding Risks and Aversion Behaviours. Environ. Urban 2017, 29, 69–88. [Google Scholar] [CrossRef]
- Espinosa-García, A.C.; Díaz-Ávalos, C.; González-Villarreal, F.J.; Val-Segura, R.; Malvaez-Orozco, V.; Mazari-Hiriart, M. Drinking Water Quality in a Mexico City University Community: Perception and Preferences. Ecohealth 2015, 12, 88–97. [Google Scholar] [CrossRef]
- Piriou, P.; Mackey, E.D.; Suffet, I.H.; Bruchet, A. Chlorinous Flavor Perception in Drinking Water. Water Sci. Technol. 2004, 49, 321–328. [Google Scholar] [CrossRef] [PubMed]
- Mackey, E.D.; Baribeau, H.; Crozes, G.F.; Suffet, I.H.; Piriou, P. Public Thresholds for Chlorinous Flavors in U.S. Tap Water. Water Sci. Technol. 2004, 49, 335–340. [Google Scholar] [CrossRef] [PubMed]
- Wening Purwandari, T.; Kazama, S.; Takizawa, S. Water Consumption Analysis of Small Islands Supplied with Desalinated Water in Indonesia. J. Jpn. Soc. Civ. Eng. Ser. G (Environ. Res.) 2021, 77, 129–140. [Google Scholar] [CrossRef] [PubMed]
- Prayoga, R.; Nastiti, A.; Schindler, S.; Kusumah, S.W.D.; Sutadian, A.D.; Sundana, E.J.; Simatupang, E.; Wibowo, A.; Budiwantoro, B.; Sedighi, M. Perceptions of Drinking Water Service of the ‘off-Grid’ Community in Cimahi, Indonesia. Water 2021, 13, 1398. [Google Scholar] [CrossRef]
- Javidi, A.; Pierce, G.U.S. Households’ Perception of Drinking Water as Unsafe and Its Consequences: Examining Alternative Choices to the Tap. Water Resour. Res. 2018, 54, 6100–6113. [Google Scholar] [CrossRef]
Disclaimer/Publisher’s Note: The statements, opinions and data contained in all publications are solely those of the individual author(s) and contributor(s) and not of MDPI and/or the editor(s). MDPI and/or the editor(s) disclaim responsibility for any injury to people or property resulting from any ideas, methods, instructions or products referred to in the content. |
© 2024 by the authors. Licensee MDPI, Basel, Switzerland. This article is an open access article distributed under the terms and conditions of the Creative Commons Attribution (CC BY) license (https://creativecommons.org/licenses/by/4.0/).