Abstract
To investigate the variation laws of various hydraulic parameters and internal fluid flow patterns of eccentric semi-ball valves under different boundary conditions, the DPM model was used to numerically simulate the eccentric semi-ball valve based on Fluent 2021 R1 software. The flow velocity, pressure distribution, and erosion wear rate on the valve wall were simulated under different combinations of opening, inlet flow velocity, and sediment concentration conditions, and hydraulic parameters such as drag coefficient, flow coefficient, and cavitation coefficient were calculated. The results show that as the opening of the eccentric semi-ball valve increases, the valve drag coefficient decreases, the flow coefficient increases, the cavitation coefficient increases, and the degree of cavitation decreases. The flow velocity in the high-velocity zone at both ends of the valve plate decreases, and the gradient of water flow velocity passing through the valve decreases. The area of the low-velocity zone at the rear of the valve plate decreases, and the vortex phenomenon gradually weakens; as the sediment content in the water increases, the valve drag coefficient increases, the flow coefficient decreases, and the cavitation coefficient first increases and then decreases. The maximum flow velocity of the pipeline decreases faster and faster, causing an increase in pressure gradient in the flow area and drastic changes. This results in higher pressure on the pipe wall near the valve plate, especially a significant increase in negative pressure; As the inlet flow rate increases, the valve drag coefficient decreases, the flow coefficient increases, and the cavitation coefficient gradually decreases. The flow velocity of the water passing through the valve increases, and the low-pressure area downstream of the valve plate increases. The pressure gradient at both ends of the valve port increases significantly from small to large, and the positive pressure upstream of the valve plate gradually increases. The force of the water flow on the valve plate is large, causing friction between the valve stem and the valve body, which is not conducive to long-term operation. With the increase in inlet flow rate, the maximum wear amount and wear range of the valve plate have significantly increased, and erosion wear is mainly distributed in point blocks at the edge of the valve plate. This study can provide certain references and solutions for the key technology research of eccentric semi-ball valves and assess the performance indicators of the operation being maintained.
1. Introduction
Valves are mechanical equipment that control hydraulic parameters such as fluid pressure and flow rate. They have various functions such as interruption, diversion, diversion, and anti backflow. They are a basic component of water supply systems and play an important role in daily life and industrial production. Valves are mainly divided into two categories: automatic valves and drive valves, among which drive valves include gate valves, globe valves, ball valves, etc. An eccentric semi-ball valve, as one of the typical representatives of drive valves, is often installed at the outlet of the water pump to control the flow rate due to its simple operation, fast opening and closing, and convenient installation. When a water hammer occurs, it can quickly control the valve to close according to the set valve closing procedure, effectively ensuring the safe operation of the water supply system. At present, the water hammer protection measures for water supply engineering at home and abroad are mainly limited to studying the fast and slow closing time and angle of the eccentric semi-ball valve. There is relatively little research on the flow field analysis and water sediment performance of the pipeline where the eccentric semi-ball valve is located. During the adjustment process, the local drag coefficient changes due to factors such as valve plate shape, opening time, opening changes, and sediment concentration, resulting in severe pressure fluctuations in the water supply pipeline. This will affect the safe operation of the water supply project. Therefore, it is crucial to analyze the changes in the flow field before and after the eccentric semi-ball valve under different boundary conditions and to study the trends in hydraulic parameters such as drag coefficient, cavitation coefficient, and flow coefficient of the eccentric semi-ball valve. This study can provide some reference and solutions for the key technology research of the eccentric semi-ball valve, and also provide certain guidance for the use of eccentric semi-ball valve in engineering practice.
Compared with other valves, ball valves, butterfly valves, and eccentric semi-ball valves have the advantages of simple structure, quick opening and easy operation. At present, a large amount of research has been conducted on ball valves and butterfly valves, while there is relatively little research on eccentric semi-ball valves. Based on the user-defined UDF technology, Ma et al. [1] carried out the transient numerical simulation of the internal flow field of the ball valve under the variable speed law and different opening degrees. Shi et al. [2] proposed a new method for detecting internal leakage of the buried pipeline ball valve based on the pressure change in the valve cavity. Zhang et al. [3] proposed the noise generation mechanism of the ball valve’s flow by analyzing the contours of pressure, velocity and sound pressure level. Yan et al. [4] simulated the flow resistance characteristics of a low-noise ball valve applied to a system and investigated via computational fluid dynamics (CFD) software. Shi et al. [5] proposed a valve service life prediction method based on the PCA-PSO-LSSVM algorithm. Ivancu et al. [6] obtained results by fluid flow simulation with SolidWorks2023 for a 500 mm diameter trunnion ball valve. Ren et al. [7] revealed the relationship between the initial flow area around the ball valve on the cavitation strength and unloading rate inside the valve. Liu et al. [8] analyzed the generation mechanism and distribution law of cavitation in the ball valve. Cao et al. [9] developed a three-dimensional (3D) computational fluid dynamics (CFD) approach to elaborate the water-hammer pipe flow and 3D detailed dynamic characteristics of a closing ball valve. Han et al. [10] used the computational fluid dynamics method to perform transient numerical simulations of the ball valve under different closing times and closing laws. Yang et al. [11] simulated the emergency shutdown and turbine start-up conditions. Xu et al. [12] studied the erosion caused by the solid–liquid two-phase flow on the inner surface of the ball valve. Zhao et al. [13] conducted a transient-state numerical simulation to investigate the cavitation flow in the ball valve of a common rail (CR) injector. Zhang et al. [14] carried out experimental studies on the cavitation phenomenon inside butterfly valves. Zhang et al. [15] investigated cavitation evolution through a butterfly valve with different plate shapes under different pressure conditions. Ozkan et al. [16] carried out mechanical shock test simulations with shock response spectrum analysis. They compared simulated virtual experiments and real experiments in a computer environment in an impact testing device. Zhang et al. [17] carried out numerical simulations to study the dynamic evolution of cryogenic cavitation through a butterfly valve model at different valve opening degrees. Nguyen et al. [18] provided a description of the formation of bubbles induced by a butterfly valve and analyzed the characteristics of the pressure and flow coefficient of the valve. Kim et al. [19] conducted numerical calculations on different sizes of valve disc openings and analyzed the numerical effects of different turbulence models on valve disc openings. Li et al. [20] conducted numerical simulations on the erosion and wear process of graphite sealing surfaces under gas–solid two-phase flow media. Tao et al. [21] studied the flow situation of butterfly valves with different shafts. Research shows that the flow separation occurs at the edge of the valve disk, and the drag of the valve disk fluctuates nonperiodically with time.
The flow variation of fluid in pressurized pipelines is a very complex process. It is influenced by many factors. In recent years, a large number of scholars have conducted numerical simulations of fluid flow fields. Tong et al. [22] conducted numerical simulation and experimental research on the low-temperature extrusion process of gelatin solution. Żyłka et al. [23] investigated airflow phenomena for different valve opening heights. Qu et al. [24] simulated the slurry flow in the pipe using computational fluid dynamics (CFD) and discrete element method (DEM). Liu et al. [25] proposed a prediction strategy for the hydrodynamic performance of bionic fish. Hu et al. [26] used ANSYS AIM to computationally analyze the vessels based on the theory of computational fluid dynamics (CFD for short). Wang et al. [27] proposed an idea of projection weighted area in designing a new control butterfly valve. Han et al. [28] conducted numerical simulations on ball valves with different openings in pipeline transportation of nuclear power plants and analyzed the flow characteristics under different openings. Askari et al. [29] used ANSYS Fluent to simulate ball valves, analyzed the working conditions of ball valves with different concentrations of particles and four different openings, and analyzed the influence of different particle diameters on erosion efficiency. Lin et al. [30] studied sleeve-regulating valves and used the fluid–structure coupling method to analyze the vibration characteristics of the valve core.
Through a literature review, it can be found that researchers have conducted numerical simulation studies on various valves using CFD technology. However, few scholars have studied and analyzed the flow field and water sediment performance of the pipeline where the eccentric semi-ball valve is located. To this end, numerical simulation research is conducted to analyze the changes in the flow field before and after the eccentric semi-ball valve under different boundary conditions and to study the trends in hydraulic parameters such as drag coefficient, cavitation coefficient, and flow coefficient of the eccentric semi-ball valve. This study can provide a theoretical basis and guidance for the design and application of eccentric semi-ball valves.
2. Methodology
2.1. DPM Model
The discrete phase model (DPM) is a type of Euler–Lagrange method used to solve fluid flow problems with particles (sediment particles, water droplets, or bubbles). Due to not considering the interaction between particles, it is generally used in situations where the particle volume concentration is less than 10%, the particle appearance is clear, and the interaction between particles and fluids is clear. The particle phase control equation is as follows:
2.2. Hydraulic Parameter Model of Eccentric Semi-Ball Valve
2.2.1. Drag Coefficient
The drag coefficient of an eccentric semi-ball valve refers to the ratio of the resistance effect of the valve to the kinetic energy during fluid flow and is one of the important performance indicators for evaluating eccentric semi-ball valves. The calculation formula for the drag coefficient of the eccentric semi-ball valve is as follows:
2.2.2. Flow Coefficient
The flow coefficient represents the magnitude of fluid flow through a valve with a certain degree of opening at a unit pressure loss before and after the valve. It is an important indicator for measuring the flow capacity of an eccentric semi-ball valve. The larger the flow coefficient, the better the flow performance and the smaller the unit pressure loss. The formula for calculating the flow coefficient is as follows:
2.2.3. Cavitation Coefficient
Due to the throttling effect of the eccentric semi-ball valve, when the pipeline fluid flows through the valve, the flow area changes, causing the fluid velocity to increase and the pressure to decrease. When the pressure drops to the saturation vapor pressure of the fluid, the fluid will vaporize in large quantities, producing bubbles. At the same time, bubbles dissolved in water will escape from the water, forming bubbles. This stage is called the flash evaporation stage [31]. When the fluid continues to pass through the eccentric semi-ball valve, the pipeline pressure increases and the bubbles formed in the first stage are compressed by nearby high pressure, causing the bubbles to burst. This stage is called the cavitation stage. During the process of the bubble bursting, an instantaneous high pressure will be generated, which will cause a high-pressure impact on the pipe wall and the half-ball valve. It is crucial to determine the severity of cavitation. The following cavitation index method is mainly used to judge the cavitation phenomenon of valves.
The cavitation index method stipulates that the smaller the valve, the more severe the cavitation degree, and the poorer the foundation of safe operating conditions. When the σ value is high, the operating conditions of the valve are good. It is stipulated that the valve does not experience cavitation when σ > σi. When σ starts to drop below σi, the valve begins to experience cavitation. When σ decreases to σmv, cavitation reaches its maximum, and the valve is most severely damaged. σmv is the inherent constant of valve production and manufacturing.
Due to the complex and variable structure of valves, the standards for determining the cavitation index are also different. In this study, the eccentric semi-ball valve and the butterfly valve have similar structures, so the corresponding index of the eccentric semi-ball valve is used: When the cavitation index σ is greater than 2.5, the valve will not experience cavitation. When 1.5 < σ < 2.5, the valve experiences slight cavitation. When σ < 1.5, the valve begins to vibrate. When σ < 0.5, prolonged operation of the valve can cause damage to the valve and downstream piping. The cavitation index method considers various factors and combines continuously optimized mathematical models with experimental data to achieve a consistent cavitation analysis method. Therefore, this article selects the cavitation index method as the standard for judging the degree of valve cavitation.
2.2.4. Erosion Rate Calculation
Erosion is a phenomenon of material loss caused by repeated collisions of solid particles on a curved surface. Erosion can damage pipelines, valves, and other flow channels. Therefore, it is very important to study the erosion rate and determine the areas in the channel that are susceptible to erosion. If a medium containing solid particles is transported, wear will occur between the eccentric semi-ball valve and the pipeline, resulting in a decrease in the performance of the eccentric semi-ball valve. The most direct manifestation is the decrease in drag coefficient and flow coefficient. Therefore, when transporting fluids containing solid particles, certain requirements are placed on the anti abrasion performance of eccentric semi-ball valves. The anti erosion performance of a pump is usually judged by observing the erosion rate of the valve body. The erosion speed is closely related to the medium flow rate, impact angle, solid particle shape, especially the material and hardness of the valve body. In this study, we used the Finnie erosion model built-in in ANSYS Fluent. For almost all plastic materials, erosion varies with impact angle and velocity. The erosion mass calculation formula is as follows:
Finnie’s erosion wear model relates the erosion rate to the kinetic energy ratio of particle impact on the surface through the following function:
is the critical value for distinguishing between frictional wear and impact wear. If , friction and wear dominate. If , impact wear dominates. So when using this model, attention should be paid to the selection of the K value, which is affected by parameters such as shape and temperature, and is generally 1. The value of n should be selected based on the properties of the material and particles.
3. Experimental Steps and Results
The drag coefficient testing device for eccentric semi-ball valves is shown in Figure 1. The main instruments and equipment include two horizontal centrifugal pumps, one vacuum pump, one flow meter, four pressure gauges, eight control valves, and one water storage tank.
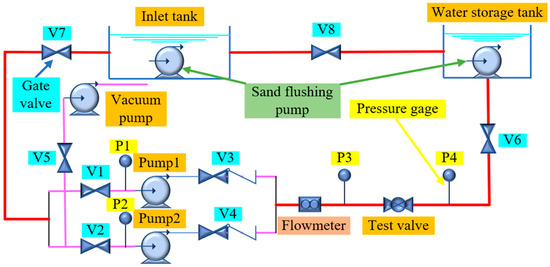
Figure 1.
The drag coefficient testing device diagram for the eccentric semi-ball valve.
The experimental system is mainly divided into two parts: the upper computer system and the on-site control station. The upper computer system mainly consists of PLC cabinets, industrial computers, monitoring software and other equipment, which are mainly used for real-time data collection and detection. The on-site monitoring mainly feeds back the information collected from the on-site monitoring objects to the upper system and displays it in a timely manner. It also provides timely alarms for unconventional information. The pump station receives water from the inlet tank and is pressurized by pumps 1 and 2 to safely transport it to the second floor water storage tank. During the pipeline water supply process, gate valves are installed in front of the two pumps to facilitate valve start-up and maintenance. A check valve should be installed behind the water pump to prevent fluid backflow in the pipeline. A vacuum pump is installed at the front end of the water pump valve to facilitate vacuum pumping before starting the pump. A pressure gauge is installed at a distance of 1.5 m from the front end and 1.5 m from the back end of the test valve. The pressure before and after the valve is displayed on the pressure gauge by changing the valve opening, and the drag coefficient calculation formula is input into the computer to calculate the drag coefficient through the pressure before and after the valve. The water flow rate is measured by a flow meter in the pipeline. The specification of the water storage tank is 1.8 × 1.2 × 1.5 m, with a water level depth of 0.7 m.
The detailed testing process for the drag coefficient of the experimental device is as follows:
- (1)
- Close valves V3, V4, V6, V7, V8, and open valves V1, V2, V5.
- (2)
- Start the centrifugal pump and vacuum pump, and wait for the vacuum pump to extract air from the water flow at the inlet of the centrifugal pump. When water flow appears at the outlet of the vacuum pump and pressure gauges P1 and P2 meet the pressure standards, open valves V3, V4, V6, V7, and V8, and close valve V5.
- (3)
- The natural sand sample used in the experiment has a particle size of 0.019 mm. On this basis, an experiment was conducted with a sediment concentration of 20 kg/m3, and a flow rate of Q ≈ 2545 m3/h was tested. The pipeline flowmeter was used for full pipe flow. According to the previously designed sediment content, pour the pre weighed sediment into the water tank, and start measuring the flow after the sediment is mixed evenly. Each flow rate is set for 60 min. The flushing pump of the tailwater tank should always operate to ensure consistency of sediment content data at different flow rates. Measure the flow rate of the pipeline through a flow meter to keep the water pump operating at the engineering design flow rate. Connect the test valve to the computer and control its opening size.
- (4)
- Record the values of pressure gauges P3 and P4 at different valve openings using a computer under the designed flow rate.
- (5)
- Calculate the hydraulic parameters of the test valve using relevant mathematical formulas.
At a design flow rate of 2.5 m/s and a pipe diameter of DN600, the inlet and outlet pressures of the eccentric semi-ball value were measured, and the corresponding formulas were used to calculate the experimental data of different openings of the eccentric semi-ball valve, as shown in Table 1.

Table 1.
DN600 eccentric semi-ball value different opening test data.
4. Numerical Simulation
4.1. Establishment of Geometric Models
An eccentric semi-ball valve is a type of valve that controls the opening and closing of a valve by rotating the half-globe valve through a valve chain. It has the advantages of convenient opening and closing, simple structure, reliable sealing, and easy maintenance. It is installed after the water pump and plays a role in throttling, cutting off, and other functions. One of the important measures to ensure the safety of water supply engineering is to control the valve opening and closing time reasonably when the pump stops due to an accident. The simplified structure of the eccentric semi-ball valve is shown in Figure 2, which mainly consists of components such as the valve stem, valve cover, and valve seat.
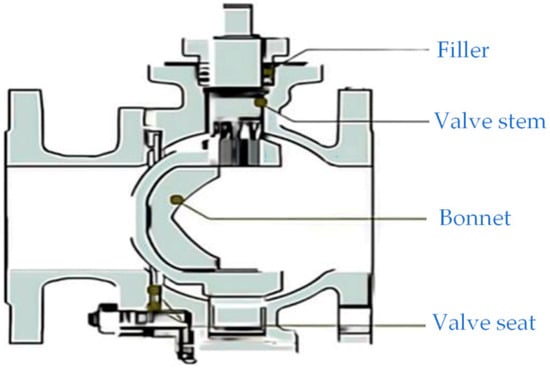
Figure 2.
Simplified structure diagram of eccentric semi-ball valve.
Due to the complex fluid flow inside the pipeline caused by the eccentric semi-ball valve, in order to ensure the stability of the numerical simulation results, a DN600 pipeline is connected 2 m in front of the eccentric semi-ball valve and 2 m behind the valve, as shown in Figure 3. Figure 3 consists of schematic diagrams of eccentric semi-ball valves with different degrees of opening. Use SpaceClaim 2021 R1 to create a 3D model of an eccentric semi-ball valve, where the negative x-axis represents the direction of fluid flow and the negative z-axis represents the direction of gravity acting on the fluid. At the same time, in order to facilitate the convergence of numerical simulation calculations, this study simplifies the fluid computational domain model under the condition of ensuring numerical simulation accuracy, such as the throttling plug inside the hemispherical valve and the valve plate edge angle inside the fluid domain.

Figure 3.
Mathematical model of eccentric semi-ball valve.
4.2. Grid Partition
After establishing the mathematical model in this article, fluent meshing is used to generate the ball valve calculation mesh and solve the complete process of calculation. Due to the complexity of the internal flow field, in order to achieve higher mesh quality, faster computer computation speed, and better convergence, the poly-hexcore volumetric mesh generation method based on “mosaic” technology is adopted here. This method can connect hexahedral meshes with polyhedral meshes at common nodes (without interface faces), thereby increasing the number of hexahedrons in the mesh while ensuring complete automation of the work and achieving the goal of improving solution efficiency and accuracy. When the valve opening is different, the mesh quality of the body sometimes cannot reach 0.2. In this case, the improved mesh function can be used to optimize the mesh quality. There are significant differences in the number of grid divisions under different valve openings, and the number of grids divided varies with the opening of the eccentric semi-ball valve. Figure 4 shows the mathematical model grid division established when the opening is 60°, and Table 2 shows the changes in the number of grids under different openings of the eccentric semi-ball valve. The mesh quality of the eccentric semi-ball valve model under different valve openings exceeds 0.2, which meets the requirements.
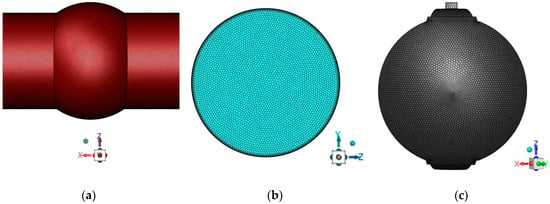
Figure 4.
Grid partition of eccentric semi-ball valve and fluid domain. They should be listed as follows: (a) Fluid domain grid. (b) Pipeline entrance grid. (c) Eccentric semi-ball valve grid.

Table 2.
Number of grids for eccentric semi-ball valve at different opening degrees.
4.3. Fluent Calculation
This article uses a DN600 eccentric semi-ball valve as the research object, establishes mathematical models of eccentric semi-ball valves under different opening degrees through SpaceClaim, and imports them into the Fluent solver for numerical simulation and analysis. The computer processor is an AMD EPYC 7B12 64-core processor (64 CPUs), ~2.25 GHz (two processors), which meets the computing power requirements for this numerical simulation. The manufacturer name of the device is Advanced Micro Devices (AMD), located in Santa Clara, CA, USA. The turbulence model adopts the Shear Stress Transport (SST) k–ω model, which combines the advantages of the k–ω model in near-wall calculations and the advantages of the k–ε model in far-field calculations. Compared with the standard k–ω model, the SST k–ω model adds a lateral dissipation derivative term and considers the transport process of turbulent shear stress when defining turbulent viscosity. The turbulence constant used in the model has also been adjusted, greatly expanding the applicability of the SST k–ω model. Select the standard wall function (SWF) as the wall function. Add a discrete phase model (to study water sediment two-phase flow) with sediment concentrations of 0, 5, 10, 15, 20 kg/m3 and particle diameters of 0.019 mm. The corresponding volume fractions are shown in Table 3.

Table 3.
Volume fractions corresponding to different sediment concentrations.
Define boundary conditions, with a vertical z-axis negative gravity acceleration of 9.81 m/s2 for the fluid, set the inlet as the velocity inlet, and select escape particle escape as the boundary condition type for the discrete phase model. The outlet is set as a pressure outlet, the channel wall is set as a standard fixed non slip wall, and the roughness constant is set to 0.013. In this simulation of the steady-state three-dimensional flow process of sediment-laden water flow in an eccentric semi-ball valve, the solving algorithm is set as the Coupled algorithm based on pressure basis, which simultaneously solves the momentum equation and continuity equation. By implicitly discretizing the pressure gradient term and surface mass flux in the momentum equation, a fully implicit algorithm can be implemented. The pressure difference in spatial discretization is measured using the Body-Force-Weighted method, while the remaining differences are measured using a more accurate second-order upwind scheme. Perform a mixed initialization setting on it globally, set the number of steps to 3000, and finally start the calculation.
5. Results and Discussion
5.1. Comparative Analysis of Numerical Simulation Results and Experimental Results of Eccentric Semi-Ball Value
Numerical simulation analysis was conducted on the DN600 eccentric semi-ball value with a flow rate of 2.5 m/s used for experimental testing. In this paper, the average pressure at the inlet and outlet of the eccentric semi-ball value was selected to calculate the pressure difference, and the variation om the drag coefficient under different opening degrees was studied. The fully closed opening of the eccentric semi-ball value in this paper is 0°, and the fully open opening is 90°. The numerical simulation results and experimental test data are shown in Table 4.

Table 4.
Eccentric semi-ball valve inlet and outlet pressure error analysis.
According to Table 4, as the valve opening increases, the error between simulated data and experimental data decreases. The overall inlet error is controlled within 9%, and the overall outlet error is controlled within 5%. The accuracy of the numerical simulation results meets the requirements of the paper. It is speculated that the reason is that the flow state of the pipeline is complex when the opening is small, and the details in the fluid domain such as the throttle plug that are ignored by the numerical simulation model affect the fluid flow, resulting in errors. However, the overall error is controlled at around 10%, which means that the numerical simulation results can be considered accurate.
5.2. Analysis of Coefficient Changes at Different Openings with Constant Inlet Flow Velocity and Sediment Concentration
When testing the flow coefficient of a hemispherical valve in practical engineering, significant differences in test results may occur due to different measuring devices and methods. When calculating the pressure difference before and after measuring the valve, factors such as the selection of the valve diameter and fluid Reynolds number need to be comprehensively considered. Similarly, in the numerical simulation process, different mathematical models, pressure selection cross-sections, and other factors can cause errors in the flow coefficient. In this paper, the pressure selection points are chosen at 1.5 m in front of the eccentric semi-ball valve and 1.5 m behind the hemispherical valve. At this time, the pressure is relatively stable and can effectively measure the overall variation law of the flow coefficient. Taking the inlet velocity of 2.5 m/s and sediment concentration of 20 kg/m3 as an example, numerical simulations were conducted on an eccentric semi-ball valve with a pipeline diameter of DN600 to analyze the changes in drag coefficient, flow coefficient, and cavitation coefficient at opening angles of 10°, 20°, 30°, 40°, 50°, 60°, 70°, 80°, and 90°.
According to Table 5 and Figure 5, it can be seen that when the inlet flow velocity and sediment concentration are constant, as the opening of the eccentric semi-ball valve increases, the valve drag coefficient decreases and the flow coefficient increases. When the valve opening is between 0° and 20°, the flow coefficient is small, the drag coefficient is large, and the rate of change is fast. The valve opening further increases, the rate of increase in flow coefficient becomes faster, and the drag coefficient tends to stabilize. As the opening increases, the inlet pressure gradually decreases, the outlet pressure gradually increases, and the pressure difference between the inlet and outlet gradually decreases. Especially between 0° and 20°, there is a significant change in pressure before and after the eccentric semi-ball valve. As the opening of the eccentric semi-ball valve increases, the cavitation coefficient also increases, which is beneficial for the safe operation of the eccentric semi-ball valve. When the opening of the eccentric semi-ball valve is less than 50°, σ < 0.5, prolonged exposure to this opening can easily cause wear and erosion of the valve, leading to damage to the hemispherical valve. When the opening is 50° < θ < 70°, 0.5 < σ < 1.5, the eccentric semi-ball valve will experience slight vibration at this opening. When the opening is 70° < θ < 90°, 1.5 < σ < 2.5, slight cavitation occurs in the eccentric semi-ball valve, which does not affect normal use. This opening is the optimal operating condition for the eccentric half-globe valve.

Table 5.
Changes in various coefficients of the eccentric semi-ball valve at different opening degrees.
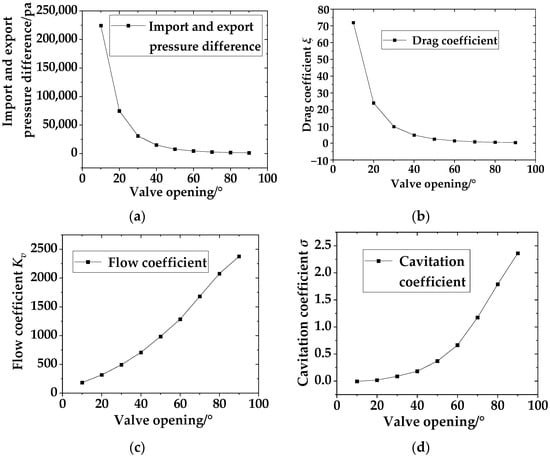
Figure 5.
Changes in various coefficients at different openings. They should be listed as follows: (a) Import and export pressure difference. (b) Drag coefficient. (c) Flow coefficient. (d) Cavitation coefficient.
5.3. Analysis of Coefficient Changes under Different Sediment Concentrations with Constant Inlet Flow Velocity and Opening Degree
Taking 2.5 m/s and an opening of 60° as an example, numerical simulations were conducted on sediment concentrations of 0, 5, 10, 15, and 20 kg/m3 to study the changes in drag coefficient, flow coefficient, and cavitation coefficient.
According to Table 6 and Figure 6, it can be seen that when the inlet velocity and opening are constant, as the sediment concentration in the water increases, the valve drag coefficient increases and the flow coefficient decreases. When the sediment concentration in the water is between 10 and 15 kg/m3, the rate of decrease in flow coefficient becomes faster, the rate of increase in drag coefficient is greater. As the sediment concentration in the water further increases, the gradient of changes in flow coefficient and drag coefficient gradually decreases and tends to stabilize. As the sediment content in the water increases, the pressure difference between the inlet and outlet gradually increases, especially between 10 and 15 kg/m3, and the pressure changes significantly before and after the eccentric semi-ball valve. As the sediment concentration in the water increases, the cavitation coefficient first increases and then decreases, but overall it is small and the change is not significant. When the sediment concentration in the water is 0–20 kg/m3, 0.5 < σ < 1.5, the eccentric semi-ball valve will experience slight vibration within this range of sediment concentration in the water.

Table 6.
Changes in various coefficients of eccentric semi-ball valve under different sediment concentrations.
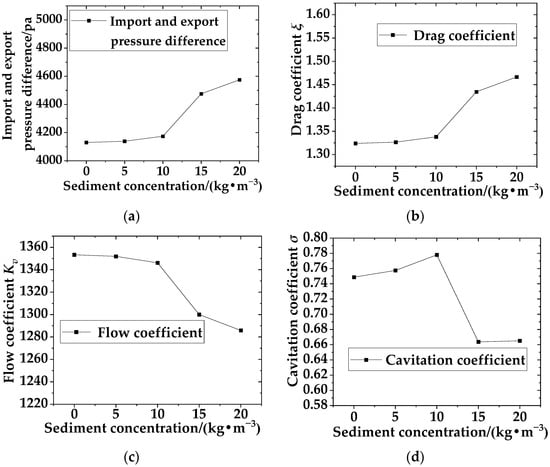
Figure 6.
Changes in various coefficients under different sediment concentrations. They should be listed as follows: (a) Import and export pressure difference. (b) Drag coefficient. (c) Flow coefficient. (d) Cavitation coefficient.
5.4. Analysis of Coefficient Changes under Different Inlet Flow Velocities with Constant Sediment Content and Opening Degree
Taking a sediment concentration of 10 kg/m3 and an opening of 60° as an example, numerical simulations were conducted on inlet velocities of 0.5, 1.5, 2.5, 3.5, and 4.5 m/s, respectively, and the changes in drag coefficient, flow coefficient, and cavitation coefficient were studied.
According to Table 7 and Figure 7, it can be seen that when the sediment concentration and opening degree in the water are constant, the valve drag coefficient decreases and the flow coefficient increases with the increase in inlet flow velocity. When the inlet flow velocity is between 0.5 and 1.5 m/s, the rate of increase in flow coefficient becomes faster, the rate of decrease in drag coefficient is greater, and the inlet flow velocity further increases. The flow coefficient and drag coefficient tend to stabilize. As the inlet flow rate increases, the pressure difference between the inlet and outlet gradually increases, and the pressure changes significantly before and after the eccentric semi-ball valve. As the inlet flow rate increases, the cavitation coefficient gradually decreases, which is not conducive to the safe operation of the eccentric semi-ball valve. Especially between 0.5 and 1.5 m/s, the cavitation coefficient of the eccentric semi-ball valve changes significantly. When the inlet flow rate is 3.5–4.5 m/s and σ < 0.5, prolonged exposure to this opening can easily cause wear and erosion of the valve, resulting in damage to the hemispherical valve. When the inlet flow rate is 2.5–3.5 m/s and 0.5 < σ < 1.5, the eccentric semi-ball valve will experience slight vibration at this opening. When the inlet flow rate is 1.5–2.5 m/s and 1.5 < σ < 2.5, slight cavitation occurs in the eccentric semi-ball valve, which does not affect normal use. When the inlet flow rate is 0.5–1.5 m/s and σ > 2.5, it is the optimal operating condition for the eccentric semi-ball valve.

Table 7.
Changes in various coefficients of the eccentric semi-ball valve at different inlet velocities.
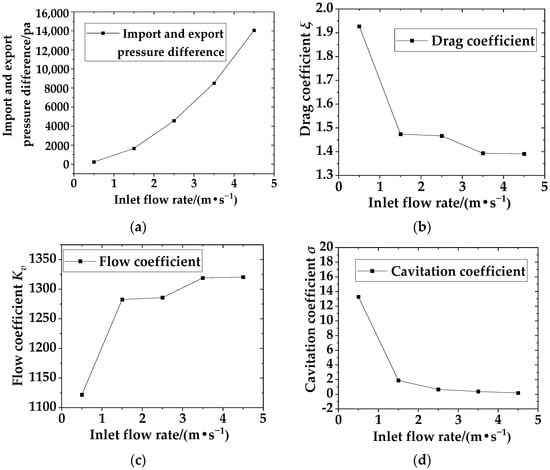
Figure 7.
Changes in various coefficients at different inlet velocities. They should be listed as follows: (a) Import and export pressure difference. (b) Drag coefficient. (c) Flow coefficient. (d) Cavitation coefficient.
5.5. Internal Flow Field Analysis of Eccentric Semi-Ball Valve at Different Openings
5.5.1. Internal Velocity Analysis of the Eccentric Semi-Ball Valve
Using an inlet flow velocity of 2.5 m/s and a sand concentration of 20 kg/m3 as examples, numerical simulations were conducted for a DN600 eccentric semi-ball valve at openings of 10°, 20°, 30°, 40°, 50°, 60°, 70°, 80°, and 90°. The study analyzed velocity contour variations in the pipeline under different openings, as shown in Figure 8. The maximum flow velocity of the pipeline at different openings is shown in Figure 9.
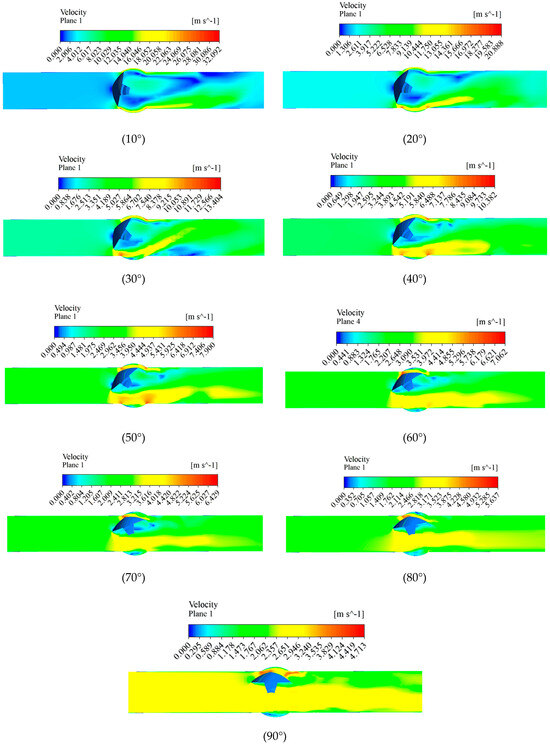
Figure 8.
Variation in pipe velocity at different openings.
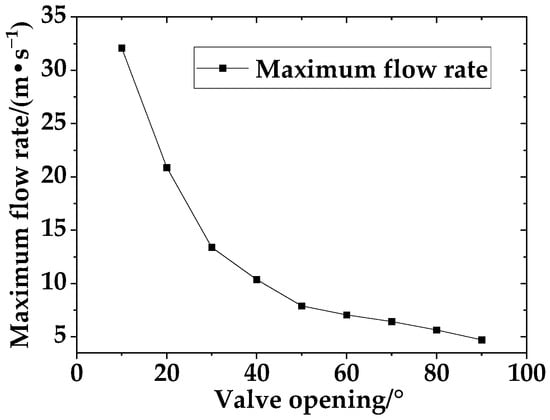
Figure 9.
Diagram of the maximum flow velocity of the pipe at different openings.
When the opening of the eccentric semi-ball valve is between 10° and 30°, due to the small valve opening, a large amount of water flow is obstructed by the valve, resulting in reduced flow velocity in front of the valve and partial backflow. A small portion of the water flows through the valve openings at both ends at higher velocities. Behind the valve, the water flow is extremely unstable under the impact of high-speed water flow. There is a significant velocity gradient across the valve flow, with lower flow velocities behind the valve plate. In the external high-speed flow envelope, two distinct vortex zones form behind the valve over time, causing certain damage to the valve plate. Moreover, the water flow passing through the valve increases the impact on both ends of the valve plate and the adjacent pipe wall.
With the opening increased from to 40° to 50°, the eccentric semi-ball valve aperture expands, allowing more water to flow through. However, due to the valve plate’s offset to one side, the flow of water across the valve becomes uneven on both sides. A large volume of water rushes downstream from the lower side, while a smaller amount flows downstream from the upper side between the valve plate and the pipe wall. Because the upper side of the valve plate has a large angle with the direction of water flow, there remains a low-velocity area. The area of flow through the lower side increases, reducing the area of low velocity at the back of the valve plate and decreasing the vortex area behind the valve. Compared to 20°, the flow conditions are improved, with a more pronounced velocity gradient.
At an aperture of 60° to 70°, the valve opening is larger compared to 40° to 50°. The flow rate passing through the valve plate from the lower side increases further. Overall, the velocity of the water flow through the valve has decreased. The angle between the valve plate and the water flow diminishes, nearly eliminating the low-velocity area at the upper end of the valve plate. The water flow velocity at the front end of the valve plate becomes more uniform. The low-velocity area behind the valve plate further decreases, and the vortex zone gradually disappears.
When the opening is 80°~90°, it can be regarded that the valve plate is fully open, the water flow through the valve is further reduced and continues to approach the average flow rate, the valve plate blocks the water flow less, the water flow before and after the valve plate is relatively stable, and the low flow rate area and vortex area on the back of the valve plate gradually disappear. With the increase in the opening of the eccentric semi-ball valve, the flow velocity in the high-velocity area at both ends of the valve plate decreases, the flow velocity gradient of the water passing through the valve decreases and tends to the inlet flow velocity, the low-flow velocity area at the rear of the valve plate decreases, and the vortex phenomenon gradually disappears, and the impact force on the pipe wall and valve plate is weakened.
5.5.2. Pressure Contour Map at Different Openings
The Figure 10 shows pressure distribution contour maps at different openings of an eccentric semi-ball valve, and Figure 11 shows the maximum and minimum pressure variation cloud map of the pipeline at different opening degrees.
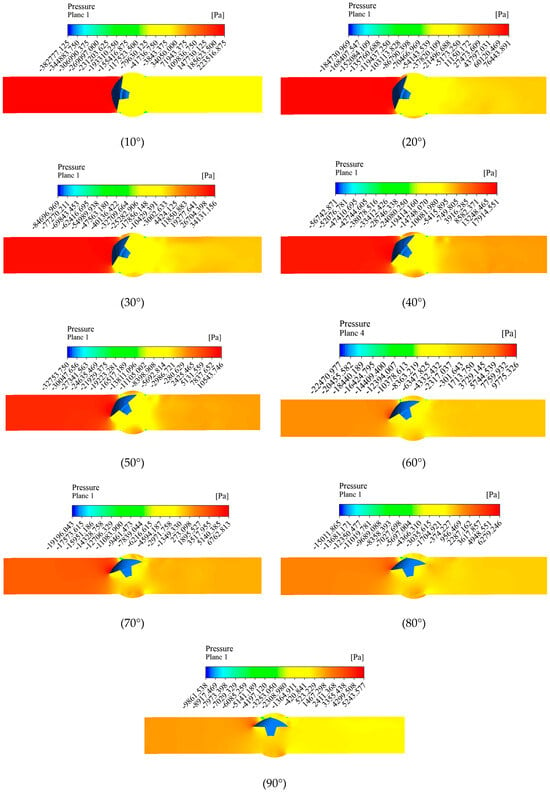
Figure 10.
Variation in pipe pressure at different openings.
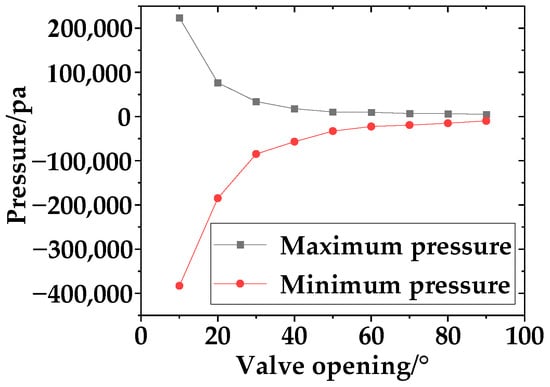
Figure 11.
The change in the maximum and minimum pressure of the pipe under different openings.
At valve openings of 10° to 30°, there is a significant pressure differential between the upstream and downstream pressure fields of the eccentric semi-ball valve. A distinct negative pressure zone is present downstream of the valve plate, relatively concentrated in distribution. As the valve plate opens further, the size of the low-pressure zone downstream decreases, while the high-pressure zones upstream of the valve plate extend downstream from both ends. The pressure gradient at both ends of the valve port is distinctly distributed from high to low. Upstream of the valve plate, there are high-pressure zones where the water flow exerts a significant force on the valve plate, resulting in friction between the valve stem and the valve body, which is not conducive to prolonged operation at this opening.
At openings of 40° to 50°, the gradient and variation in the flow area are pronounced, with a more intense pressure gradient. There is higher pressure near the pipe wall adjacent to the valve plate. Downstream of the valve plate, the low-pressure zone gradient is evident, and as the opening increases, the area of the negative pressure zone decreases and converges towards the back of the valve plate. Upstream of the valve plate, high pressure still exists but is somewhat reduced.
When the opening angle increases from 60° to 70°, the pressure gradient in the flow area across the valve plate diminishes somewhat. Apart from a concentrated area of high pressure at the front end of the valve plate, the upstream pressure throughout the rest of the valve plate decreases. Downstream, negative pressure generally weakens, reducing the difference in pressure gradients. The pressure on the downstream lower side of the valve plate is slightly higher than on the upper side, and the pressure differential between the front and back of the valve plate gradually diminishes and stabilizes.
When the opening angle is between 80° and 90°, the eccentric semi-ball valve is essentially in a fully open state. At 80° of opening, there is still a certain amount of negative pressure at the back of the valve plate. As the opening increases to 90°, there is almost no negative pressure zone in the pipeline. The upstream and downstream pressures stabilize at this point, and the pressure differential between the front and back of the valve plate reaches its minimum.
5.5.3. Effect of Opening on Erosion Wear of Eccentric Semi-Ball Valves
Erosive wear refers to the loss of surface material when a solid surface comes into relative motion with a fluid containing particles. The wear caused by solid particles on the material surface has always been a significant factor affecting equipment performance and service life. In the case of an eccentric semi-ball valve, erosive wear caused by solid particles in the fluid is one of the main reasons leading to valve failure. This wear not only impacts equipment lifespan but also poses serious safety risks. Understanding the extent and scope of erosive wear on eccentric semi-ball valves under different operating conditions is crucial for industrial safety and production integrity.
To study the influence of opening angle on the erosive wear of an eccentric semi-ball valve, numerical simulations were conducted for a DN600 valve under conditions of inlet velocity at 2.5 m/s and sand concentration of 20 kg/m3. The valve was simulated at opening angles of 10°, 20°, 30°, 40°, 50°, 60°, 70°, 80°, and 90°. The following Figure 12 shows erosion rate contour maps for each angle, measured in units of kg/(m2·s), indicating the mass loss per unit area per unit time.
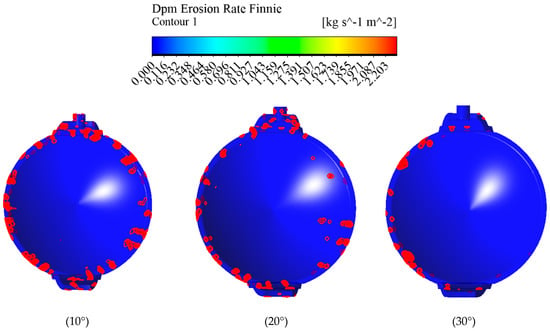

Figure 12.
Distribution diagram of valve wall erosion rates at different openings.
Analysis of the effect of opening angle on erosive wear in eccentric semi-ball valves: From the erosive wear contour maps at different opening angles of the eccentric semi-ball valve, it is evident that variations in the valve’s opening angle significantly impact the distribution and magnitude of erosive wear. As the opening angle increases, both the maximum amount and the extent of wear on the valve disc decrease noticeably, leading to reduced mass loss. Erosive wear predominantly appears in patchy distributions around the edge of the valve disc. When the opening angle of the eccentric semi-ball valve is smaller, the flow cross-section through the valve is narrower, resulting in higher fluid velocities and greater velocity variations as the water flows past the valve. This also increases the velocity of particles, intensifying their interaction with the velocity field and causing more irregular trajectories. Consequently, the kinetic energy carried by particles is higher, thereby enhancing erosive effects on the valve and its surfaces. Conversely, as the opening angle of the eccentric semi-ball valve increases, fluid velocities decrease. This results in reduced velocities and kinetic energies gained by particles, consequently lowering the degree of erosive wear caused by collisions. This explains why as the opening angle increases, the erosive wear on the eccentric semi-ball valve decreases significantly.
5.6. Analysis of Internal Flow Field in Eccentric Semi-Ball Valves with Sediment Concentration
5.6.1. Internal Velocity Analysis of Eccentric Semi-Ball Valves
Using an inlet velocity of 2.5 m/s and a valve opening of 60° as examples, conduct numerical simulations on a DN600 eccentric semi-ball valve with sediment concentrations of 0, 5, 10, 15, and 20 kg/m3. Analyze the variations in velocity contour maps in the pipeline under different sediment concentrations.
As shown in Figure 13, when the opening and inlet flow rates are constant and the sediment concentration is 0–5 kg/m3, the flow rate passing through the valve plate from the upper side is relatively high, and the overall flow velocity of the water passing through the valve is also high. The low-speed area near the wall on the upper side behind the valve is large, and the flow velocity gradient of the water passing through the valve is large. The water flow velocity behind the valve plate is low, and two obvious vortex zones are formed behind the valve under the external high-speed flow. The water flow velocity at the front end of the valve plate is relatively uniform, and the boundary between the low-velocity zone and the high-velocity zone behind the valve is obvious. When the sediment concentration is 10–20 kg/m3, the flow velocity of the water passing through the valve begins to decrease, the area of the low-velocity zone on the back of the valve plate increases, the area of the vortex zone behind the valve decreases, the water flow before and after the valve plate is relatively stable, and the boundary between the low-velocity zone and the high-velocity zone behind the valve gradually disappears. As shown in Figure 14, with the increase in sediment concentration, the maximum flow velocity of the pipeline decreases at an increasingly fast rate.
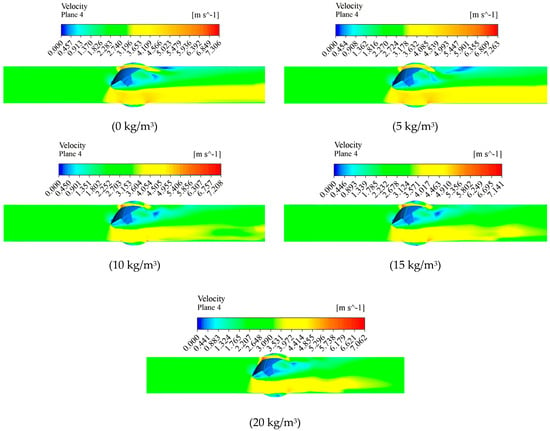
Figure 13.
Velocity variation diagram in pipelines under different sediment concentrations.
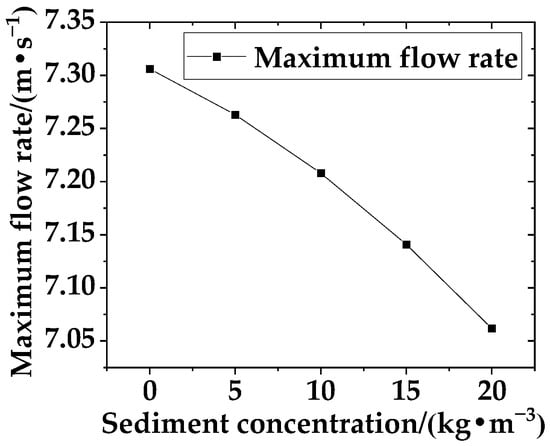
Figure 14.
Maximum flow velocity diagrams in the pipeline under different sediment concentrations.
5.6.2. Pressure Contour Map under Different Sediment Concentrations
The diagram below shows pressure distribution contour maps of the eccentric semi-ball valve under different sediment concentrations of 0, 5, 10, 15, and 20 kg/m3.
From Figure 15 and Figure 16, it can be observed that there is a clear distinction in the pressure fields upstream and downstream of the valve disc. There is a noticeable negative pressure zone downstream of the valve disc, and its distribution is relatively concentrated. As the sediment concentration in the water increases, the pressure upstream of the valve disc significantly strengthens, the low-pressure zone downstream of the valve disc decreases, and the high-pressure zone upstream of the valve disc extends downstream from both ends. With higher sediment concentrations, the area of high pressure upstream of the valve disc increases, exerting greater force on the valve disc. Therefore, prolonged operation under high sediment conditions is detrimental to the normal operation of the eccentric semi-ball valve. As the sediment concentration in the water gradually increases, the pressure gradient in the overflow area increases sharply, leading to drastic changes. This results in higher pressures near the valve disc and notably increased negative pressures.
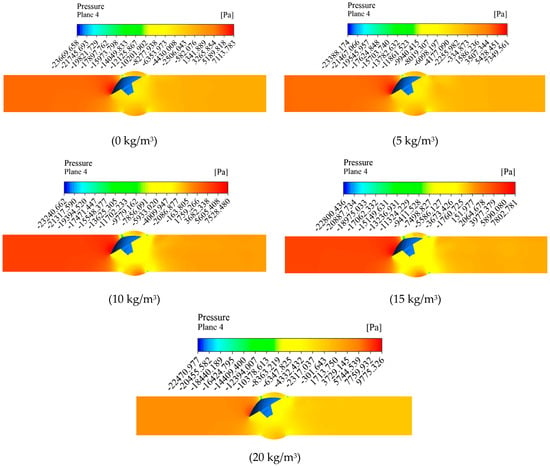
Figure 15.
Pressure variation in pipelines under different sediment concentrations.
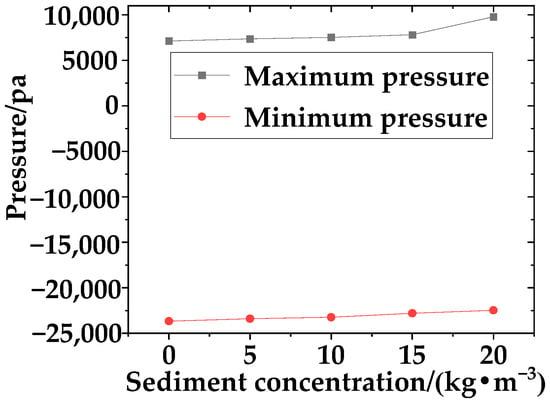
Figure 16.
Graph showing variations in maximum and minimum pipeline pressures under different sediment concentrations.
5.6.3. The Impact of Sediment Concentration on the Erosion and Abrasive Wear of Eccentric Semi-Ball Valves
To study the effect of sediment concentration on the erosion and abrasive wear of eccentric semi-ball valves, numerical simulations were conducted at an inlet flow velocity of 2.5 m/s and a valve opening of 60°. Sediment concentrations of 0, 5, 10, 15, and 20 kg/m3 were simulated. Figure 17 shows erosion rate contour maps corresponding to each sediment concentration. The unit is kg/(m2·s), indicating the mass loss per unit area per unit time.
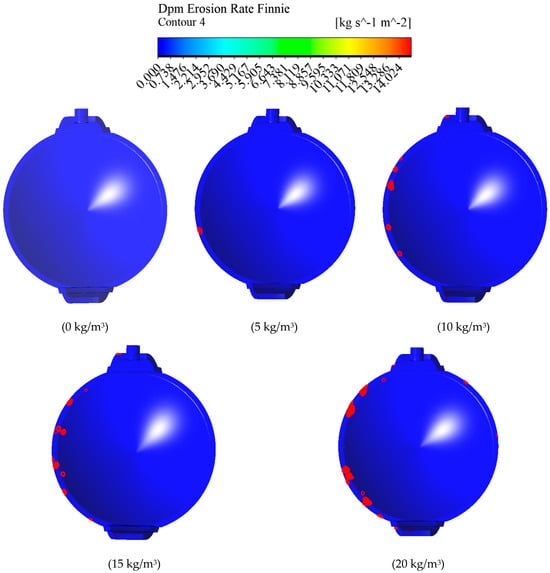
Figure 17.
Distribution of valve wall erosion rates at different sediment concentrations.
Based on the erosion and wear contour maps of the eccentric semi-ball valve at different sediment concentrations, it is evident that sediment content in water significantly influences the distribution and extent of erosion and wear. As sediment concentration increases, both the maximum wear amount and the extent of wear on the valve disc notably increase, resulting in a significant rise in mass loss. Erosion and wear are predominantly concentrated in a spotty manner around the edges of the valve disc. With higher sediment concentrations, the disturbance of particle movement by the velocity field becomes more pronounced, leading to more irregular trajectories of particles and intensifying erosion effects on the eccentric semi-ball valve.
The increase in sediment concentration increases the surface area of particles, thereby enhancing the resistance and gravitational effects of particles. This phenomenon leads to reduced velocity acquired by particles from the liquid phase, resulting in decreased kinetic energy of particles. While individual sediment particles may exhibit reduced erosion on the butterfly plate and pipeline wall, the overall rate of erosion and wear increases due to the larger total volume of sediment particles present.
5.7. Internal Flow Field Analysis of an Eccentric Semi-Ball Valve at Inlet Velocity
5.7.1. Internal Velocity Analysis of an Eccentric Semi-Ball Valve
Using an example with a sediment concentration of 20 kg/m3 and an opening angle of 60°, numerical simulations were conducted on an eccentric semi-ball valve with a diameter of DN600, considering inlet velocities of 0.5, 1.5, 2.5, 3.5, and 4.5 m/s. The analysis aimed to examine the velocity contour maps within the pipeline under different inlet velocities, as shown in Figure 18. The maximum flow velocity of the pipeline under different inlet flow velocities is shown in Figure 19.
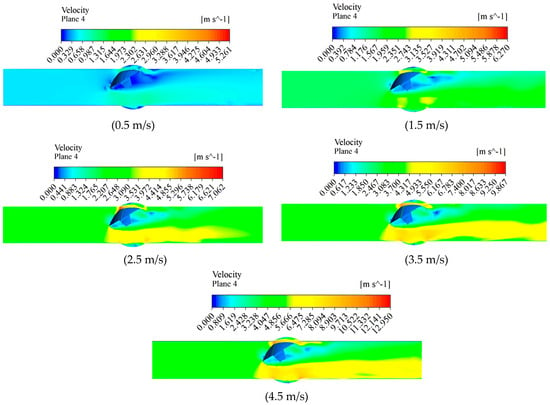
Figure 18.
Velocity variation diagrams in the pipeline under different inlet flow velocities.
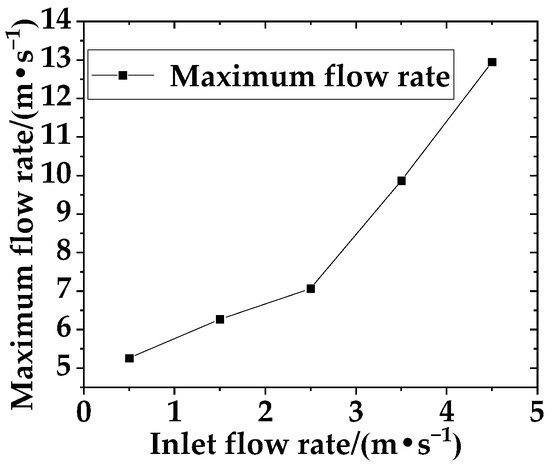
Figure 19.
Maximum velocity diagrams in the pipeline under different inlet flow velocities.
At an inlet flow velocity of 0.5 m/s, the flow velocity within the pipeline is relatively low. The velocity gradient of the flow passing through the valve is small, and the velocity behind the valve plate is low. Under the influence of high-speed external flow, two distinct vortex regions form behind the valve. With an inlet flow velocity increasing to 1.5 to 2.5 m/s, the flow velocity through the valve increases. However, due to the valve plate being biased to one side, the flow velocities on both sides of the valve become uneven. A large volume of water flows downstream from upstream, while a smaller amount of fluid flows downstream between the upper side of the valve plate and the pipe wall. The area of low velocity behind the valve plate decreases, and the velocity gradient becomes more pronounced. At inlet flow velocities of 3.5 to 4.5 m/s, the flow rate passing through the valve plate’s lower side increases further. The overall flow velocity of the water passing through the valve increases. The flow velocity at the front end of the valve plate becomes more uniform, and the area of low velocity behind the valve further decreases. The vortex regions gradually disappear, and the boundary between the low-velocity area behind the valve and the high-velocity area becomes more distinct.
5.7.2. Pressure Contour Map under Different Inlet Velocities
The following Figure 20 shows pressure distribution contour maps of an eccentric semi-ball valve under numerical simulations at different inlet velocities of 0.5, 1.5, 2.5, 3.5, and 4.5 m/s. Figure 21 shows the variation of maximum and minimum pressure in the pipeline at different inlet flow rates.
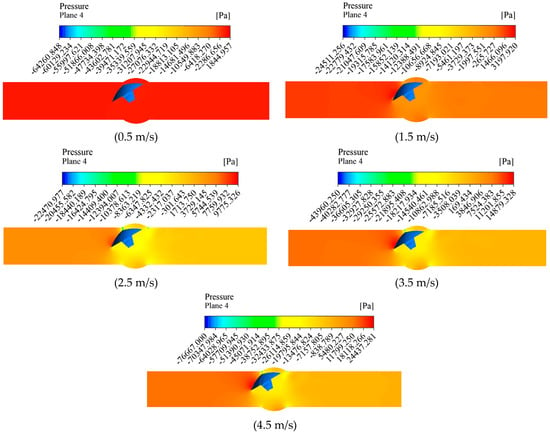
Figure 20.
Pressure variation in pipelines under different inlet velocities.
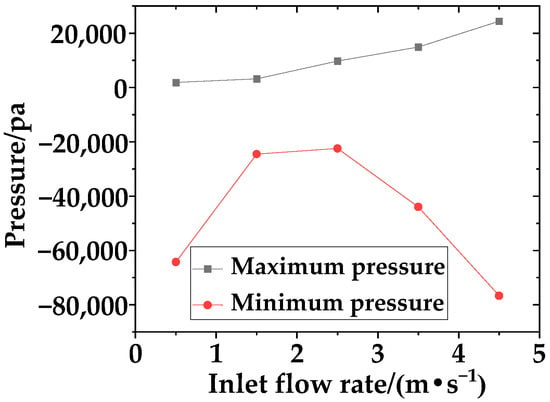
Figure 21.
Pressure variation diagrams in pipelines under different inlet velocities show maximum and minimum pressures.
At an inlet velocity of 0.5 m/s, the difference in pressure fields upstream and downstream of the eccentric semi-ball valve plate is very minimal, and the pressure distribution is relatively uniform. As the inlet velocity increases to 1.5–2.5 m/s, the flow velocity through the valve increases, enlarging the low-pressure area downstream of the valve plate. The pressure gradient across the valve ends becomes more pronounced, and positive pressure upstream of the valve plate gradually increases. The force of the water flow on the valve plate increases, resulting in friction between the valve stem and the valve body, which is not conducive for prolonged operation at this valve opening. With an inlet velocity of 3.5–4.5 m/s, the gradient changes in the flow area become more severe, leading to higher pressures near the pipe wall adjacent to the valve plate. Particularly, the minimum negative pressure and the pressure differential before and after the valve plate further increase.
5.7.3. The Influence of Inlet Velocity on Erosion and Wear of the Eccentric Semi-Ball Valve
To study the effect of inlet velocity on erosion and wear of the eccentric semi-ball valve, numerical simulations were conducted at an opening of 60° and with a sand concentration of 20 kg/m3. Inlet velocities of 0.5, 1.5, 2.5, 3.5, and 4.5 m/s were simulated. Figure 22 shows erosion rate contour maps for each opening, measured in units of kg/(m2·s), indicating the mass loss per unit area over time.
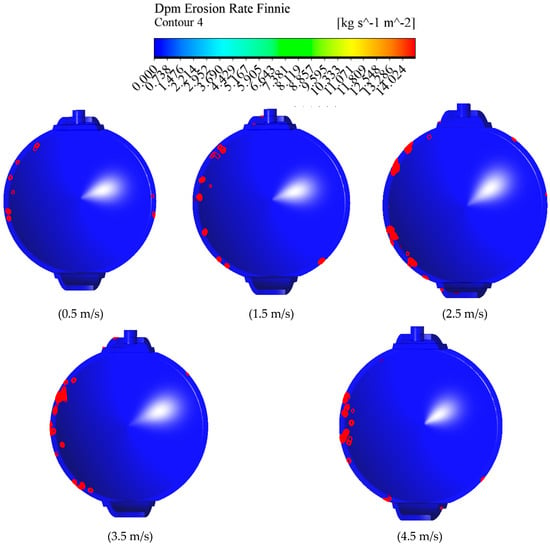
Figure 22.
Distribution maps of valve wall erosion rate at different inlet velocities.
From the erosion and wear contour maps of the eccentric semi-ball valve at different inlet velocities, it is evident that varying inlet velocities significantly influence the distribution and extent of erosion and wear. As the inlet velocity increases, both the maximum amount and the extent of wear on the valve plate noticeably increase. Erosion and wear are primarily observed in a punctate and chunky distribution around the edges of the valve plate. The reason for these changes lies in the fact that as the inlet velocity of the eccentric semi-ball valve increases, the flow velocity of water passing through the valve also increases, along with greater velocity variations. This results in higher particle velocities, stronger disturbances in the velocity field affecting particle motion, and more pronounced irregular trajectories of particles. Consequently, particles possess greater kinetic energy, leading to intensified erosion effects on both the eccentric semi-ball valve and the surrounding surfaces.
6. Conclusions
Given the complexity of flow dynamics in the eccentric semi-ball valve at the outlet of water pumps and the limited research in this area, this study focuses on a DN600 eccentric semi-ball valve. Through numerical simulation calculations, parameters such as drag coefficient, flow coefficient, and cavitation coefficient are investigated. The simulated results include velocity contour maps, pressure contour maps, and erosion and wear contour maps, which are analyzed for patterns. The main findings are as follows:
(1) Theoretical analysis of the eccentric semi-ball valve reveals that current research and operational principles often overlook parameters such as drag coefficient, flow coefficient, and cavitation coefficient, which significantly impact the safe operation of the eccentric semi-ball valve and pump station transition processes. As an important measure to ensure the safe operation of pumping stations, eccentric semi-ball valves provide a theoretical basis and technical support for the safe operation of water supply projects through numerical simulation and fitting of relevant curves.
(2) With constant inlet velocity and sediment concentration, as the opening angle of the eccentric semi-ball valve increases, the valve drag coefficient decreases, the flow coefficient increases, and the cavitation coefficient increases but the severity of cavitation diminishes. For an opening angle range of 70° < θ < 90°, with 1.5 < σ < 2.5, slight cavitation occurs in the eccentric semi-ball valve, which does not affect normal operation. As the opening angle of the eccentric semi-ball valve increases, the velocity decreases in the high-speed regions at both ends of the valve plate, and the velocity gradient across the valve water flow diminishes. The area of the low-velocity region behind the valve plate reduces, gradually weakening the vortex phenomenon. The flow velocity over the valve plate continuously decreases, approaching the inlet velocity, and reducing the impact force on the pipe wall and valve plate. The pressure difference before and after the valve decreases, leading to a stabilization of pressure before and after the valve. With increasing opening angle, both the maximum wear amount and the extent of wear on the valve plate significantly decrease, resulting in reduced mass loss.
(3) With constant inlet velocity and fixed opening angle, as the sediment concentration in the water increases, the valve drag coefficient increases while the flow coefficient decreases. The cavitation coefficient initially increases and then decreases. For sediment concentrations of 0 to 20 kg/m3, 0.5 < σ < 1.5. Within this range, the eccentric semi-ball valve experiences slight vibration. As sediment concentration gradually increases, the maximum flow velocity in the pipeline decreases more rapidly. The pressure gradient in the flow area increases, leading to more pronounced and abrupt changes. There is greater pressure on the pipe wall near the valve plate, especially with a significant increase in negative pressure. Therefore, prolonged operation under high sediment concentrations is detrimental to the normal operation of the eccentric semi-ball valve. With increasing sediment concentration, both the maximum wear amount and the extent of wear on the valve plate noticeably increase, resulting in greater mass loss.
(4) When sediment concentration and valve opening are constant, increasing inlet flow velocity decreases the valve drag coefficient and increases the flow coefficient. The cavitation coefficient gradually decreases, which is detrimental to the safe operation of the eccentric semi-ball valve. As the inlet flow velocity increases, the maximum water flow velocity over the valve increases, intensifying erosion on the valve plate, stem, and pipe walls. This results in an increased pressure differential before and after the valve. Therefore, maintaining lower pipeline flow velocities helps the eccentric semi-ball valve operate safely under low-pressure conditions. It is advisable to keep the inlet flow velocity of the pump within a reasonable range. With higher flow velocities over the valve, the downstream low-pressure area behind the valve plate enlarges. There is a noticeable gradient in pressure distribution from small to large towards both ends of the valve opening, and upstream positive pressure on the valve plate gradually increases. The force of the water flow on the valve plate increases, leading to friction between the stem and valve body, which is unfavorable for long-term operation. As inlet flow velocity increases, both the maximum wear amount and the extent of wear on the valve plate significantly increase. Erosive wear is mainly concentrated in patches along the edges of the valve plate.
In summary, this study focuses on the solid–liquid two-phase flow characteristics of a DN600 eccentric semi-ball valve. We investigate the variations in internal flow field characteristics of the valve, comparing and analyzing erosion wear, flow resistance parameters, and cavitation coefficients under different operating conditions. This study only used Fluent software to theoretically simulate and analyze the eccentric semi-ball valve, and only conducted partial experimental verification, lacking complete experimental verification. In the future, a more in-depth analysis of the eccentric semi-ball valve can be conducted through a combination of experiments and theory.
Author Contributions
Conceptualization, Y.T., Y.C. and J.W.; methodology, Y.T., Y.C. and H.J.; software, Y.T. and Y.C.; validation, Y.T., Y.C. and L.S.; formal analysis, Y.T. and Y.C.; investigation, J.W. and H.J.; resources, J.W., H.J. and L.S.; data curation, Y.T., Y.C. and L.S.; writing—original draft preparation, Y.T. and Y.C.; writing—review and editing, Y.T., Y.C. and J.W.; visualization, Y.T. and Y.C.; supervision, J.W., H.J. and L.S.; project administration, J.W. and Y.C.; funding acquisition, J.W. and Y.C. All authors have read and agreed to the published version of the manuscript.
Funding
This research was funded by the Free Exploration Project of Basic Research Programs of Shanxi Province, Science and Technology Department of Shanxi Province, China (20210302123169, 202203021212271), the Scientific and Technological Innovation Programs of Higher Education In-stitutions in Shanxi, Shanxi Provincial Education Department, China (2021L020, 2022L033), the School-level Scientific Research Programs of Taiyuan University of Technology, Taiyuan University of Technology, China (2022QN055), the Graduate Education and Teaching Management Innovation Programs of Shanxi Province, Shanxi Provincial Education Department, China (2023JG031), and the special fund for Science and Technology Innovation Teams of Shanxi Province (202204051002027).
Institutional Review Board Statement
Not applicable.
Informed Consent Statement
Not applicable.
Data Availability Statement
The data presented in this study can be made available upon request from the authors. The data are not publicly available due to privacy restrictions.
Acknowledgments
The authors are grateful for the research collaboration.
Conflicts of Interest
The authors declare no conflicts of interest.
Nomenclature
| p | parameters of particles |
| particle mass | |
| particle velocity (m/s) | |
| FD | drag force |
| FB | buoyancy caused by gravity |
| F | other forces exerted on particles besides drag force and buoyancy caused by gravity |
| FVM | virtual quality power |
| FP | pressure gradient force |
| FR | Coriolis force and centrifugal force present in rotating systems |
| FM | Magnus lift |
| FS | Saffman lift |
| FBA | Basset force |
| P1 | inlet pressure of eccentric semi-ball valve (pa) |
| P2 | outlet pressure of eccentric semi-ball valve (pa) |
| v | average velocity of fluid (m/s) |
| ρ | fluid density (Kg/m3) |
| Kv | flow coefficient |
| fluid volume flow rate (m3/h) | |
| ∆p | Import and export pressure difference (pa) |
| σ | cavitation coefficient |
| the saturated vapor pressure of water at room temperature (25 ℃) is 3160 pa. | |
| E | dimensionless erosion mass |
| K | model constant |
| Vp | particle impact velocity |
| f(γ) | dimensionless function of the impact angle γ |
| n | for metals, the value of the exponent n is generally in the range of 2.3 to 2.5. |
References
- Ma, G.; Lin, Z.; Zhu, Z.; Fang, Y. Effect of variable speed motion curve of electric actuator on ball valve performance and internal flow field. Adv. Mech. Eng. 2021, 13, 16878140211028003. [Google Scholar] [CrossRef]
- Shi, M.; Ye, T.; Zhou, B.; Pu, H.; Jiang, C. Design and experimental research of internal leakage detection device of buried pipeline ball valve based on valve cavity pressure detection. Flow Meas. Instrum. 2022, 83, 102112. [Google Scholar] [CrossRef]
- Zhang, J.; Yang, Q.; Lv, R.; Liu, B.; Li, Y. Research on noise generation mechanism and noise reduction ball valve measures of ball valve. IEEE Access 2020, 8, 15973–15982. [Google Scholar] [CrossRef]
- Yan, X.; Wang, G.; Xiong, J. Analytical Research on the Flow Resistance Characteristics of Low-noise Ball Valves Based on Computational Fluid Dynamics Technology. J. Phys. Conf. Ser. 2023, 1, 2565. [Google Scholar] [CrossRef]
- Shi, M.; Tan, P.; Qin, L.; Huang, Z. Research on Valve Life Prediction Based on PCA-PSO-LSSVM. Processes 2023, 11, 1396. [Google Scholar] [CrossRef]
- Ivancu, L.-I.; Popescu, D. Investigation of the Fluid Flow in a Large Ball Valve Designed for Natural Gas Pipelines. Appl. Sci. 2023, 13, 4247. [Google Scholar] [CrossRef]
- Ren, R.; Su, T.; Ma, F.; Zhao, X.; Xu, C.; Wu, X. Influence of the flow area around the ball valve on the flow characteristics of the injector control valve. Flow Meas. Instrum. 2023, 90, 102333. [Google Scholar] [CrossRef]
- Liu, J.; Liu, Z.; Wu, J.; Li, Z.; Chen, P.; Gu, X. Visualization experiment and numerical calculation of the cavitation evolution inside the injector ball valve. Fuel 2022, 329, 125500. [Google Scholar] [CrossRef]
- Cao, Y.; Zhou, L.; Ou, C.; Fang, H.; Liu, D. 3D CFD simulation and analysis of transient flow in a water pipeline. AQUA Water Infrastruct. Ecosyst. Soc. 2022, 71, 751–767. [Google Scholar] [CrossRef]
- Han, Y.; Shi, W.; Xu, H.; Wang, J.; Zhou, L. Effects of Closing Times and Laws on Water Hammer in a Ball Valve Pipeline. Water 2022, 14, 1497. [Google Scholar] [CrossRef]
- Yang, B.; Zhao, L.; Tian, T.; Qin, Y.; Liu, C. Research on ball valve and misaligned guide vane devices to improve the “S” characteristics of a pump turbine. J. Mech. Sci. Technol. 2022, 36, 2425–2435. [Google Scholar] [CrossRef]
- Xu, B.; Lin, Z.; Zhu, Z.; Yu, T. Experimental and simulation study of the effect of gravity on the solid-liquid two-phase flow and erosion of ball valve. Adv. Powder Technol. 2022, 33, 103416. [Google Scholar] [CrossRef]
- Zhao, J.; Chen, S.; Yang, G.; Zhang, H. Simulation study on the cavitation distribution in the ball valve of a common rail injector. Int. J. Engine Res. 2024, 25, 1575–1587. [Google Scholar] [CrossRef]
- Zhang, G.; Zhang, H.T.; Wu, Z.Y.; Wu, X.; Kim, H.D.; Lin, Z. Experimental studies of cavitation evolution through a butterfly valve at different regulation conditions. Exp. Fluids 2024, 65, 4. [Google Scholar] [CrossRef]
- Zhang, H.T.; Wu, X.; Suryan, A.; Lin, Z.; Zhang, G. Experimental study on cavitation inhibition in a butterfly valve with different plate shapes. Phys. Fluids 2024, 36, 023363. [Google Scholar] [CrossRef]
- Ozkan, E. Mechanical shock test simulation analysis of butterfly valves developed for the naval defense industry and evaluation of real test and production data. Sci. Rep. 2024, 14, 9692. [Google Scholar] [CrossRef]
- Zhang, G.; Wang, W.W.; Wu, Z.Y.; Kim, H.D.; Lin, Z. Effect of the opening degree on evolution of cryogenic cavitation through a butterfly valve. Energy 2023, 283, 128543. [Google Scholar] [CrossRef]
- Nguyen, Q.K.; Jung, K.H.; Lee, G.N.; Park, S.B.; Kim, J.M.; Suh, S.B.; Lee, J. Experimental study on pressure characteristics and flow coefficient of butterfly valve. Int. J. Nav. Archit. Ocean Eng. 2023, 15, 100495. [Google Scholar] [CrossRef]
- Kim, M.S.; Seong, H.S.; Yang, J.H.; Lee, S.W.; Choi, S.W. Fluid Flow and Effect of Turbulence Model on Large-Sized Triple-Offset Butterfly Valve. J. Appl. Fluid Mech. 2023, 16, 2364–2380. [Google Scholar]
- Li, S.; Zhang, B.; Yang, L.; Zhang, J.; Wang, Y.; Kang, W. Study on Wear Properties of the Graphite-Sealing Surfaces in a Triple Eccentric Butterfly Valve Based on EDEM-Fluent Coupling. Machines 2023, 11, 463. [Google Scholar] [CrossRef]
- Tao, J.; Lin, Z.; Zhang, G.; Su, J.; Zhu, Z. A numerical and experimental study of the time-averaged and transient flow downstream of a butterfly valve. J. Fluids Eng. 2022, 144, 051202. [Google Scholar] [CrossRef]
- Tong, Q.; Zhao, W.; Guo, T.; Wang, D.; Dong, X. A Study of the Gelatin Low-Temperature Deposition Manufacturing Forming Process Based on Fluid Numerical Simulation. Foods 2023, 12, 2687. [Google Scholar] [CrossRef] [PubMed]
- Żyłka, M.; Marszałek, N.; Żyłka, W. Numerical simulation of pneumatic throttle check valve using computational fluid dynamics (CFD). Sci. Rep. 2023, 13, 2475. [Google Scholar] [CrossRef]
- Qu, H.; Chen, X.; Liu, X.; Liu, Y.; Li, Z.; Zeng, Z. Particle-fluid flow and distribution in a horizontal pipe with side holes using experiment and numerical simulation. Powder Technol. 2023, 417, 118245. [Google Scholar] [CrossRef]
- Liu, J.; Yu, F.; He, B.; Yan, T. Hydrodynamic numerical simulation and prediction of bionic fish based on computational fluid dynamics and multilayer perceptron. Eng. Appl. Comput. Fluid Mech. 2022, 16, 858–878. [Google Scholar] [CrossRef]
- Hu, T. Fluxion Form Comparison between Newton Fluid and Bingham Fluid based on Three-Dimensional Numerical Simulation With Examples of Blood in Aorta and Water. J. Phys. Conf. Ser. 2022, 2386, 012006. [Google Scholar] [CrossRef]
- Wang, Y.; Zhu, Y.; Shen, X.R.; Ma, J.F. Numerical Simulation and Experimental Research of a New Butterfly Valve. Appl. Mech. Mater. 2012, 1977, 1255–1260. [Google Scholar] [CrossRef]
- Han, Y.; Zhou, L.; Bai, L.; Xue, P.; Lv, W.; Shi, W.; Huang, G. Transient simulation and experiment validation on the opening and closing process of a ball valve. Nucl. Eng. Technol. 2022, 54, 1674–1685. [Google Scholar] [CrossRef]
- Askari, A.; Falavand Jozaei, A. Numerical simulation of the effect of particle size on the erosion damage in ball valves of pressure reducing station. J. Comput. Appl. Mech. 2021, 52, 1–11. [Google Scholar]
- Lin, Z.H.; Hou, C.W.; Zhang, L.; Guan, A.Q.; Jin, Z.J.; Qian, J.Y. Fluid-structure interaction analysis on vibration characteristics of sleeve control valve. Ann. Nucl. Energy 2023, 181, 109579. [Google Scholar] [CrossRef]
- Chi, J.; Chen, W.; Shen, S.; Mu, X. Experimental study on bubbles behaviors in pure water flash evaporation process. Desalin. Water Treat. 2024, 317, 100213. [Google Scholar] [CrossRef]
Disclaimer/Publisher’s Note: The statements, opinions and data contained in all publications are solely those of the individual author(s) and contributor(s) and not of MDPI and/or the editor(s). MDPI and/or the editor(s) disclaim responsibility for any injury to people or property resulting from any ideas, methods, instructions or products referred to in the content. |
© 2024 by the authors. Licensee MDPI, Basel, Switzerland. This article is an open access article distributed under the terms and conditions of the Creative Commons Attribution (CC BY) license (https://creativecommons.org/licenses/by/4.0/).