Abstract
For the reuse of traction batteries, many different scenarios exist, for example, stationary storage farms or fast charging stations. Another second-life usage scenario is the reuse of batteries as home energy storage in combination with a photovoltaic installation in a private household. This application is the focus of the present study. Home energy storage is a reasonable possibility for storing renewable energy and conserving resources, but it also includes multiple challenges regarding reliability and safety requirements. Within this study, these challenges are investigated. A battery inspection concept was developed, and a logistic model for considering the legal requirements was created. Data from different use cases were selected, and their structure was homogenized. To assess their safety, fire tests were performed. In addition, a concept for a reliability assessment that provides the possibility to evaluate the suitability of a battery for a second-life application based on usage data in its first life was developed. Based on the results, a prototype of a second-life storage system was built from traction battery cells removed from electric vehicles. This prototype is currently used to store energy from a photovoltaic system, and its usage data were collected.
1. Introduction
To counteract climate change, emission-free energy sources are required. The generation of renewable energies is inconsistent. Therefore, the demand for energy storage is increasing and is predicted to continue rising over the coming years [1]. Storage systems are required in many different sectors. An especially high demand regarding the amount of stored energy is needed in the mobility sector. As an action against global warming, a change in the type of powertrain used is currently being pursued, and the market shares of electric and hybrid vehicles (EV and HEV) have increased significantly in recent years [2,3,4].
In these types of vehicles, a traction battery is used, which is often built using multiple lithium-ion cells [5]. Since batteries degrade, they reach their end of life (EOL) in the vehicle when the requirements of the application can no longer be accomplished. In the Electric Vehicle Battery Test Procedures Manual of 1996 [6], the EOL of a vehicle is defined as a capacity loss or a peak power loss of more than 20%. The EOL at a capacity loss of 20% to 30% is assumed in many studies in order to define the vehicle battery’s EOL, as seen, for example, in [7,8,9]. Although the battery is no longer suitable for use within the vehicle, it might still fulfill the requirements of an application with a lower load case. Therefore, the used batteries as a whole, or parts of them (modules or cells), can be utilized, and the usage phase can be enlarged with a second life [7]. A second life reduces the need for disposal; energy consumption for the production of new batteries for the considered second-life application is not required, resulting in a more efficient use of resources [10]. Along with the advantages, reuse also involves many challenges. The battery is constructed specifically for its first-life application, and the battery management system (BMS) and the safety architecture within the vehicle are designed accordingly. Since the degradation of the battery is influenced by the individual usage, each battery has a unique initial situation that needs to be considered for the preparation of the second-life application [11,12]. Besides that, a new safety architecture as well as a new BMS, which are both adapted to the regarded second-life application, are needed [2,13].
The technical feasibility of different second-life applications for EV batteries has been analyzed and shown previously; for example, by the BMW storage farm in Leipzig (Germany), which was built from up to 700 used BMW i3 batteries by BMW (Munich, Germany) [14], and by the 13 MWh second-life battery storage in Luenen (Germany), which was built using 1000 battery systems from the Smart Fortwo electric (second generation) [15]. Also on the market is the E-STOR storage system from Connected Energy, which is equipped with second-life Renault EV batteries [16], and a configuration of the xStorage Compact by Eaton, with second-life batteries [17]. Besides these real-world applications, several examples of scientific research have been published involving investigations regarding the second-life use of batteries from multiple different perspectives. In [7], the technical as well as the economic feasibility of eight possible second-life applications have been investigated, and four applications were identified as possible second-life ones for traction batteries. In [18], the suitability of batteries for a second-life application from a degradation point of view was studied. In that study, battery cells (type: lithium-ion nickel manganese cobalt/carbon), as well as stacks of three cells, were aged in a second-life application with two different load cases—a Spanish residential household and, for mitigation, the power variability of a grid-scale photovoltaic system. The first life of the cells also took place under laboratory testing conditions. The first-life load profile was based on the Worldwide Harmonized Light Duty Test cycle (WLTC) and was also studied under different static aging conditions. The suitability of the cells for a second-life application was found to depend on the degradation during its first life. Within the SASLAB (Sustainability Assessment of Second-Life Application of Automotive Batteries) project, the sustainability of a second life of traction batteries was analyzed from three different perspectives—technical, environmental, and social. The technical perspective was analyzed based on laboratory aging tests on new and used batteries and was based on the findings that a second use of the batteries seemed to be technically feasible. Two specific use cases were looked at in order to investigate the environmental implications, and with certain restrictions, a benefit was found for the second-use cases in terms of peek saving and an increase in the self-consumption of a residential house equipped with a photovoltaic installation. As well as the regarded perspectives, it was also found that the economic perspective should be considered in order to assess the suitability [9]. Ahmadi et al. [8] predicted a usage time of ten years and a further capacity loss of 15% for lithium-ion batteries in a second-life application as an energy storage device. This analysis was performed based on data exploration. In the Sunbatt project [11], different second-life use cases were simulated, and the second-life lifespan was estimated. An application-dependent life span of 6 years (area regulation grid services) to 30 years (fast electric vehicle charging support) was found. Within the EOL-IS project, concepts and software solutions, e.g., for the evaluation of a traction battery for different reuse scenarios, have been developed. Chemical, technical, economical, and information technological challenges were faced within this project. A concept for an eEOL-Pass was presented, which was focused on the changes required when placing the vehicle on the market [19]. These are some examples that represent the state-of-the-art in science and technology for this research field. As can been seen, investigations from interdisciplinary perspectives are ongoing in the battery research field with regard to second-life applications.
Although much research has been carried out and second-life applications have been instigated, there are still many research questions remaining. For example, the connection between a specific usage profile and battery degradation has not been fully researched. Besides that, the environmental impact of a failure resulting in a fire of this type of battery needs to be considered. The threats posed by the usage of lithium-ion batteries, the complexity of the aging process, the many different configurations and chemistries, and the impact of individual usage require much more interdisciplinary research to ensure a safe second-life usage and to make the best use of the resources. On top of that, especially the consideration of different perspectives is seen as particularly relevant. As already described, there are some investigations with a multidisciplinary approach. To the author’s knowledge, none of the existing studies face the combination of the following challenges:
- The possibilities to remove, check, transport and reconstruct battery parts without internal manufacturer information and in consideration of legal requirements;
- The safety issues and hazards (e.g., venting of toxic gases) associated with failure (e.g., thermal runaway) within the second-life application;
- The individual first and second-life usage to predict reliability and remaining useful life, already before expensive removal and tests from the EV;
- The construction of a stationary home storage device, taking into account the necessity of safety for validation purposes.
During the presented research activities, the development of a second-life stationary energy storage system for residential households equipped with a photovoltaic system is pursued, which can be realized by small and medium-sized enterprises (SME). Thereby, a combination of the above-mentioned challenges is taken into account. This enables an environmental benefit, not only by extending the battery life span and saving resources, but also in the event of failure. In comparison to alternative solutions for the reuse of traction batteries (e.g., BMW’s storage farm), the reuse of these batteries as home storage with a photovoltaic system presents a number of additional challenges and requirements in terms of safety and reliability, which must be addressed in order to expand the field of application. Over the course of a three-year project, five partners collaborated to achieve the following three main objectives:
- Development of a safety architecture and a safety concept;
- Development of a reliability model;
- Development of a solution realizable by SMEs for second-life energy storage systems.
The research has been divided into six steps, which are presented in Figure 1. In the presented paper, the realization of these process steps is described. Within Section 2, the used materials and methods are presented. The results of the individual process steps are then explained in Section 3. Besides that, occurred challenges are described. It should be noted that not all analyses conducted during this research study are presented in detail. The focus is on the final results of the whole project. The results of the project are discussed in Section 4. The paper concludes with a conclusion and an outlook in Section 5.

Figure 1.
Process steps of the approach.
2. Materials and Methods
Within the following section materials and methods are described. For ease of reference, this chapter is divided into four parts. In the first part, the regarded vehicles, batteries, and data sets are described. In the second part, battery fundamentals and measurement methods are presented. The following chapters are explicitly related to the corresponding process steps of the safety or reliability analysis.
2.1. Considered Electric Vehicles, Batteries and Data Sets
During the project, two electric vehicles, two battery types and different kinds of data sets were collected, analyzed and used for the different parts of the project. The materials available are described in the following subsections.
2.1.1. Electric Vehicles
Two Peugeot iOn EVs, manufactured by Peugeot (Vélizy-Villacoublay, France) in 2011, were procured to collect traction batteries aged under real field conditions. After approximately ten years of use, one of the EVs had a mileage of 18,000 km and the other had a mileage of 81,000 km. The traction battery in this type of vehicle, a Yuasa-LEV50 from GS Yuasa (Kyōto, Japan), consists of 88 prismatic cells connected in series. According to the data sheet, the accumulator had a nominal capacity of 50 Ah, a charging over voltage (COV) of 4.1 V and a discharging under voltage (CUV) of 2.7 V. After their first life in the vehicle, the batteries were removed from the vehicles and disassembled at the cell level.
2.1.2. Analyzed Batteries
Besides the Yuasa-LEV50 battery cells extracted from the Peugeot iOn vehicles, there were also prismatic cells of a different type available. These cells had been disposed and there was no knowledge of the reasons or the prehistory. Measurements indicated that these batteries had not been used before. These cells were therefore not suitable for all analysis and construction of a second-life prototype, but were suitable for the safety investigations. In Table 1, the specifications of the regarded batteries are presented.

Table 1.
Characteristics of the lithium-ion batteries used for the safety analysis.
2.1.3. Data Sets
Both battery test data and usage data were required for homogenization of the data structure and reliability analysis. After a closer look at several freely available data sets of lithium-ion battery test data presented in [20], the NASA battery data sets five and eleven were selected to be used for the reliability analysis [21]. Access to the usage data was difficult, as described in [22]. As usage data are personal data, there are some legal and privacy issues that need to be considered during the collection. Therefore, data were collected manually in several ways during the project. On the one hand, data from an Audi e-tron 2019 Sportback model (Audi AG, Auto-Union-Str. 1, 85057 Ingolstadt, Germany) were read out during a workshop. It contains information at a single point in time. On the other hand, time series data were collected from a Tesla Model X (Tesla, Inc., Austin, TX, USA). As described in [22], the data set is not continuous but includes approximately 160 h of charging and discharging. These time series data can be used to specify a use case during the first life of a traction battery. To characterize the second-life use case, a data set of a battery storage system in a private household was collected almost continuously every 1.5 s with only a few breaks over two and a half years. The household is equipped with two photovoltaic systems, a heat pump and a wall box [10].
2.2. Battery Fundamentals
Within the following chapter, some battery fundamentals and measurement methods are described, which are the base of operation and necessary to understand the presented study. This includes battery degradation in general and the determination of battery conditions based on laboratory measurements and prediction models implemented in the BMS.
2.2.1. Battery Degradation
Different aging phenomena cause battery degradation. The phenomena can be classified into calendar and cycle aging mechanisms, which can be detected by measuring an increase in the internal resistance or a capacity fade [23,24]. Therefore, battery degradation can be described by the capacity fading over the lifetime of the battery. The battery lifetime can be defined as the actual time span or the amount of equivalent full charge and discharge cycles [2]. In [25], the shape of the capacity fade curve was described by a square root function for calendar aging and a linear function for some part of the cycle aging. In [26], different fitting functions were tested and a relationship between the capacity fade and time t0.75 was found to be more valid for the calendar aging than a square root function. The most precise fitting function was found differently for different data sets, another example can be found in [27], but the general form of these functions is similar to each other. Besides that, in some studies accelerated aging has been observed before the final EOL of the battery at 0% remaining capacity and after reaching a specific degradation point (e.g., [18,28]). From the different results, a schematic degradation curve can be derived [29,30]. The expected schematic degradation curve assumed for a remaining useful life (RUL) prediction in this study is shown in Figure 2. The EOLsecond life is defined as the point just before accelerated aging is expected.
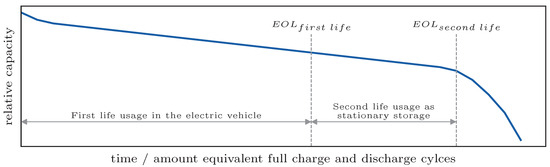
Figure 2.
Schematic capacity fade curve (own illustration based on [29,30]).
This schematic curve provides a starting point for the reliability analysis. The actual course of the degradation function of a single battery is individual, caused by product specification (e.g., materials used, design), manufacturing differences as well as individual usage behaviors [12,31,32]. Furthermore, a single data point such as the state of health (SOH) at the EOLfirst life does not contain information about the trend of the degradation. These influences lead to difficulties in predicting the RUL.
2.2.2. Battery Measurements
Three measurement methods are performed to characterize the batteries’ individual cells after the EOLfirst life, respectively.
Capacity Measurement and State of Health
The capacity of a battery is an indicator of the battery’s condition [33]. Capacity measurements are used to determine how many ampere-hours (Ah) can be drawn from the accumulator. Accordingly, the accumulator is discharged from the end-of-charge voltage to the end-of-discharge voltage under specific test conditions defined by the current and temperature [34]. During this process, the time t is measured and the actual capacity can be determined from the integral over time (Equation (1)).
In the case of the Yuasa-LEV50, the test current used was 25 A and the temperature was 25 °C. The relationship between the actual measured capacity and the capacity of a new cell , defined either by the initial capacity of the battery before usage or by the nominal capacity of this type of battery as documented in the data sheet, is referred to as the capacity state of health (SOHC, Equation (2)) [33]. Due to the fact that no information is available on the specific cells before usage, the nominal capacity was used to define the actual SOHC. The measurements were performed with the SM500-CP-90 from Delta-Elektronika (Vissersdijk 4, 4301 ND Zierikzee, The Netherlands) and the Albatros BMS (v.1.5) from BE-Power (Ruhberg 8, 35463 Fernwald, Germany).
Hybrid Pulse Power Characterization
The Hybrid Pulse Power Characterization (HPPC) is used to determine a current-dependent resistance (according to ΔU/I). The HPPC test were performed according to the ISO 12405-4 standard [35]. The battery was defined as a high energy storage device and tested with a maximum discharge pulse current of Idp,max = 90 A [35]; the corresponding profile is shown in Figure 3. The measurement was again performed with SM500-CP-90 from Delta-Elektronika and BMS from BE-Power (Albatros v.1.5).
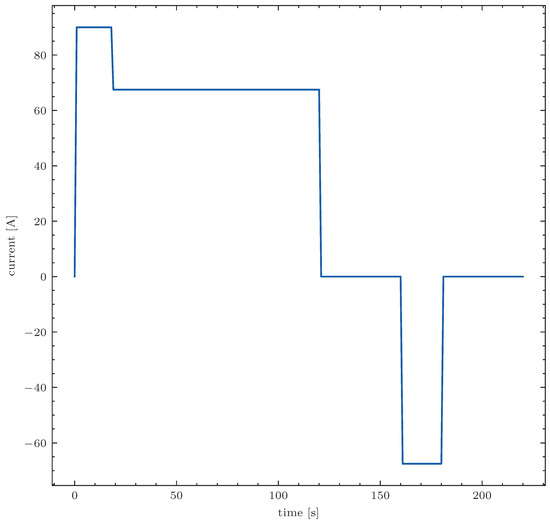
Figure 3.
HPPC test profile with a maximum discharge pulse current of Idp,max = 90 A (own illustration based on [35]).
Electrochemical Impedance Spectroscopy
The Electrochemical Impedance Spectroscopy (EIS) can be used to determine the frequency-dependent resistance of accumulators. In this method, an alternating voltage is applied to the accumulator and the current and phase are measured during this process. The measured values can be used to calculate an impedance. The calculation is based on a replacement circuit diagram of the accumulator. A frequency range is usually considered. For this purpose, the procedure is repeated with different frequencies. The measurement was carried out using the BTC1B+ device and associated software from BRS Messtechnik (Strohberg 23, 70180 Stuttgart, Germany). For the settings, 0.1 Hz to 1000 Hz and six measuring points per decade were used [36].
2.2.3. Condition Determination
The measurement methods presented are elaborate. Since the capacity of the battery depends on the measurement conditions and requires a full charge or discharge cycle of the battery, it is not possible to accurately measure it directly during everyday use of an EV. Therefore, the state of the battery in use is usually realized by predicting the SOHC. A prediction model is implemented within the BMS [4]. As mentioned above, the prediction is not trivial and different approaches such as data-based, adaptive or electrochemical approaches are used [37,38]. In this study, a data-based approach is pursued. The data-based approaches are used to describe and predict the state of the battery, focusing on the measured battery data during the usage phase.
2.3. Safety Analysis
According to Ren et al. [39], the most significant concern associated with the large-scale application of lithium-ion cells is the potential for thermal runaway. This phenomenon entails a self-accelerating exothermic decomposition reaction, whereby the cell experiences a rapid increase in temperature and releases various gases. These gases may possess both toxic and flammable properties, which can cause the Li-ion cell to ignite or even explode. The risk of thermal runaway is related not only to the chemical composition and structural design of the cell, but also to changes that occur as the cell ages or degrades (e.g., due to lithium plating). Given the inherent risk of thermal runaway in lithium-ion cells, the subsequent safety analysis addresses the potential health hazards posed to residents by the toxic gases that might be produced in the event of such an incident. With the aim of investigating the toxicity of the venting gases emitted during the thermal runaway of lithium-ion cells in order to estimate the hazard potential for residents and emergency services, an experimental apparatus was designed based on the work of Golubkov et al. [40]. The core element is a pressure vessel made of carbon steel (up to 40 bar pressure, 1.6 t of weight, 170 L of internal volume, manufactured by AVN GmbH (Heppenheimer Str. 18/20, 68623 Lampertheim, Germany), in which lithium-ion cells from traction batteries can be brought to thermal runaway by electrical (overcharging) stress. The gases emitted in this process are first collected and the amount of gas produced in each case is determined by the overpressure measured by the pressure sensor. The pressure vessel is equipped with two bellows slides which allow a controlled discharge of the collected venting gas into downstream collecting devices, but also purging with synthetic air or an inert gas (e.g., N2). Due to the strong temperature development during thermal runaway, the pressure vessel is additionally equipped with a stainless steel inner tube as heat protection. A stainless steel support plate, which is mounted around a rail construction for fixing a single lithium-ion cell, serves as a test location inside the vessel (Figure 4). The relevant specifications of the tested cells are given in Table 1.
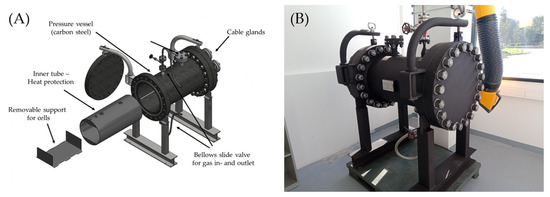
Figure 4.
Schematic 3D drawing of the carbon steel pressure vessel (40 bar pressure, 1.6 t weight) with the mounting and attachement elements (A) and pressure vessel on delivery (B).
After placing the cell in the pressure vessel, the power cables leading to the outside are connected to a laboratory power supply (EA PSI 9080-12 2U 19, Elektro-Automatik GmbH & Co. KG, Helmholtzstraße 31-37, 41747 Viersen, Germany) via ring terminals. A current of 122.41 A is then applied at variable voltage until thermal runaway occurs, resulting in an overpressure of (800–900) bar due to the generation of gases. The gases are passed through the outlet into two, successively connected impingers, each of them containing 500 mL of a 20 mM Na2CO3/NaHCO3 solution (Merck, Darmstadt, Germany; Carl Roth, Schoemperlenstraße 3-5, 76185 Karlsruhe, Germany). The carbonate buffer solution is used to collect hydrogen fluoride (HF), which can then be analyzed by ion chromatography (IC). As soon as atmospheric pressure is reached inside the vessel, the outlet valve is closed and air is pumped into the vessel via the inlet valve with the aid of an air compressor, which is then also passed over the downstream impingers. This rinsing process, during which the vessel is filled with (2–4) bar of air, is carried out three times per test. During the experiments, the pressure (Model 225, Setra Systems, Boxborough, MA, USA) and temperature (Type K thermocouples) inside the vessel are recorded.
Ion chromatographic analyses of aqueous samples are performed on a Dionex ICS-200 System from Thermo Fisher Scientific (Waltham, MA, USA) with a conductivity detector (DS6, 35 °C). Measurements are performed with an injection volume of 25 μL at a column temperature of 30 °C using an IONPac AS23 anion separation column, an AERS 500 suppressor (SRS, 25 mA, 4 mm), and an aqueous solution of sodium bicarbonate/sodium carbonate buffer (0.8 mM/4.5 mM) as eluent (1 mL min−1).
2.4. Reliability Analysis
The objective is to optimize the utilization of the battery, extending its lifespan as far as is safely and reliably possible. Therefore, the reliability analysis is particularly important. In the reliability assessment, the RUL of the battery is supposed to be determined based on the individual-specific use case. To achieve this, various machine learning algorithms and data fitting techniques are employed.
2.4.1. Machine Learning
Machine learning (ML) is a subfield of artificial intelligence. The application of ML enables the prediction of unknown events. Based on training data, algorithms are used to learn the interrelationships between input data and target values or patterns that can be found in the data. The interrelationships are stored in a model which can be used to make predictions for new input data [41,42]. The general process is visualized in Figure 5.
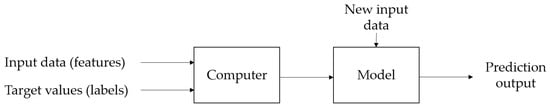
Figure 5.
Concept of machine learning model building (own illustration based on [42], p. 5).
In this study, algorithms of supervised learning (e.g., random forest, support vector machines), when a target value is known, as well as methods of unsupervised learning (e.g., cluster algorithms) to find patterns in the data, are employed. A combination of different ML algorithms has been applied to find solutions for the classification and regression issues that arise during the reliability assessment.
2.4.2. Data Fitting
The process of data fitting allows for the modeling of functional relations between values and the smoothing of available data points. A linear function represents the simplest case to model; however, it does not always provide an accurate representation of the regarded fitting problem. To adjust a chosen function to the considered data, the fitting parameters need to be parameterized. A variety of methods can be used for this quantification. The most common is the least-squares. Therefore, the sum of the quadratic residuals (Equation (3)) is supposed to be minimized [43,44]. In order to solve the optimization problem, the curve fit function of SciPy, which is based on non-linear least squares algorithms, was used [45].
3. Results
In the following chapter, the results of the individual project parts are presented in the order visualized in Figure 1. The chapter begins with the battery inspection concept. However, the research team encountered certain challenges during the procurement process for the batteries that are to mention. Despite the statistic that the market shares of electric and hybrid vehicles continue to grow [46,47], which results in a continuously increasing amount of used batteries with a time shift corresponding to the lifetime of the batteries in the vehicle, it proved challenging to procure used batteries. No automotive manufacturer could be found to cooperate and provide batteries for the presented investigations. Consequently, two electric vehicles were purchased and deconstructed in order to obtain the traction batteries (cf. Section 2.1.1). Given that the vehicles had been in use for approximately ten years, it was not possible to obtain a new battery or cells of the same type for comparison. Nevertheless, the researchers were able to initiate the project, recognizing the significance of addressing these challenges when planning any second-life project, particularly in the context of EV-manufacturer-independent serial production.
3.1. Battery Inspection Concept
The first objective of the project was to develop an inspection concept for the categorization of used batteries removed from EVs. The main focus is on the suitability of the battery, respectively, battery cells for a second-life application, in particular stationary storage. In addition, the investigation of batteries aged in real use in an EV was considered as a verification of the theoretical considerations, which are mainly based on battery test data, since only a relatively small amount of measurement data is published after the first service life.
The traction batteries were removed from the vehicles and disassembled into individual modules. The battery consists of twelve modules connected in series. Ten of the modules consist of eight cells connected in series (8S1P), and two of them (modules six and twelve) consist of four cells connected in series (4S1P). The modules were first fully charged to the final charge voltage (4.1 V for each cell). During this process, the internal resistance of each cell was determined with the EIS method (cf. Section 2.2.2). In Figure 6, the EIS measurement results for all eight cells of module one from the vehicle with a mileage of 81,000 km are shown to be exemplary. For each accumulator, 24 measured values were recorded at different frequencies. Each measurement is marked with a dot. To make it easier for the reader to assign the measurements to the respective accumulators, the dots are connected by lines. The values at the bottom left of the figure (with a negative imaginary frequency-dependent resistance of approx. 1.25 Im [mΩ]) were measured at a frequency of 1000 Hz. The values at the top right of the figure (with a frequency-dependent ohmic resistance of approx. 2 Re [mΩ]) were measured at a frequency of 0.1 Hz. The other measured values were recorded at a frequency between 0.15 Hz and 500 Hz. The figure shows, that the ohmic resistance of cell 2 deviates by approx. 0.05 mΩfrom the other seven accumulators.
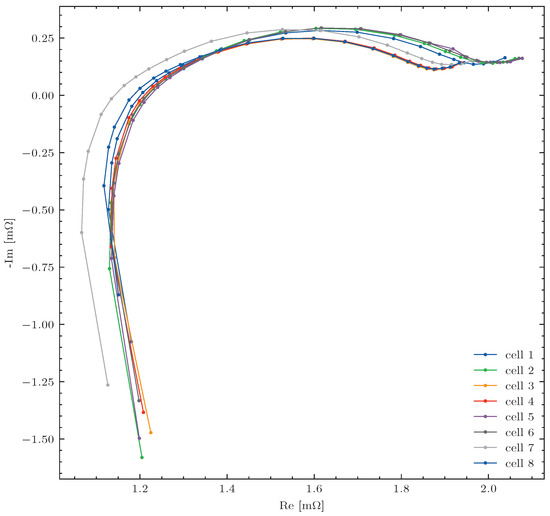
Figure 6.
Nyquist plot for the results of the EIS measurements for each cell of module one of the EV with 81,000 km mileage.
A capacity test at 25 A (0.5 C) was then carried out individually on all the eight cell modules, with the four cell modules connected in series. The results can be found in Table 2. The module voltage was monitored by the BE-Power BMS mentioned above and the test was terminated when the voltage fell below the CUV limit. The discharge capacity was recorded using the SM500-CP-90 laboratory instrument mentioned above.
Table 2.
Measurement results of the capacity test on the individual modules with 0.5 C. Modules six and twelve consisted of four cells and were connected in series (8S) for the measurement.
As mentioned above, the HPPC test was carried out according to the ISO 12405-4 standard on three sample modules (one, three and eight). The cell voltages resulting from the test current for one module (five) of the EV with a mileage of 18,000 km, as well as the test current, are shown in Figure 7. The measured values were recorded at a frequency of 10 Hz. The current is specified by the ISO 12405-4 standard. Whenever the current changes from 0 A to −90 A, a rapid change in the cell voltages of approx. 100 mV can be seen. This occurs within the first two seconds after the current has changed to −90 A. An internal resistance value can be calculated for each accumulator from the ratio between the voltage and current change. The ISO standard defines the calculation times. As soon as a voltage of less than 2.7 V is measured on a battery, the BMS switches off. As a result, the current specified by the standard can no longer be maintained and the test is considered complete.
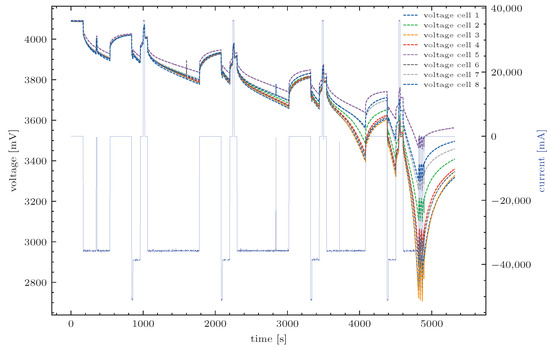
Figure 7.
Voltage and current over time during the HPPC measurement of module five of the EV with a mileage of 18,000 km.
Performing all three measurement methods allows an analysis of redundant information in the measurement methods. Since the aim is to develop a battery inspection concept that is as precise, quick and inexpensive as possible, a definition of relevant and redundant test information is required. Therefore, the results obtained with the different test procedures were compared. First, a Pearson correlation analysis was performed and a strong correlation was found between the different test results. The Pearson coefficient between the measured capacity and the EIS results, as well as between the measured capacity and the HPPC results has an absolute value of more than 0.8. Thus, it is possible to define evaluation criteria for the EIS and the HPPC method and the SOH can be predicted with sufficient accuracy for both methods.
The measurement methods were generally evaluated and compared with each other. The results of the evaluation can be found in Table 3. The weighting factor g is defined for the rating of the importance for each requirement, and the evaluation coefficient n is used for the assessment of the measurement in each category. The range from one to nine defines the rating scale of the evaluation coefficient. A high number represents a positive evaluation. The sum of the products of the weighting factor g and the evaluation coefficient n is used to rank the three methods. The low energy and time consumption of the EIS method leads to the highest score in the evaluation matrix and thus to the first rank.
Table 3.
Evaluation of the three measurement methods. The weighting factor g is used for rating the importance of each requirement. The evaluation coefficient n is used for the assessment of the measurement in each category. The sum of the products of weighting factor g and evaluation coefficient n represents an evaluation metric that is used to build the ranks of the three methods.
It was assumed that the test runs did not have a significant effect on the aging of the batteries, as all three measurement methods were carried out within a short period of time and the test load was low in relation to the load in the field.
3.2. Logistic Model
Another part of the research project was the development of a logistical concept for the safe transport of traction batteries after their first use in EVs has ended. The availability of traction batteries suitable for secondary use can be geographically ubiquitous, and the locations of use between the first- and second-use concepts can vary greatly. To ensure that traction batteries can be used where they are needed, safe and proper transport of these batteries is required by law.
Lithium-ion batteries pose an increased risk of fire if mishandled or damaged. For this reason, they are classified as dangerous goods and fall within the scope of the European Agreement concerning the International Carriage of Dangerous Goods by Road (ADR, frenc: Accord européen relatif au transport international des marchandises Dangereuses par Route), which is anchored in the Dangerous Goods Ordinance Road, Rail, Inland Navigation (GGVSEB) [48]. The title of the Agreement was amended by the Protocol amending the title of the ADR, which was adopted by the Conference of the Parties to the Agreement on 13 May 2019 and entered into force on 1 January 2021. Since that date, the ‘European Agreement concerning the International Carriage of Dangerous Goods by Road’ (ADR) has become the ‘Agreement concerning the International Carriage of Dangerous Goods by Road’ [49].
This means that the various regulations for the transport of dangerous goods apply to lithium-ion batteries. In particular, defective lithium-ion batteries pose a major safety risk. In addition to the various safety regulations, special packaging approved by the competent authority must be used for transport, storage, and disposal. Moreover, according to the dangerous goods regulations, lithium-ion batteries must comply with the criteria of the UN Manual of Tests and Criteria [50], Section 38.3.5 (UN 38.3 Transport Test) to ensure the safety during transport. This test is intended to simulate the conditions that lithium batteries may be exposed to during transport, such as pressure and temperature variations, and mechanical or physical damage such as crushing or dropping. The test requirements vary for lithium-ion batteries, for example, depending on weight and energy content.
Every two years, the legal provisions are adapted to the current state of technology and the current risks in the transport of dangerous goods. This report is focused on the topic of road transport. On 1 January 2021, such an amendment came into force with the ADR 2021. For the German area of application, the amendments are published as the 28th ADR Amendment Ordinance [49]. As a general transitional period the application of ADR 2021 is permitted until 30 June 2023. This means that the application of the ADR 2023 will be mandatory from 1 July 2023 at the latest.
On their way to a second use, used batteries that are declared as waste must also comply with various legal requirements set out in the Waste Management Act (KrWG) [51]. The requirements to be met apply not only to batteries, but also to the person handling the batteries, the vehicle in which the batteries are transported, the packaging in which the batteries are packed and the place where the batteries are to be stored, either temporarily or permanently.
To illustrate the processes and procedures for the transport of lithium-ion battery systems, modules or cells according to ADR 2021, a process model in the form of a flowchart has been developed and is shown in Figure 8. All legal requirements applicable to lithium-ion batteries suitable for secondary use and lithium-ion batteries requiring disposal have been carefully considered. Every detail of the model and the steps are outlined and documented separately.
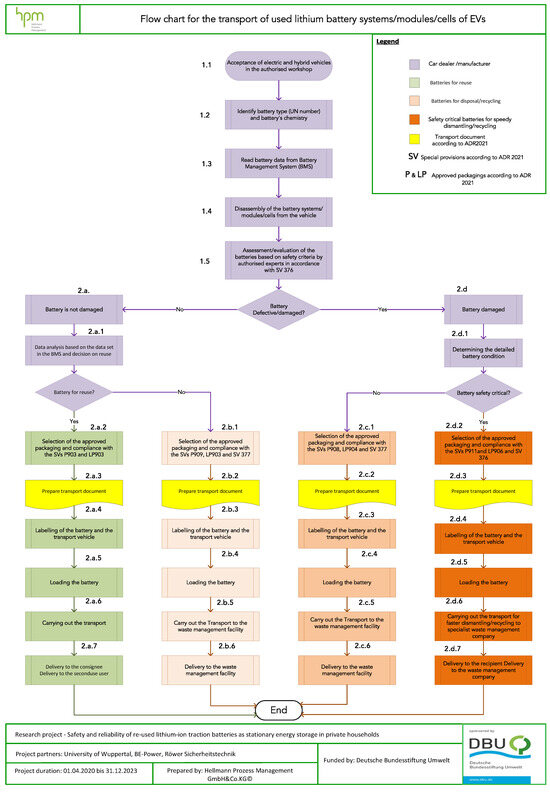
Figure 8.
Transportation process for used lithium-ion battery systems according to ADR 2021.
3.3. Homogenization of the Data Structure
As battery and EV data come in different types, formats and with specific structures, homogenization of the data is important for a harmonized process. Therefore, a database was set up in which the data of various models of electric vehicles are collected and selectively stored for the intended analysis. The main purpose of the database is to bundle the collected data of the different vehicles in a uniform structure and offers the possibility to enter further operational data.
Obtaining data for the intended database from used batteries that have spent their first life in a vehicle (from the beginning to the end of the first life) was very challenging and not possible, either from vehicle manufacturers, owners, or workshops. Currently, the exchange of such data between manufacturers, distributors, and end-users is not regulated by law in Germany, and the transparency and availability of comprehensive data sets is a major challenge for scientific research. Due to the lack of data availability for this project, the project partners provided their own vehicles to collect the necessary data. In addition, two used Peugeot vehicles were purchased for the project in order to disassemble their battery packs, carry out the necessary tests and, based on the test results, select the suitable battery cells for secondary use to be installed in the intended prototype system.
The data from the electric vehicles were collected as records and stored in a database in a simple data structure (Excel spreadsheet). The reason for choosing a database with a simple data structure is that it provides an interface for merging and harmonizing the data. The data were collected from three different vehicles in three different approaches, in different formats and not in the same type of collection processes as described in Section 2.1.3. Due to the highly varying recording times and the unequal size of the data collected from each vehicle, it was a major challenge to integrate the collected data into a single data set in order to compare and analyze them. Therefore, the database offers the possibility to store the most important information for the evaluation of the battery SOH, which can be recorded during measurements. The stored information includes for example the charge and discharge current, cell voltage, temperature fluctuations, SOC (state of charge), DOD (depth of discharge), impedance, remaining range, operating time and other health metrics.
3.4. Safety Analysis
To ensure safety, two types of analysis were carried out, and the results are presented in the following chapter. Firstly, the results for thermal runaway due to overcharging are presented. Then the hydrogen fluoride concentration is determined.
3.4.1. Results on Thermal Runaway due to Overcharging
Overcharging the cells leads to initial reactions after about 20 min. Noises can be heard from inside the vessel which, in conjunction with a pressure increase of about 50 mbar, indicate a first venting event. At the same time, the voltage displayed on the laboratory power supply drops from 5.80 V (710 W) to 0.95 V (116 W) and rises again to 1.45 V (117 W) over the following ten minutes before subsequently becoming constant. After a total of 30 min of testing, another banging noise occurs inside the vessel, followed by a pressure increase of around 5 bar and a temperature jump to around 500 °C. The overpressure then settles at around (800–900) bar and the temperature drops.
With the aid of the ideal gas law, the respective material quantities of the released gases can be calculated from the pressure differences and the associated temperatures in combination with the internal volume of the pressure vessel (170 L). These can then be converted into a gas volume at room temperature (25 °C) and atmospheric pressure (1013.25 hPa). With the approximation that the gases produced actually exhibit ideal behavior, an average of (5.36 ± 0.54) mol of venting gas was emitted during thermal runaway from the NMC cells and (5.65 ± 0.38) mol of the LMO cells. The results are presented in Table 4 and Table 5.
Table 4.
Measured pressures (as difference between start and end pressures) as well as temperatures (end temperature at pressure reading) after thermal runaway of NMC cells and the calculated material quantities and gas volumes (at room temperature and atmospheric pressure) of the emitted venting gases.
Table 5.
Measured pressures (as difference between start and end pressures) as well as temperatures (end temperature at pressure reading) after thermal runaway of LMO cells and the calculated material quantities and gas volumes (at room temperature and atmospheric pressure) of the emitted venting gases.
A striking feature of both cell chemistries is a rapid temperature increase in the cell housing within a few seconds, reflecting the thermal runaway. However, even before this event, a steady temperature increase can be observed, which often forms a plateau shortly before the actual passage, indicating a premature venting of gas and thus a reduction in the reaction rate. This is confirmed by a simultaneous pressure increase of about 50 mbar. Comparing the two cell types, it is noticeable that the wall of the pressure vessel rises up to 178.2 °C in the case of the NMC cells, while a maximum of 48.2 °C is reached in the case of the LMO cells. The maximum temperature reached by the cell housing of the NMC cell is 448.39 °C, which is significantly higher than the maximum temperature of 345.58 °C reached by the LMO cell. This indicates that the temperature and possibly also flame propagation is significantly greater for the NMC cells than for the LMO cells. It can be concluded that the thermal runaway of the NMC cells is associated with higher energy releases. In a module comprising eight (8S1P) or four (4S1P) of these cells connected in series, or in the prototype developed with up to 14 cells in series, temperature developments may vary depending on the position of the cell in question due to heat transfer between the cells and a potential cooling system. However, this has not been tested as part of the project. When examining a single cell, the subsequent decrease in temperature is slow in the case of the cell housing, while the container wall immediately drops back near to initial temperature. The temperature profiles during thermal runaway for NMC and LMO cells are shown in Figure 9.
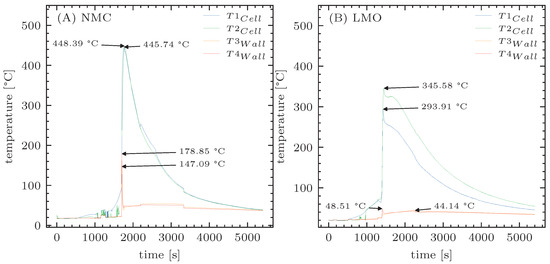
Figure 9.
Temperature profile during thermal runaway of lithium-ion cells in a pressure vessel. (A) NMC cells and (B) LMO cells. T1 and T2 temperature at cell housing and T3 and T4 temperature at the outer wall of the pressure vessel.
3.4.2. Determination of the Hydrogen Fluoride Concentration
The measured fluoride contents (amount of substance in 500 mL carbonate buffer solution) for three tests carried out in an analogous manner and converted into corresponding hydrogen fluoride volumes for the NMC and LMO cells are listed in Table 6 and Table 7.
Table 6.
Fluoride contents determined by IC after thermal runaway of NMC cells in the carbonate buffer solution of two impingers, conversion to the volume of hydrogen fluoride formed, and the carryover between the downstream impingers (α = Impinger 1/Impinger 2).
Table 7.
Fluoride contents determined by IC after thermal runaway of LMO cells in the carbonate buffer solution of two impingers, conversion to the volume of hydrogen fluoride formed, and the carryover between the downstream impingers (α = Impinger 1/Impinger 2).
Although hydrogen fluoride has unlimited water solubility [52], the fluoride concentrations measured in the second impinger show that complete uptake does not occur in the first impinger and that a certain portion breaks through. It can be assumed that some fraction of the HF in the second impinger is also carried over into a theoretical third impinger, then to a fourth and so on. Consequently, the total concentration c0 is calculated from the sum of all possible n impingers (Equation (4)). The concentration ratio of two successive impingers is assumed to be constant and defined as the carryover ratio α, which gives the concentration in an impinger as the product of the concentration of the previous one and the carryover (Equation (5)). Thus, using a geometric series (Equation (6)), it is possible to calculate a theoretical total concentration (Equation (7)) and a collection efficiency CE (Equation (8)), which are listed for the average values in Table 8.
Table 8.
Calculated total concentrations (c0) and collection efficiencies.
With a collection efficiency of 58% and 59%, the thermal runaway of the cells studied here would consequently release an average of 1.7 ± 0.1 mL (NMC) and 17.6 ± 0.4 mL (LMO) of hydrogen fluoride gas (0.01 mg/Wh NMC); (0.1 mg/Wh LMO) would be released.
3.5. Reliability Analysis
The aim of the presented reliability analysis was to develop an opportunity to assess the reliability of a battery for a specific second-life application based on non-continuous time series data collected during the first life of the batteries within the vehicle so that a prediction for the RUL and the reliability in the pursued second-life application can be performed based on the usage patterns and before costly and time-consuming battery tests have already been carried out.
Within this study, a concept for a holistic reliability concept has been developed. It is based on the results of different data analyses and a comprehensive literature review. Some underlying analysis results have been published previously in [10,22]. An overview of the developed concept procedure is shown in Figure 10. The realization of the concept is divided into nine process steps. The individual work packages are currently being implemented, optimized and validated.
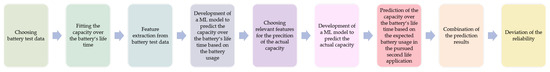
Figure 10.
Concept of procedure for the realization of a holistic reliability assessment which implements the individual usage patterns in the first life and the predicted usage in the pursued second-life application.
3.5.1. Choice and Fitting of Test Data
Since capacity can only be accurately measured in a laboratory environment, laboratory test data should be used. Thereby, a large amount of data should be considered. The degradation of the batteries depends on the cell type and the used materials, but there are some parallels. Besides that, the actual degradation also depends on the usage behavior. To enlarge the database and generalize the reliability model in the end, a combination of different data sets is pursued. Normalization and standardization techniques should be considered, to create a comparability. In addition, failures and outliers in the recorded data should be removed for the fitting process. To further enlarge the size of the data sets, data augmentation techniques are regarded.
The capacity in dependence on the battery’s lifetime is pursued to be described by a mathematical function. For the choice of the function, the following criteria are considered:
- The function should be the best fit for all the available samples;
- It should represent the schematically assumed degradation trend (cf. Section 2.2.1);
- The function should be as simple as possible, with the least amount of fitting parameters.
To ensure the first bullet, the data fitting can be performed with different fitting functions and the results can be evaluated. Therefore, an evaluation metric needs to be chosen. In this study, a minimization of the mean absolute error (MAE; Equation (9)) and the mean squared error (MSE; Equation (10)), respectively, and the root mean squared error (RMSE; Equation (11)) are pursued. The characteristic values are calculated for each battery sample in the data set. In the calculation, is the measured value, and represents the predicted value at time step i. The variable n represents the amount of reference measurements in this battery sample. The suitability of the fitting function for all samples is performed by considering the distribution and statistical characteristics (mean, median, standard deviation, maximum, minimum, quantile) of the evaluation metrics.
Since the EOLsecond life in this study is defined as just before the onset of accelerated aging, the chosen function has to be able to assume the described shape and has as few fitting parameters as possible. An example of a fitted capacity curve without any data preprocessing of a battery cell from the NASA test data set 11 (RW 11) [21] is shown in Figure 11. The fitting function is a third-degree polynomial.
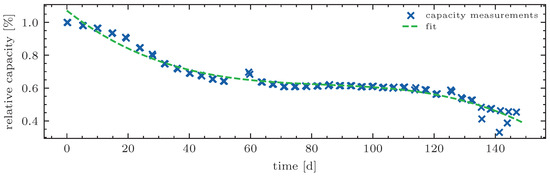
Figure 11.
Capacity data measured over the lifetime of one battery cell (RW 11) from the NASA battery test data set 11 [21] and the fitted degradation curve with a cubic function.
3.5.2. Prediction of the Capacity Curve
As presented in [10], based on a data set of an EV and a stationary energy storage, it was possible to quantify differences in the usage patterns between these two applications. Therefore, 770 different features were extracted from the battery power signal and 40 features were identified as being particularly relevant for differentiating between these two applications. Based on the features extracted from the available data, an accuracy of over 99% was achieved using a random forest algorithm. This information is supposed to be used for the prediction of the usage-dependent capacity curve over the lifetime of the battery. These 40 features should be extracted from the battery power signal of the battery test data and used to train the ML model. A complete list of the 40 features can be found in Table 9. The features were extracted with the Python package tsfresh (v.0.19.0) [53]. See the package documentation for further information.
Table 9.
Features found as relevant for the differentiation of the two use cases: battery in an EV, battery as a stationary storage system in a private household with a photovoltaic system based on the results presented in [10].
For this usage-based ML model, the 40 features extracted from the battery power are supposed to be used to predict the fitting parameters of the curve fit described before. Later on, this model should be used to predict the capacity over the life span of the battery for the battery in the vehicle based on the usage patterns. For the realization, different ML algorithms have been considered, for example a random forest regressor and a neural network. These algorithms allow a prediction of multiple target variables at the same time. Besides that, a support vector machine was also taken into account for the regression. In this case, a chained multioutput model construction is required to predict more than one parameter and has the advantage of being suitable for small data sets. At this point, most investigation has been made on a neural network, which has been parameterized on a sample data set and was found to be suitable for this task.
3.5.3. Prediction of the Actual Capacity
For the prediction of the capacity, an ML model is supposed to be used as well. Many studies are made to predict the capacity based on ML models and can be found in the literature (e.g., [38,54]). During this project, some investigations were made to predict the capacity with ML based on field data of an EV. On top of that, these findings were used to build models for the capacity prediction with the NASA test data set. The main results of the literature review and the self-executed analysis can be concluded as follows:
- During the usage, the charge cycle characteristic is more comparable to test data than the discharge cycle, and the battery is usually not cycled from 100% to 0%; therefore, Coulomb counting is not possible. Comparability can be achieved by considering the voltage intervals instead of the whole cycle [55].
- The discharge cycle is different for each usage. Therefore, the charge and discharge cycles should be separated for the prediction [22].
- Features should be extracted from the three signals: battery current, battery voltage and temperature to obtain precise results.
For a model that is adaptable to real driving data, these findings should be considered.
3.5.4. Estimation of the Degradation in the Second Life Application
For the degradation model over the whole life of the battery taking into account the different applications, the model described in Section 3.5.2 is supposed to be used to predict the capacity fade for the battery with the expected second-life usage patterns. These usage patterns are assumptions and the use of energy storage in a private household may be seasonal. Therefore, the assumptions should be made in ranges and the prediction should be performed for these ranges. The predicted actual capacity is then used to merge the predicted capacity in the first-life application with the estimated curve share for the second-life application. A schematic example is shown in Figure 12. Since the EOLsecond life is assumed to be right before the accelerated aging starts, this point in time can be determined from these results.
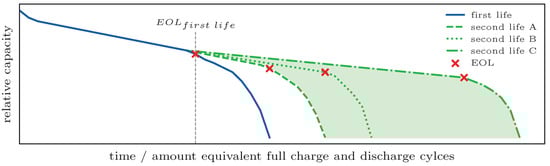
Figure 12.
Schematic results of the concept presented. The estimated first-life degradation is shown in blue. Green represents the area of predicted degradation curves based on different use cases. Scenario A represents the most ambitious regarded use case and C the least ambitious. Scenario B shows the prediction with average usage. The EOL right before the accelerated aging is marked in red.
3.5.5. Reliability Estimation
Based on these results, a reliability model can be used to calculate the failure probability at different time steps. Therefore, it is planned to use the Weibull distribution. The failure points from the predicted degradation curve share are supposed to be used to determine the location and shape parameters.
3.6. Development of the Energy Storage System
Based on the results, a stationary storage unit from the accumulators, which were found to be suitable for a repurpose application, was supposed to be built and tested within the application. The battery constructed from the cells of the electric vehicle was designed to be connected to the SPH4000 DC/AC inverter by Grotwatt (Hangcheng Blvd, Bao’an District, Shenzhen, China). For this purpose, the voltage limits of the inverter (discharging 42 V and charging 59 V) had to be observed. Since each accumulator operates in a voltage range from 2.7 V to 4.1 V (according to the data sheet), a configuration of 14 serially connected cells (14S) was chosen. Within this voltage range, the energy density of the battery is most effectively utilized. A full charge () of the battery is possible. Discharging can be performed down to 42 V, which corresponds to 3 V for each battery cell (), leaving only a few percent of the total capacity unused (SOC at 3 V < 5%). The power output of the prototype was designed to ensure that the maximum work current of the inverter of 66 A is not limited by the prototype. As an accumulator can carry this current in both charge and discharge directions, there is no need for a parallel interconnection. The energy storage system should be easy to install in a housing. Therefore, the weight should be as low as possible and should fit through a common door (width > 600 mm). For this purpose, a stainless steel battery case was made.
The selection of battery cells for the prototype is important. Of the 48 cells that were subjected to all three tests (HPPC, EIS and capacity test), the 14 cells with the lowest ohmic resistance at 1000 Hz were selected. The BMS (Albatros v.1.5) was used for monitoring, shutdown and storing the measurement data. In Figure 13, the inside of the prototype with an open box and the outside with a closed box is shown. In addition, a second prototype is currently being built.
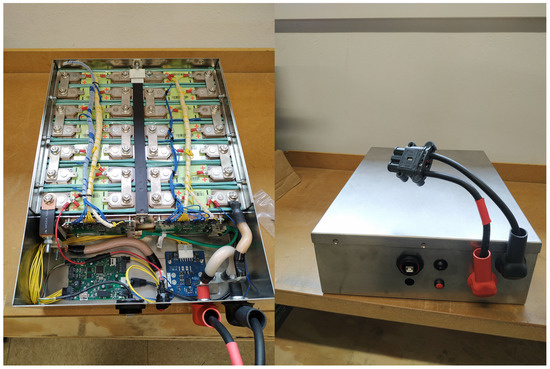
Figure 13.
Picture of the prototype with an open box on the left and with a closed box on the right sight.
3.7. Prototype
The prototype was installed inside the building of the company Röwer, which is equipped with a photovoltaic system. The technical and safety feasibility has therefore been achieved. The battery is stored inside a battery storage cabinet specially designed for lithium-ion batteries. It provides a fire resistance of 90 min and a liquid-tight bottom tray and meets the requirements of the DIN EN 14470-1 [56]. In addition, the cabinet is connected to the company’s safety system. Smoke and thermal development are immediately reported to the emergency call center. An inverter was chosen to connect the battery to a photovoltaic installation with 24 modules. The battery is charged exclusively by the PV system. For discharging, the prototype is connected to the domestic grid. Meanwhile, the prototype is installed in 2022 and saves all measurement data on an SD card with a logging frequency of 1 Hz. The battery storage cabinet and the installation of the prototype inside it are shown in Figure 14.

Figure 14.
Battery storage cabinet and prototype installation at the company Röwer.
A second prototype is currently being installed. The cabinets provide enough room for a second installation. The company has also installed a new photovoltaic system with 24 modules, but with a higher performance. The used inverter used will be similar to that of the first prototype. The second prototype will represent a different application scenario. The storage system will be used for charging stations for electric vehicles or bicycles.
4. Discussion
Within the framework of the research presented, the holistic process of the construction of a second-life home storage system is considered, starting with the supply of traction batteries. Although there is a high amount of traction batteries that will need to be recycled in the upcoming years, it has been found that it is rather difficult to receive and analyze those batteries. In addition, there is a need for a safe possibility to transport the battery once it is removed from the vehicle. There are no valid standards that allow a simple data-logging process, so each vehicle type needs to be considered separately. Battery information about the chemical composition, number, and order of cells is not available. Besides that, knowledge about the reaction of the battery in case of a fire emergency is not accessible. These circumstances greatly complicate the preparation for a second use. Therefore, the battery and its data availability must be ensured for this type of project. The eEOL-pass proposed in the EOL-IS project [19] is a reasonable solution for some information availability. Besides that, further investigations are needed with special regard to the battery availability, for example by implementing a general control or check after the first life for the suitability of a second life. A logistic concept has been developed to ensure the safe transport of used batteries in compliance with all relevant legal regulations. Lithium-ion batteries are categorized as hazardous waste due to the harmful substances they contain. According to the German Waste Management Act, products classified as hazardous waste must bear the correct waste catalogue number (AVV), which identifies the hazardous nature of the product, when transported in accordance with the European Waste Catalogue Regulation. At present, it appears that an AVV for lithium-ion batteries has not yet been defined. This is a loophole in the current regulation, and we expect legislators to pass a new regulation that includes lithium-ion batteries. As mentioned above, obtaining battery data has been a major challenge within the project, as battery manufacturers are not yet legally obliged to make their battery data available to third parties. Furthermore, due to this legislative loophole, there is no standardized data collection system for all battery types. A further challenge was to bring the data collected in this research project into a standardized and coherent form. The EU Battery Regulation, which was drafted in December 2020 and negotiated several more times, came into force on 17 August 2023 and stipulates that manufacturers must meet several requirements. According to the EU Battery Regulation 2023/1542 of the European Parliament and of the Council, lithium-ion batteries for electric vehicles have their own classification. Manufacturers of such batteries must, among other things, create a battery passport to record the key details and history of the battery. The battery passport data can be made available to battery owners, distributors, owners of recycling facilities, re-users or any other economic operator.
Three different measurement methods have been presented and compared to characterize the state of health after the first usage phase. All of them can give a prediction of the current state, but neither of the usage patterns nor the time-dependent degradation. The EIS test was found to fulfill most of the requirements and a correlation between the test results was found. The tested batteries had an SOH of 60–80%. The average deviation between the capacity measured by capacity measurement (Section 2.2.2) and the capacity calculated from the measurement data of the other two test methods (Section 2.2.2) was only 0.7 Ah (2%). A correlation of the measured data was assumed before the tests were carried out. The expectations regarding the correlation were exceeded as a larger deviation was assumed. The strong correlation makes it possible to define evaluation criteria with all three tests. For example, the manufacturer could define an SOH limit for the reuse of the batteries in stationary storage systems. The EIS test has its strengths in the fast, energy-saving and cost-effective evaluation of batteries. With a proper evaluation criterion, the test is ideally suited for the pre-sorting of batteries coming out of first life. In a final quality test of the finished stationary energy storage system, the capacity test is still justified due to its precise SOH determination.
The safety of the cells was considered by looking more closely at the process of overcharging resulting in a thermal runaway of the cells. In addition, the concentration of hydrogen fluoride (HF) released during this process was investigated. The concentration values determined by ion chromatography for the release of hydrogen fluoride gas of 0.01 mg/Wh for NMC and 0.1 mg/Wh for LMO cells were significantly below the HF releases of 23 and 6 mg/Wh for lithium-ion cells with NMC/LMO cathode published by Sturk et al. [57]. It is possible that a large part of the released gaseous hydrogen fluoride released will react and bind to the surfaces of the pressure vessel as well as to the residues of the lithium-ion cell. For this reason, the battery residue should be analyzed in a downstream step to determine fluorine-containing compounds (e.g., organofluorine compounds or heavy metal fluorides). Furthermore, during the experiments it was found that the buffer solution (20 mM Na2CO3/NaHCO3) [58] has an insufficient capacity to completely absorb the entire amount of HF. Therefore, a mathematical procedure was used to estimate the actual HF concentration released. However, even though the determined concentration values of hydrogen fluoride per cell or per Wh were relatively low, it should be kept in mind that an actual home energy storage system does not consist of a single cell, but of modules of several lithium-ion cells. For example, the prototype consists of fourteen cells (LMO, 125.7 Wh per cell), giving a total of 1759.8 Wh, resulting in a potential release of hydrogen fluoride gas of 202 mg. An assumed HF volume of 247 mL for fourteen cells and a total gas volume of 1934 L results in an HF quantity of 128 ppmv. These values clearly show that non-negligible amounts of hydrogen fluoride gas are released during the TR of the lithium-ion battery system. This must be taken into account when evaluating the potential hazards and what safety precautions can be taken to mitigate these hazards, especially when using batteries in a second life as the risk of thermal runaway may increase with aged batteries [59,60,61].
A reliability concept has been presented to perform a reliability assessment based on non-continuous time series data collected during the first life usage. The presented reliability assessment concept represents a possibility of predicting the failure probability of a used battery in a specific second-life application, before the battery has been removed from the vehicle. At this point, the process steps have been individually tested and developed on a small amount of data and the implementation is still in progress. The assessment is designed to be extended to more battery types and battery data. Until today, no battery test data representing the two considered use cases and the change in use scenario at EOLfirst life are available to validate the developed concept, so the validity of the concept still needs to be determined, but the reliability prediction from the presented assessment could provide a first estimation of whether the battery could be suitable for a second-life usage even before the removal from the EV and costly and time-consuming tests.
The prototype has been built and a safety concept has been developed. Long-term reliability and safety can be analyzed in the future on the basis of data collected during the current operation. The durability of the prototype cannot be predicted at this stage. Initial estimates can be made once the data has been evaluated. More precise assessments can only be made after a certain number of cycles and years. All in all, the prototype constructed within this project is built from a single battery type. Another cell type has been considered in the safety assessment, and data from different cell types has been used to build the reliability concept. It is necessary to validate the information with other battery types and cells in order to generalize the findings, but also to define specific characteristics that need to be considered and how these can be implemented. For example, screwed cells might be easier to disassemble than laser-welded cells. Besides that, depending on the battery configuration, different levels of disassembly and correspondingly different reassembly strategies might be required.
5. Conclusions
As the reuse of a battery has an important impact on the sustainability and the efficient use of resources, it should be considered after the first life of the battery in the vehicle. The presented research gives a holistic overview of the process of building a second-life prototype. This requires research in several areas. Challenges and most important findings that occurred during the construction of a second-life prototype are presented. Besides that, a second-life prototype with a safety concept has been installed within the project activities. It provides the possibility to select data and validate the second-life usage of a traction battery in a private household. The data will be collected and can be used for further investigations regarding the second-life usage. Furthermore, continuative analysis with different batteries, cell types, deconstruction levels and data sets is needed to establish a standardized process for the reuse of traction batteries. In addition to the establishment of a standardized reuse process, future studies should investigate the potential of a second-life application compared to the prevailing recycling process, taking into account various side effects such as thermal runaway.
Author Contributions
Conceptualization, V.K., A.P., R.G. and S.B.; methodology, L.H.G. and B.W.; formal analysis, L.H.G., G.L. and B.W.; investigation, V.K., G.L., H.O. and R.W.; data curation, L.H.G. and B.W.; writing—original draft preparation, L.H.G., G.L., H.O., R.W. and B.W.; writing—review and editing, L.H.G. and R.G.; visualization, L.H.G.; supervision, R.G. and S.B.; project administration, S.B.; funding acquisition, V.K., A.P., G.R., R.G. and S.B. All authors have read and agreed to the published version of the manuscript.
Funding
This research was funded by the German Federal Environmental Foundation (Deutsche Bundesstiftung Umwelt-DBU; 33874/01).
Data Availability Statement
The data sets presented in this article are not readily. Requests to access the data sets should be directed to the corresponding author.
Acknowledgments
The authors would like to thank Dennis Winterbur for his support in the investigation process and the preparation of the original draft. The authors would also like to thank Tsvetanka Alyova and Katja Klicker for their support in the preparation of the original draft and Monique Glockmann for her support in the review and editing process.
Conflicts of Interest
The authors Georg Loef and Volker Klein were employed by the company Be-Power GmbH, the authors Haimanot Okube and André Pohl were employed by the company Hellmann Process Management GmbH & Co. KG. and the authors Ralf Winterbur and Georg Röwer were employed by the company Röwer Sicherheits- und Gebäudetechnik GmbH. The remaining authors declare that the research was conducted in the absence of any commercial or financial relationships that could be construed as a potential conflict of interest.
References
- Statista Estimates; BloombergNEF; US Department of Energy. Prognostizierte Nachfrage nach Batterien Weltweit nach Anwendung von 2020 bis 2030 (in Gigawattstunden). 24 June 2021. Available online: https://de.statista.com/statistik/daten/studie/1330168/umfrage/prognostizierte-nachfrage-nach-batterien-nach-anwendung/ (accessed on 23 August 2023).
- Bracke, S.; Guenther, L.H. Concept for a Second Life use of Traction Batteries in Private Households: The Impact of an Adapted Environmental Setting on the Product Reliability. In Proceedings of the 30th European Safety and Reliability Conference and 15th Probabilistic Safety Assessment and Management Conference, Venice, Italy, 1–5 November 2020; Baraldi, P., Di Maio, F., Zio, E., Eds.; Springer: Singapore, 2020; pp. 4178–4185. [Google Scholar] [CrossRef]
- ZSW; IEA. Anzahl von Elektroautos Weltweit von 2012 bis 2022 und eine Prognose bis 2030. 12 August 2023. Available online: https://de.statista.com/statistik/daten/studie/168350/umfrage/bestandsentwicklung-von-elektrofahrzeugen/ (accessed on 23 August 2023).
- Xiong, R. Battery Management Algorithm for Electric Vehicles; Springer: Singapore, 2020. [Google Scholar]
- Zhang, Z.; Zhang, S.S. Challenges of Key Materials for Rechargeable Batteries. In Rechargeable Batteries; Zhang, Z., Zhang, S.S., Eds.; Green Energy and Technology; Springer: Cham, Switzerland, 2015; pp. 1–24. [Google Scholar] [CrossRef]
- Battery Test Procedure (BTP) Working Group. Electric Vehicle Battery Test Procedures Manual; United States Advanced Battery Consortium: Detroit, MI, USA, 1996. [Google Scholar]
- Cready, E.; Lippert, J.; Pihl, J.; Weinstock, I.; Symons, P. Technical and Economic Feasibility of Applying Used EV Batteries in Stationary Applications; Technical Report; U.S. Department of Commerce National Technical Information Service: Springfield, VA, USA, 2003. [Google Scholar] [CrossRef]
- Ahmadi, L.; Fowler, M.; Young, S.B.; Fraser, R.A.; Gaffney, B.; Walker, S.B. Energy efficiency of Li-ion battery packs re-used in stationary power applications. Sustain. Energy Technol. Assess. 2014, 8, 9–17. [Google Scholar] [CrossRef]
- Bobba, S.; Cusenza, M.A.; Di Persio, F.; Eynard, U.; Mathieux, F.; Messagie, M.; Pfrang, A.; Podias, A.; Tecchio, P. Sustainability Assessment of Second Life Application of Automotive Batteries (SASLAB): JRC Exploratory Research (2016–2017): Final Technical Report, August 2018; EUR, Scientific and Technical Research Series; Publications Office of the European Union: Luxembourg, 2018; Volume 29321. [Google Scholar]
- Guenther, L.H.; Fiur, P.; Bracke, S. Usage Data Analysis of Lithium-Ion Batteries as a Base for the Prediction of the Product Reliability in a Specific Second Life Application. In Proceedings of the Book of Extended Abstracts for the 32nd European Safety and Reliability Conference, Dublin, Ireland, 28 August–1 September 2022; Leva, M.C., Patelli, E., Podofillini, L., Wilson, S., Eds.; Springer: Singapore, 2022; pp. 1212–1219. [Google Scholar] [CrossRef]
- Casals, L.C.; Amante García, B.; Canal, C. Second life batteries lifespan: Rest of useful life and environmental analysis. J. Environ. Manag. 2019, 232, 354–363. [Google Scholar] [CrossRef]
- Baure, G.; Dubarry, M. Synthetic vs. Real Driving Cycles: A Comparison of Electric Vehicle Battery Degradation. Batteries 2019, 5, 42. [Google Scholar] [CrossRef]
- Bracke, S.; Reinecke, F.; Goertz, R. Risk scenarios, reliability challenges and safety concept approach for second life lithium-ion battery systems out of automotive technologies. In Proceedings of the Safety and Reliability—Theory and Applications; Čepin, M., Briš, R., Eds.; CRC Press: Boca Raton, FL, USA, 2017; p. 182. [Google Scholar] [CrossRef]
- BMW Group Demonstriert Führungsrolle im Bereich Elektromobilität, 26 October 2017. Available online: https://www.press.bmwgroup.com/deutschland/article/detail/T0275547DE/bmw-group-demonstriert-fuehrungsrolle-im-bereich-elektromobilitaet?language=de (accessed on 11 September 2023).
- World’s Largest 2nd-Use Battery Storage Is Starting Up, 13 September 2016. Available online: https://www.mobilityhouse.com/int_en/our-company/newsroom/article/worlds-largest-2nd-use-battery-storage-is-starting-up (accessed on 13 September 2023).
- Connected Energy. E-STOR Battery Energy Storage. Available online: https://connected-energy.co.uk/battery-energy-storage/ (accessed on 13 September 2023).
- Eaton Industries Manufacturing GmbH. Eaton xStorage Compact: Technisches Datenblatt. September 2022. Available online: https://www.eaton.com/content/dam/eaton/products/energy-storage/xstorage-compact/de-de/eaton-xstorage-compact-technical-datasheet-de-de.pdf (accessed on 13 September 2023).
- Martinez-Laserna, E.; Sarasketa-Zabala, E.; Villarreal Sarria, I.; Stroe, D.I.; Swierczynski, M.; Warnecke, A.; Timmermans, J.M.; Goutam, S.; Omar, N.; Rodriguez, P. Technical Viability of Battery Second Life: A Study From the Ageing Perspective. IEEE Trans. Ind. Appl. 2018, 54, 2703–2713. [Google Scholar] [CrossRef]
- Becker, J.; Beverungen, D.; Winter, M.; Menne, S. (Eds.) Umwidmung und Weiterverwendung von Traktionsbatterien: Szenarien, Dienstleistungen und Entscheidungsunterstützung; Springer: Berlin/Heidelberg, Germany, 2019. [Google Scholar]
- dos Reis, G.; Strange, C.; Yadav, M.; Li, S. Lithium-ion battery data and where to find it. Energy AI 2021, 5, 100081. [Google Scholar] [CrossRef]
- National Aeronautics and Space Administration. Prognostics Center of Excellence Data Set Repository. 3 April 2023. Available online: https://www.nasa.gov/content/prognostics-center-of-excellence-data-set-repository (accessed on 30 August 2023).
- Guenther, L.H.; Scholz, T.; Pautzke, F.; Fechtner, H.; Schmuelling, B.; Schelte, N.; Severengiz, S.; Hinz, M.; Bracke, S. Reliability Engineering of Electric Vehicle Powertrains: Data Collection and Analysis Based on Products in the Usage Phase. In Proceedings of the 31st European Safety and Reliability Conference (ESREL 2021), Angers, France, 19–23 September 2021; Castanier, B., Cepin, M., Bigaud, D., Berenguer, C., Eds.; Springer: Singapore, 2021; pp. 2573–2580. [Google Scholar] [CrossRef]
- Leuthner, S. Lithium-ion battery overview. In Lithium-Ion Batteries: Basics and Applications; Korthauer, R., Ed.; Springer: Berlin/Heidelberg, Germany, 2018; pp. 13–19. [Google Scholar] [CrossRef]
- Danzer, M.A.; Liebau, V.; Maglia, F. Aging of lithium-ion batteries for electric vehicles. In Advances in Battery Technologies for Electric Vehicles; Elsevier: Amsterdam, The Netherlands, 2015; pp. 359–387. [Google Scholar] [CrossRef]
- Wang, J.; Purewal, J.; Liu, P.; Hicks-Garner, J.; Soukazian, S.; Sherman, E.; Sorenson, A.; Vu, L.; Tataria, H.; Verbrugge, M.W. Degradation of lithium ion batteries employing graphite negatives and nickel–cobalt–manganese oxide + spinel manganese oxide positives: Part 1, aging mechanisms and life estimation. J. Power Sources 2014, 269, 937–948. [Google Scholar] [CrossRef]
- Schmalstieg, J.; Käbitz, S.; Ecker, M.; Sauer, D.U. A holistic aging model for Li(NiMnCo)O2 based 18650 lithium-ion batteries. J. Power Sources 2014, 257, 325–334. [Google Scholar] [CrossRef]
- Grolleau, S.; Delaille, A.; Gualous, H.; Gyan, P.; Revel, R.; Bernard, J.; Redondo-Iglesias, E.; Peter, J. Calendar aging of commercial graphite/LiFePO4 cell – Predicting capacity fade under time dependent storage conditions. J. Power Sources 2014, 255, 450–458. [Google Scholar] [CrossRef]
- Ecker, M.; Nieto, N.; Käbitz, S.; Schmalstieg, J.; Blanke, H.; Warnecke, A.; Sauer, D.U. Calendar and cycle life study of Li(NiMnCo)O2-based 18650 lithium-ion batteries. J. Power Sources 2014, 248, 839–851. [Google Scholar] [CrossRef]
- Fischhaber, S.; Regett, A.; Schuster, S.F.; Hesse, H. Studie: Second-Life-Konzepte für Lithium-Ionen-Batterien aus Elektrofahrzeugen: Analyse von Nachnutzungsanwendungen, ökonomischen und ökologischen Potenzialen: Ergebnispapier Nr. 18. February 2016. Available online: https://www.ffe.de/wp-content/uploads/2016/06/StudieSecondLifeKonzepte1.pdf (accessed on 30 August 2023).
- Wang, Y.; Chang, X.; Li, Z.; Mei, Y.; Zhang, Y.; Liu, L.; Wang, K.; Gu, H.; Li, L. Preventing Sudden Death of High–Energy Lithium–Ion Batteries at Elevated Temperature Through Interfacial Ion–Flux Rectification. Adv. Funct. Mater. 2023, 33, 2208329. [Google Scholar] [CrossRef]
- Ben-Marzouk, M.; Pelissier, S.; Clerc, G.; Sari, A.; Venet, P. Generation of a Real-Life Battery Usage Pattern for Electrical Vehicle Application and Aging Comparison With the WLTC Profile. IEEE Trans. Veh. Technol. 2021, 70, 5618–5627. [Google Scholar] [CrossRef]
- Stroe, D.I.; Swierczynski, M.; Kaer, S.K.; Laserna, E.M.; Zabala, E.S. Accelerated aging of Lithium-ion batteries based on electric vehicle mission profile. In Proceedings of the 2017 IEEE Energy Conversion Congress and Exposition (ECCE), Cincinnati, OH, USA, 1–5 October 2017; IEEE: Piscataway, NJ, USA, 2017; pp. 5631–5637. [Google Scholar] [CrossRef]
- Korthauer, R. (Ed.) Lithium-Ion Batteries: Basics and Applications; Springer: Berlin/Heidelberg, Germany, 2018. [Google Scholar] [CrossRef]
- Deutsches Institut für Normung: DIN. DIN EN IEC 62660-1 (VDE 0510-33): 2020-07 Lithium-Ionen-Sekundärzellen für den Antrieb von Elektrostraßenfahrzeugen-Teil 1: Prüfung des Leistungsverhaltens (IEC 62660-1:2018); Deutsche Fassung EN IEC 62660-1:2019. July 2020. Available online: https://www.din.de/de/mitwirken/normenausschuesse/dke/veroeffentlichungen/wdc-beuth:din21:321514971 (accessed on 30 August 2023).
- International Organization for Standardization. Electrically Propelled Road Vehicles—Test Specification for Lithium-Ion Traction Battery Packs and Systems—Part 4: Performance Testing, 12405-4:2018-07. July 2018. Available online: https://www.iso.org/standard/71407.html (accessed on 30 August 2023).
- Agudelo, B.O.; Zamboni, W.; Monmasson, E.; Spagnuolo, G. Identification of battery circuit model from EIS data. In Proceedings of the JCGE—Congrès des Jeunes Chercheurs en Génie Electrique, Saint Pierre d’Oléron, France, 11–14 June 2019. [Google Scholar]
- Lipu, M.H.; Hannan, M.A.; Hussain, A.; Hoque, M.M.; Ker, P.J.; Saad, M.; Ayob, A. A review of state of health and remaining useful life estimation methods for lithium-ion battery in electric vehicles: Challenges and recommendations. J. Clean. Prod. 2018, 205, 115–133. [Google Scholar] [CrossRef]
- Prakash, V.; Vigneswaran, T. State-of-Health Estimation of Li-ion Batteries in Electric Vehicle Using IndRNN under Variable Load Condition. Energies 2019, 12, 4338. [Google Scholar] [CrossRef]
- Ren, D.; Hsu, H.; Li, R.; Feng, X.; Guo, D.; Han, X.; Lu, L.; He, X.; Gao, S.; Hou, J.; et al. A comparative investigation of aging effects on thermal runaway behavior of lithium-ion batteries. eTransportation 2019, 2, 100034. [Google Scholar] [CrossRef]
- Golubkov, A.W.; Planteu, R.; Krohn, P.; Rasch, B.; Brunnsteiner, B.; Thaler, A.; Hacker, V. Thermal runaway of large automotive Li-ion batteries. RSC Adv. 2018, 8, 40172–40186. [Google Scholar] [CrossRef] [PubMed]
- Awad, M.; Khanna, R. Efficient Learning Machines; Apress: Berkeley, CA, USA, 2015. [Google Scholar] [CrossRef]
- Liu, Y. Python Machine Learning By Example—Third Edition, 3rd ed.; Packt Publishing and Safari: Boston, MA, USA, 2020. [Google Scholar]
- Young, P. Everything You Wanted to Know About Data Analysis and Fitting but Were Afraid to Ask; Springer: Cham, Switzerland, 2015. [Google Scholar] [CrossRef]
- Bracke, S. Technische Zuverlässigkeit; Springer: Berlin/Heidelberg, Germany, 2022. [Google Scholar] [CrossRef]
- Virtanen, P.; Gommers, R.; Oliphant, T.E.; Haberland, M.; Reddy, T.; Cournapeau, D.; Burovski, E.; Peterson, P.; Weckesser, W.; Bright, J.; et al. SciPy 1.0: Fundamental algorithms for scientific computing in Python. Nat. Methods 2020, 17, 261–272. [Google Scholar] [CrossRef]
- KBA. Anzahl der Elektroautos in Deutschland von 2006 bis Juli 2023. August 2023. Available online: https://de.statista.com/statistik/daten/studie/265993/umfrage/anzahl-der-hybridautos-in-deutschland/ (accessed on 21 September 2023).
- KBA. Anzahl der Hybridautos in Deutschland von 2006 bis 2023. March 2023. Available online: https://de.statista.com/statistik/daten/studie/265995/umfrage/anzahl-der-elektroautos-in-deutschland/ (accessed on 21 September 2023).
- Federal Ministry of Transport and Digital Infrastructure. Dangerous Goods Ordinance Road, Rail, Inland Navigation: GGVSEB. 17 June 2009. Available online: https://www.fao.org/faolex/results/details/en/c/LEX-FAOC158013/ (accessed on 30 August 2023).
- Unides, N. ADR Applicable as from 1 January 2021: European Agreement Concerning the International Carriage of Dangerous Goods by Road; United Nations: New York, NY, USA; Geneva, Switzerland, 2020. [Google Scholar]
- United Nations. Manual of Tests and Criteria, 7th ed.; Revised Edition; United Nations: New York, NY, USA, 2019. [Google Scholar]
- Bundestag. Gesetz zur Förderung der Kreislaufwirtschaft und Sicherung der umweltverträglichen Bewirtschaftung von Abfällen: KrWG. 24 February 2012. Available online: https://www.gesetze-im-internet.de/krwg/BJNR021210012.html (accessed on 30 August 2023).
- Cheng, M.D. Atmospheric chemistry of hydrogen fluoride. J. Atmos. Chem. 2018, 75, 1–16. [Google Scholar] [CrossRef]
- Christ, M.; Braun, N.; Neuffer, J.; Kempa-Liehr, A.W. tsfresh (v.0.19.0), 2016–2023. Available online: https://tsfresh.readthedocs.io (accessed on 7 October 2023).
- Ng, M.F.; Zhao, J.; Yan, Q.; Conduit, G.J.; Seh, Z.W. Predicting the state of charge and health of batteries using data-driven machine learning. Nat. Mach. Intell. 2020, 2, 161–170. [Google Scholar] [CrossRef]
- Liu, Z.; Zhao, J.; Wang, H.; Yang, C. A New Lithium-Ion Battery SOH Estimation Method Based on an Indirect Enhanced Health Indicator and Support Vector Regression in PHMs. Energies 2020, 13, 830. [Google Scholar] [CrossRef]
- Deutsches Institut für Normung: DIN. DIN EN 14470-1: Fire Safety Storage Cabinets—Part 1: Safety Storage Cabinets for Flammable Liquids; German version EN 14470-1:2023. September 2023. Available online: https://www.dinmedia.de/en/standard/din-en-14470-1/369141563 (accessed on 30 August 2023).
- Sturk, D.; Rosell, L.; Blomqvist, P.; Ahlberg Tidblad, A. Analysis of Li-Ion Battery Gases Vented in an Inert Atmosphere Thermal Test Chamber. Batteries 2019, 5, 61. [Google Scholar] [CrossRef]
- Larsson, F.; Andersson, P.; Blomqvist, P.; Mellander, B.E. Toxic fluoride gas emissions from lithium-ion battery fires. Sci. Rep. 2017, 7, 10018. [Google Scholar] [CrossRef]
- Abada, S.; Petit, M.; Lecocq, A.; Marlair, G.; Sauvant-Moynot, V.; Huet, F. Combined experimental and modeling approaches of the thermal runaway of fresh and aged lithium-ion batteries. J. Power Sources 2018, 399, 264–273. [Google Scholar] [CrossRef]
- Vermeer, W.; Chandra Mouli, G.R.; Bauer, P. A Comprehensive Review on the Characteristics and Modeling of Lithium-Ion Battery Aging. IEEE Trans. Transp. Electrif. 2022, 8, 2205–2232. [Google Scholar] [CrossRef]
- Xie, S.; Ren, L.; Yang, X.; Wang, H.; Sun, Q.; Chen, X.; He, Y. Influence of cycling aging and ambient pressure on the thermal safety features of lithium-ion battery. J. Power Sources 2020, 448, 227425. [Google Scholar] [CrossRef]

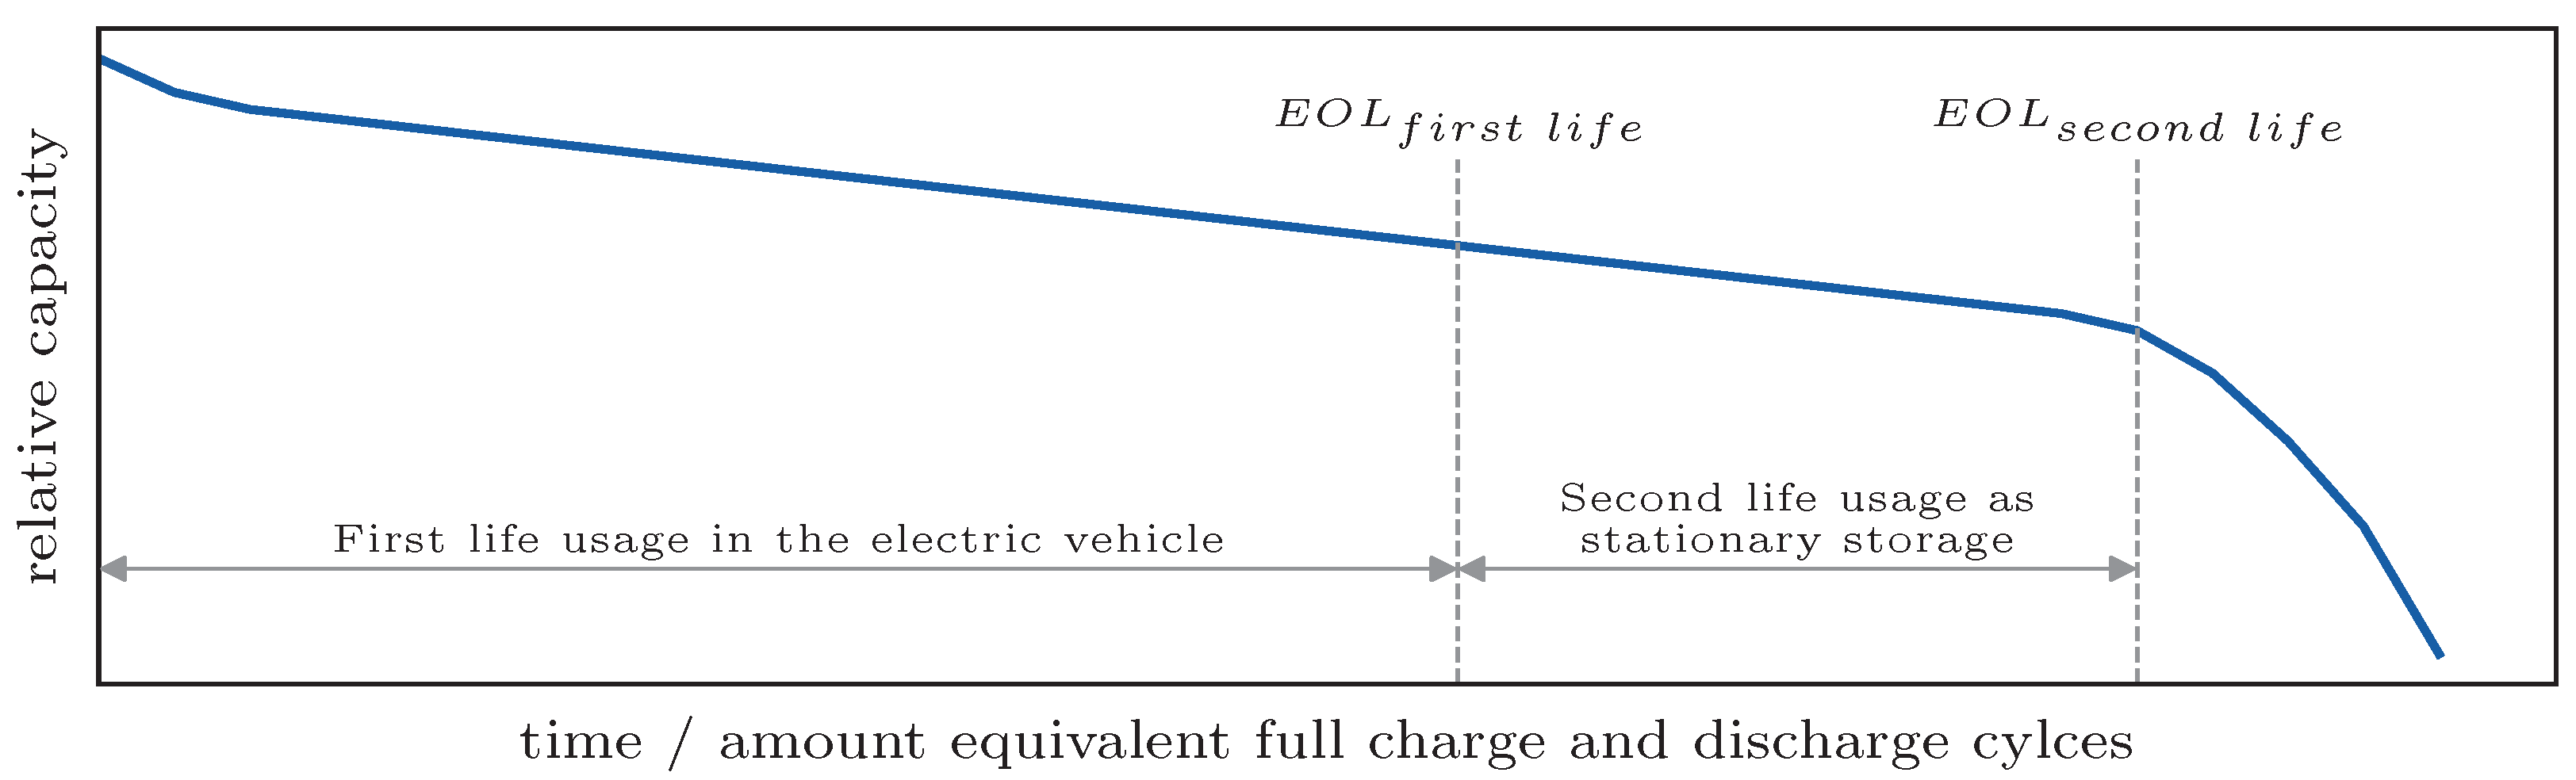
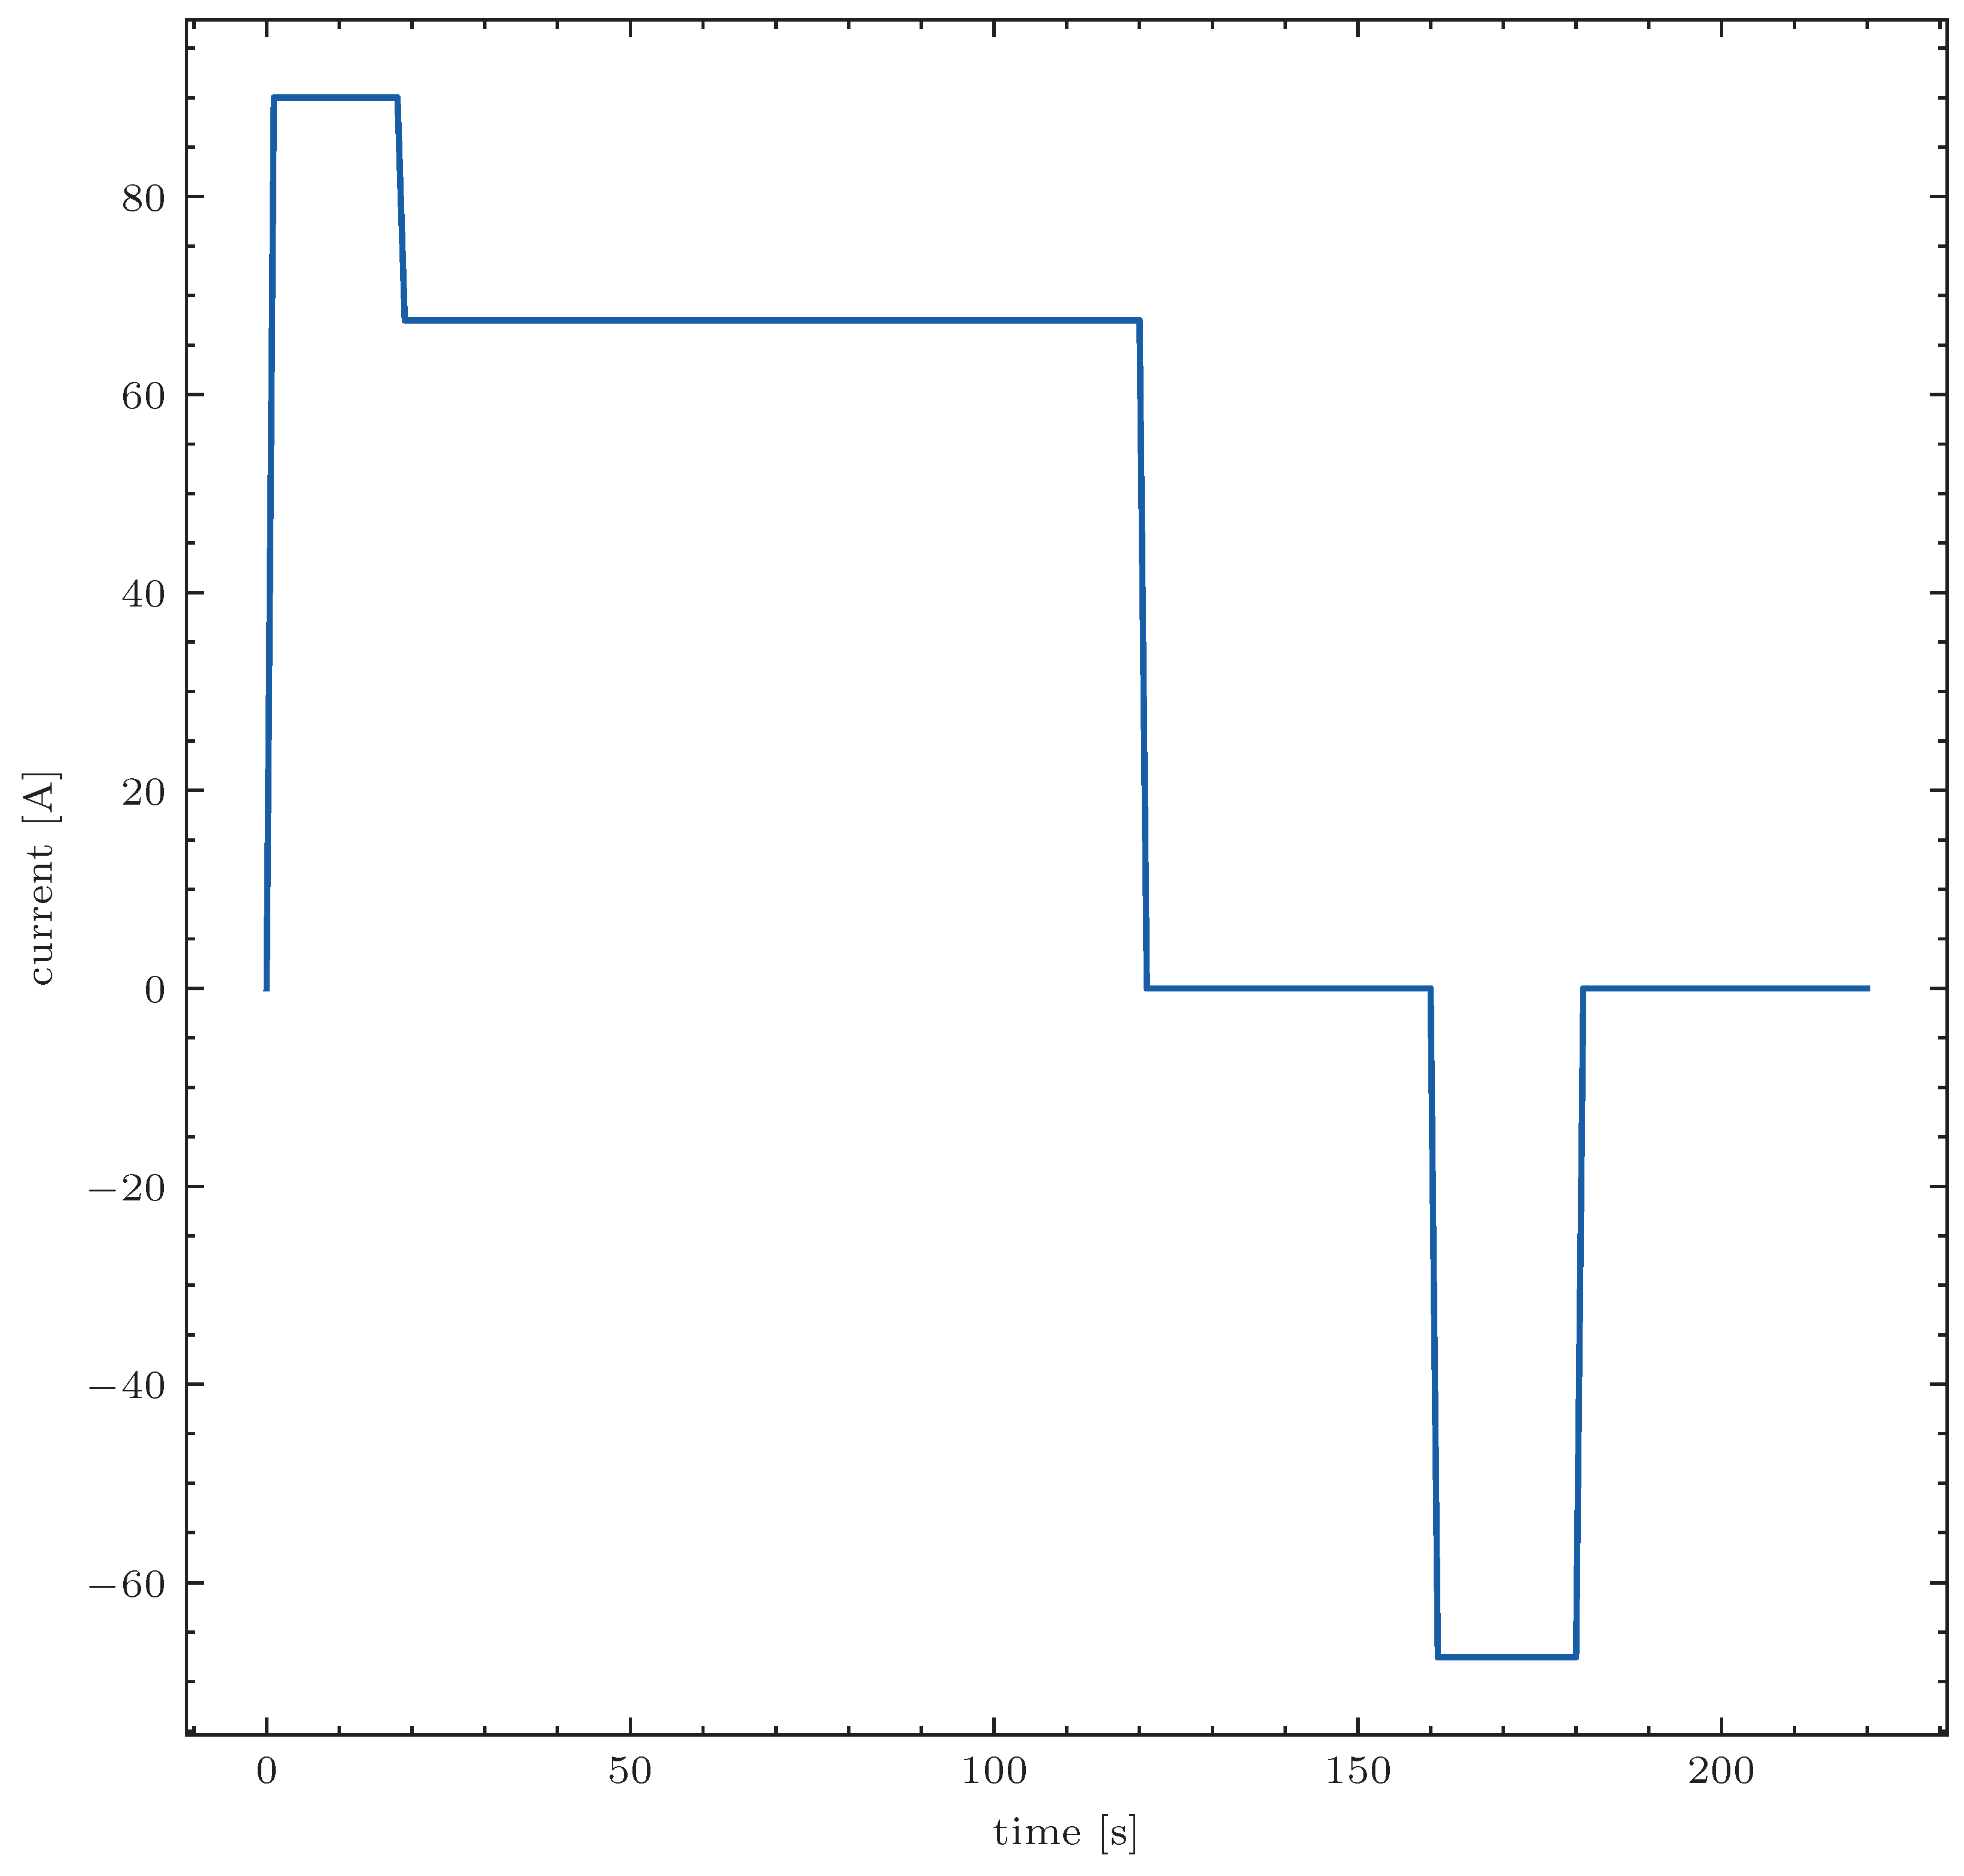
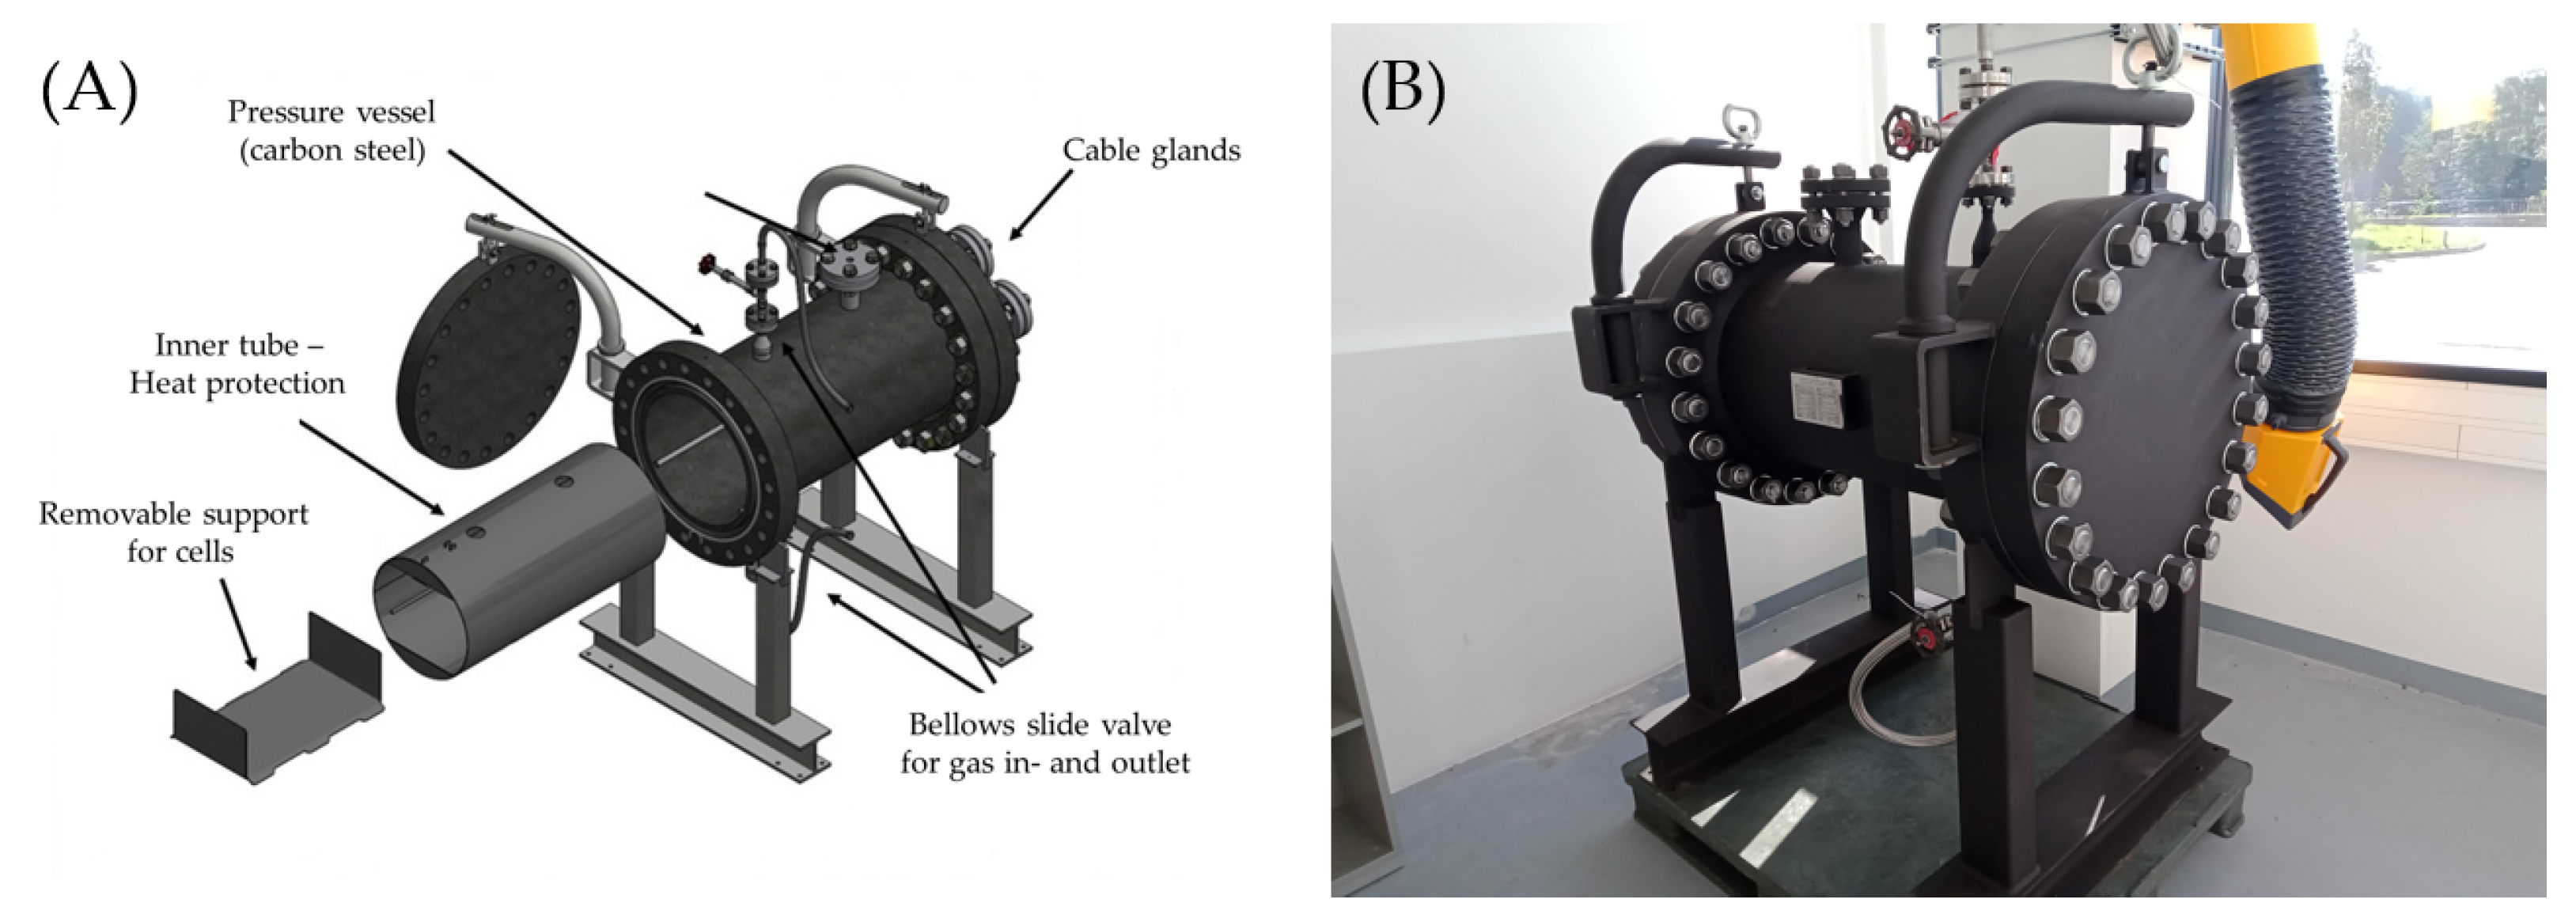
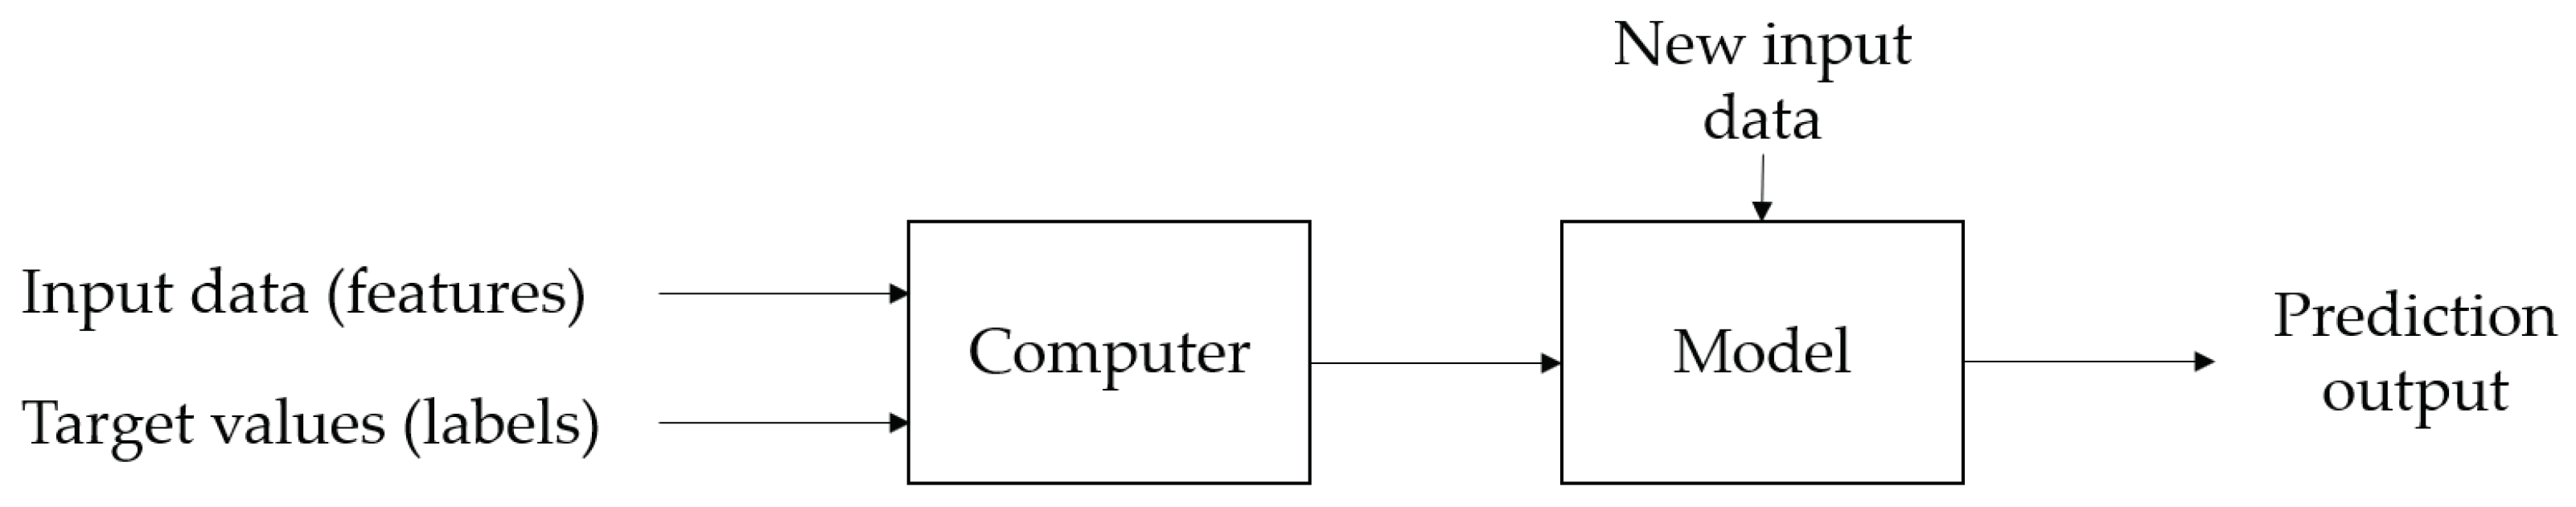
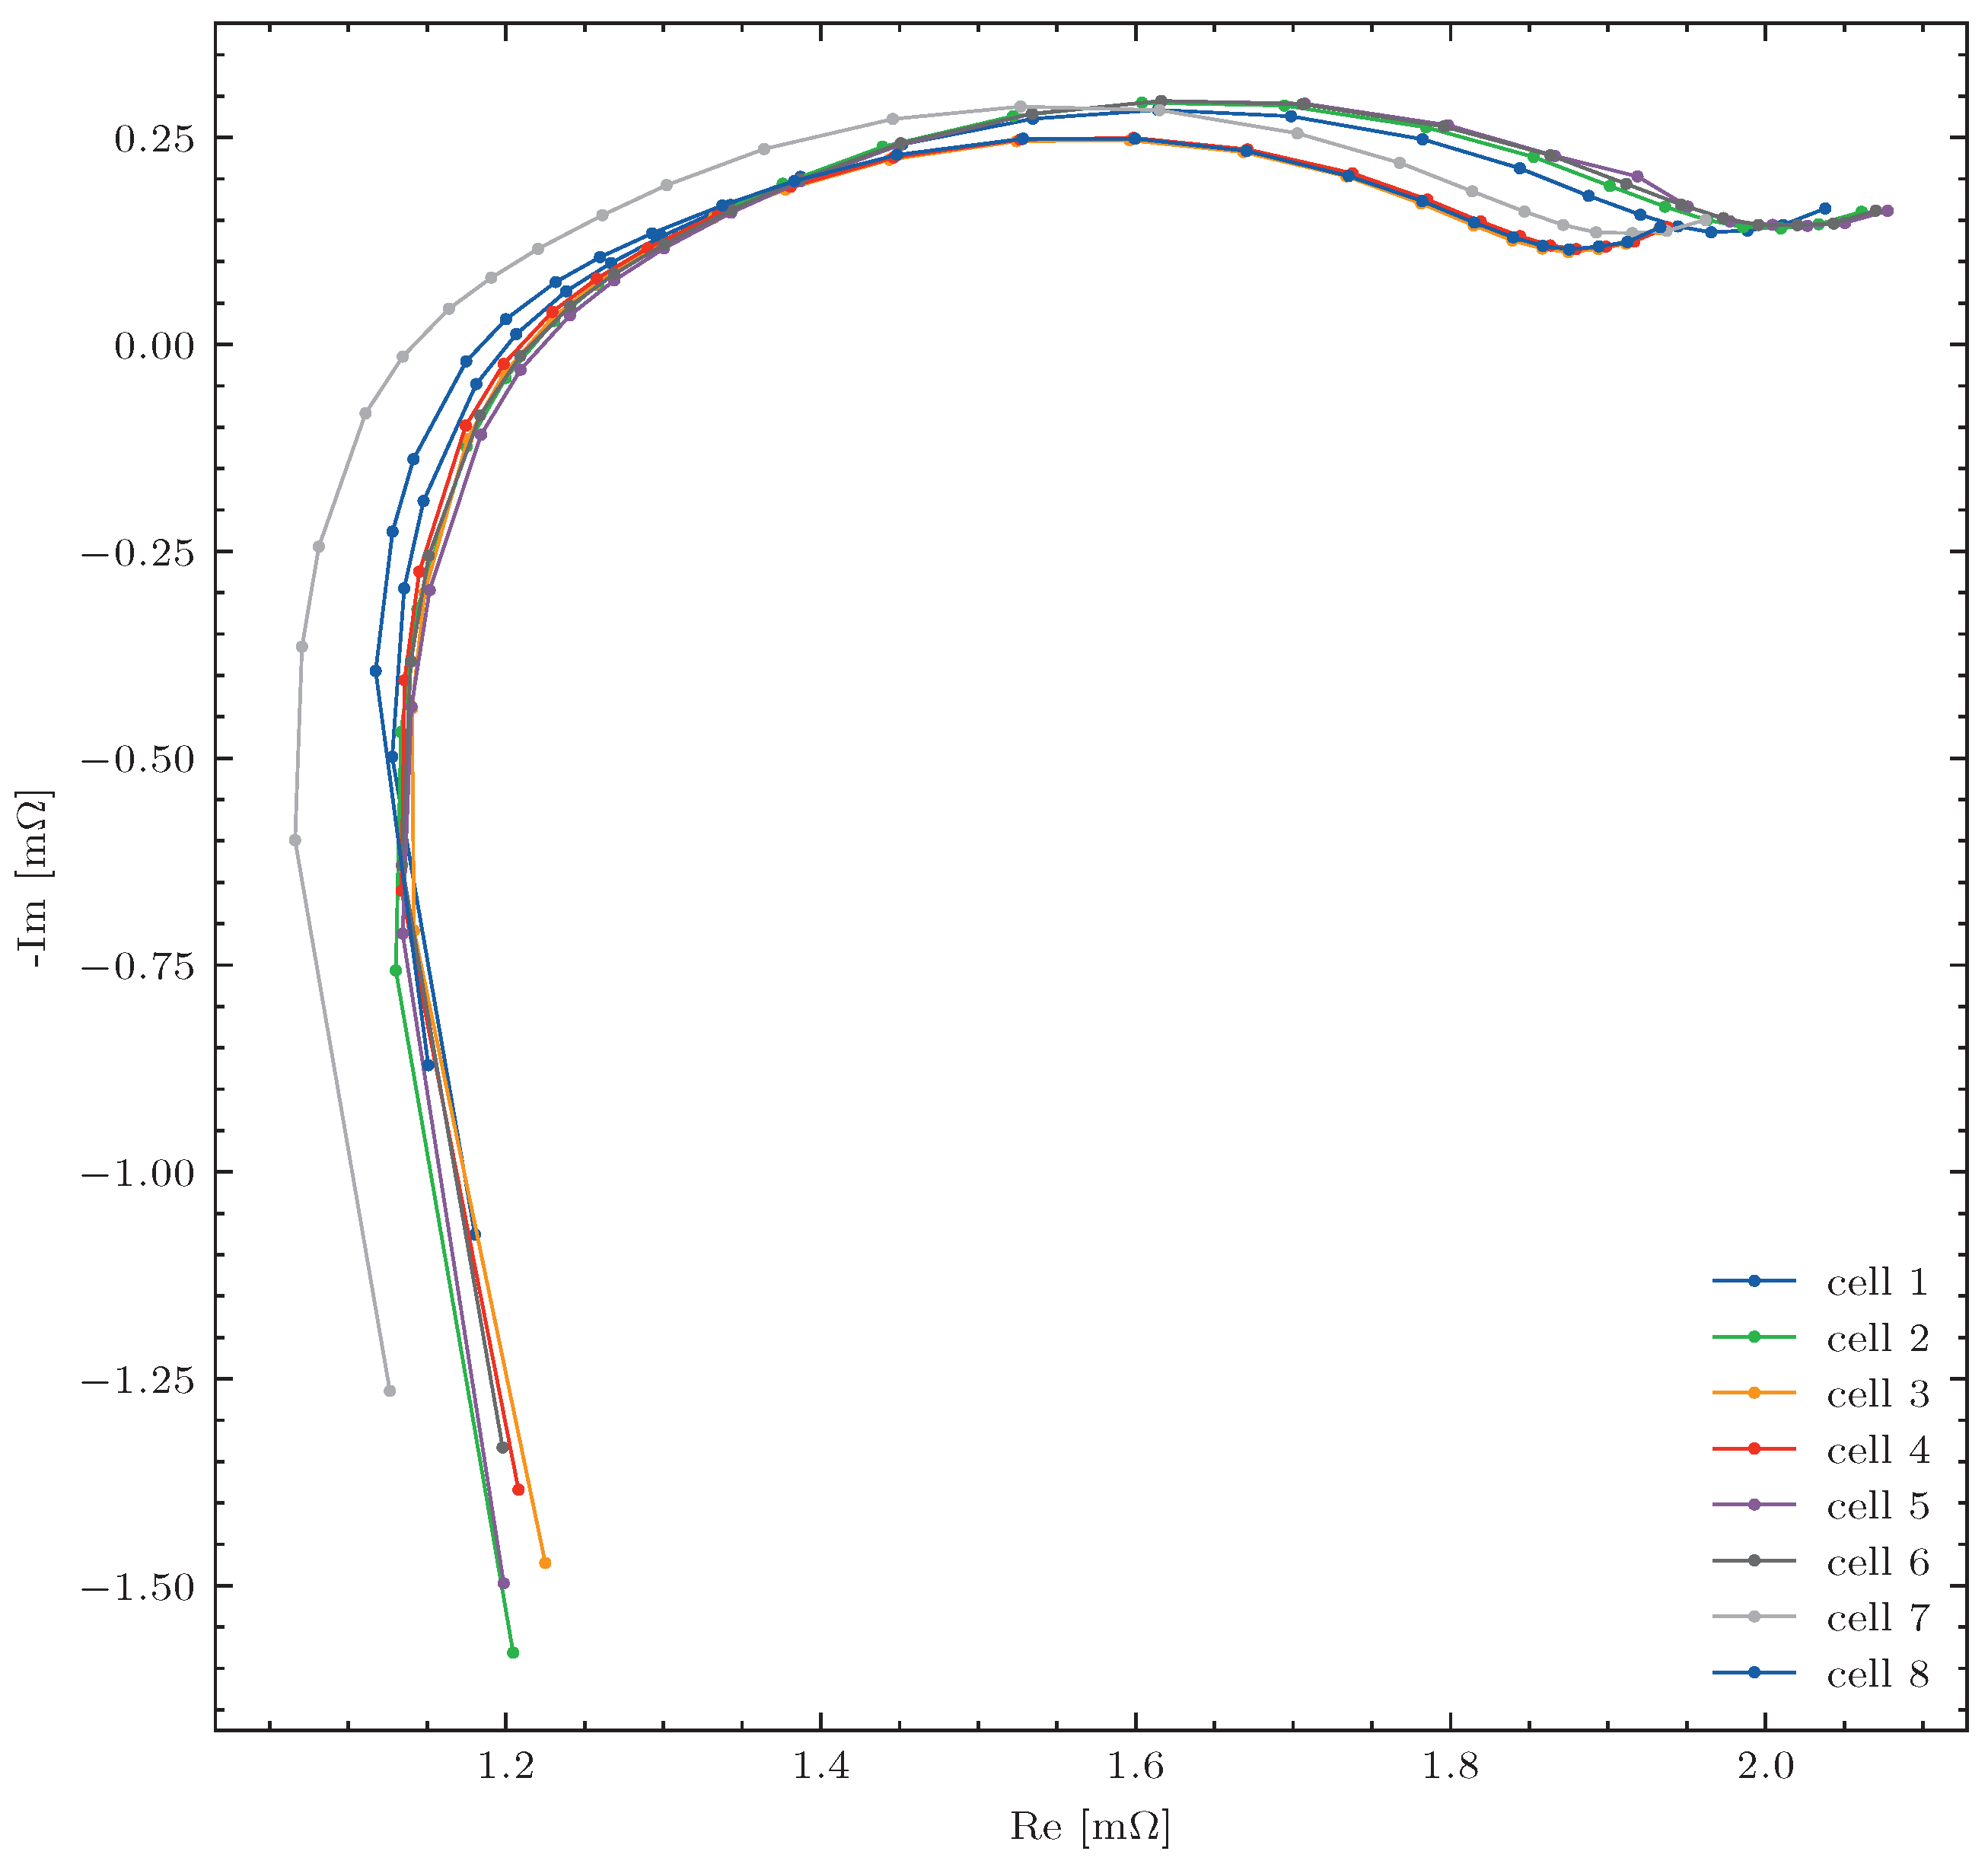
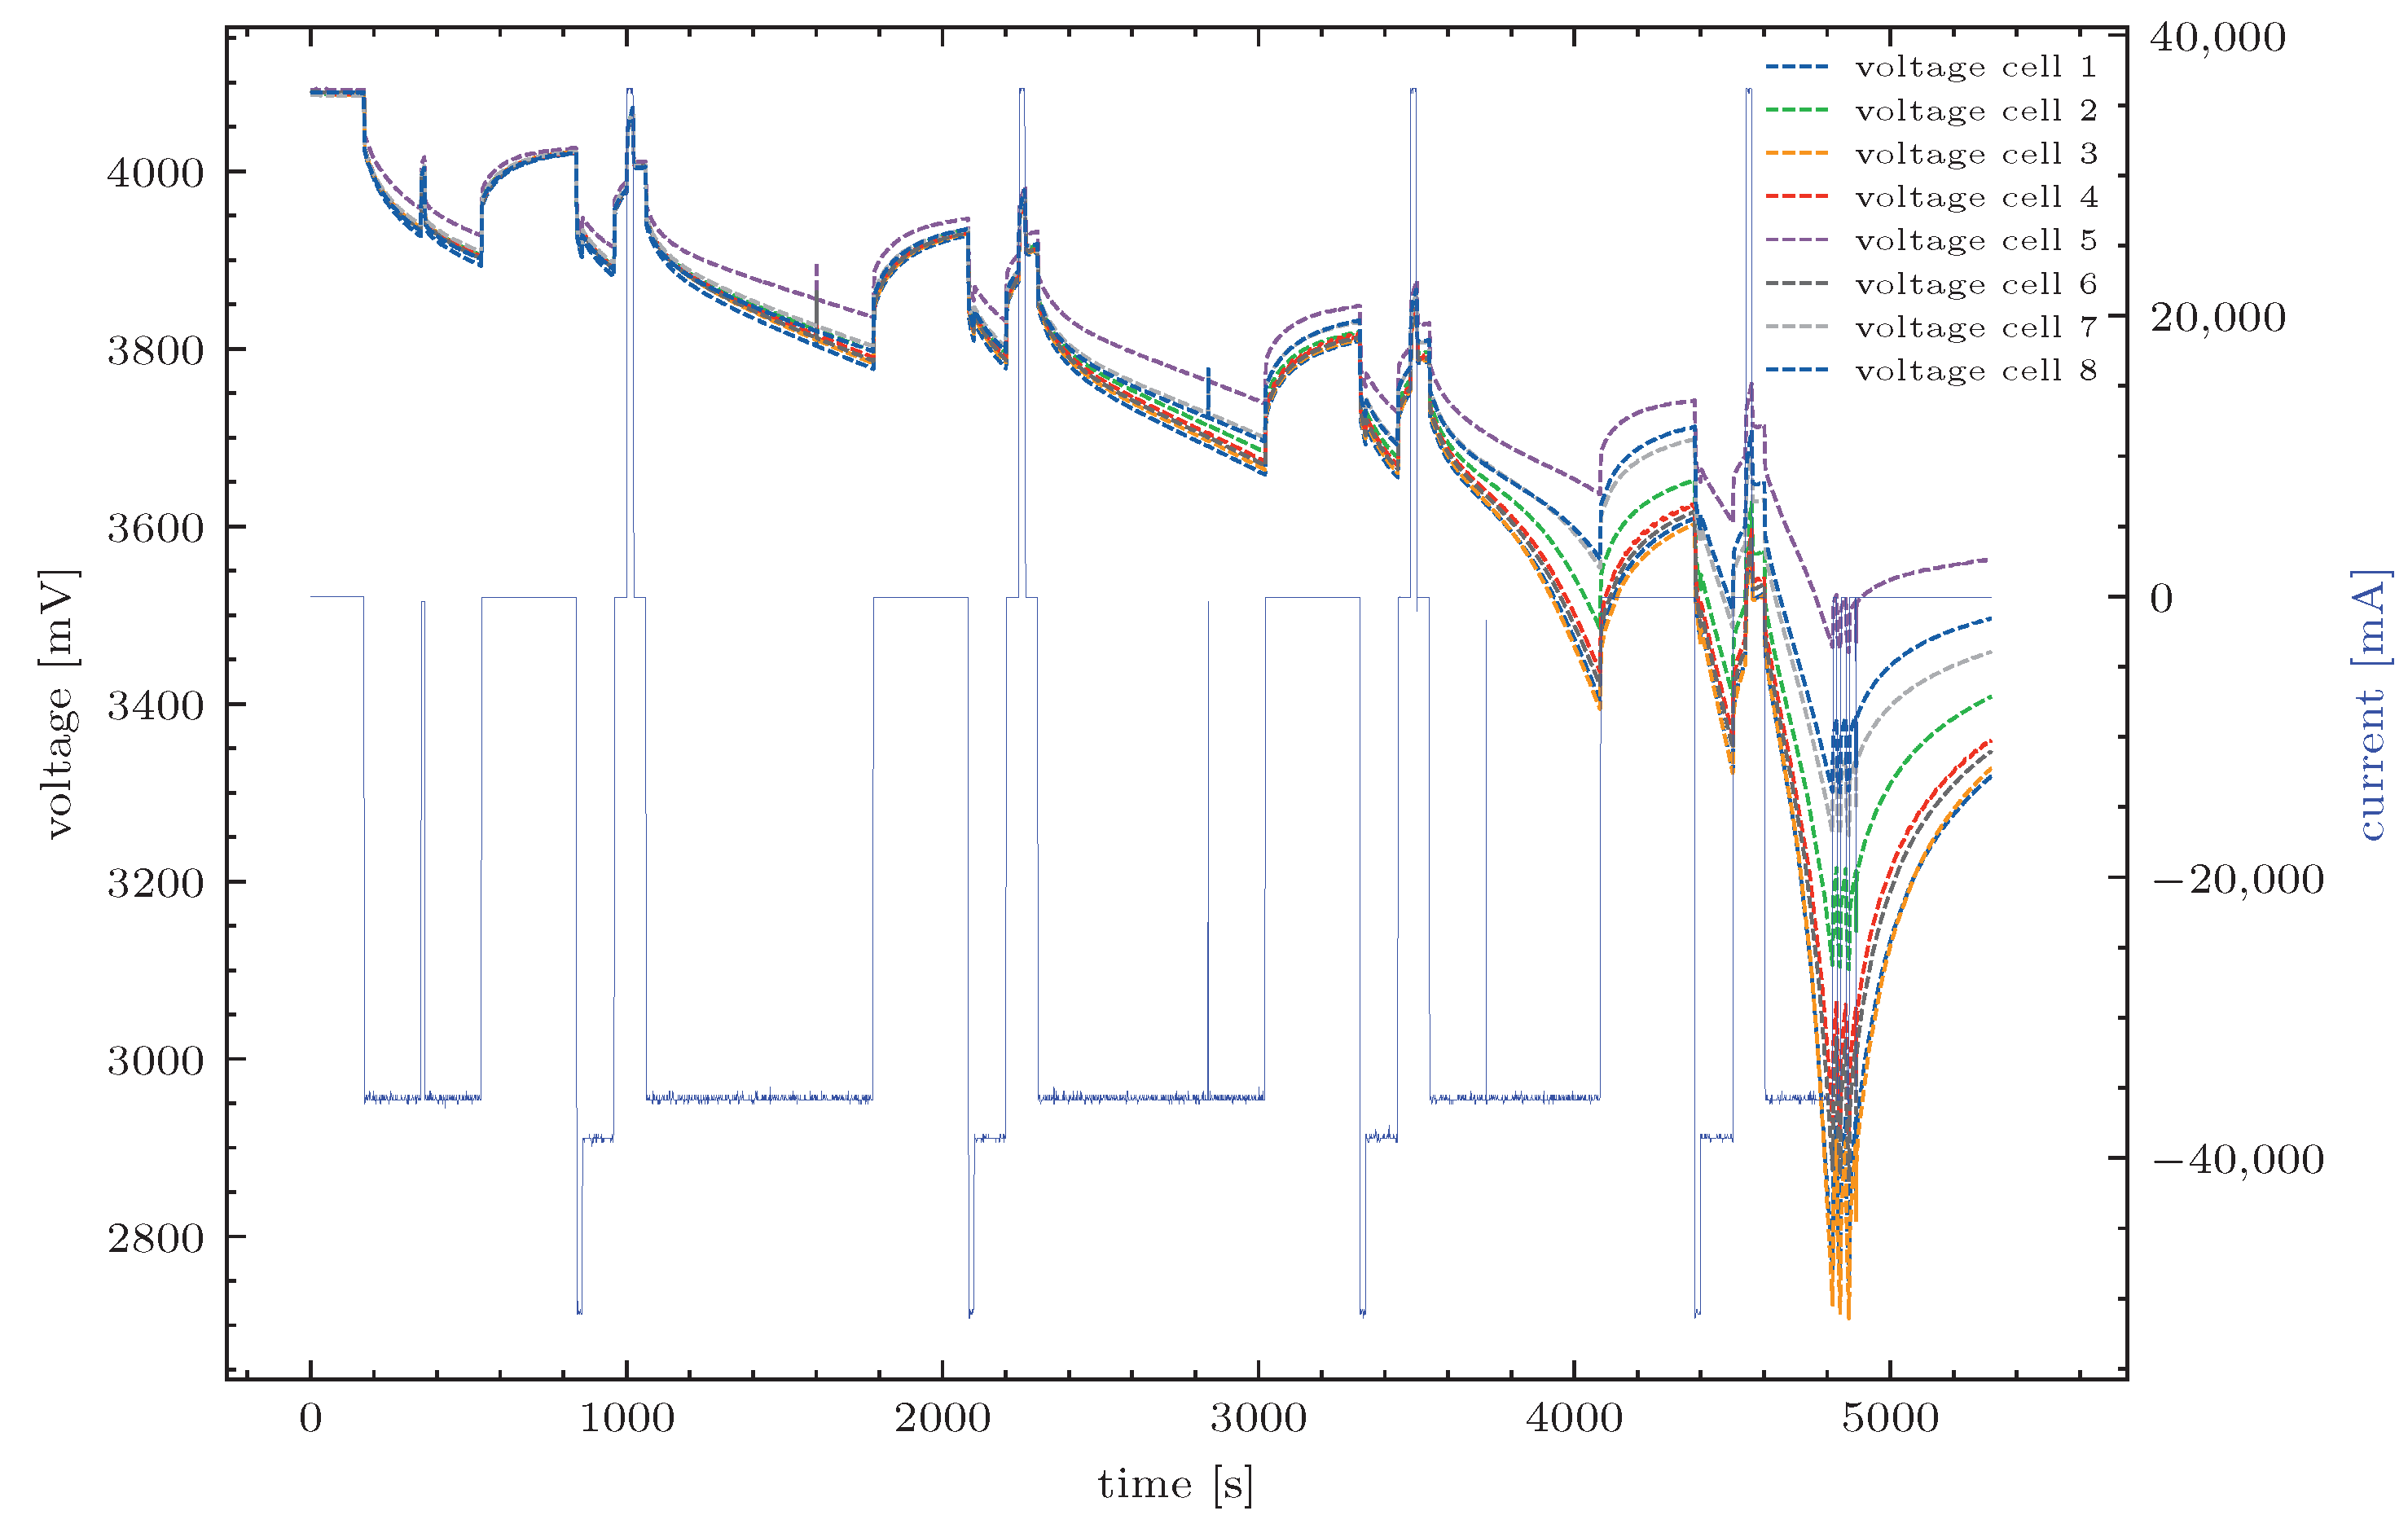
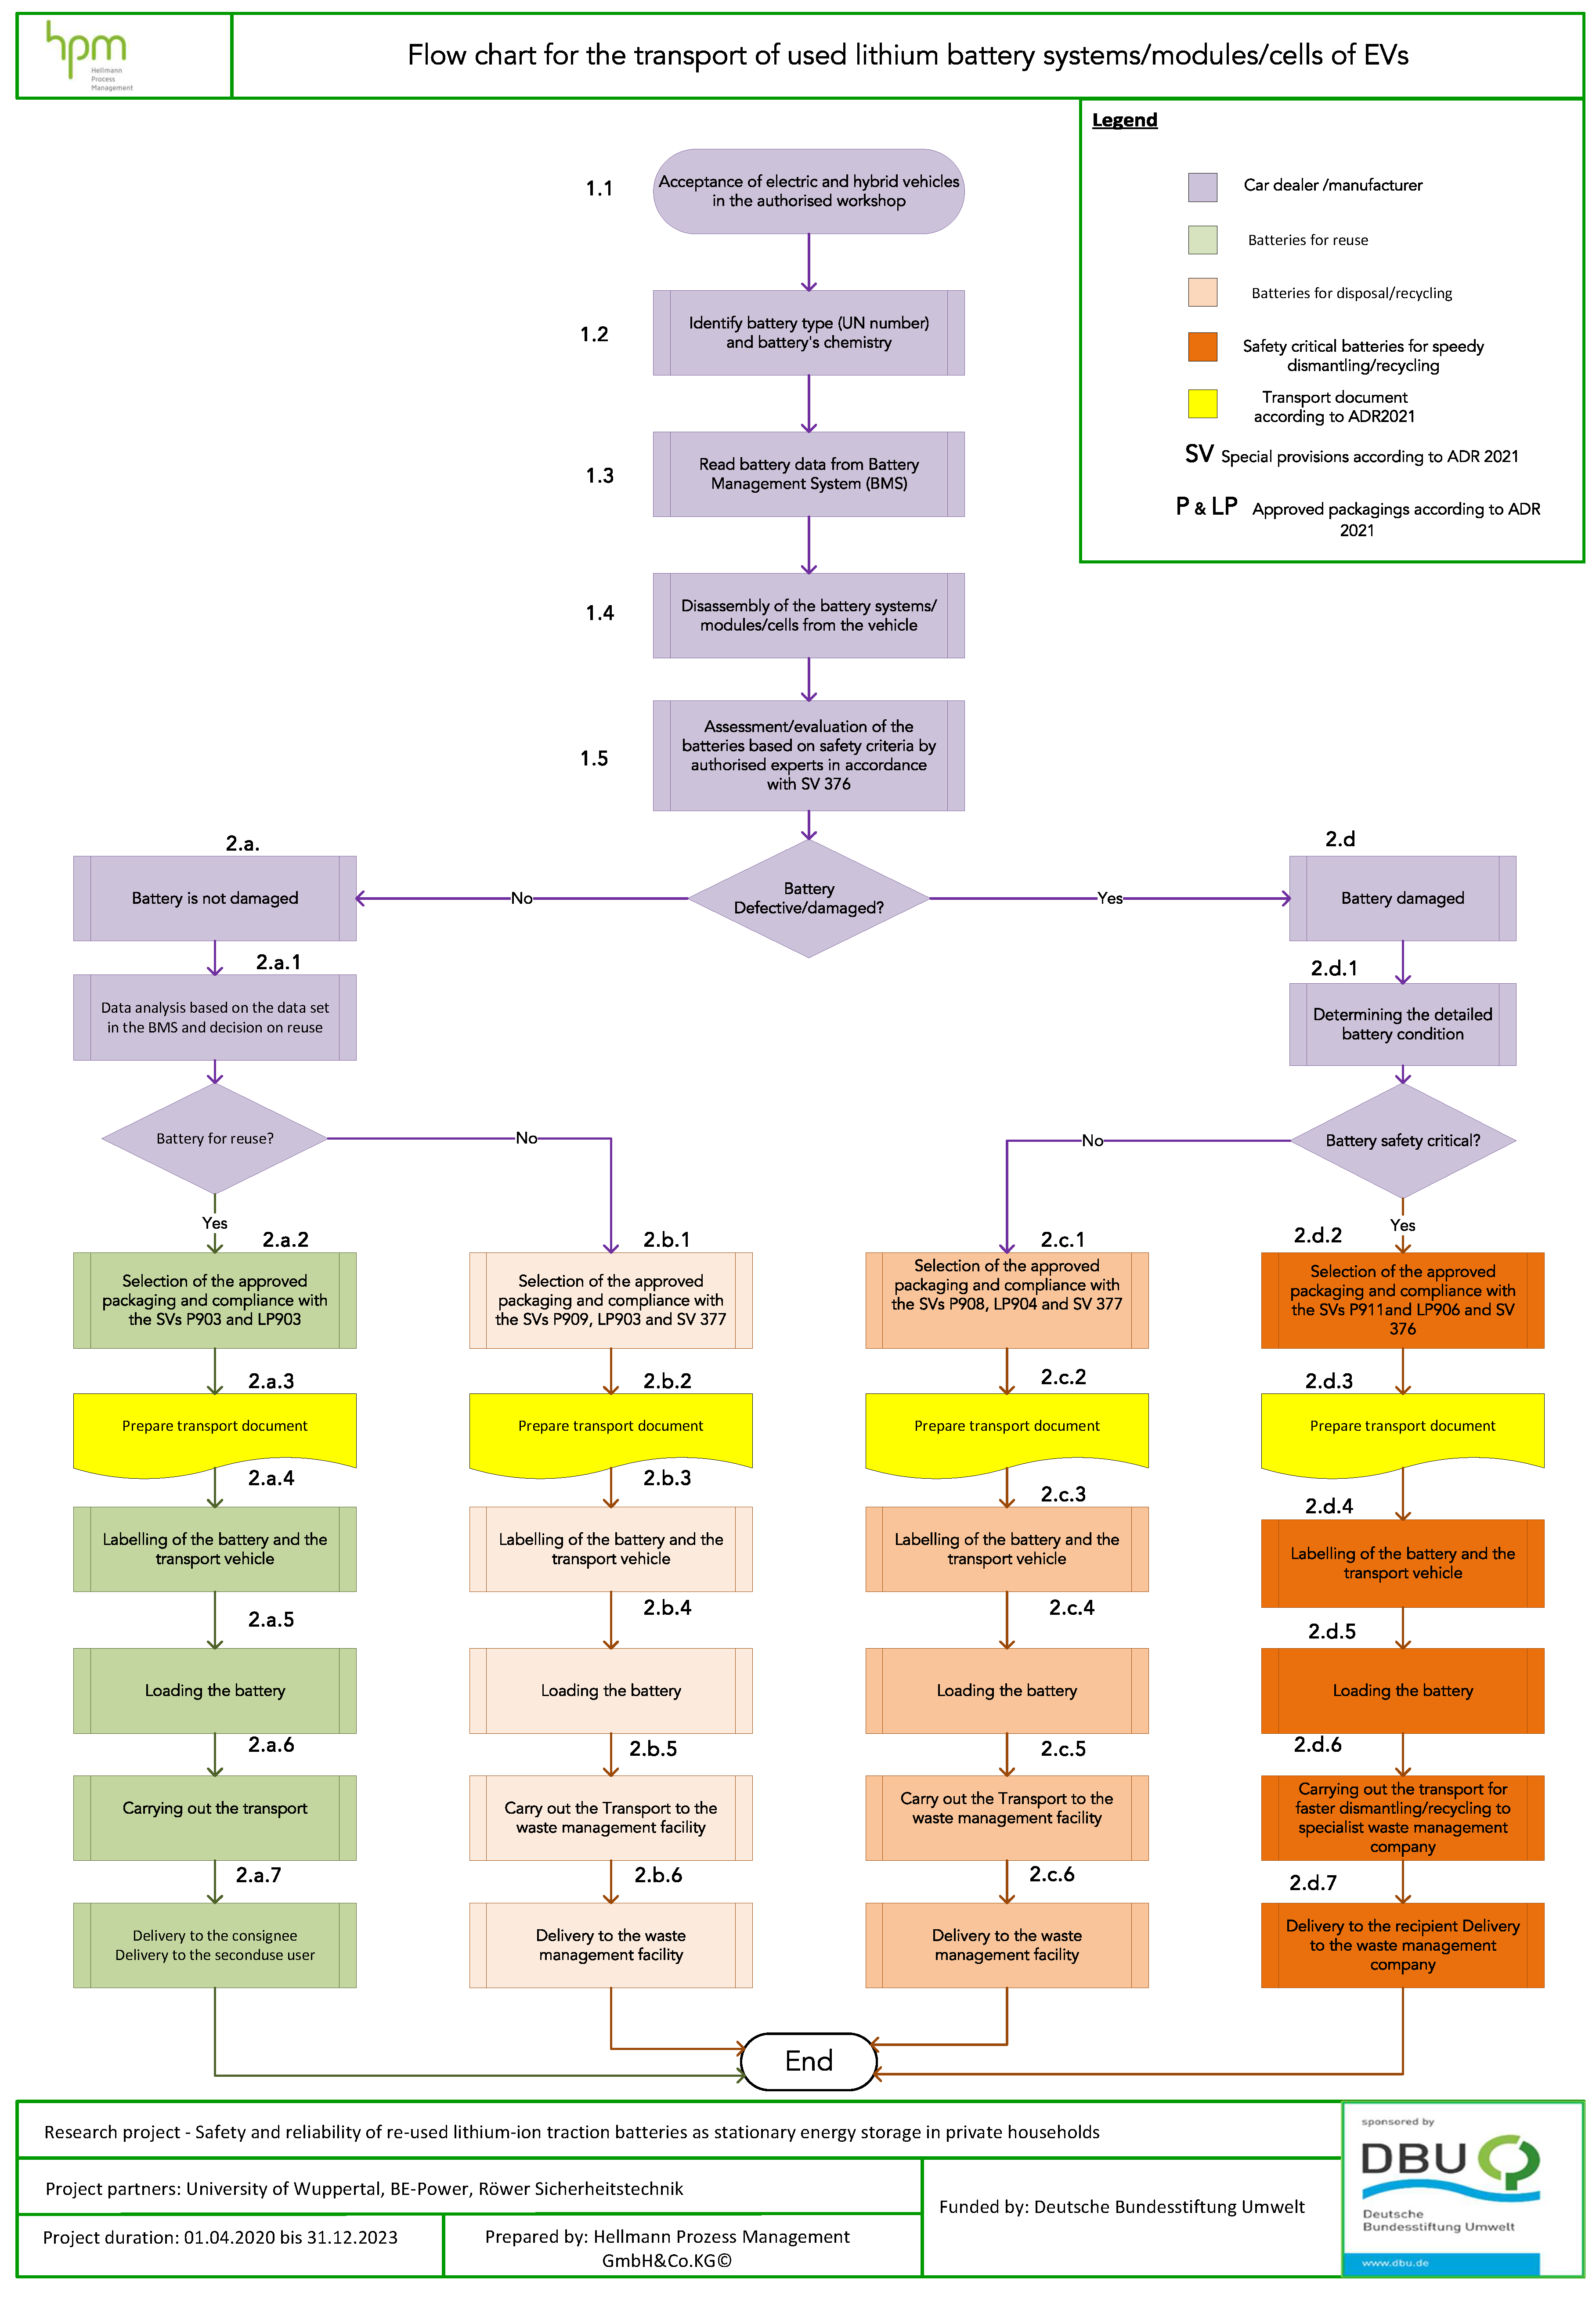
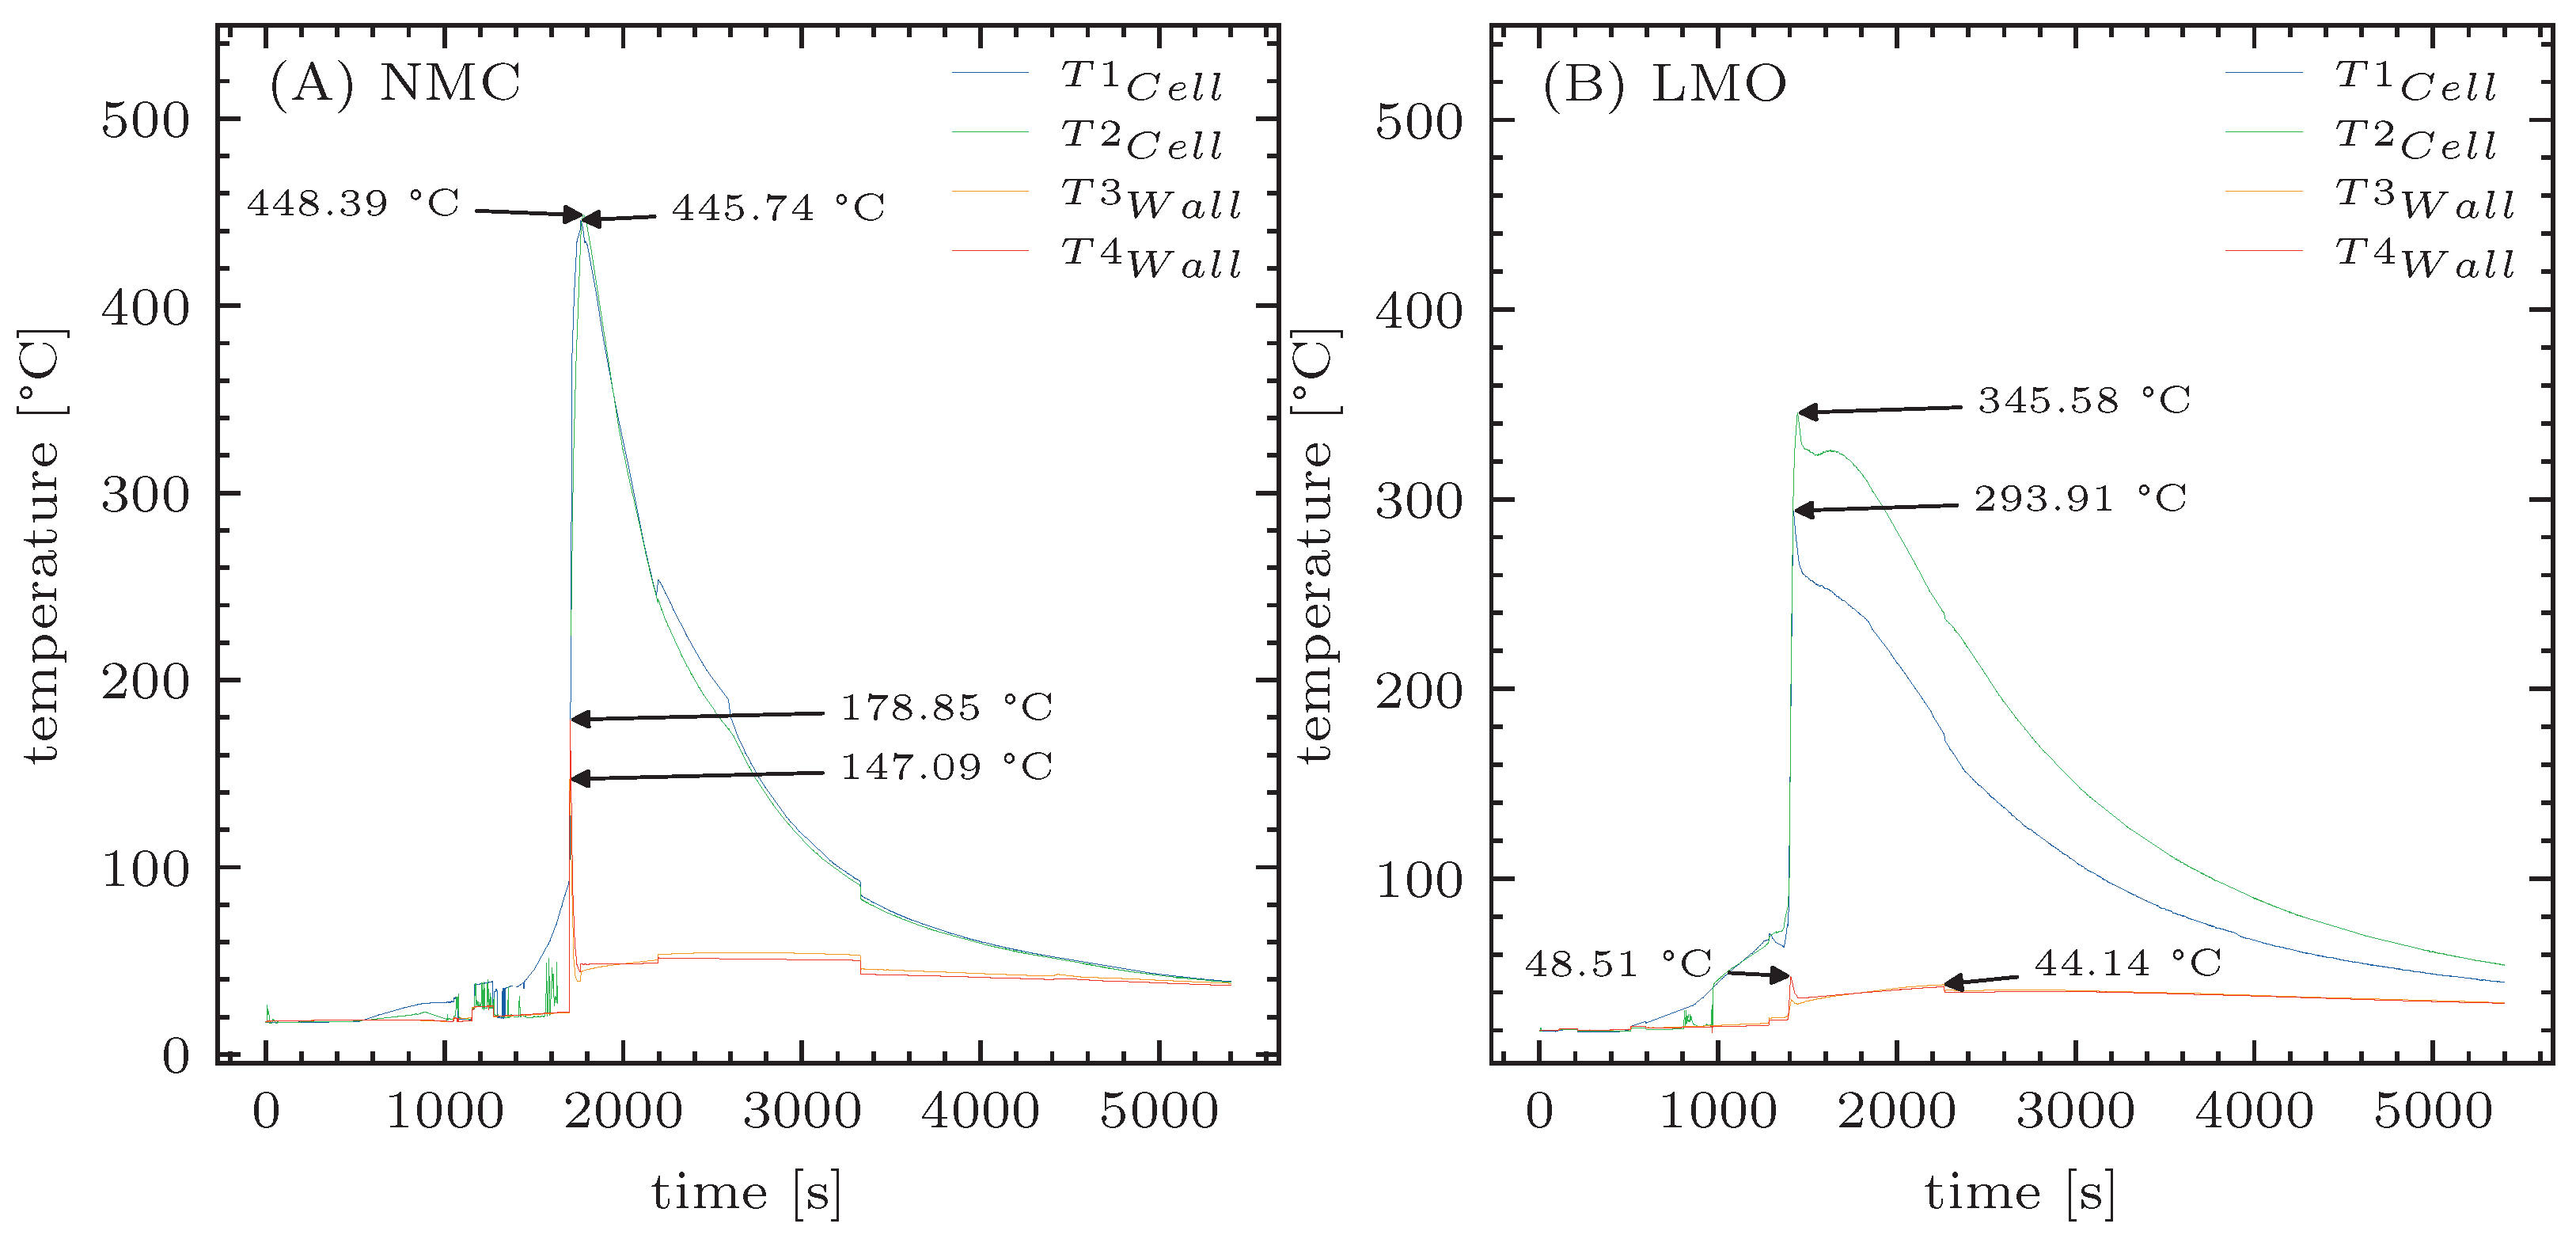
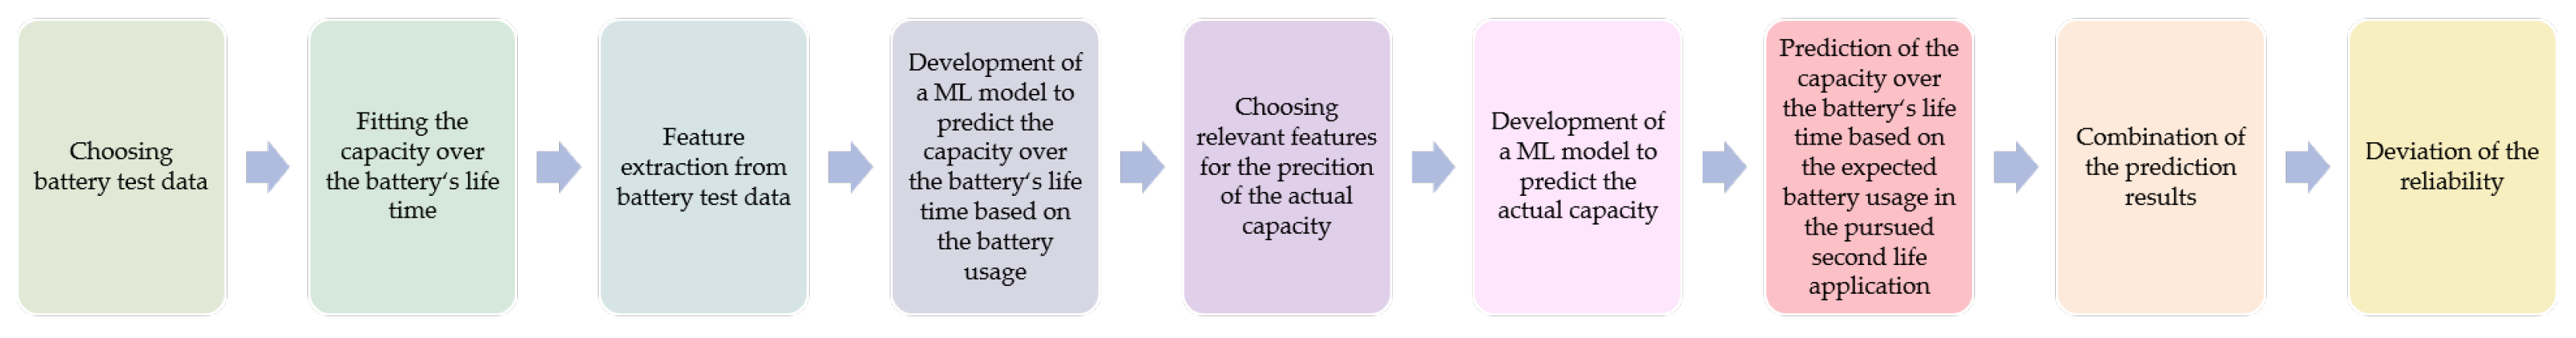
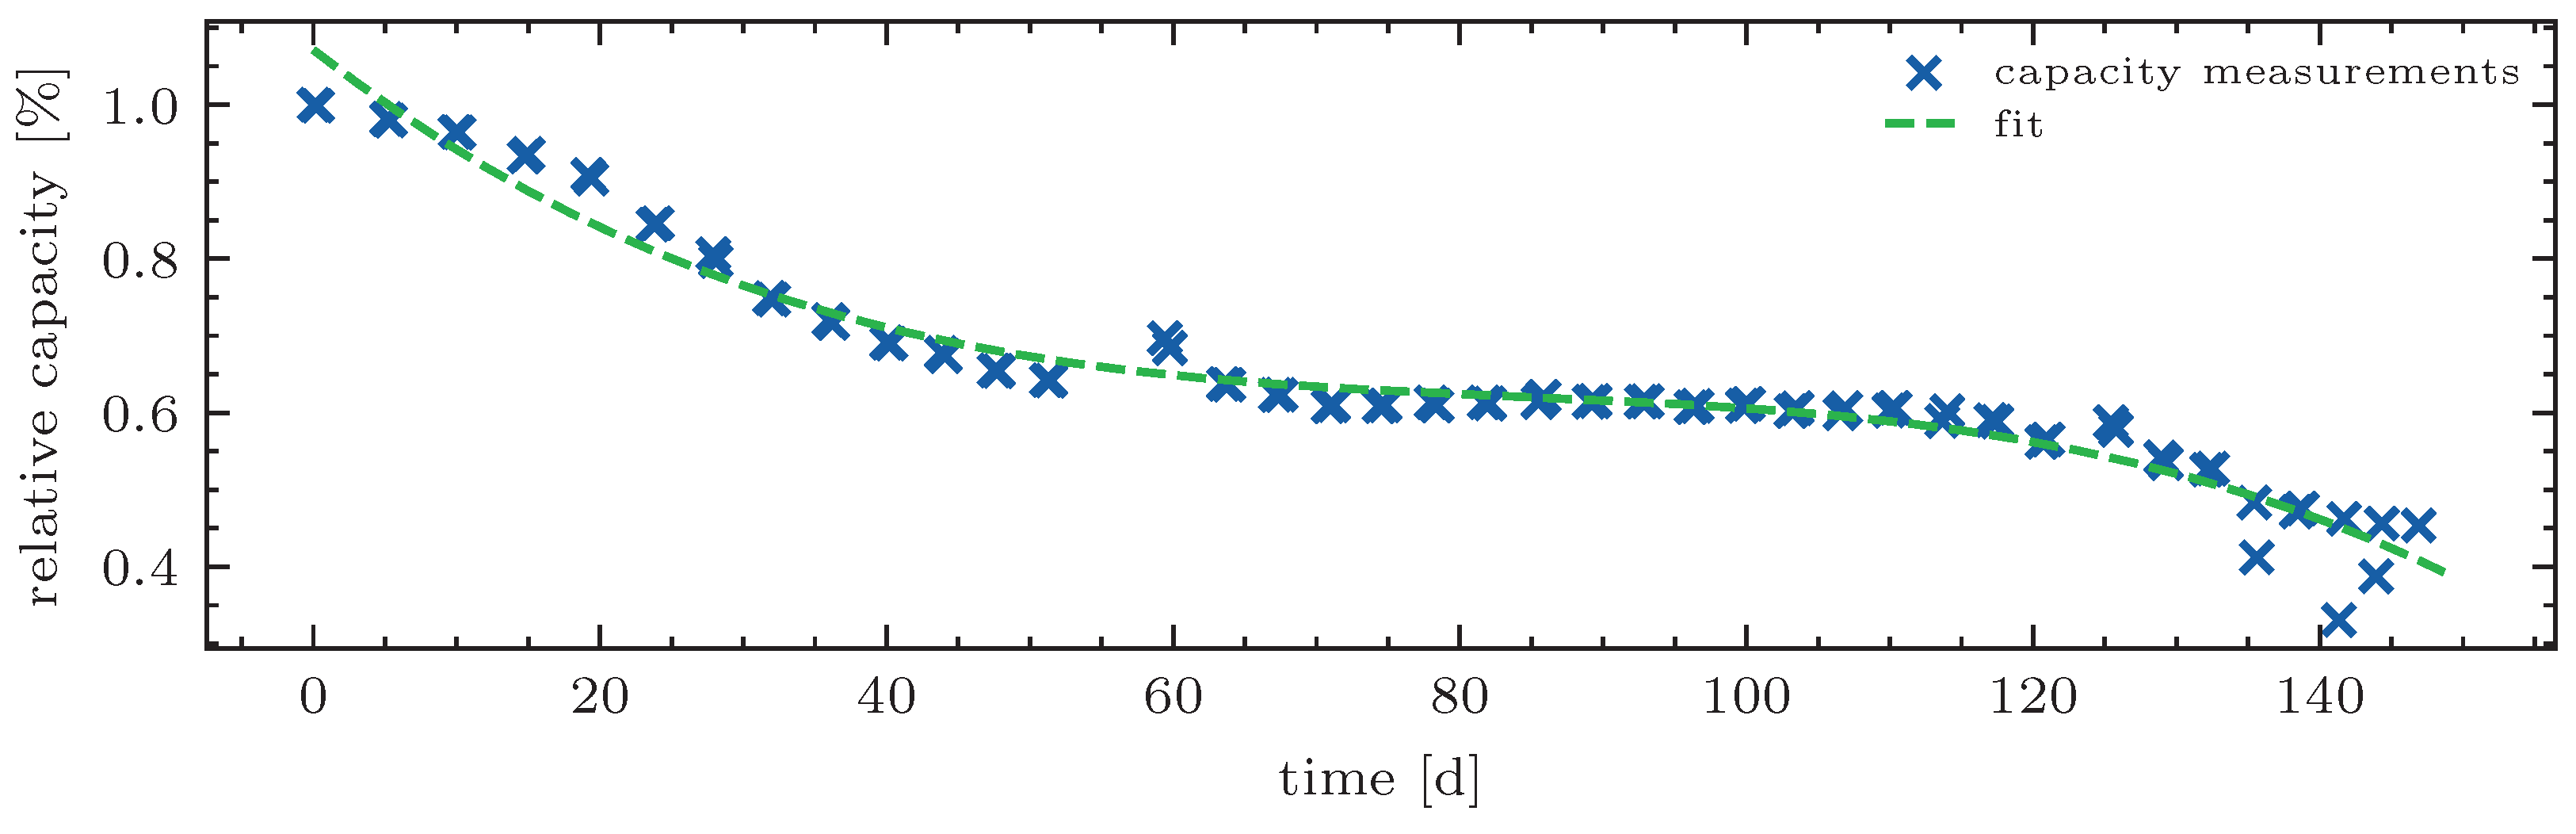
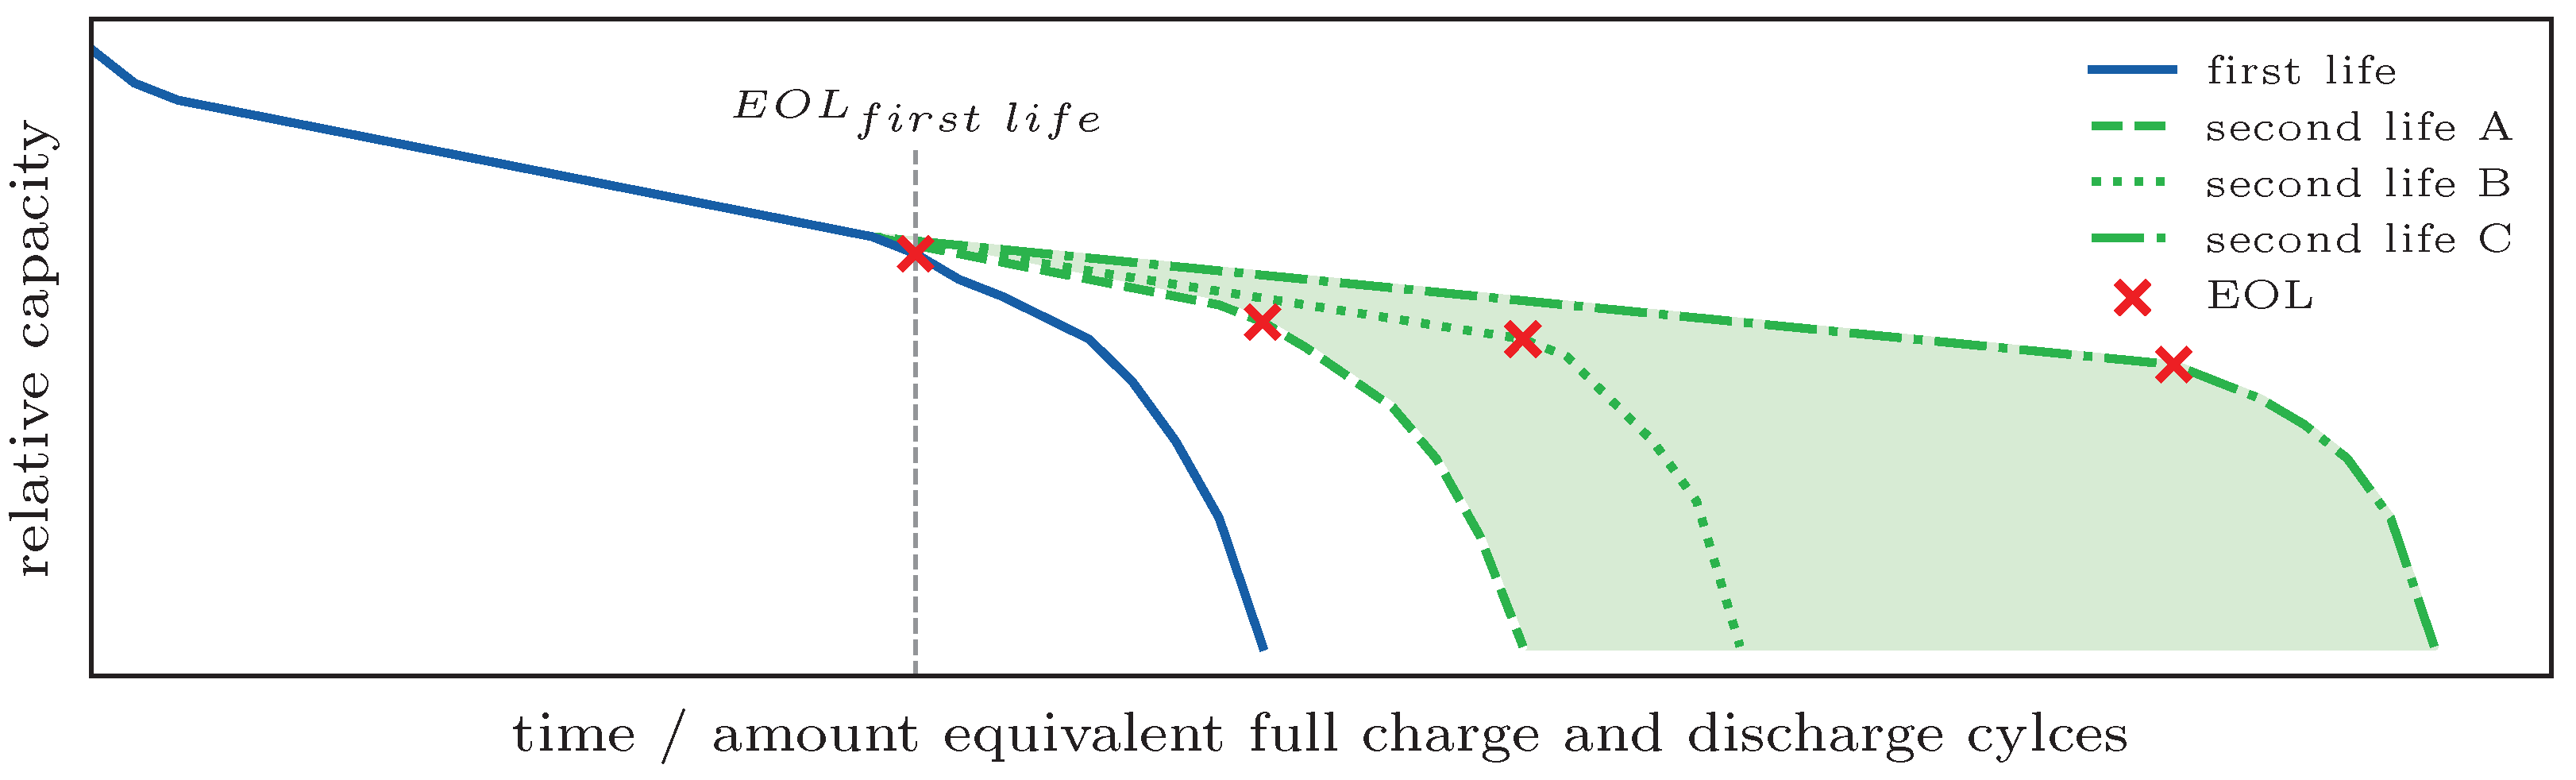
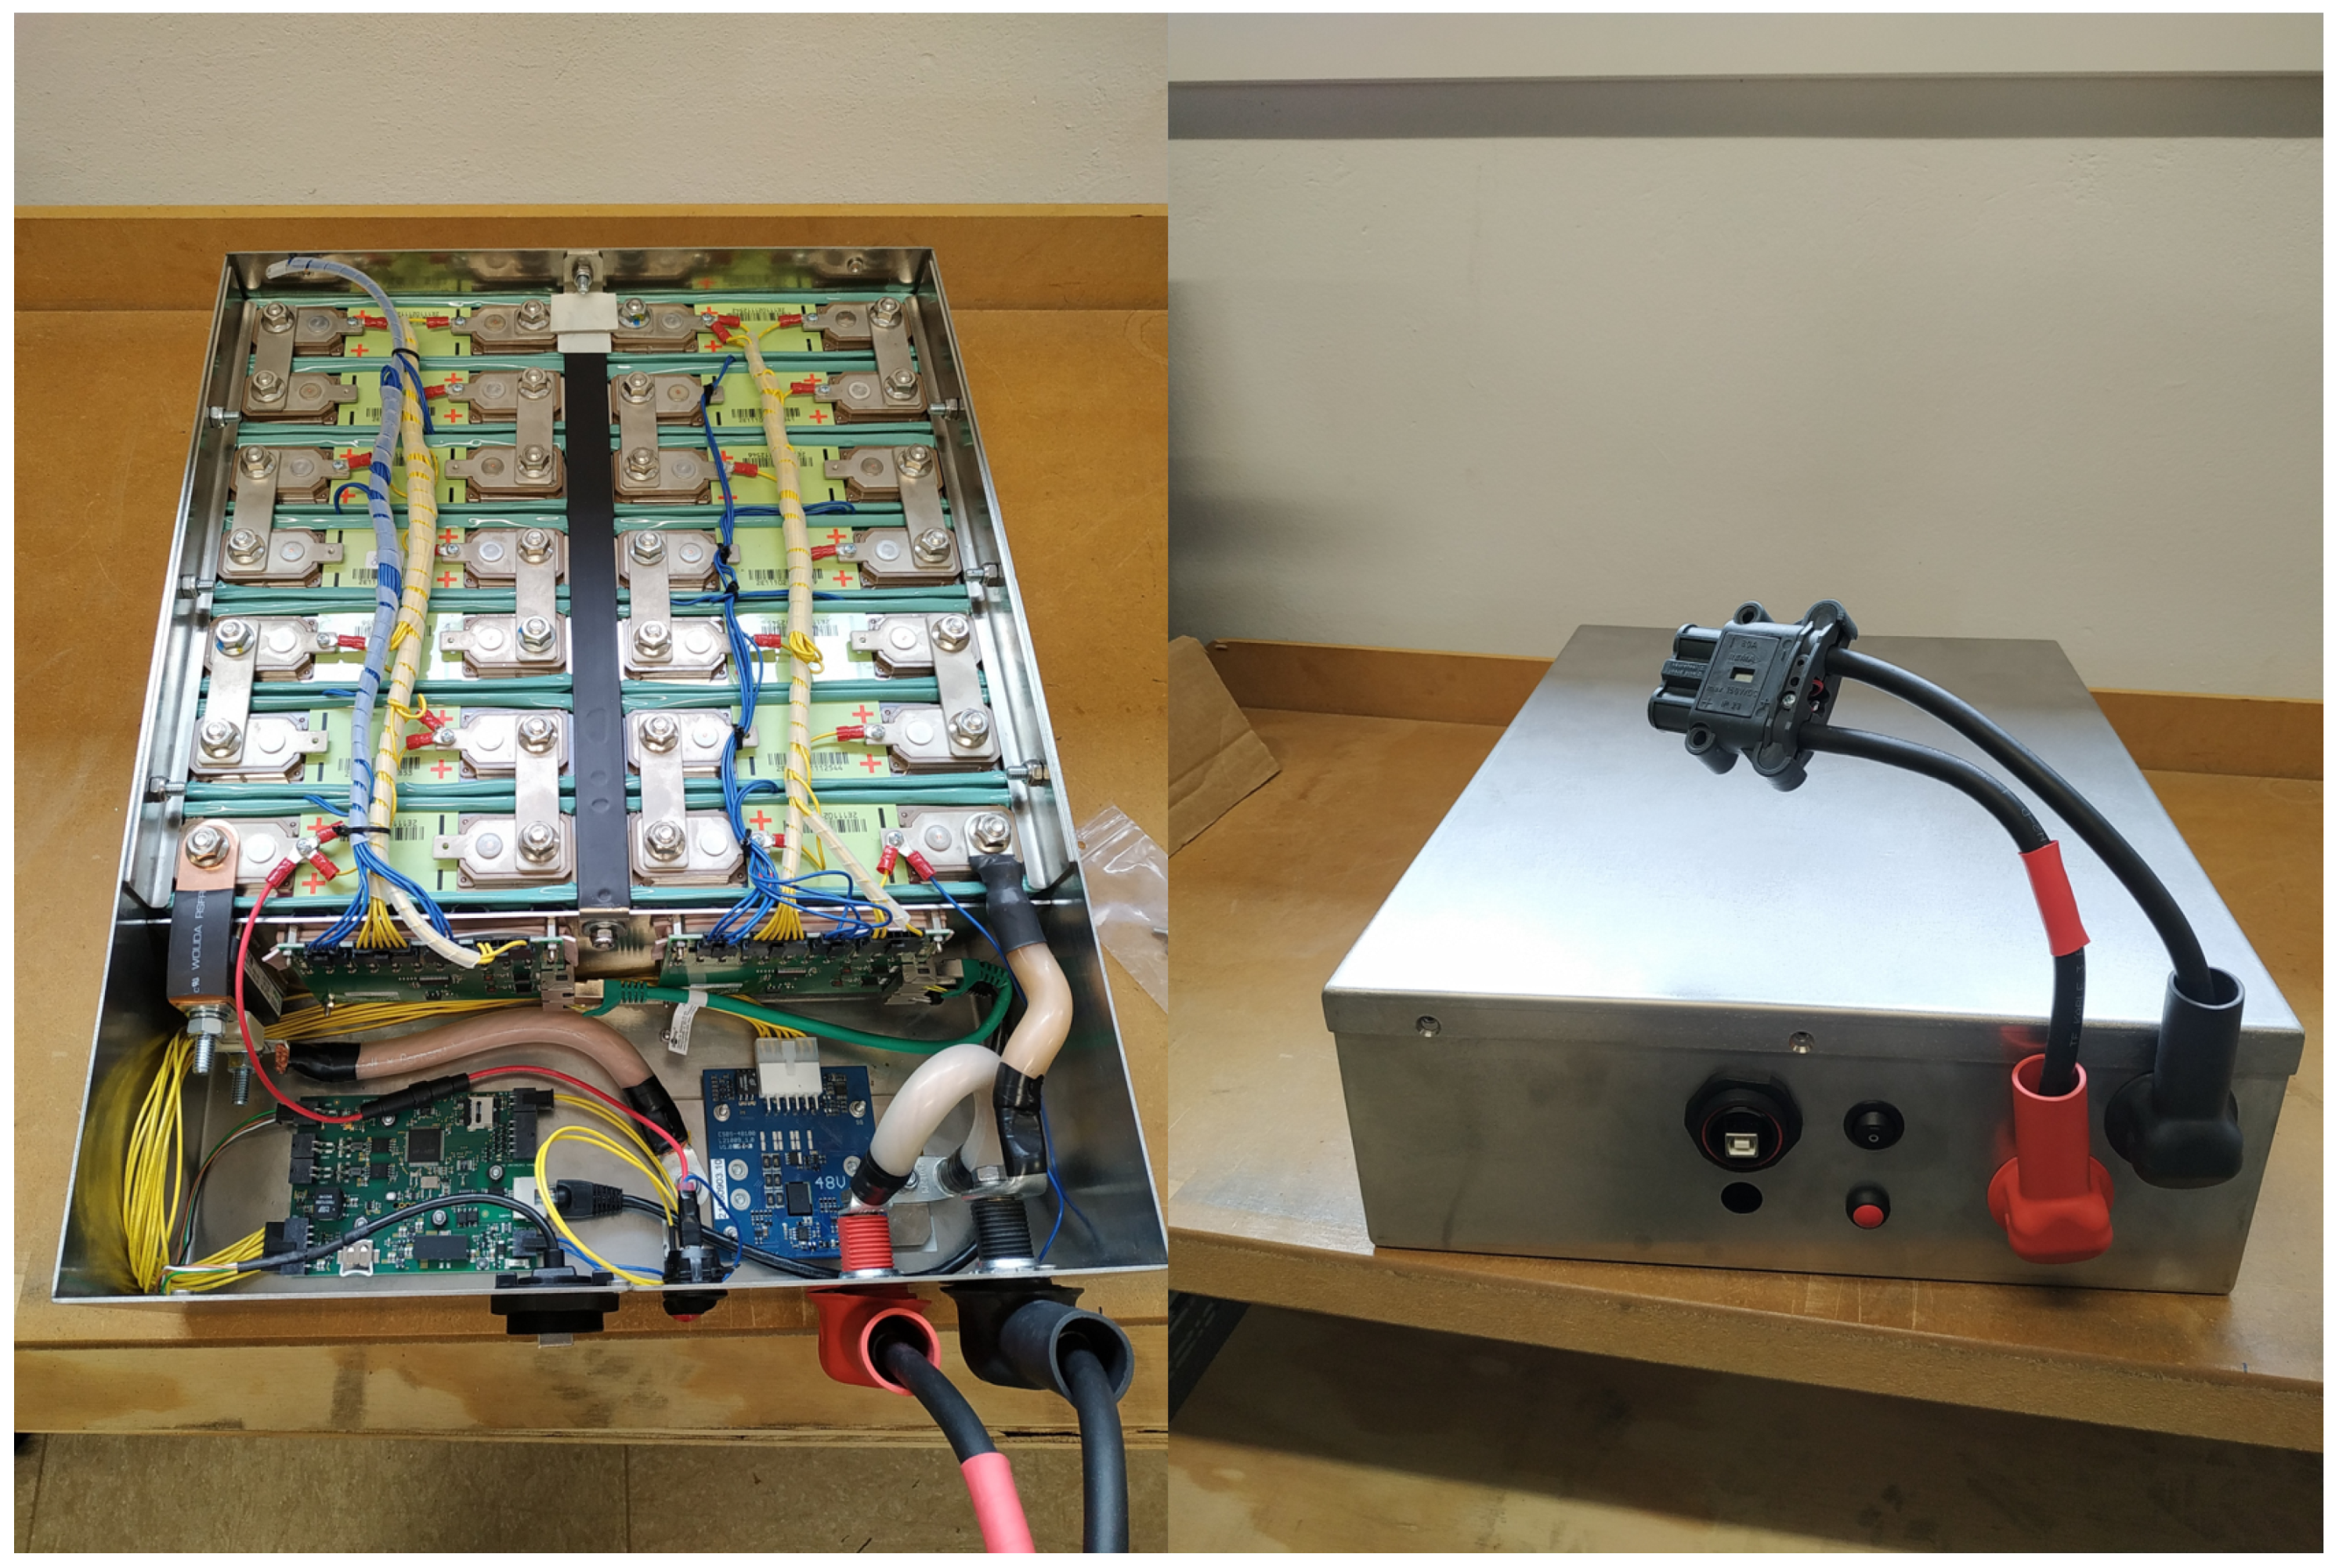
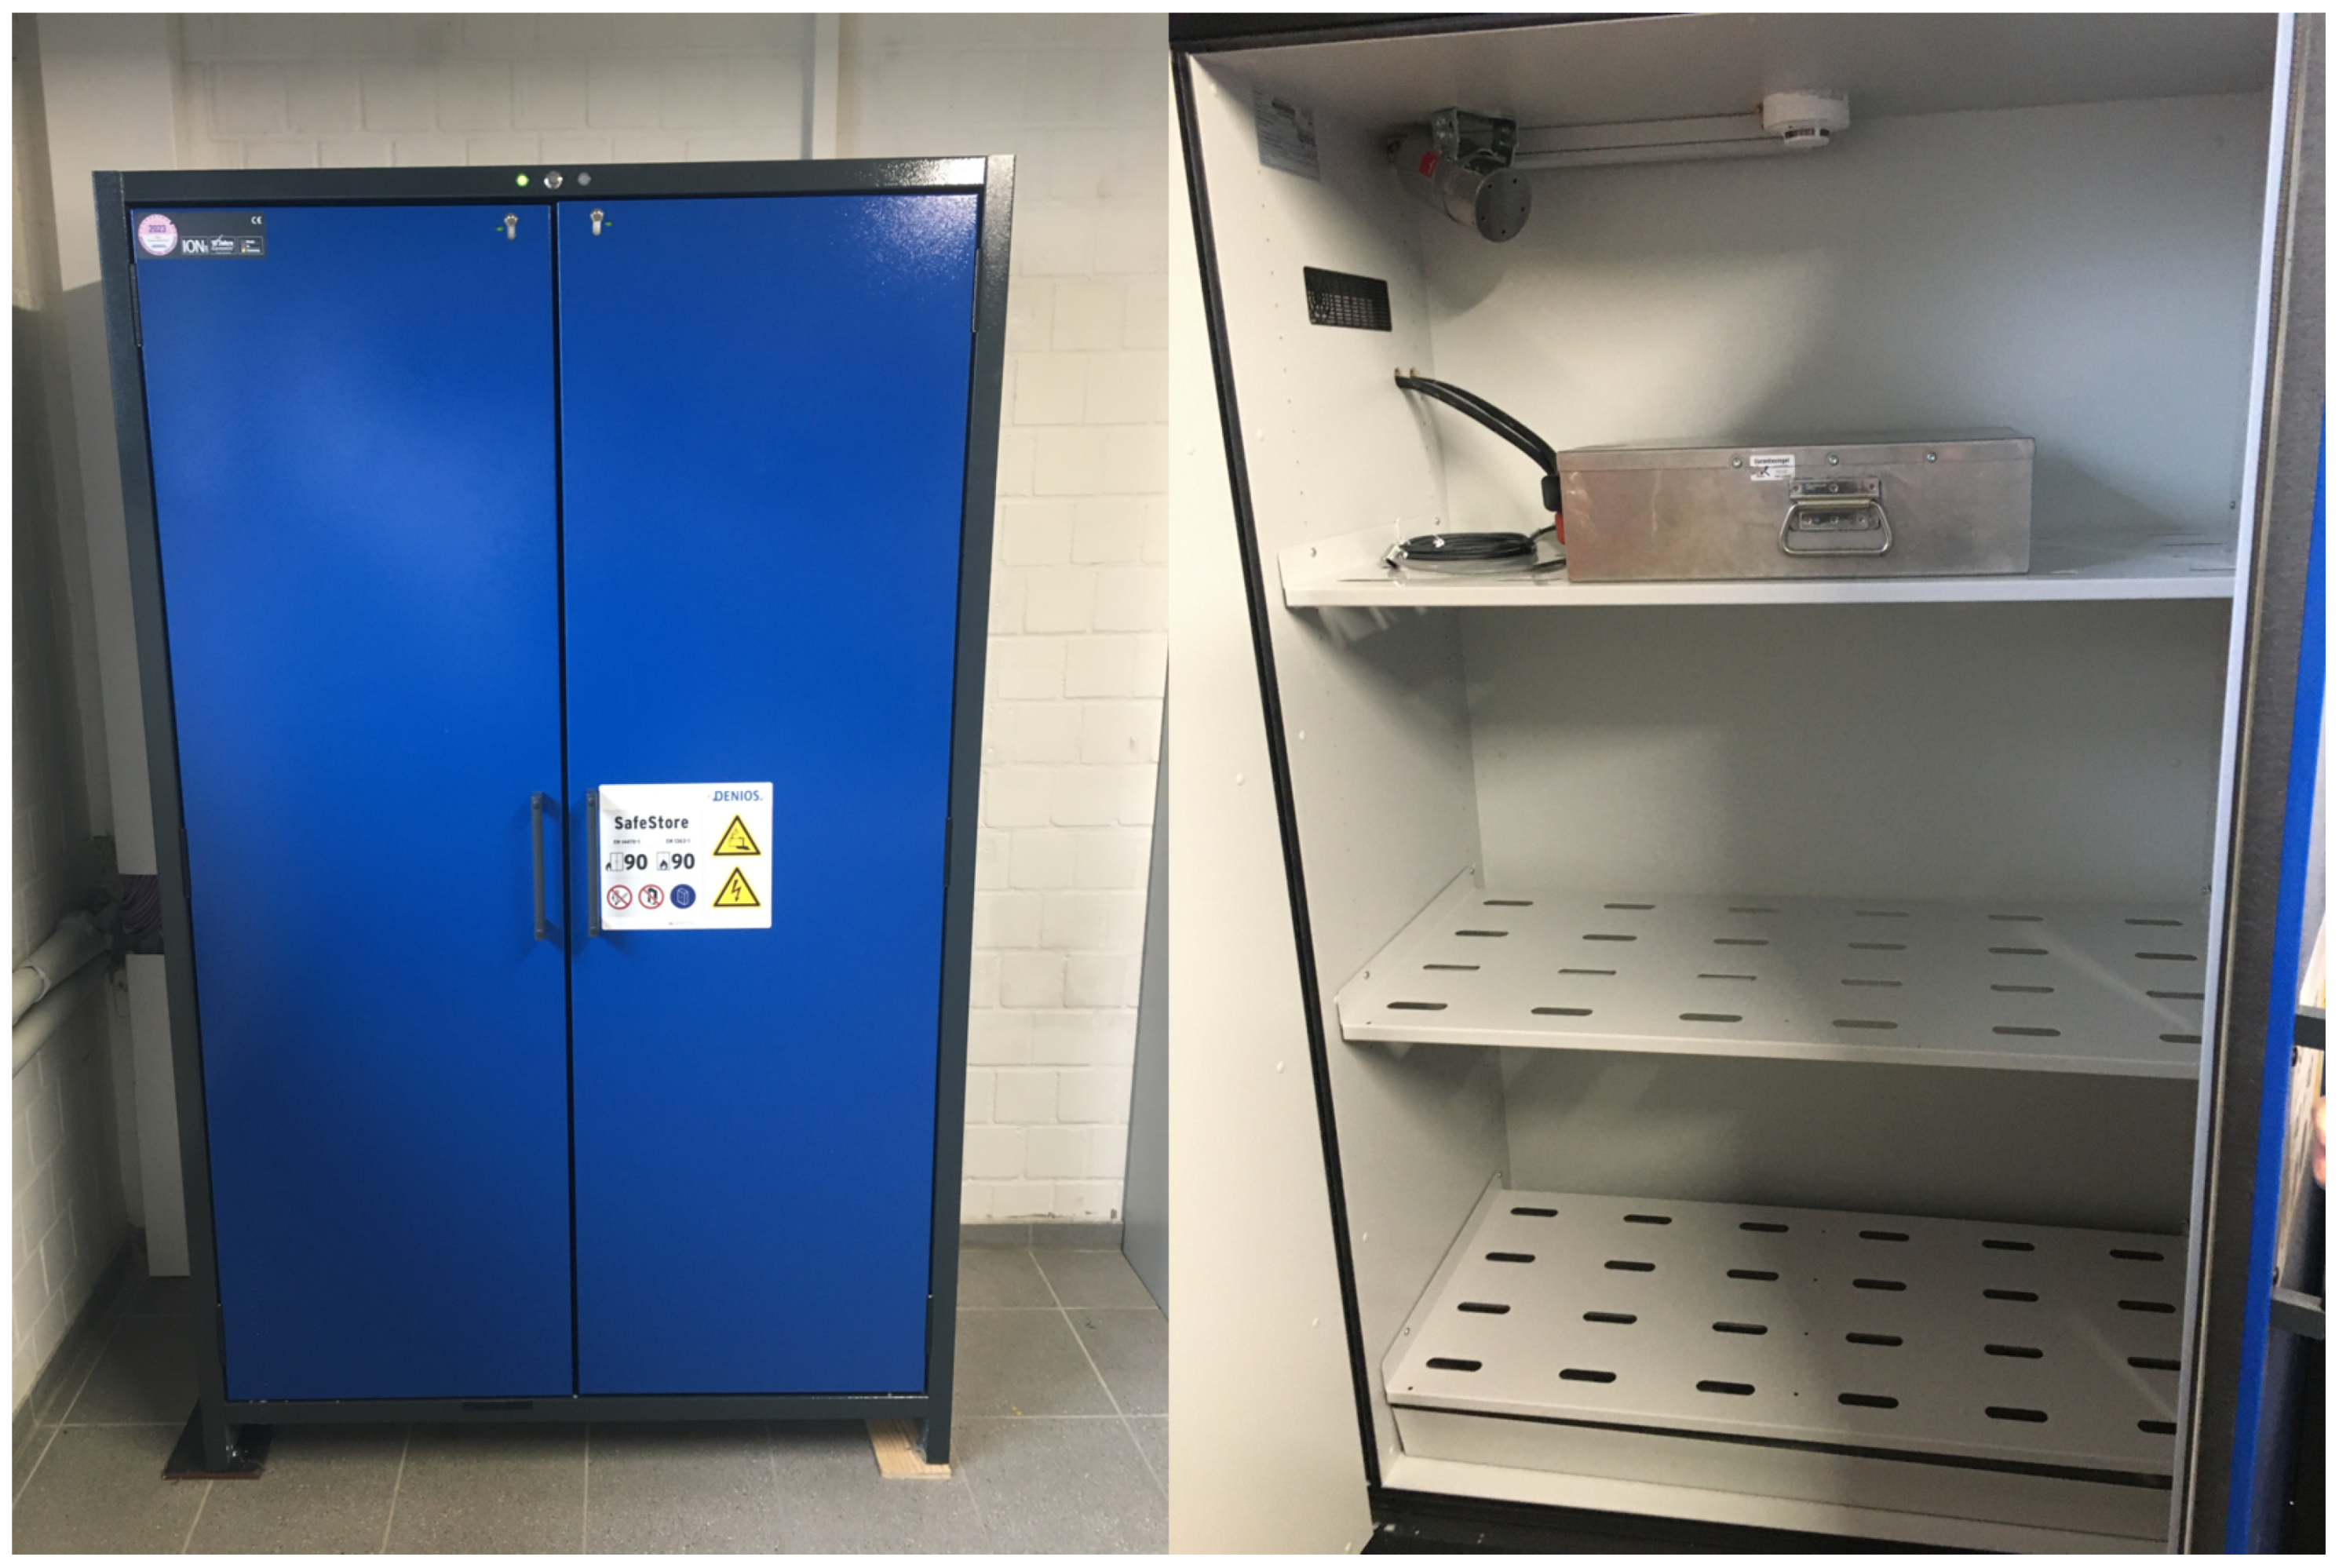
Disclaimer/Publisher’s Note: The statements, opinions and data contained in all publications are solely those of the individual author(s) and contributor(s) and not of MDPI and/or the editor(s). MDPI and/or the editor(s) disclaim responsibility for any injury to people or property resulting from any ideas, methods, instructions or products referred to in the content. |
© 2024 by the authors. Licensee MDPI, Basel, Switzerland. This article is an open access article distributed under the terms and conditions of the Creative Commons Attribution (CC BY) license (https://creativecommons.org/licenses/by/4.0/).