Article

Analysis of the Characteristics and Driving Mechanisms of Carbon Emission Decoupling in the Hu-Bao-O-Yu City Cluster under the “Double Carbon” Target

School of Economics and Management, Beijing Forestry University, Beijing 100107, China
*
Author to whom correspondence should be addressed.
Sustainability 2024, 16(17), 7290; https://doi.org/10.3390/su16177290 (registering DOI)
Submission received: 22 July 2024 / Revised: 21 August 2024 / Accepted: 21 August 2024 / Published: 24 August 2024

Abstract

:
The Hu-Bao-O-Yu urban area is a major source of carbon emissions in China. It is also a major source of energy exports and high-end chemicals in China. Reaching peak carbon emissions early is especially important for meeting the national peak goal. For urban areas that rely on natural resources, we need to make it clearer how carbon emissions and economic growth affect each other and slowly break the strong link between the two. Therefore, in this paper, based on the data on carbon emissions, the decoupling state and the driving mechanism of carbon emissions in the Hu-Bao-O-Yu City group are researched by using the Tapio decoupling model and GDIM method. A new decoupling index model is constructed by combining GDIM and the traditional decoupling model. The main findings are as follows: (1) The Hu-Bao-O-Yu urban agglomeration, Ordos City, Baotou City and Yulin City have significant growth trends in annual carbon emissions, with Yulin City being the most important carbon source for the Hu-Bao-O-Yu urban agglomeration and its economic contribution to carbon emissions of the whole urban agglomeration is the most efficient. (2) The decoupling of Hu-Bao-O-Yu, Huhhot City, Baotou City, and Ordos City is dominated by expansionary negative decoupling, whereas Yulin City has strong negative decoupling. (3) The Hu-Bao-O-Yu urban cluster mainly affects the carbon intensity of fixed asset investments and output carbon intensity, which is a key part of the carbon separation process. The energy scale and structure also play a part in this process over time. (4) Changes in GDP per capita are a bigger part of changes in carbon emissions in the Hu-Bao-O-Yu urban agglomeration. These changes also determine the direction for changes in carbon emissions in the Hu-Bao-O-Yu urban agglomeration. In the future, the Hu-Bao-O-Yu urban agglomeration needs to coordinate its economic growth. Ordos and Yulin need to speed up the optimisation and transformation of their energy structures. Baotou needs to push for the low-carbon transformation of its industries. Huhhot needs to do more research on carbon sequestration technology and spend more on environmental protection. This will make the Hu-Bao-O-Yu urban agglomeration a resource-saving urban agglomeration and improve its ability to reduce emissions.

1. Introduction

The biggest non-traditional security threat to human growth is now world climate change, and the only way to stop it is through low-carbon development [1,2]. China is one of the countries most affected by climate change. It also has the world’s second-largest economy and uses twice as much energy per unit of GDP as the average country. Each person in China also emits over 40% more carbon than the average person in the world [3,4]. President Xi Jinping gave an important speech at the general debate of the seventy-fifth session of the UN General Assembly on 22 September 2020. In it, he suggested that China should try to reach a “dual-carbon” goal of carbon neutrality by 2060 and a peak in its carbon dioxide emissions by 2030 [5]. As China moves into the new normal for the economy, it has to deal with the pressures of changing its economy and cutting its carbon emissions. Resource-based regions that use too much energy as part of their development plan not only make their own growth less efficient but also damage the climate and make greenhouse gas emissions worse. When an economy becomes big enough, problems with the environment start to slow down regional growth. This makes resource-based areas become stuck in the resource advantage trap. The resource-rich areas of China are a strong base for industry economic growth, but they also release more CO2 into the air [6,7]. The best way to achieve low-carbon development right now is to make it clear how carbon emissions and economic growth affect each other and slowly move away from the strong link between the two. This way, both reducing carbon emissions and economic growth will benefit.
From physics comes the idea of decoupling, which means that there is a stable connection between variables that have a responding relationship. It is called decoupling if the response link between the variables becomes weaker or even breaks down over time [8]. The best way to achieve low-carbon development right now is to make it clear how carbon emissions and economic growth affect each other and slowly move away from the strong link between the two. This way, both reducing carbon emissions and economic growth will benefit.
From physics comes the idea of decoupling, which means that there is a stable connection between variables that have a responding relationship. It is called decoupling if the response link between the variables becomes weaker or even breaks down over time [9]. Decoupling studies are often used to figure out how economic growth affects changes in carbon emissions that happen at different times. These changes are mostly caused by the economic growth itself. Responses from the government are based on how much carbon pollution costs [8]. Decoupling studies are often used to figure out how economic growth affects changes in carbon emissions that happen at different times. These changes are mostly caused by the economic growth itself. Responses from the government based on how much carbon pollution costs [10], and the Tapio decoupling model to look at how economic growth, the amount of traffic, and carbon pollution from travel are connected in Europe [11]. and the Tapio decoupling model to look at how economic growth, the amount of traffic, and carbon pollution from travel are connected in Europe [12], is not affected by statistical scales [13], and the Tapio decoupling model to look at how economic growth, the amount of traffic, and carbon pollution from travel are connected in Europe [14]. Researchers have used this model to compare the level of decoupling in emerging and developed countries. They found that high decoupling is most common in developed countries like the UK and the US, which have already reached carbon peaking [15,16], China and other emerging countries still have weak decoupling, even though their carbon emissions are still going up [17]. In China’s provinces and towns, weak decoupling and expansionary negative decoupling are the most common types of decoupling. Strong decoupling only happens sometimes, which suggests that more efforts will be needed to reach carbon peaks.
Decoupling processes vary depending on a number of factors, including the stage of social development, the rate of economic growth, and the availability of resources [18,19]. In observational studies, this is why disconnection analysis is often conducted along with the study of how things move. To come up with good policies and measures to reduce carbon emissions, scientists need to know a lot about how economic and social development, other factors that affect decoupling, and the effects of carbon emissions work. Researchers at home and abroad have completed a lot of work on these research methods [20,21] and index selection [22,23] of carbon emission impact factors, and have obtained a lot of useful information that helps us learn more about the things that affect carbon emissions. The Logarithmic Mean Divisia Index (LMDI) is one of them. It solves the residual and zero-value problems that come with exponential decomposition analysis. It also has the benefits of complete decomposition and unique results, and it has been used a lot to look into what caused changes in carbon emissions over time. Using this method, researchers have turned the factors that affect changes in carbon emissions into a number of different markers that can be used for different types of research. They have also conducted studies on a world scale [24], regional [25], national [26], city [27] and industrial [28] scales.
There are some problems with the current index decomposition methods, like LMDI. For example, when the target variable is broken down into its product of factors, the factors tend to correlate, which can cause bias in the results. Also, it is not possible to measure the impact of multiple absolute factors at the same time, so the important factors that affect the outcome may be missed [29,30]. So, Vaninsky came up with the generalised Diels–Alder exponential decomposition method (GDIMM). This method fixes the problems with the old exponential decomposition method by taking into account how the factors affect each other and how changes in carbon emissions are affected by a number of absolute and relative factors [31], and its breakdown results show the relationship between the factors, so you don’t have to do the same sums over and over. Some researchers have been able to use the GDIM decomposition method to do useful studies [32,33]. The current study, on the other hand, is mostly focused on the business level and has not been fully applied at the regional level yet.
The breakdown of carbon emissions into their constituent parts helps us figure out what causes changes in carbon emissions, which in turn helps scientists come up with plans to lower carbon emissions. The study of decoupling effects can help us figure out how well the current policy for reducing carbon emissions is really working. It can also push for the policy to keep becoming better and show us how to reach our goals of reducing carbon emissions and decoupling. However, most of the literature on decoupling analyses only talks about “decoupling or not”. There are not many in-depth studies on the drivers of decoupling, which makes it hard to figure out why the decoupling effect changes and how much each factor really contributes to it. This means that government departments do not have enough theoretical support to make carbon decoupling policies. Also, most of the current research on the decoupling relationship between economic growth and carbon emissions looks at physical governance units like national or provincial areas. These have clear administrative divisions, as well as the scope of authority and responsibility. They are also better at enforcing policies. On the other hand, urban agglomerations are a virtual governance unit that has flexible boundaries and encourages cooperation within themselves. They are an important way for China to compete on a global scale and have a unique advantage when it comes to managing the trans-regional governance of carbon emission reduction [34]. Using city clusters as a research unit, it is important to look into the decoupling relationship between economic growth and carbon emissions, as well as the driving mechanism and come up with ways for city clusters to reduce their carbon emissions. This is both theoretically and practically important for encouraging cross-regional collaboration on emission reduction [35].
The Hu-Bao-O-Yu urban agglomeration growth plan (the “Plan”) was officially passed by the State Council in 2018 and will be put into action until 2035. It is clear from the Plan that the Hu-Bao-O-Yu urban agglomeration is “a national high-end energy and chemical base, a strategic fulcrum for opening up to the north and west, an ecological civilisation cooperation and co-construction zone in the northwest, and a pioneer zone for urban-rural integration and development in ethnic areas.” This shows that the State wants to encourage the building of urban agglomerations in the central and western regions and that academics need to do timely studies. Before, researchers who looked at how the Hu-Bao-O-Yu urban area affects carbon emissions mostly completed large-scale strategy studies [36,37]. As part of regional integration, it is important to look into not only the emission reduction pathways that work for the Hu-Bao-O-Yu urban agglomeration as a whole but also the different and unique emission reduction pathways that work for each city. This is vital in order to reach the “double carbon” goal. Because of this, in this study, we build a carbon decoupling index model using the GDIM decomposition method and build on previous studies. To figure out what causes the strong decoupling effect, the weak decoupling effect, and the non-decoupling effect of urban agglomerations.
Compared to other studies, this one only slightly adds the following: (1) This paper introduces the GDIM decomposition method to the traditional decoupling model and builds a new decoupling index model of carbon emissions. It also does an innovative job of expanding the use of the GDIM decomposition method at the regional level. It can look into the decoupling effect of carbon pollution and find out what causes it. It gives the government the theoretical backing it needs to come up with a good carbon decoupling strategy. To obtain a better idea of how technological progress actually helps reduce carbon emissions and decoupling, this study looks at three main factors: overall energy consumption, overall fixed asset investment, and industry value added. These are found to have a big impact on carbon emissions in resource-based regions. The study also compares these factors in terms of investment efficiency, energy intensity, and carbon intensity of energy use. This will help the regions come up with a more effective way to lower their emissions.

2. Materials and Methods
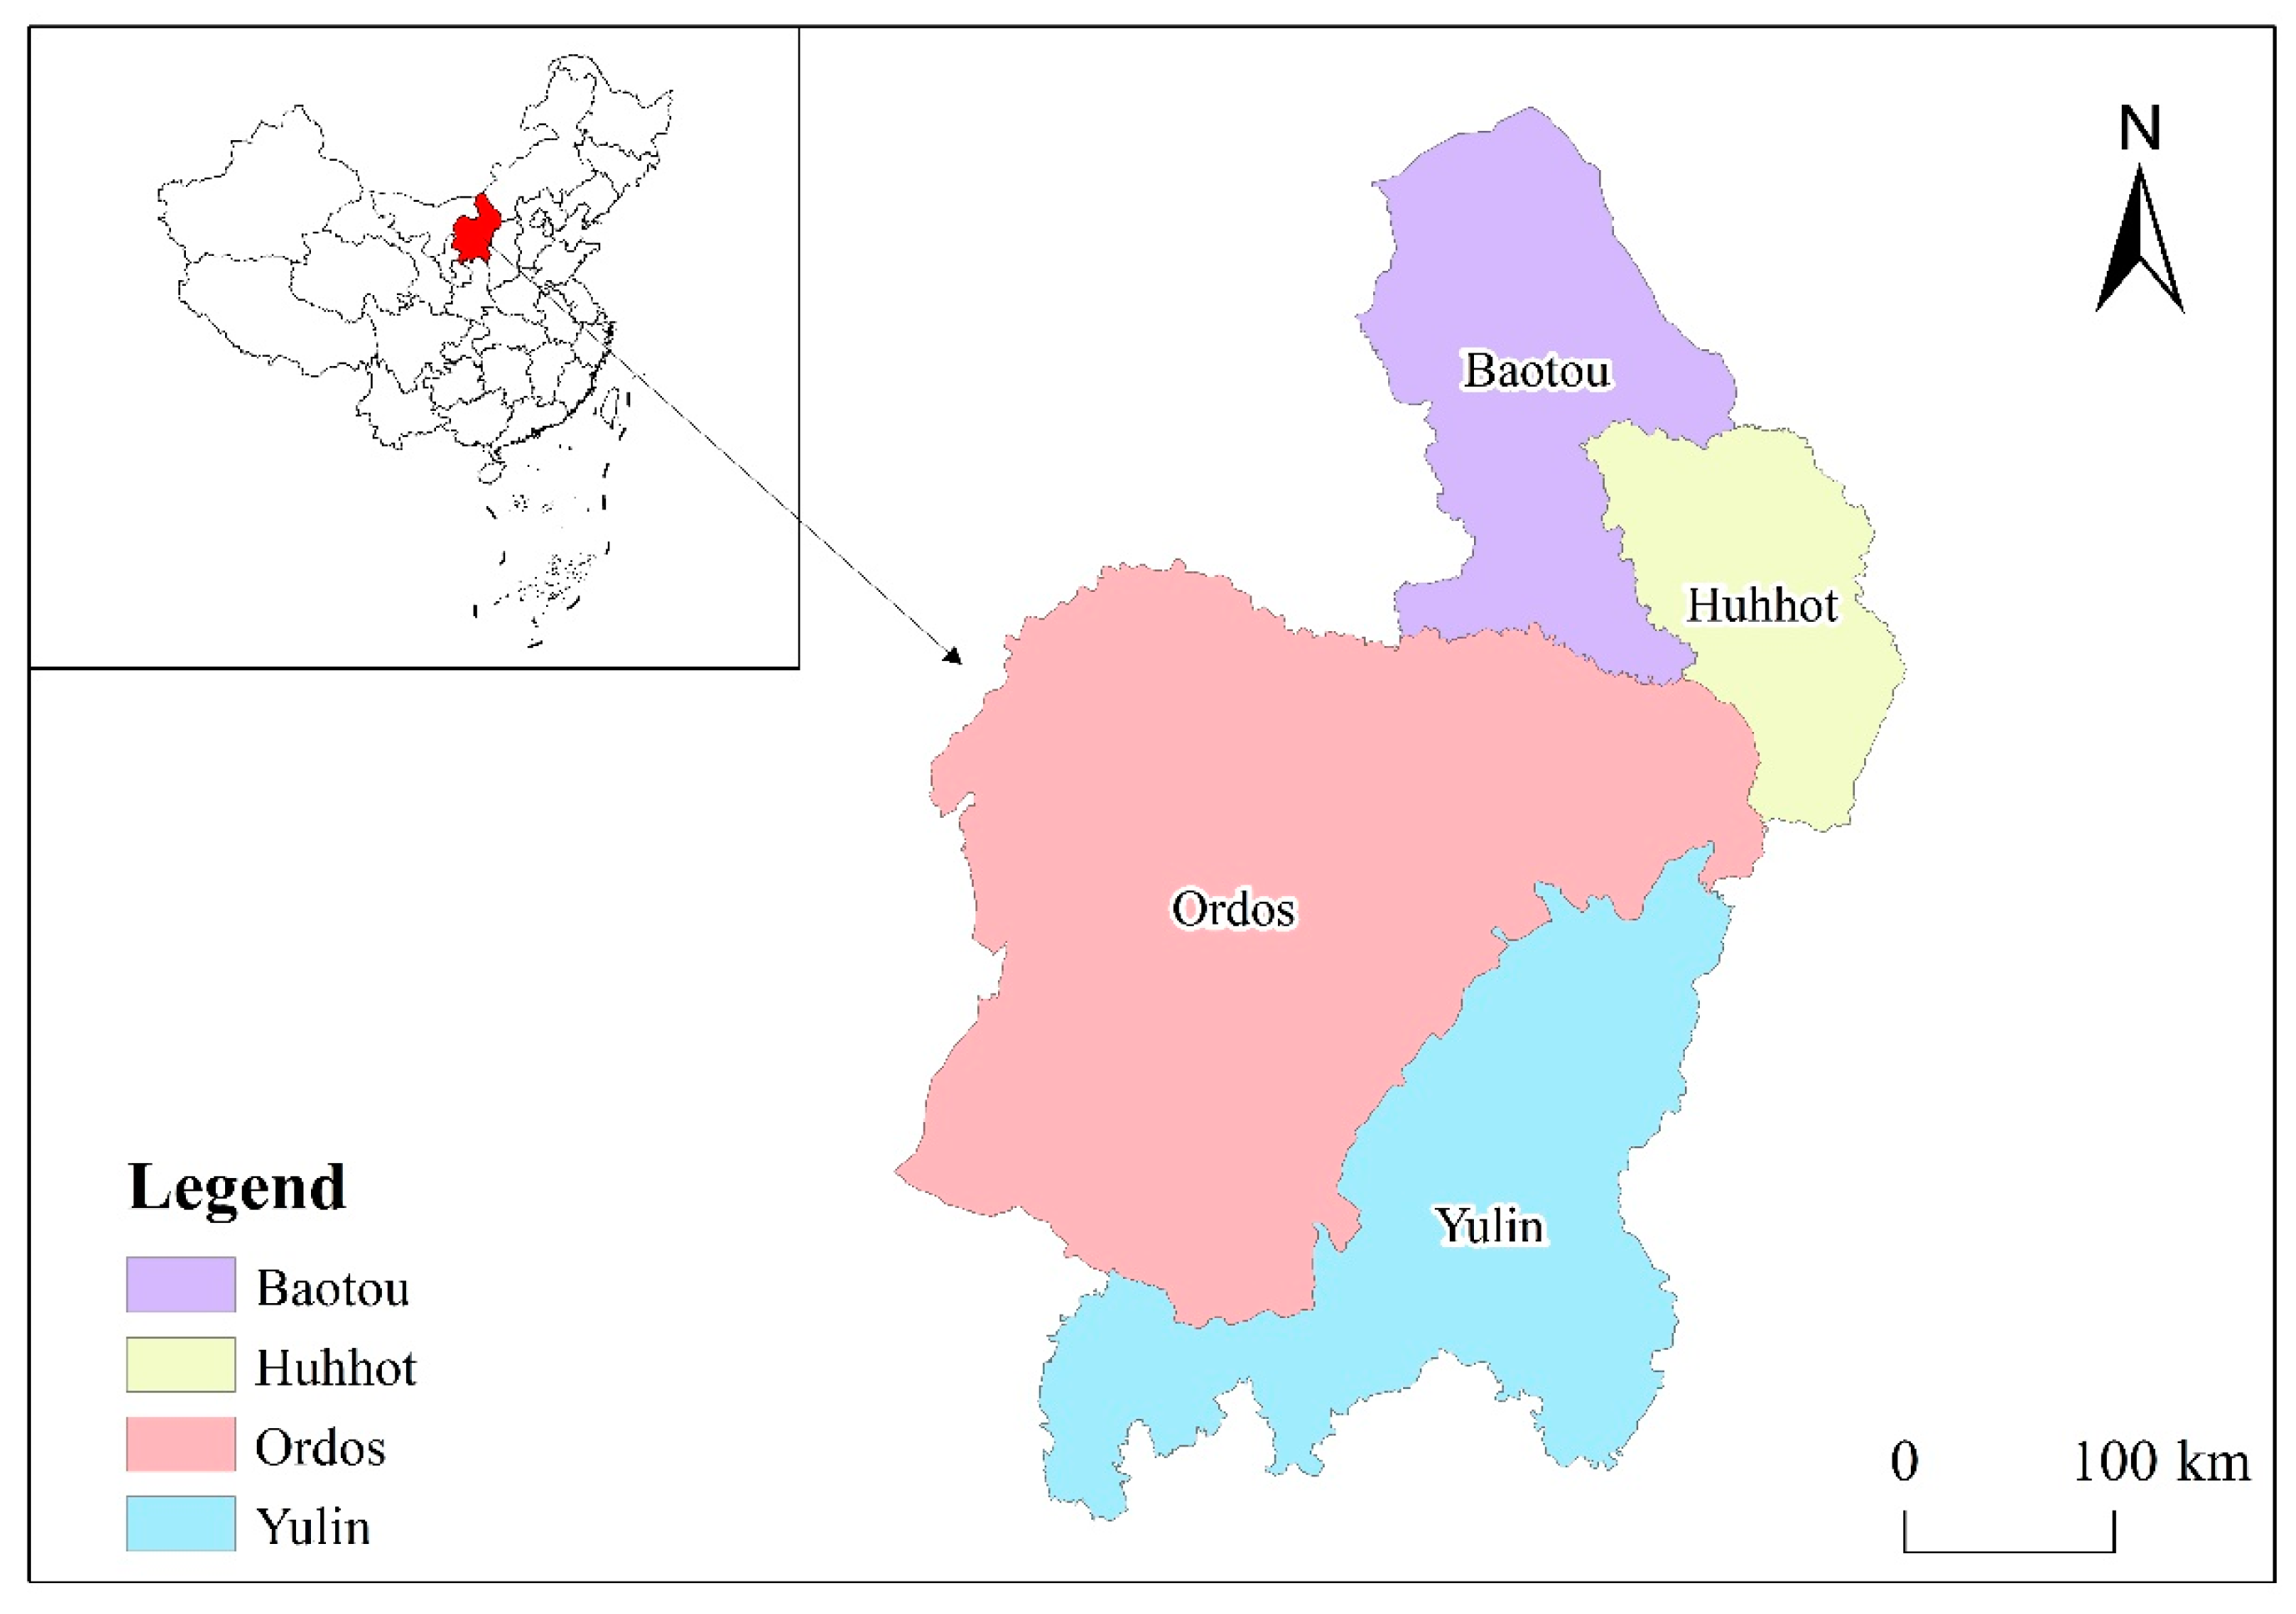
2.1. Study Area

The Hu-Bao-O-Yu urban region is in the middle of China’s northern dry zone, at 36°48′50″–42°44′5″ N, 106°28′16″–112°18′7″ E. It is in the area where farming and raising animals coexist, and it covers about 1.8% of the country’s land area [38]. While Huhhot is the region’s core city, Baotou, Ordos, and Yulin are its key node towns. The cities’ resources support each other and their ability to work together has gradually been improved [39]. The Hu-Bao-O-Yu urban agglomeration is an important energy transportation corridor in China. It also has a lot of great mineral resources and is a national hub for businesses that work with energy chemicals, rare earths, new materials, and handling agriculture and animal products [40], building the foundations for the region’s industrial and economic growth while also giving energy for other areas to grow quickly. However, the ecological risk resistance threshold of the region is low [41], and there are problems such as rough processing of raw materials and poor local conversion efficiency of energy, which lead to increasing energy carbon emissions in the city cluster. This has had a serious impact on carbon-peaking plans and carbon reduction projects. Figure 1 shows the geographical distribution of urban agglomerations.

2.2. Data Sources

For this paper, energy and carbon pollution data for towns and urban agglomerations, GDP data, coal energy consumption data, total energy consumption data, and investment data from 2005 to 2021 were used.
Data on total CO2 emissions at the municipal level were obtained from the China Carbon Emission Accounts and Datasets (CEADs) (https://www.ceads.net), some Chinese and foreign study groups put together a database to give China and other developing countries and regions carbon accounting, socioeconomic, and trade statistics on a large scale. China and other developing countries and areas’ trade, trade, and social and economic facts. The database has the longest and most complete CO2 emissions data for Chinese cities and towns. It can be used to help cities and towns make plans to reduce CO2 emissions.
The China Statistical Yearbook and the statistical yearbooks of each city are used to obtain information on GDP, coal energy use, total energy use, and investment. MATLAB software (MATLAB R2022a) was used to fill in and review the missing data to make sure the data were consistent and correct.

2.3. Research Methodology

2.3.1. Economic Contribution of Carbon Emissions

The economic contribution coefficient (ECC) of carbon emissions is used in this study to show how economically useful carbon emissions are in each town. The formula is:
E C C i = G i G / C i C
How much money does municipality i make? The answer is G. The total amount of money made in the study area is C. The amount of carbon dioxide that municipality i makes is Ci. If ECCi > 1, it means that carbon emissions in city i are pretty good for the economy. If ECCi < 1, it means that carbon emissions in the city are not very good for the economy.

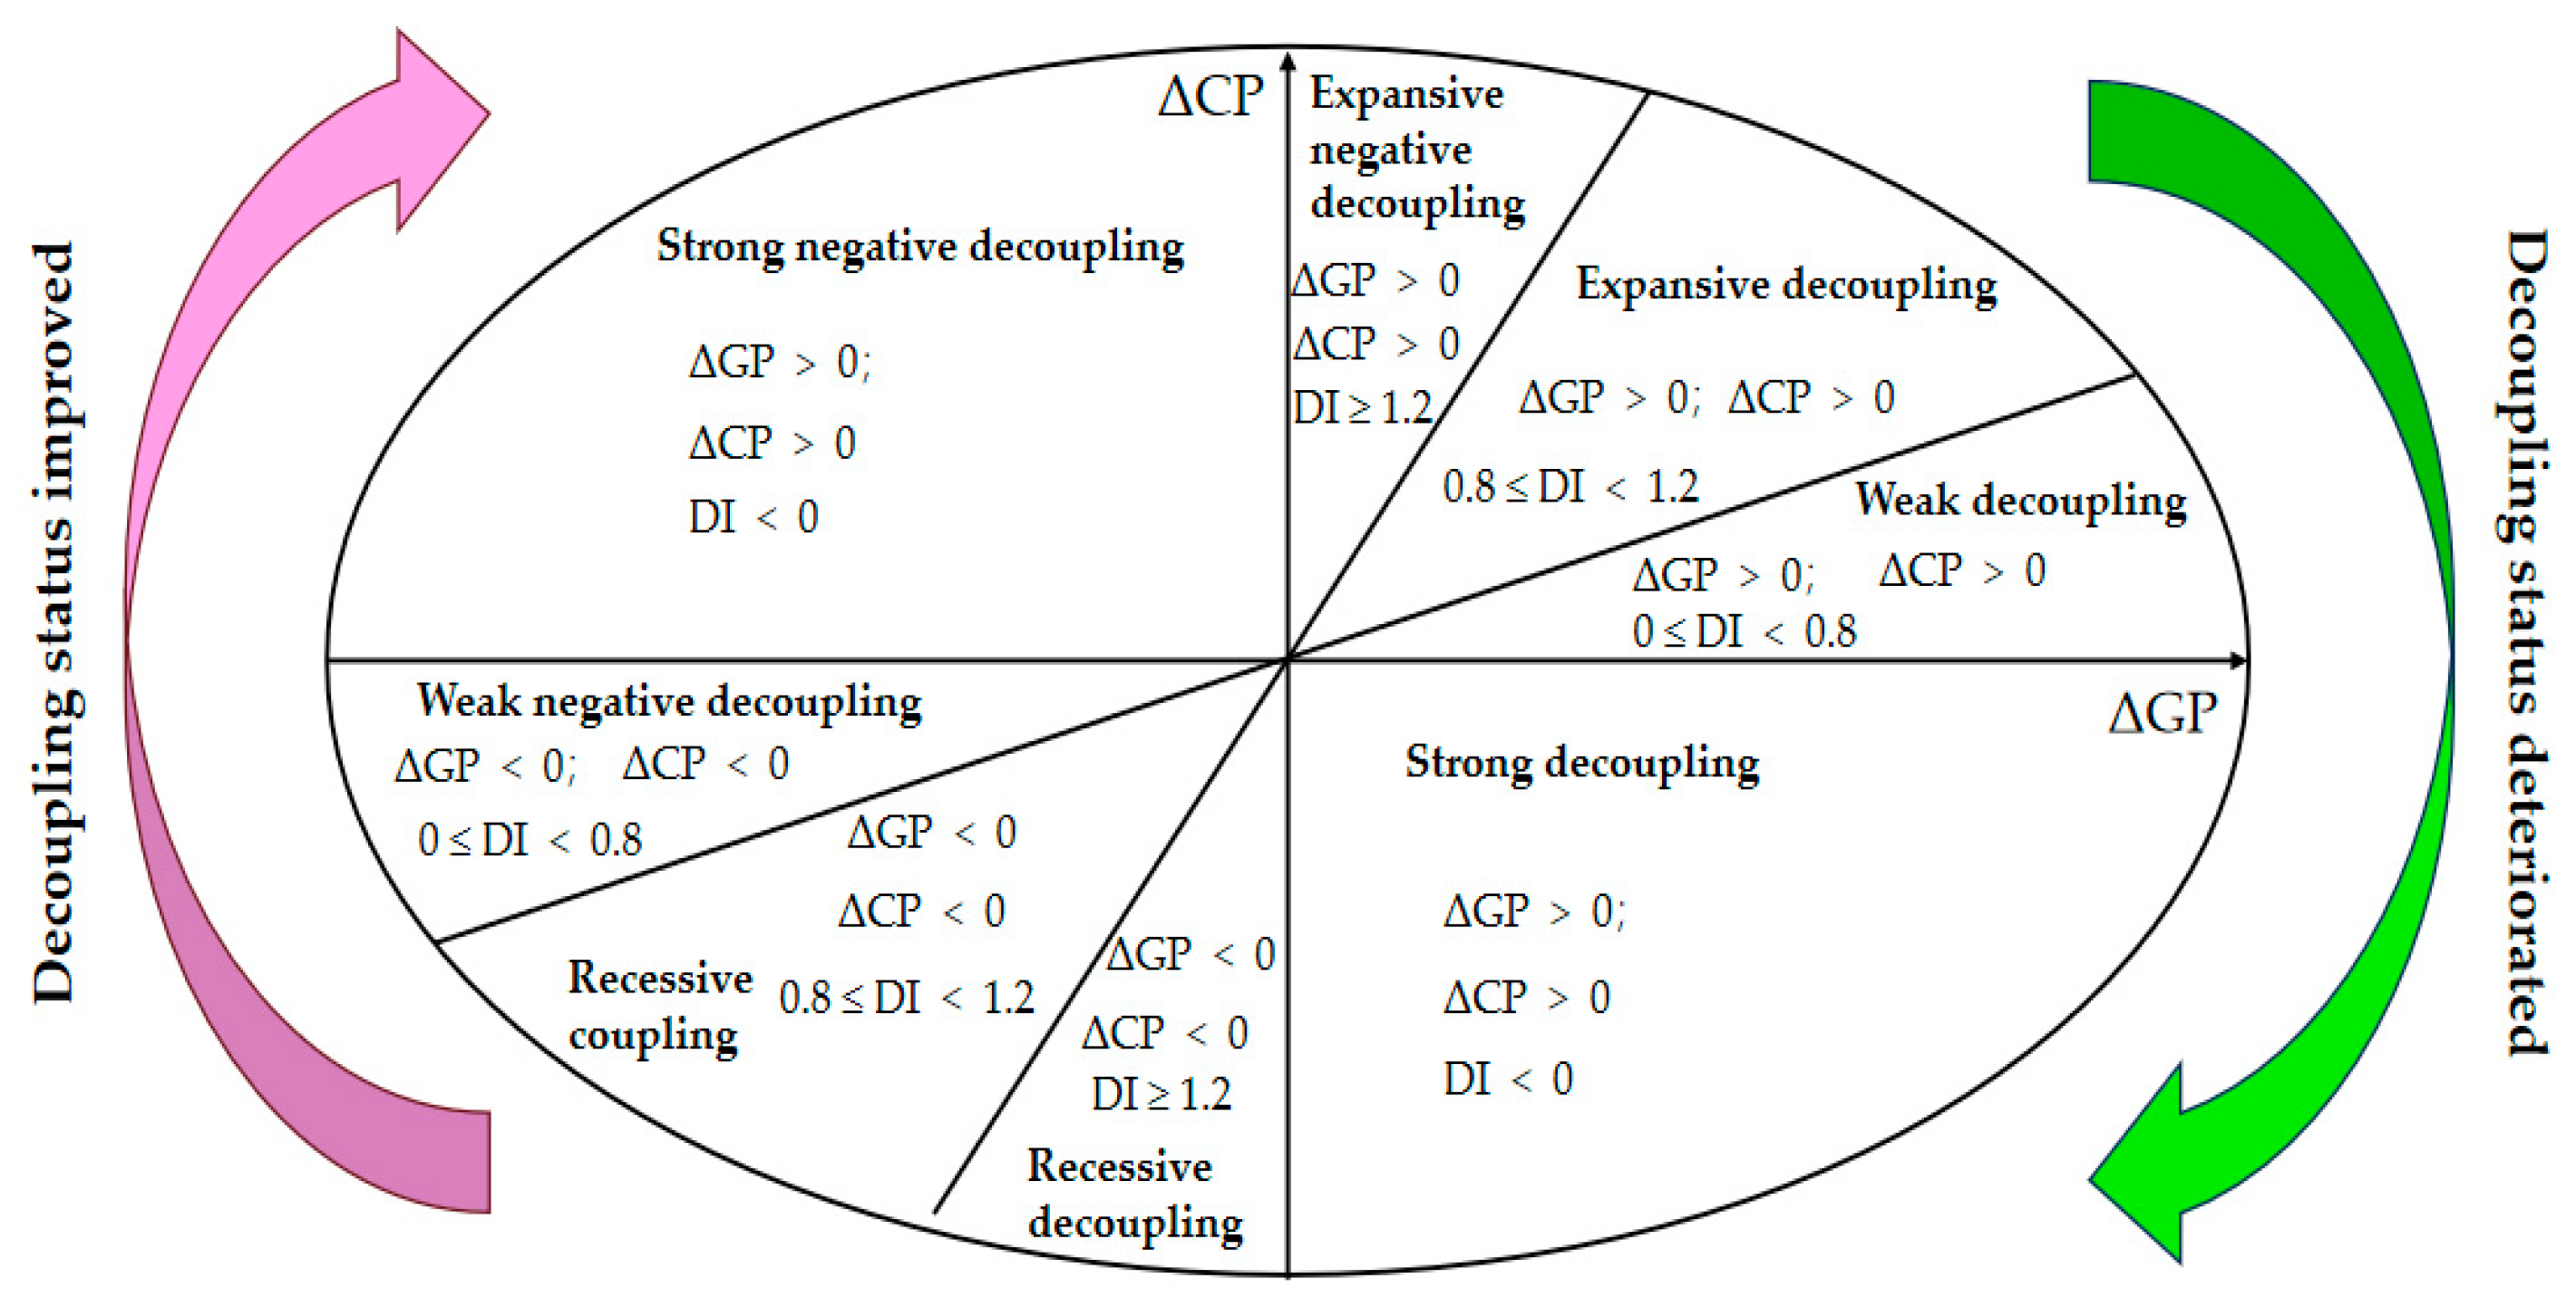
2.3.2. Tapio Decoupling Model

The Tapio decoupling model was used to figure out the carbon pollution decoupling factor for the years 2006–2021.
D I = % Δ E P % Δ D F = Δ C P / C P Δ G P / G P = C P t + 1 C P t / C P t G P t + 1 G P t / G P t
DI is the decoupling index, EP and DF are the environmental pressures and driving factors, respectively, expressed as carbon emissions per capita (CP) and GDP per capita (GP) (Figure 2). The decoupling index is the ratio of the % change in environmental pressures (ΔEP) to the % change in economic drivers (ΔDF) for the period t–t + 1.
A system of deelasticity indices is constructed and classified as decoupling (including strong decoupling, weak decoupling and recessive decoupling), negative decoupling (including strong negative decoupling, weak negative decoupling and expansive negative decoupling), and coupling (including expansive coupling and recessive coupling). (1) Strong decoupling indicates that economic growth is accompanied by a decline in carbon dioxide emissions, which is what countries expect. (2) Weak decoupling indicates that the economy and carbon emissions are growing at the same time, but the economy is growing faster than carbon emissions. (3) Recessive decoupling means that both the economy and carbon emissions are falling, but carbon emissions are falling faster. (4) Expansive negative decoupling means that carbon emissions are growing much faster than the economy, which is a less favourable scenario for reducing emissions. (5) Strong negative decoupling means that the situation is not favourable on both fronts, with carbon emissions increasing while the economy declines. (6) Weak negative decoupling indicates that as the economy declines, carbon emissions also decline, but less than the economy. (7) Expansive coupling is that carbon emissions are growing at about the same rate as the economy. (8) Recessive coupling is that carbon emissions are declining at about the same rate as the economy.

2.3.3. GDMI Method

Based on the principle of GDIM decomposition method proposed by Vaninsky, the following decomposition equations for the drivers of urban agglomeration are established
C O 2 = C O 2 G D P × G D P
C O 2 = C O 2 E n e r g y × E n e r g y
C O 2 = C O 2 I n v e s t m e n t × I n v e t s m e n t
Based on the above equation and the Table 1 The specific meaning of each variable shown, the equation is transformed into the following form.
Z = X 1 X 2 X 1 X 2 X 3 X 4 = 0 X 1 X 2 X 5 X 6 = 0 X 1 X 5 X 7 = 0 X 3 X 1 X 8 = 0
Let C(X) be the function that shows how factor X changes carbon emissions. Using the above equation, we can make a Jacobi matrix X with the factors that affect the change in emissions.
Φ X = X 2 X 2 1 X 8 X 1 X 1 0 0 X 4 0 0 1 X 3 0 0 0 0 X 6 X 7 0 0 X 5 0 0 0 0 X 5 0 0 0 0 X 1
For absolute factors X1, X3, X5, define the exponential function
Q t = Q 1 Q 0 t
Derive the equation.
d Q t d t = l n Q 1 Q 0 × Q t
According to the principle of GDIM, the change in carbon emissions (ΔC) can be decomposed into the form of a sum of the contributions of the various influencing factors.
C X / Φ = L C T I Φ X Φ + X d x
where L denotes the time span; ∇C = (X2, X1, 0, 0, 0, 0, 0, 0, 0); the elements in the row decomposition vector C X / Φ are the amount of changes in carbon emissions from the eight influencing factors that have been decomposed, and the sum of the changes in carbon emissions from these eight influencing factors is the total change in carbon emissions.
According to the generalised Diels–Alder index decomposition factor in the previous section, the change in carbon emissions C of each city in the urban agglomeration can be decomposed into the sum of eight influences, namely C G , C E , C I , C C / G , C C / E , C C / I , C G / I and C E / G . The three absolute quantity influences C G , C E and C I reflect the impact of changes in the absolute scale of output, energy consumption and investment on the changes in carbon emissions, respectively, and the other five relative quantity influences C C / G , C C / E , C C / I , C G / I and C E / G represent the changes in the degree of low carbon in the efficiency of output, respectively, changes in the structure of energy consumption, changes in the low-carbon degree of investment per unit of fixed assets, the value added to GDP per unit of fixed assets, and the impact of changes in energy intensity on changes in carbon emissions, respectively.

2.3.4. GDIM-Based Decoupling Index Modelling

Policies that aim to lower carbon pollution without hurting economic growth are called “carbon decoupling efforts”. To obtain a better idea of how well decoupling is working, you can take out carbon emissions caused by economic growth from studies of separating carbon emissions. Based on the findings of the GDIM analysis, C G and C G / I are considered as economic growth factors, and the other six factors (including C E , C I , C C / G , C C / E , C C / I and C E / G ) are considered as potential efforts to promote decoupling of carbon emissions. Therefore, the carbon emission reduction effort ( C D E ) can be expressed as the following equation.
C D E = C C G C G / I
= C E + C I + C C / G + C C / E + C C / I + C G / I + C E / G
From the method, we can see that the economic growth factor is unfavourably linked to the effort to lower carbon emissions. The economic growth factor has been separated from other factors. This is why this study comes up with a new decoupling indicator: the ratio of attempts to reduce carbon emissions to factors that affect economic growth. This is completed to find out how well policies actually work to reduce carbon emissions.
φ t = C D E C G + C G / I
where φ t is the decoupling indicator of carbon emissions. When φ t ≥ 1, it means strong decoupling effect, i.e., the driver has a facilitating effect on carbon decoupling; when 0 < φ t < 1, it means weak decoupling effect, i.e., the driver’s facilitating effect on carbon decoupling is weaker than the facilitating effect on economic growth; when φ t ≤ 0, it means there is no decoupling effect, i.e., the driver plays a hindering role in the process of carbon decoupling.
Further disaggregation yields decoupling effects across carbon reduction efforts.
φ t = C E + C I + C C / G + C C / E + C C / T + C E / G C G
= φ E + φ I + φ C G + φ C E + φ C I + φ E G
where φ E is the decoupling effect of energy consumption scale; φ I is the decoupling effect of fixed asset investment; φ C G is the decoupling effect of output carbon intensity; φ C E is the decoupling effect of carbon intensity of energy consumption (i.e., energy mix); φ C I is the decoupling effect of carbon intensity of fixed asset investment; and φ E G is the decoupling effect of energy intensity.

3. Results and Analysis

3.1. Carbon Emission Accounting Results

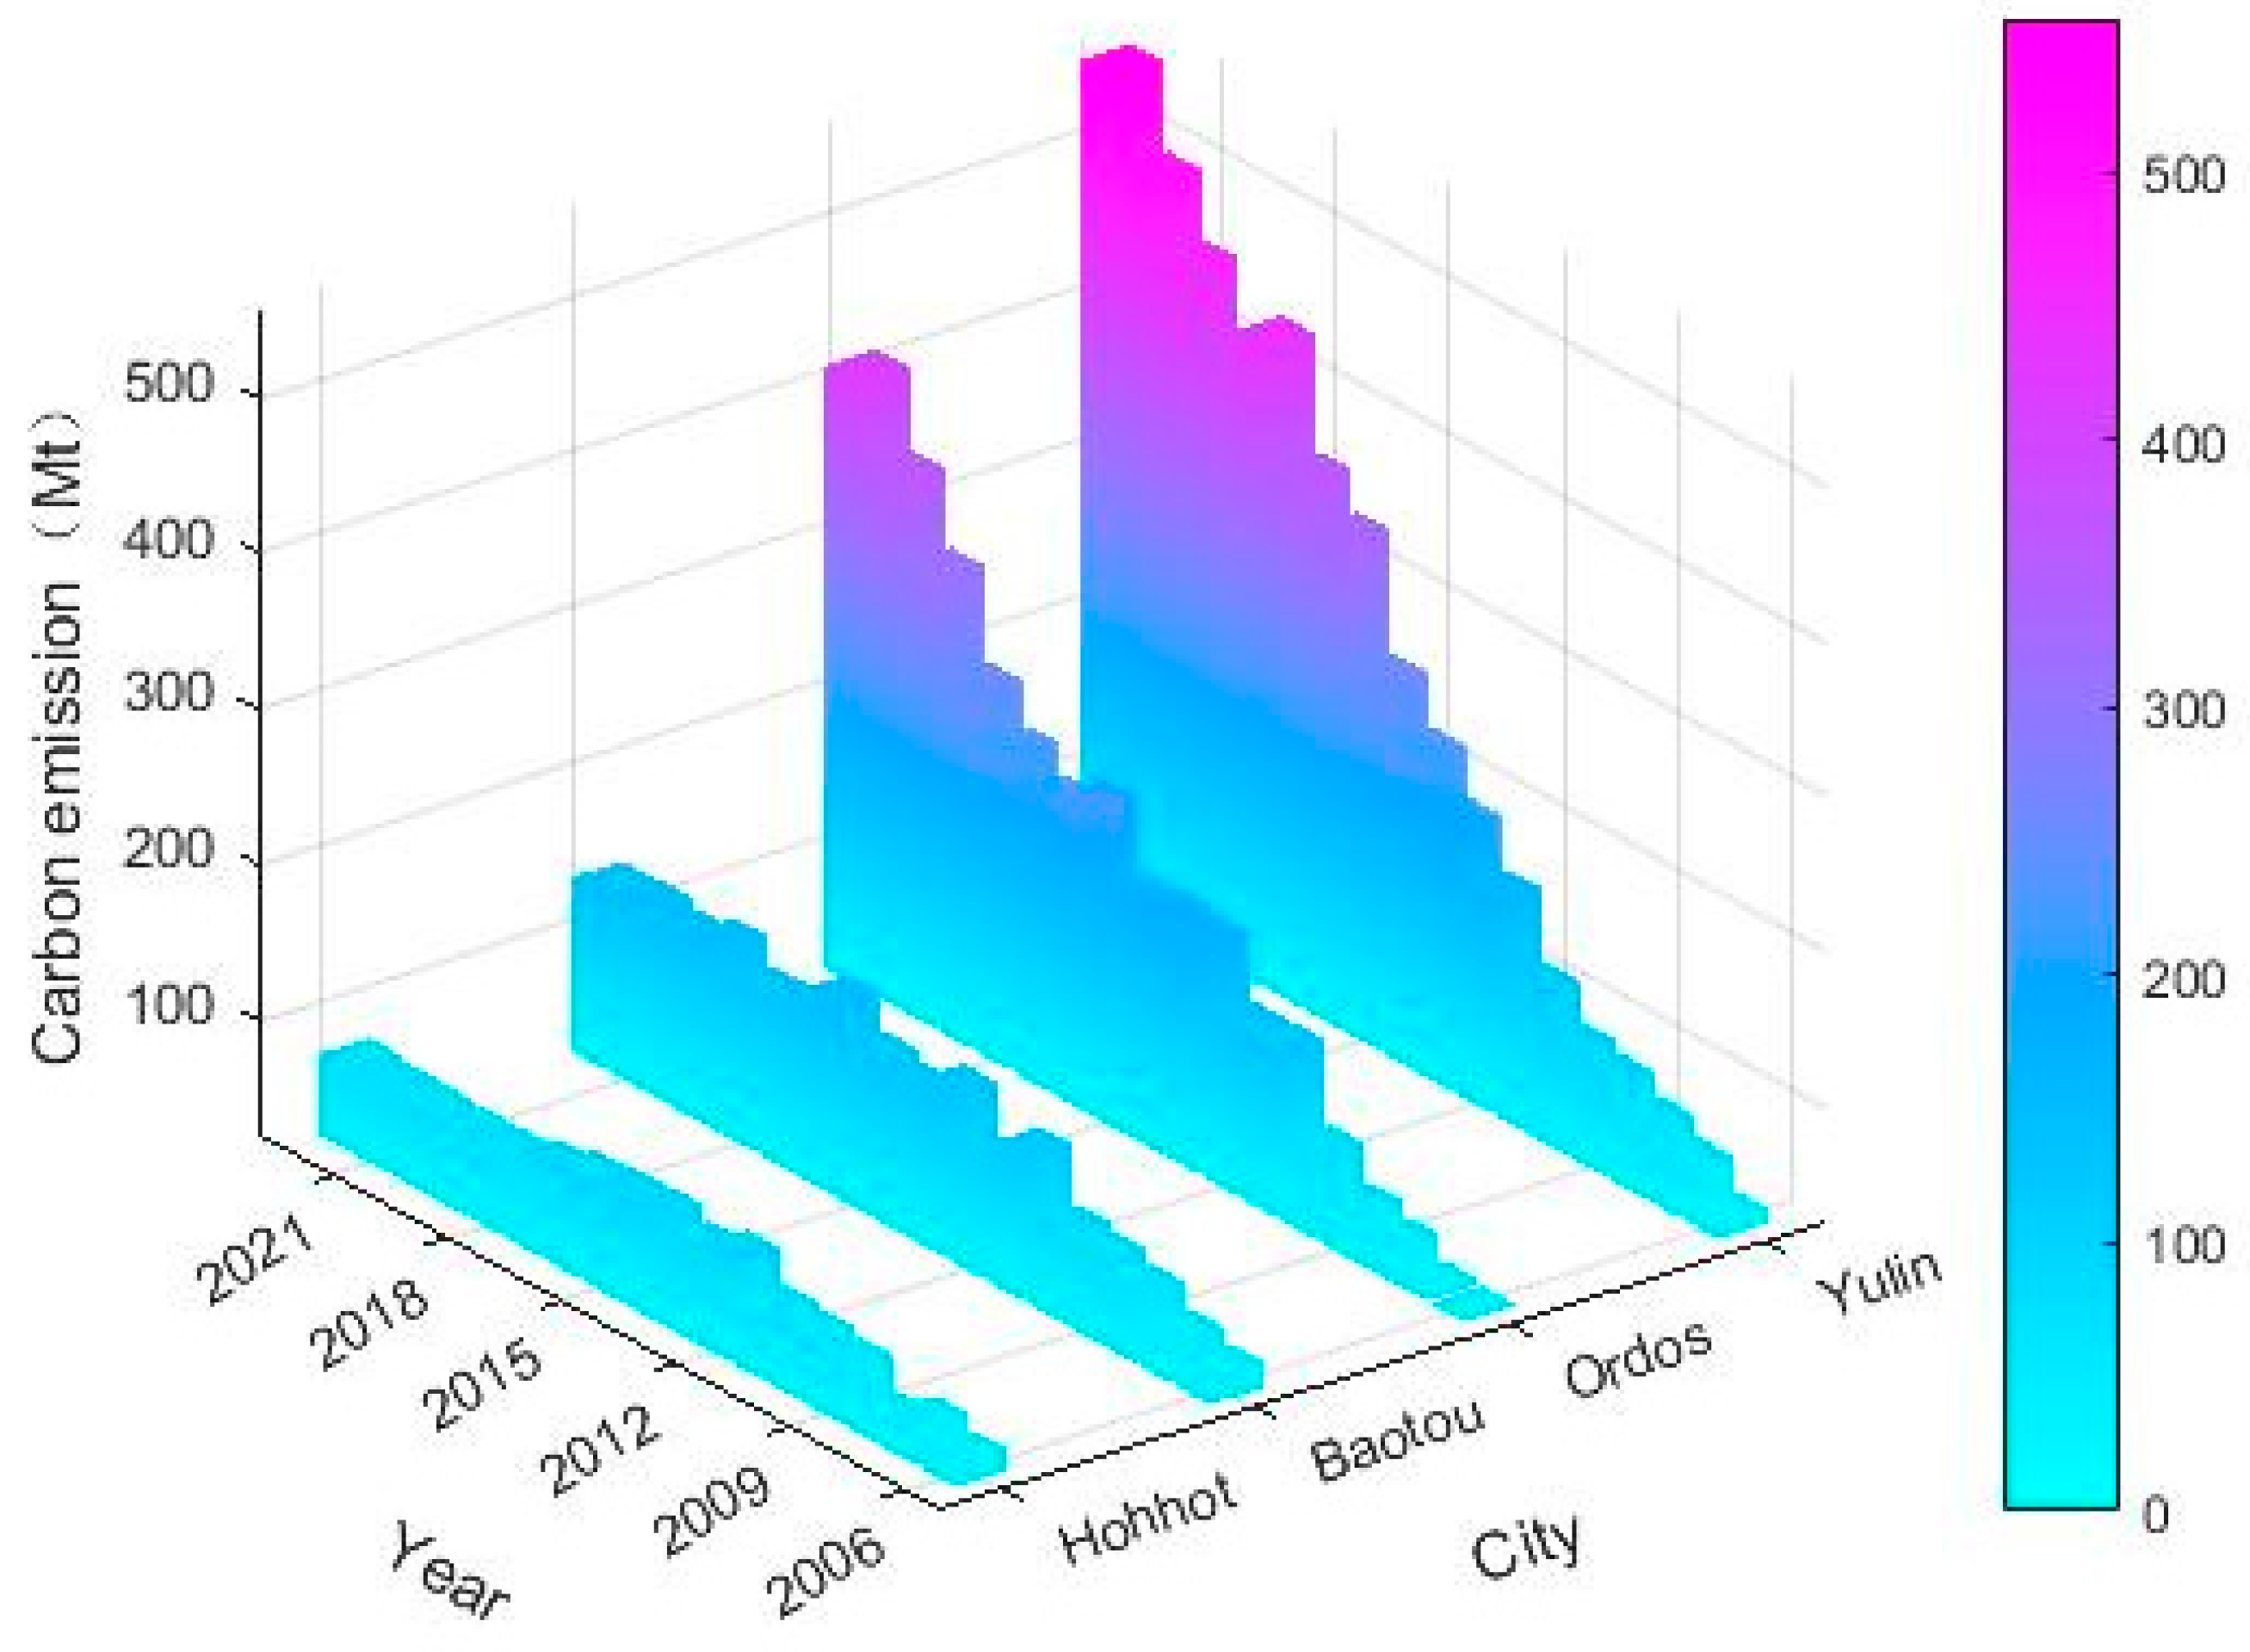
3.1.1. Total Carbon Emissions Change

In general, the urban area has a significant (p < 0.01) rising trend in its annual carbon emissions, as shown in Figure 3. From Figure 4, we can see that Yulin City is the most important source of carbon in the urban agglomeration and has the biggest yearly carbon emissions over the past few years. It is clear that the city’s yearly carbon emissions are going up (p < 0.01). In 2005, the city released 34.67 Mt of carbon, which was equal to 23.79% of the city’s total emissions. By 2021, it will release 557.19 Mt of carbon, which is equal to 46.95% of the city’s total emissions, or about half of the city cluster’s carbon emissions. As a whole, carbon emissions have been going up and then down: from 40.36 Mt in 2005 to 89.35 Mt in 2013, they went up and then down to 77.32 Mt in 2021, and the share went from 27.69% in 2005 to 6.51% in 2021. Huhhot City has the lowest annual carbon emissions. From 2005 to 2021, Baotou’s carbon emissions grew significantly (p < 0.05). From 2005 to 2015, they grew quickly each year, hitting a high point of 146.70 Mt in 2015. After 2015, the growth rate slowed down, and in 2021, the city’s share of carbon emissions was only 11.64%. Of all the cities that put out carbon each year, only Yulin puts out more than Ordos. From 26.83 Mt in 2005 to 413.87 Mt in 2021, Ordos will have put out 34.87% of all the carbon that the cities put out together. This is a major growth trend (p < 0.01).

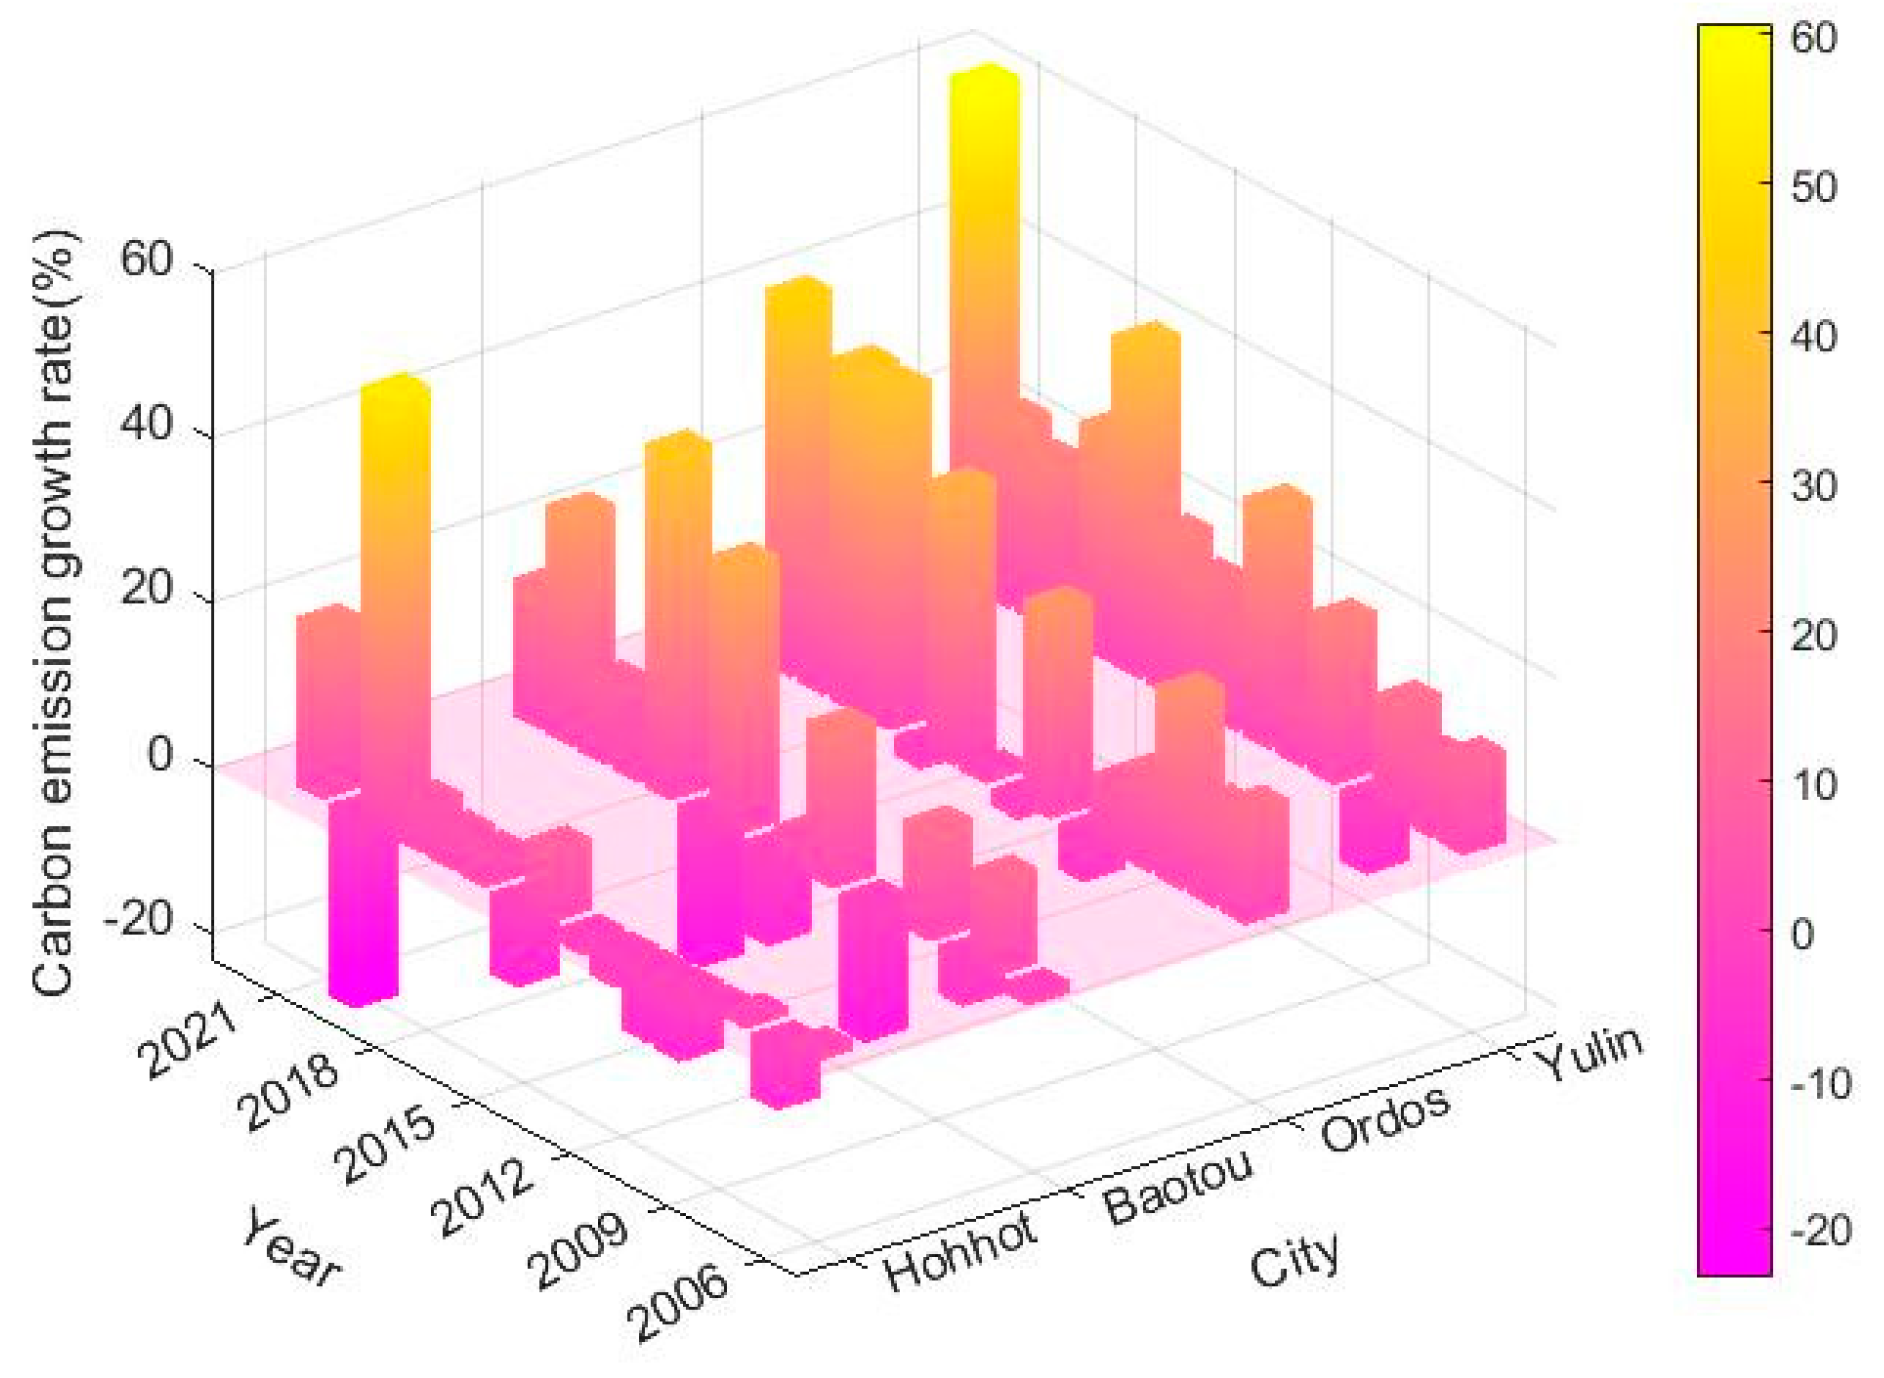
3.1.2. Carbon Emissions Change Rate Profile

The urban agglomeration’s yearly carbon output growth rate changes downwards, as shown in Figure 5. This is a significant trend (p < 0.05), and there was a “negative growth” event in 2016. The carbon emission growth rates of the four cities were low at the start of the study, as shown in Figure 6. However, after 2019, the rates began to rise “precipitously,” with Yulin City having a growth rate of almost 60% in 2021. From 2005 to 2021, the average carbon emission growth rates of the four cities are, in order, Yulin, Ordos, Baotou, and Huhhot. However, Huhhot’s growth rate of carbon emissions has been mostly negative or less positive until 2018, which is less than the average growth rate of carbon emissions in the city cluster. In 2020, Huhhot’s carbon emissions will grow faster than those of Baotou and Ordos. This shows that Huhhot has become more dependent on energy in recent years.

3.1.3. Changes in the Economic Contribution of Carbon Emissions

Equation (1) was used to figure out how much carbon pollution cost the Hu-Bao-O-Yu region’s economy from 2005 to 2021 as shown in Figure 7.. The ECC index for Huhhot and Baotou cities went up from 2005 to 2021 based on the economic input rate of carbon pollution. In 2017, the ECC index for Huhhot City was higher than 1, and after 2018, it was higher for Baotou City. This shows that economic growth has been important for Huhhot and Baotou cities in recent years, which is better for the economic contribution of carbon emissions. This city’s ECC score does not show a clear trend, and at the start of the study period, it was higher than those in Huhhot and Baotou. In recent years, there has not been a big difference between Ordos’s ECC index and that of Baotou. However, Ordos’s average ECC index is higher than those of these two places. This shows that Ordos’s economic input to carbon emissions was pretty high during the study period. There are three stages of “rising-declining-rising” for the ECC index, and Yulin has the highest average. After 2020, the ECC index will be above 1.4, which means that Yulin is the most efficient city in the group when it comes to carbon emissions.

3.2. Decoupling Analysis

3.2.1. Analysis of the Decoupling Effect of Carbon Emissions

Since both GDP per head and carbon emissions are expected to keep going up in the urban area from 2006 to 2021, it is in the first and fourth quadrants of Table 2. The average value of the separation coefficient over several years is 2.19. This means that carbon emissions and economic growth are negatively linked to each other. The rate of economic growth and the rate of growth in carbon pollution are similar, and the link between them stays the same. In Figure 2, you can see that the city cluster’s decoupling coefficient is going through a cycle of “decreasing, increasing, and decreasing.” This means that the city cluster’s decoupling state has gone through a process of “improving, deteriorating, and improving”. There have been times when the splitting state became better, worse, and better. As time went on, the decoupling coefficients of urban agglomerations went up and down. From 2005 to 2008, they went from expansionary negative decoupling to expansionary linkage and weak decoupling. Then, from 2009 to 2015, they went up and down, and the decoupling state became worse from weak decoupling to expansionary negative decoupling. In 2016, the growth rate of carbon emissions and the decoupling coefficients started to go down, and carbon emissions and economic growth reached the strongest decoupling state. In 2020, there was a strong negative decoupling. After that, carbon emissions went up again, and the decoupling state turned weak. The Hu-Bao-O-Yu urban agglomeration is mostly experiencing negative decoupling, with some strong decoupling happening every once in a while. The urban agglomeration does not yet have the right conditions for carbon peaks.
An analysis of the decoupling status of the four cities reveals that the average decoupling coefficients of Huhhot, Baotou and Ordos are 5.41, 1.28 and 1.55, respectively, with the decoupling status being mainly expansionary negative decoupling, while the average decoupling coefficient of Yulin is −0.26 during the study period, showing a strong negative decoupling status (Table 3). The decoupling coefficients in Huhhot were all greater than 1.2 and increased year by year, showing expansionary negative decoupling from 2005 to 2011 and improving after 2012, with recessionary decoupling predominating and no strong decoupling state. In Baotou, the decoupling score is usually less than 1 and goes down. The decoupling situation has become better. Negative decoupling, weak decoupling, and strong decoupling are mostly growing in the city. Strong decoupling happens more often, which shows that low-carbon policies and other policies are strongly encouraging carbon emission reduction in Baotou. This has gradually separated carbon emissions from economic growth and created the conditions for carbon peaking. Ordos has had negative decoupling most of the time, with strong decoupling happening once after the “new normal” in 2014. Its decoupling status is slowly becoming better, but strong negative decoupling happened in 2020, making it the worst decoupling status ever. During the study time, Yulin’s decoupling status changed from expansive decoupling to weak decoupling. After 2010, the decoupling status changed in a series of steps, going from expansive negative decoupling to strong negative decoupling to weak decoupling. This year, Yulin has strong decoupling, but it does not reach the best level of decoupling until 2019. In short, the city cluster and all the cities’ decoupling have become better over the past few years, but strong decoupling does not happen very often, and economic growth and carbon emissions are still linked.

3.2.2. Trends in Decoupling Indicators

As shown by Table 4, only the indicator values of φ C G and φ C I are positive throughout the study period, suggesting that there is a decoupling effort between the carbon intensity of outputs and the carbon emissions per unit of fixed asset investment in urban agglomerations, which to a certain extent offsets the increase in carbon emissions induced by economic growth. However, the pattern of change is different in the three sub-phases. For output carbon intensity, the decoupling value is on an increasing trend, reaching 0.97 in the 2016–2021 period, which is becoming closer to achieving a strong decoupling effect, and efforts to achieve a strong decoupling effect need to be further increased. In contrast, the decoupling strength of carbon emissions per unit of fixed-asset investment has gradually become smaller, from a strong decoupling effect at the beginning to a weak decoupling effect in 2016–2021, which is far from realising a strong decoupling effect and is relatively lagging behind in the decoupling process.
For the energy scale, the decoupling index is negative, but its effect on decoupling efforts is positive, especially in 2016–2021, implying a certain decoupling effect. Energy structure and energy intensity are both negatively decoupled, which is a positive trend but still restricts the entire city cluster from reaching decoupling, and energy intensity has been weakly negatively decoupled. Fixed-asset investment has experienced a gradual improvement in its evolution, a result closely related to the fact that the State has included carbon emission reduction as a binding indicator for the first time in the Outline of the Twelfth Five-Year Plan and that it has broken down the overall target into annual assessments of carbon intensity for each region.
To sum up, the Hubao-Eyu City Cluster has benefited from the fact that the carbon intensity of fixed asset investments and the carbon intensity of output have been very important in separating carbon emissions. The energy scale and structure have also gradually helped with this process. At the moment, energy intensity is the main thing that stops decoupling from happening. This means that the Hubao-Eyu urban area had stricter carbon decoupling rules in the beginning but is not as good at controlling the intensity of carbon emissions now.

4. Further Discussion

Since China’s economy has reached a new normal, energy efficiency is decreasing, and carbon emissions are about to reach their highest level [42], more research needs to be conducted on the relationship between carbon emissions and economic growth. This will help us better understand how carbon emissions and economic growth are linked and how they affect each other. This can help provide some scientific support for coordinating regional development, reducing emissions, saving energy, and easing the growing stress on resources and the environment.
In the Hu-Bao-O-Yu urban agglomeration, economic growth is the main cause of rising carbon pollution. This is connected to the economic growth model of the resource-dependent urban agglomeration. An important energy and coal chemical base, an agricultural and livestock products processing industry base, and a rare earth new materials industry base in China is the Hu-Bao-O-Yu urban agglomeration. As industries have grown, so has the urban agglomeration’s overall energy use. If the “double carbon” goal is met, the Hu-Bao-O-Yu City cluster’s economic growth will be green, low-carbon, and driven by technological progress. This will have a big effect on the current model of development, which is not very well thought out.
The Hu-Bao-O-Yu City cluster will work harder to save energy and use less of it after the “double carbon” target is proposed. This is because optimising the energy structure and lowering the intensity of energy use will have a bigger impact on reducing carbon emissions. To ensure energy supply security, using less fossil fuels like coal and making energy use more efficient will help the city cluster and each city reach the “double carbon” target.
The Huhhot Energy Conservation and Emission Reduction Implementation Plan for the 14th Five-Year Plan and the Baotou Carbon Neutral Implementation Plan for Accelerating the Construction of a Green and Low-Carbon City both make it clear what the goals are for saving energy and lowering carbon emissions in Huhhot and Baotou. However, they do not go into specifics about how these goals will be coordinated with economic growth. Baotou’s economy is the least responsible for the city’s carbon emissions. The city has also reached a weak decoupling between carbon emissions and economic development, with strong decoupling happening more often. This means that Baotou is ready to “take the lead” in reaching the peak. As the city grows, it should tightly control the use of fossil fuels, support the use of clean energy, build the industry base of a low-carbon economy, and push hard for the growth of the tertiary sector. As the core city with the most people, Huhhot has the lowest annual carbon emissions and a growth rate that fluctuates lower than the rest of the city cluster. However, its decoupling status has never reached a weak decoupling, and in recent years, it has become more dependent on energy. Since this is the case, technology and intelligence will help Huhhot’s business grow and become better. Huhhot should step up its scientific research to keep up with the times of big data, keep coming up with new products and technologies to help secondary industries grow, cut down on resource waste, stop the trend of energy resources running out, and make it mandatory to follow stricter rules for preventing and controlling pollution.
Coal and other fossil fuels have been important to Ordos City’s economy for a long time, and the city uses a lot of these oils. The study shows that from 2005 to 2021, Ordos City had the second-highest average yearly carbon emissions and the second-highest economic contribution from carbon emissions, after Yulin City. The city’s decoupling status has become better, but the negative decoupling of growth is still the main event. In Ordos City’s 14th Five-Year Plan for Comprehensive Energy Development, it is emphasised that non-fossil energy should be developed on a large scale, that green, advanced, and efficient large wind power and photovoltaic bases should be built faster, and that the 100 billion industry cluster of non-fossil energy and its equipment manufacturing should be actively grown. To change the energy system in Ordos, it is important to use natural fuels in a clean and efficient way. But there are still a lot of problems to solve in order to promote energy transformation. We need to make even bigger steps forward with key technologies, encourage the use of fossil fuels through a technological revolution, speed up the development and construction of non-fossil energy sources like wind power and photovoltaic, and speed up the changes to the way energy is structured. Furthermore, a strong judicial oversight system should be set up to make sure that the sectors involved meet their carbon emission responsibilities. This will help reach the goal of making fossil fuels clean and low in carbon emissions.
More than two-thirds of the carbon emissions in the Hu-Bao-O-Yu City Cluster come from Yulin City. It is also the key to the carbon peaks of the city cluster. Yulin City only went through a strong decoupling state in 2018. In the other years, it went through a number of different states, including negative decoupling of growth, strong negative decoupling, and weak decoupling, with the worst decoupling state happening in 2018. Yulin’s secondary industry share is currently very dependent on energy, which makes it harder to reach carbon peaking. To reach carbon peaking, Yulin needs to improve its industrial structure to lower energy use and emissions. To be more specific, Yulin should speed up the process of getting rid of old production capacity by focussing on three main areas: reducing carbon at the source, reducing carbon during the process, and storing carbon at the end; reorganising the layout of industries; keeping an eye on industries that produce a lot of pollution and carbon; gradually lowering the amount of energy used by replacing old capacity, merging and buying other companies; and improving manufacturing.
A dynamic process of change called decoupling means that if energy products are a big part of economic growth, the economy needs to slowly become less reliant on coal, oil, and gas during the development process to avoid an expansionary recoupling [43]. So, it is important to make the use of renewable energy more efficient in the Hu-Bao-O-Yu City cluster so that we can gradually obtain a more intensive, cleaner, and more diverse energy consumption structure. We should also keep building on and improving the strengths of each city by focussing on industrial restructuring and quickly getting rid of or changing high-carbon industries. Also, because carbon emissions and economic growth behave differently in energy-intensive areas, market mechanisms like carbon tax control and trading carbon emissions should be slowly put in place to make the low-carbon market economy system better and provide a strong guarantee for the coordinated growth of both carbon emissions and economic development [44].

5. Conclusions and Policy Suggestions

5.1. Conclusions

This study uses the Hu-Bao-O-Yu urban agglomeration as an example of a typical Western resource-dependent urban agglomeration. It uses the Tapio decoupling model and the GDIM method to find out how carbon emissions are decoupled in the Hu-Bao-O-Yu urban agglomeration and its constituent cities. The main findings are as follows:
(1)
Hu-Bao-O-Yu City cluster, Ordos City, Baotou City, and Yulin City all have significant rising carbon emissions every year. The most important carbon source in the Hu-Bao-O-Yu City cluster is Yulin City, which has the highest annual carbon emissions. Huhhot City, on the other hand, has the lowest annual carbon emissions, with a general trend of rising and then falling.
(2)
The yearly growth rate of carbon emissions in the urban area is going down, and this is a bigger trend. Yulin, Ordos, Baotou, and Huhhot had the slowest average growth rates in carbon emissions from 2005 to 2021. Huhhot has become more energy-dependent in recent years.
(3)
Out of all the cities in this group, Yulin has the highest economic contribution efficiency of carbon emissions. Ordos has stayed pretty stable, while Huhhot and Baotou have paid attention to economic growth in recent years and have raised their economic contribution efficiency to carbon emissions.
(4)
Hohhot, Baotou, and Ordos are all part of a city cluster that is decoupling. Hohhot and Baotou are expansionary negative decoupling, while Yulin is strong negative decoupling. In the last few years, decoupling has become better in all towns and the city cluster. However, strong decoupling happens less often, and economic growth is still linked to carbon pollution.
The urban agglomeration mostly benefits from the fact that the carbon intensity of fixed asset investments and the carbon intensity of output are two of the most important factors in separating carbon emissions. The energy scale and structure also play a part in this process over time.

5.2. Policy Suggestions

In order to reach the “double carbon” goal of splitting and efficiency, it is important to improve the structure of energy use while the economy grows. During the 14th and 15th Five-Year Plans, the urban agglomeration can rely on regional scientific research units to strengthen research and development of new energy generation technologies like wind, solar, and hydrogen energy. They can also strongly support the development and use of renewable energy technologies like water and bio-energy, and they can use Huhhot’s talent and resources to create low-carbon or even carbon-free energy and increase the use of renewable energy. By switching from a “resource-dependent” to an “innovation-driven” model of science and technology, the city can create low-carbon or even carbon-free energy, use green energy in more ways, and lower its carbon emissions. How the economy is set up affects how much energy is used. There has been a fast rise in carbon pollution in the Hu-Bao-O-Yu City cluster because of the growth of secondary industries, especially the industrial sector. To achieve low-carbon development, the industrial economy needs to develop more efficiently. The city cluster should quickly figure out what carbon emissions are and how they are caused in the industry. They should also take specific steps to lower emissions in key industries, and the government should make rules to help and protect the growth of the service industry. As a city cluster that depends on natural resources, the energy structure of the city cluster should be planned as an integrated whole. The energy policy should be well thought out, and Huhhot’s science and technology innovations should be fully utilised. Innovation should be at the centre of efforts to improve and optimise the energy and industrial structures. At the same time, it should create a way for people in the city cluster to work together to come up with new low-carbon technologies, work together on research and development projects for low-carbon technologies across the region, support CCUS technology, encourage ecological carbon sequestration, and create a complete and adaptable way to reduce carbon emissions.
For certain cities, low-carbon development in Baotou is focused on upgrading existing technology to help advanced industrial structure and vigorously developing the tertiary industry; Ordos and Yulin need to improve energy efficiency to speed up energy upgrading and transformation; Huhhot needs to support scientific research and innovation more, strengthen the partnership between business, academia, and research, and keep coming up with new products and technologies to help the growth of secondary industries in the other three cities. This will help cut down on resource waste and slow the rate at which energy resources are running out.

Author Contributions

Conceptualisation, M.Z. and Y.Z.; methodology, X.N. and M.Z.; software, X.N.; validation, J.Y. and Y.Z.; formal analysis, M.Z.; investigation, X.N. and M.Z.; resources, C.W.; data curation, M.Z.; writing—original draft preparation, M.Z.; writing—review and editing, J.Y.; visualisation, Y.Z.; supervision, Y.Z.; project administration, Y.Z.; funding acquisition, Y.Z. All authors have read and agreed to the published version of the manuscript.

Funding

This research was funded by the National Forestry and Grassland Administration Development Centre (grant number JYC-2022-0058).

Institutional Review Board Statement

Informed Consent Statement

Informed consent was obtained from all subjects involved in the study.

Data Availability Statement

The data presented in this study are available on request from the corresponding author.

Acknowledgments

Thanks to the authors for their contributions.

Conflicts of Interest

The authors declare no conflicts of interest.

References

  1. He, C.; Wang, Y.P.; Tang, K. Impact of Low-Carbon City Construction Policy on Green Innovation Performance in China. Emerg. Mark. Financ. Trade 2023, 59, 15–26. [Google Scholar] [CrossRef]
  2. He, H.; Kramer, R.J.; Soden, B.J.; Jeevanjee, N. State Dependence of CO2 Forcing and Its Implications for Climate Sensitivity. Science 2023, 382, 1051–1056. [Google Scholar] [CrossRef] [PubMed]
  3. Zhao, X.; Xu, H.; Sun, Q. Research on China’s Carbon Emission Efficiency and Its Regional Differences. Sustainability 2022, 14, 9731. [Google Scholar] [CrossRef]
  4. Hao, J.; Gao, F.; Fang, X.; Nong, X.; Zhang, Y.; Hong, F. Multi-Factor Decomposition and Multi-Scenario Prediction Decoupling Analysis of China’s Carbon Emission Under Dual Carbon Goal. Sci. Total Environ. 2022, 841, 156788. [Google Scholar] [CrossRef]
  5. Wang, X.; Wang, G.; Chen, T.; Zeng, Z.; Heng, C.K. Low-carbon city and its future research trends: A bibliometric analysis and systematic review. Sustain. Cities Soc. 2023, 90, 104381. [Google Scholar] [CrossRef]
  6. Fang, G.; Wang, L.; Gao, Z.; Chen, J.; Tian, L. How to Advance China’s Carbon Emission peak?—A Comparative Analysis of Energy Transition in China and the USA. Environ. Sci. Pollut. Res. 2022, 29, 71487–71501. [Google Scholar] [CrossRef]
  7. Zeng, C.; Jiang, S.; Zhou, F. Can Low-Carbon City Pilot Policy Promote Regional Green High-Quality Development? Sustainability 2024, 16, 5520. [Google Scholar] [CrossRef]
  8. Liu, J.; Yang, Q.; Ou, S.; Liu, J. Factor decomposition and the decoupling effect of carbon emissions in China’s manufacturing high emission subsectors. Energy 2022, 248, 123568. [Google Scholar] [CrossRef]
  9. Chen, J.; Xu, C.; Song, M. Determinants for Decoupling Economic Growth from Carbon Dioxide Emissions in China. Reg. Environ. Change 2020, 20, 1–12. [Google Scholar] [CrossRef]
  10. Jiang, X.; Su, M.; Li, R. Investigating the factors Influencing the Decoupling of Transport-Related Carbon Emissions from Turnover Volume in China. Sustainability 2018, 10, 3034. [Google Scholar] [CrossRef]
  11. Zhao, S.; Yin, M. Research on Rural Population Arable Land/Rural Settlements Association Model and Coordinated Development Path: A Case Analysis of the Yellow River Basin (Henan Section). Int. J. Environ. Res. Public Health 2023, 20, 3833. [Google Scholar] [CrossRef]
  12. Lai, W.; Hu, Q.; Zhou, Q. Decomposition Analysis of PM2.5 Emissions Based on LMDI and Tapio Decoupling Model: Study of Hunan and Guangdong. Environ. Sci. Pollut. Res. 2021, 28, 43443–43458. [Google Scholar] [CrossRef]
  13. Liu, X.; Zhong, S.; Yang, M. Study on the Decoupling Relationship of Energy-Related CO2 Emissions and Economic Growth in China: Using the New Two-Dimensional Decoupling Model. Ecol. Indic. 2022, 143, 109405. [Google Scholar] [CrossRef]
  14. Li, L.; Li, Y. The Spatial Relationship Between CO2 Emissions and Economic Growth in the Construction Industry: Based on the Tapio Decoupling Model and STIRPAT Model. Sustainability 2022, 15, 528. [Google Scholar] [CrossRef]
  15. Wu, Y.; Zhu, Q.; Zhu, B. Decoupling Analysis of World Economic Growth and CO2 Emissions: A Study Comparing Developed and Developing Countries. J. Clean. Prod. 2018, 190, 94–103. [Google Scholar] [CrossRef]
  16. Chen, J.; Wang, P.; Cui, L.; Huang, S.; Song, M. Decomposition and Decoupling Analysis of CO2 Emissions in OECD. Appl. Energy 2018, 231, 937–950. [Google Scholar] [CrossRef]
  17. Scofield, J.H.; Doane, J. Energy Performance of LEED-Certified Buildings from 2015 Chicago Benchmarking Data. Energy Build. 2018, 174, 402–413. [Google Scholar] [CrossRef]
  18. Scipioni, A.; Manzardo, A.; Mazzi, A.; Mastrobuono, M. Monitoring the Carbon Footprint of Products: A Methodological Proposal. J. Clean. Prod. 2012, 36, 94–101. [Google Scholar] [CrossRef]
  19. Wang, J.; Hui, W.; Liu, L.; Bai, Y.; Du, Y.; Li, J. Estimation and Influencing Factor Analysis of Carbon Emissions from the Entire Production Cycle for Household Consumption: Evidence from the Urban Communities in Beijing, China. Front. Environ. Sci. 2022, 10, 843920. [Google Scholar] [CrossRef]
  20. du Plessis, M.; van Eeden, J.; Goedhals-Gerber, L. Carbon Mapping Frameworks for the Distribution of Fresh Fruit: A Systematic Review. Glob. Food Secur. 2022, 32, 100607. [Google Scholar] [CrossRef]
  21. Heimburger, A.M.; Harvey, R.M.; Shepson, P.B.; Stirm, B.H.; Gore, C.; Turnbull, J.; Cambaliza, M.O.; Salmon, O.E.; Kerlo, A.E.; Lavoie, T.N.; et al. Assessing the Optimized Precision of the Aircraft Mass Balance Method for Measurement of Urban Greenhouse Gas Emission Rates Through Averaging. Elem. Sci. Anth. 2017, 5, 26. [Google Scholar] [CrossRef]
  22. Straatman, B.; Boyd, B.; Mangalagiu, D.; Rathje, P.; Eriksen, C.; Madsen, B.; Stefaniak, I.; Jensen, M.; Rasmussen, S. A Consumption-Based, Regional Input-Output Analysis of Greenhouse Gas Emissions and the Carbon Regional Index. Int. J. Environ. Technol. Manag. 2018, 21, 1–36. [Google Scholar] [CrossRef]
  23. Long, Y.; Yoshida, Y.; Liu, Q.; Zhang, H.; Wang, S.; Fang, K. Comparison of City-Level Carbon Footprint Evaluation by Applying Single-and Multi-Regional Input-Output Tables. J. Environ. Manag. 2020, 260, 110108. [Google Scholar] [CrossRef] [PubMed]
  24. Qiang, W.; Min, S. Drivers of decoupling economic growth from carbon emission—An empirical analysis of 192 countries using decoupling model and decomposition method. Environ. Impact Assess. Rev. 2020, 81, 106356. [Google Scholar]
  25. Abraham Mahanga Tsoni, C.G.; Massonini Ngoma, R.G.T.; Meng, X. Innovation and Climate Change Mitigation Technology in the Asian and African Mining Sector: Empirical Analysis Using the LMDI Method. Energies 2022, 15, 9424. [Google Scholar] [CrossRef]
  26. Peng, D.; Liu, H. Measurement and Driving Factors of Carbon Emissions from Coal Consumption in China Based on the Kaya-LMDI Model. Energies 2022, 16, 439. [Google Scholar] [CrossRef]
  27. Luo, X.; Liu, C.; Zhao, H. Driving Factors and Emission Reduction Scenarios Analysis of CO2 Emissions in Guangdong-Hong Kong-Macao Greater Bay Area and Surrounding Cities Based on LMDI and System Dynamics. Sci. Total Environ. 2023, 870, 161966. [Google Scholar] [CrossRef] [PubMed]
  28. Zou, X.; Li, J.; Zhang, Q. CO2 Emissions in China’s Power Industry by Using the LMDI Method. Environ. Sci. Pollut. Res. 2023, 30, 31332–31347. [Google Scholar] [CrossRef]
  29. Zhai, J.; Leclaire, N.; Bendewald, M. Deep energy retrofit of commercial buildings: A key pathway toward low-carbon cities. Carbon Manag. 2011, 2, 425–430. [Google Scholar] [CrossRef]
  30. Zheng, W.; Shen, G.Q.; Wang, H.; Hong, J.; Li, Z. Decision support for sustainable urban renewal: A multi-scale model. Land Use Policy 2017, 69, 361–371. [Google Scholar] [CrossRef]
  31. Vaninsky, A. Factorial Decomposition of CO2 Emissions: A Generalized Divisia Index Approach. Energy Econ. 2014, 45, 389–400. [Google Scholar] [CrossRef]
  32. Wang, Y.; Xie, T.; Yang, S. Carbon emission and its decoupling research of transportation in Jiangsu Province. J. Clean. Prod. 2017, 142, 907–914. [Google Scholar] [CrossRef]
  33. Liu, F.; Kang, Y.; Guo, K. Is electricity consumption of Chinese countiesdecoupled from carbon emissions? A study based on Tapio decoupling index. Energy 2022, 251, 123879. [Google Scholar] [CrossRef]
  34. Ma, Y.; Meng, S.; Yan, R. Heterogeneity Analysis on Decoupling Factor between Carbon Emissions and GDP in BRICS Countries. Int. J. Digit. Content Technol. Its Appl. 2013, 7, 834. [Google Scholar]
  35. Jia, Q.; Jiao, L.; Lian, X.; Wang, W. Linking Supply-Demand Balance of Ecosystem Services to Identify Ecological Security Patterns in Urban Agglomerations. Sustain. Cities Soc. 2023, 92, 104497. [Google Scholar] [CrossRef]
  36. Tian, P.; Liu, Y.; Li, J.; Pu, R.; Cao, L.; Zhang, H. Spatiotemporal Patterns of Urban Expansion and Trade-Offs and Synergies Among Ecosystem Services in Urban Agglomerations of China. Ecol. Indic. 2023, 148, 110057. [Google Scholar] [CrossRef]
  37. Zhang, C.; Dong, X.; Zhang, Z. Spatiotemporal Dynamic Distribution, Regional Differences and Spatial Convergence Mechanisms of Carbon Emission Intensity: Evidence from the Urban Agglomerations in the Yellow River Basin. Int. J. Environ. Res. Public Health 2023, 20, 3529. [Google Scholar] [CrossRef]
  38. Xu, Z.; Li, C.; Niu, L. Decoupling Relationship Between Land Mixed Use and Carbon Emissions in Hohhot-Baotou-Ordos-Yulin Urban Agglomeration. Environ. Sci. Res. 2022, 35, 299–308. [Google Scholar]
  39. Shi, Y. Study on the Relationship Between Urbanization and Eco-environment Interaction Stress in Hu-Bao-O-Yu Urban Agglomeration. Inn. Mong. Sci. Technol. Econ. 2020, 2, 20–22. [Google Scholar]
  40. Wei, L.; Zhou, L.; Sun, D.; Tang, X. The evolution of Spatio-Temporal Pattern and Scenario Simulation of Urban Agglomeration Expansion in the Yellow River Basin: A Case Study in the Hohhot-Baotou-Ordos-Yulin Urban Agglomeration. Geogr. Res. 2022, 41, 1610–1622. [Google Scholar]
  41. Song, S.; Zhang, J.; Liu, Z.; He, C. Study on the Location Factors of Urban Expansion in the Drylands: A case Study in the Hohhot-Baotou-Ordos-Yulin Urban Agglomeration, China. J. Nat. Resour. 2021, 36, 1021–1035. [Google Scholar] [CrossRef]
  42. Shi, M. Forecast of China’s Carbon Emissions Under the Background of Carbon Neutrality. Environ. Sci. Pollut. Res. 2022, 29, 43019–43033. [Google Scholar] [CrossRef] [PubMed]
  43. Sun, L.X.; Wang, M. The Realistic Way to the Decoupling of Carbon Dioxide Emissions from Economic Growth in China’s Service Sector. Emerg. Mark. Financ. Trade 2023, 59, 786–799. [Google Scholar] [CrossRef]
  44. Shen, T.; Hu, R.; Hu, P.; Tao, Z. Decoupling between Economic Growth and Carbon Emissions: Based on Four Major Regions in China. Int. J. Environ. Res. Public Health 2023, 20, 1496. [Google Scholar] [CrossRef] [PubMed]
Figure 1. Location of Hu-Bao-O-Yu urban agglomeration.
Sustainability 16 07290 g001
Figure 2. Decoupling index and decoupling status classification.
Sustainability 16 07290 g002
Figure 3. Change in annual average carbon emissions in urban agglomeration.
Sustainability 16 07290 g003
Figure 4. Comparison of average annual carbon emissions of different cities.
Sustainability 16 07290 g004
Figure 5. Change in urban agglomeration average annual carbon emission rate.
Sustainability 16 07290 g005
Figure 6. Comparison of change rate of average annual carbon emissions in different cities.
Sustainability 16 07290 g006
Figure 7. Change in efficiency of economic contribution of carbon emission in different cities.
Sustainability 16 07290 g007
Table 1. Types of variables and their interpretative meanings.
VariableMeaning
Z = CO2Carbon emission
X1 = GDPRegional gross domestic product
X2 = CO2/GDPCarbon emissions per unit of GDP of output (carbon intensity of output)
X3 = EnergyFossil energy consumption
X4 = CO2/EnergyCarbon emissions per unit of fossil energy consumed (fossil energy mix)
X5 = InvestmentInvestment in fixed assets
X6 = CO2/InvestmentCarbon emissions per unit of fixed investment assets
X7 = GDP/InvestmentGross domestic product per unit of fixed investment assets
X8 = Energy/GDPFossil energy consumed to produce a unit of GDP (fossil energy consumption intensity)
Table 2. Decoupling index and decoupling status between carbon emission and economic development in urban agglomeration.
YearDecoupling IndexDecoupling State
20061.12Expansive coupling
20070.74Weak decoupling
20080.92Expansive coupling
20090.90Expansive coupling
20101.71Expansive negative decoupling
20110.22Weak decoupling
20121.77Expansive negative decoupling
20131.05Expansive coupling
20140.67Weak decoupling
201532.11Expansive negative decoupling
2016−0.46Strong decoupling
20170.79Weak decoupling
20180.07Weak decoupling
20191.90Expansive negative decoupling
2020−8.98Strong negative decoupling
20210.44Weak decoupling
Mean value2.19Expansive negative decoupling
Table 3. Decoupling index and decoupling status between carbon emission and economic development in different cities.
YearHuhhotBaotou
Decoupling IndexDecoupling StateDecoupling IndexDecoupling State
20062.20Expansive negative decoupling1.73Expansive negative decoupling
20072.73Recessive decoupling1.51Expansive negative decoupling
20083.12Expansive negative decoupling0.51Weak decoupling
20093.42Expansive negative decoupling0.52Weak decoupling
20103.86Expansive negative decoupling7.15Expansive negative decoupling
20114.41Expansive negative decoupling−1.12Strong decoupling
20124.89Recessive decoupling4.05Expansive negative decoupling
20135.20Expansive negative decoupling−1.87Strong decoupling
20145.69Recessive decoupling0.91Expansive coupling
20156.00Recessive decoupling4.29Expansive negative decoupling
20166.59Recessive decoupling−2.48Strong decoupling
20176.89Recessive decoupling−0.01Strong decoupling
20187.36Recessive decoupling1.39Expansive negative decoupling
20197.77Expansive negative decoupling−0.72Strong decoupling
20208.24Recessive decoupling4.67Expansive negative decoupling
20218.16Expansive negative decoupling−0.07Strong decoupling
Mean value5.41Expansive negative decoupling1.28Expansive negative decoupling
YearOrdosYulin
Decoupling IndexDecoupling StateDecoupling IndexDecoupling State
20060.37Weak decoupling1.15Expansive coupling
20071.53Expansive negative decoupling1.32Expansive negative decoupling
20080.62Weak decoupling0.38Weak decoupling
20093.06Expansive negative decoupling0.28Weak decoupling
20101.94Expansive negative decoupling0.78Weak decoupling
2011−0.16Strong decoupling1.32Expansive negative decoupling
20122.74Expansive negative decoupling1.15Expansive coupling
20130.15Weak decoupling−3.06Strong negative decoupling
2014−0.50Strong decoupling0.89Expansive negative decoupling
201512.73Expansive negative decoupling−2.71Strong negative decoupling
2016−0.97Strong decoupling1.21Expansive negative decoupling
20170.95Expansive coupling0.65Weak decoupling
20181.63Expansive negative decoupling−1.39Strong decoupling
20194.33Expansive negative decoupling1.92Expansive negative decoupling
2020−4.23Strong negative decoupling−8.44Strong negative decoupling
20210.52Weak decoupling0.44Weak decoupling
Mean value1.55Expansive negative decoupling−0.26Strong negative decoupling
Table 4. Decoupling effort index of each factor.
Index2006–20212006–20102011–20152016–2021
φ E −0.21−0.44−0.140.03
φ I −0.19−0.31−0.11−0.16
φ C G 0.470.150.370.97
φ C E −1.28−1.16−1.37−1.32
φ C I 0.751.120.610.54
φ E G −0.63−0.82−0.56−0.51
Disclaimer/Publisher’s Note: The statements, opinions and data contained in all publications are solely those of the individual author(s) and contributor(s) and not of MDPI and/or the editor(s). MDPI and/or the editor(s) disclaim responsibility for any injury to people or property resulting from any ideas, methods, instructions or products referred to in the content.

