Article

Assessing the Impact of Straw Burning on PM2.5 Using Explainable Machine Learning: A Case Study in Heilongjiang Province, China

Chinese Research Academy of Environmental Sciences, Beijing 100012, China
*
Author to whom correspondence should be addressed.
Sustainability 2024, 16(17), 7315; https://doi.org/10.3390/su16177315
Submission received: 17 June 2024 / Revised: 12 August 2024 / Accepted: 19 August 2024 / Published: 26 August 2024

Abstract

:
Straw burning is recognized as a significant contributor to deteriorating air quality, but its specific impacts, particularly on PM2.5 concentrations, are still not fully understood or quantified. In this study, we conducted a detailed examination of the spatial and temporal patterns of straw burning in Heilongjiang Province, China—a key agricultural area—utilizing high-resolution fire-point data from the Fengyun-3 satellite. We subsequently employed random forest (RF) models alongside Shapley Additive Explanations (SHAPs) to systematically evaluate the impact of various determinants, including straw burning (as indicated by crop fire-point data), meteorological conditions, and aerosol optical depth (AOD), on PM2.5 levels across spatial and temporal dimensions. Our findings indicated a statistically nonsignificant downward trend in the number of crop fires in Heilongjiang Province from 2015 to 2023, with hotspots mainly concentrated in the western and southern parts of the province. On a monthly scale, straw burning was primarily observed from February to April and October to November—which are critical periods in the agricultural calendar—accounting for 97% of the annual fire counts. The RF models achieved excellent performance in predicting PM2.5 levels, with R2 values of 0.997 for temporal and 0.746 for spatial predictions. The SHAP analysis revealed the number of fire points to be the key determinant of temporal PM2.5 variations during straw-burning periods, explaining 72% of the variance. However, the significance was markedly reduced in the spatial analysis. This study leveraged machine learning and interpretable modeling techniques to provide a comprehensive understanding of the influence of straw burning on PM2.5 levels, both temporally and spatially. The detailed analysis offers valuable insights for policymakers to formulate more targeted and effective strategies to combat air pollution.

1. Introduction

Straw burning, a routine method in peri-urban and rural areas for crop residues and land preparation, is a considerable source of air pollution [1,2,3]. This method markedly influences the release of fine particulate matter, encompassing harmful pollutants such as PM2.5. This impact is particularly pronounced in areas heavily reliant on agriculture [4], leading to a significant rise in pollutant levels. Given straw burning’s role in exacerbating air pollution, there is an escalating awareness regarding its detrimental effects on both the environment and public health [5,6,7].
The challenge in accurately monitoring and analyzing the environmental impact of straw burning lies partly in the limitations of traditional fire-monitoring tools. The Moderate Resolution Imaging Spectroradiometer (MODIS) has been pivotal in global fire monitoring [8,9,10,11], but faces challenges due to sensor degradation over time [12]. This degradation underscores the need for a more reliable and consistent alternative. The Fengyun series, since the launch of the Fengyun-3C satellite, has emerged as a promising solution [13]. Further advancements were achieved with the introduction of Fengyun-3D, which has significantly enhanced fire-detection capabilities [12]. The effectiveness of the FY-3D fire-detection product in China was assessed using field-collected reference data, demonstrating that its overall accuracy and its accuracy excluding omission errors were notably superior—by 79.43% and 88.50%, respectively—compared with the MODIS fire products [12]. Thus, within China, utilizing the Fengyun-3 series fire-detection products to investigate straw burning represents a superior choice.
Research has indicated that straw burning significantly contributes to PM2.5 emissions during harvest periods, exacerbating air-quality issues in many regions [14,15,16,17,18]. A variety of methods have been applied to investigations of straw burning and its effects on air quality, offering detailed insights. For instance, a study utilizing satellite data and chemical transport models in central and eastern China demonstrated that straw burning substantially contributed to severe haze events with high PM2.5 levels [19]. Estimations from observational data and simulations using the Community Multiscale Air Quality (CMAQ) model suggested that biomass burning accounted for 37% of PM2.5 contributions [4] in the Yangtze River Delta, China. Additionally, analyses employing a correlation coefficient to examine the effects of open straw burning on environmental pollutant levels, especially PM2.5 concentrations during the spring and autumn, indicated a strong and statistically significant correlation (p < 0.05) [20,21]. Although traditional approaches like chemical transport modeling, simulations, and surveys offer valuable insights into the effects of straw burning on PM2.5 levels, they can be time-consuming and may suffer from accuracy limitations. Correlation analyses are instrumental in identifying the connection between straw burning and PM2.5 concentrations. However, they do not succeed in quantifying the precise contributions of straw burning and other influencing factors. Furthermore, this approach does not adequately capture the complex interaction between PM2.5 levels and their determinants or whether these relationships are linear or nonlinear.
In light of these limitations, there is a growing interest in exploring machine learning models as a potent tool in atmospheric research [22,23,24]. These models, recognized for their adaptability and superior computational efficiency [23], are particularly adept at tackling complex nonlinear problems. This marks a substantial leap forward from traditional methods, positioning machine learning as a promising approach to more accurately and efficiently assess the multifaceted effects of straw burning and other contributors on air quality. However, the “black-box” nature of machine learning models poses challenges when interpreting how input features influence output predictions [25]. To overcome this, the game-theory-inspired Shapley Additive Explanation (SHAP) algorithm [26] has been introduced, providing a means to quantitatively assess the impact of input features on model predictions across different scales, thus bridging the gap in model interpretability.
China is the largest agricultural producer in the world, accounting for 63.4% of the total crop residues in Asia and 17.3% of the global total [20]. Heilongjiang Province, located in northeastern China, is an important agricultural center and has maintained its position as the country’s top grain-producing province for many years. However, the spatial and temporal distribution of straw burning and its impact on air quality remain poorly understood. This knowledge gap has prevented policymakers from developing and implementing effective emission-control policies to improve air quality in Heilongjiang Province and other affected areas in China. To address this gap, our research meticulously analyzed the spatial and temporal dynamics of straw burning (as indicated by crop fire points) in Heilongjiang Province from 2015 to 2023, using high-resolution spatial and temporal data from the FY-3 satellite series. This unique application of high-resolution satellite data enabled a more accurate tracking and analysis of straw-burning dynamics, providing robust data support to understand the regional impacts on air quality. Moreover, our study employed advanced machine learning methodologies, particularly the random forest (RF) model, integrating key determinants such as meteorological conditions, crop fire points, and aerosol optical depth (AOD) data to construct sophisticated regression models for PM2.5 concentrations. Through a SHAP analysis, we elucidated the complex relationships among fire points, pertinent factors, and PM2.5 concentrations, thus enhancing the interpretability of PM2.5 variations, which is critical for developing targeted air-quality policies. The aim of this study was to discern the temporal and spatial impacts of straw burning and other associated factors on PM2.5 levels alongside their relative contributions. This investigation not only offers empirical evidence to support policy decisions, particularly regarding agricultural burning, but also highlights spatiotemporal variations to help pinpoint critical periods and locations for intervention. This enhances the effectiveness of air-quality management strategies in the region and provides crucial insights to refine air-quality management and policymaking in Heilongjiang Province.

2. Materials and Methods

2.1. Fengyun-3 Series Global Active Fire Products

The meteorological satellites of the Fengyun-3 series are equipped with mid-infrared detection instruments operating in the 3.5–4.0 µm wavelength range that are particularly sensitive to fire points [27]. Beginning with the Fengyun-3C (FY-3C) satellite launched in September 2013, the Fengyun series of meteorological satellites has played a crucial role in generating global active fire products. The FY-3C satellite employed a visible and infrared radiometer (VIRR) to generate fire products using an effective active fire-detection algorithm [28]. This methodology incorporated dynamic thresholds and infrared gradients for enhanced detection. Launched in 2017, the Fengyun-3D (FY-3D) satellite represents a significant advancement in this technology. It is equipped with a medium resolution imaging spectrometer (MERSI-II), which offers notably improved performance [12]. This upgrade in equipment provides a higher quality of data, greatly enhancing global fire-monitoring capabilities. In this study, we combined the daily global fire products from both the FY-3C and FY-3D satellites, specifically utilizing FY-3C data from 2015 to 2019 and FY-3D data from 2020 to 2023 (http://satellite.nsmc.org.cn/). These integrated data allowed us to comprehensively analyze the trends and patterns of straw burning in Heilongjiang Province over an extended period from 2015 to 2023.

2.2. Land Cover

The Copernicus Global Land Service (CGLS) serves as a key segment of the land service, functioning as a versatile service component. It offers an array of biogeophysical products, detailing the condition of and changes in the earth’s surface on a global scale. The Dynamic Land Cover map at 100 m resolution (CGLS-LC100), a significant enhancement of the Copernicus Global Land Service (CGLS) product suite, provides a detailed and comprehensive global land-cover map, with an overall accuracy of about 80% or higher [29]. In this study, a cropland map derived from the CGLS product was utilized as a filter to extract the fire points located within cropland areas.

2.3. Auxiliary Data

By incorporating variables such as total precipitation (PRE), average temperature (TEM), a digital elevation model (DEM), wind speed (Wind), and aerosol optical depth (AOD), this study aimed to analyze how these factors, along with the number of crop fire points, affected PM2.5 concentrations. To conduct this analysis, we employed machine learning technologies and interpretable models, enabling a precise assessment of the contributions of these elements on PM2.5 variability, both temporally and spatially. Upon careful examination, it was noted that certain auxiliary datasets were missing recent updates. Therefore, for the sake of temporal consistency in our analysis, we chose to focus on data spanning from 2015 to 2021 for this study.

2.3.1. Climate-Related Variables

To investigate the impact of climatic conditions on PM2.5 levels, we considered fundamental meteorological parameters, including PRE, TEM, and Wind. The latter was derived from a combination of 10 m radial wind and zonal wind. These variables were sourced from the ERA5-Land re-analysis dataset [30]. We utilized the Google Earth Engine (GEE) platform to acquire daily data on these parameters for the period spanning from 2015 to 2021. Given the ERA5-Land’s comprehensive modeling, which often yields small positive values for precipitation due to its interpolation technique, we instituted a 2 mm daily precipitation threshold [31]. Values below this were deemed insignificant for our PM2.5 analysis and were reset to zero to ensure our dataset reflected only meaningful precipitation events.

2.3.2. DEM and AOD Data

The digital elevation model (DEM) data were sourced from the Shuttle Radar Topography Mission (SRTM) [32], which represents a collaborative global research initiative aimed at acquiring digital elevation models across almost the entire planet. Offered by NASA’s Jet Propulsion Laboratory (JPL), the SRTM V3 product—also known as SRTM Plus (30 m)—was obtained through the GEE platform for this study.
The aerosol optical depth (AOD) data from 2000 to 2021 [33], as integrated into the Long-term Gap-free High-resolution Air Pollutants concentration dataset (LGHAP v2), are characterized by a high resolution (1 km) and accuracy when depicting global aerosol distributions. These AOD data benefit from a sophisticated analytic approach that combines data science, pattern recognition, and deep learning to harmonize and reconstruct AOD values from various sources, including satellite imagery, ground observations, and numerical models. The innovative use of a TensorFlow-based algorithm for gap filling enhances the dataset’s reliability, evidenced by improved performance metrics such as faster convergence speeds and higher accuracy. A validation showed a correlation coefficient (R) of 0.85 and a root mean square error (RMSE) of 0.14 against AERONET observations [33]. In this study, to align with the daily-scale fire-point data, we utilized daily-scale AOD data spanning from 2015 to 2021.

2.3.3. ChinaHighPM2.5

ChinaHighPM2.5 is part of the comprehensive China High Air Pollutant series (CHAP), offering long-term extensive coverage and high-resolution datasets of surface-level air pollutants across China. This dataset is produced by leveraging big data sources, including ground-based measurements, satellite remote sensing, atmospheric re-analysis, and model simulations, combined with artificial intelligence techniques to account for the spatial and temporal diversity of air pollution [34].
Spanning from 2000 to 2022, ChinaHighPM2.5 provides a seamless, complete spatial coverage dataset of daily, monthly, and annual ground-level PM2.5 concentrations in China, with a resolution of 1 km (referred to as D1K, M1K, and Y1K, respectively). It delivers exceptional accuracy, as evidenced by a cross-validation coefficient of determination (CV-R2) of 0.92, a root mean square error (RMSE) of 10.76 µg m−3, and a mean absolute error (MAE) of 6.32 µg m−3 on a daily scale [35]. To align with the corresponding daily-scale crop fire-point data, daily-scale PM2.5 data from 2015 to 2021 were selected for this study.

2.4. Feature Selection

To address the multicollinearity among the predictors in our model, we conducted a thorough feature selection process by calculating both the correlation coefficient (R) and variance inflation factor (VIF) for each variable. A correlation coefficient above 0.7 typically signals a strong linear relationship between variables. Additionally, a VIF is utilized to measure the severity of collinearity, with values exceeding 10 indicating significant multicollinearity, which is a common threshold in statistical analyses [36]. To ensure robustness in our analysis, we adopted stringent criteria and excluded any variable with an R greater than 0.7 or a VIF exceeding 10 [37] because such levels suggest a substantial multicollinearity that could compromise the model’s validity.

2.5. Random Forest Model

The random forest (RF) algorithm is favored in machine learning for its efficacy in classification and regression tasks [38]. It operates by integrating multiple decision trees to improve prediction accuracy without a proportional increase in computational demands [39]. Recognized for its capacity to efficiently process large datasets with numerous variables, an RF is well-suited for complex analyses. In our study, we utilized an RF to examine the spatial and temporal distribution of PM2.5, using variables such as crop fire-point counts, PRE, TEM, DEM, Wind, and AOD. We employed a Bayesian optimization to carefully adjust the key hyperparameters, including n_estimators, max_depth, and min_samples_split, to optimize the model’s performance [40].

2.6. Interpretable Analysis

The Shapley Additive Explanation (SHAP) methodology, derived from cooperative game theory, offers a robust framework to interpret machine learning model outputs [41]. The SHAP allocates Shapley values to each feature in a dataset, measuring their individual contributions to predictive outcomes on both local and global levels [42]. This analytical method surpasses traditional machine learning interpretation techniques by facilitating an accurate assessment of each feature’s impact and directionality on specific predictions and the overall model. For any given sample, the Shapley value for a feature parameter i is computed using the following calculation:
Shapleyvalue ( i ) = S N \ { i } | S | ( M - | S | - 1 ) ! M ! [ f x ( S { i } ) - f x ( S ) ]
In this context, N represents the comprehensive set of all feature parameters, encompassing a total of M dimensions. S refers to a specific subset selected from N, characterized by a dimensionality of | S | . The function f x ( S ) delivers the outcome produced when employing only the subset of the feature parameters of S. Conversely, the function f x ( S { i } ) produces an output resulting from the incorporation of parameter i with the existing set of the feature parameters of S. The Shapley value’s magnitude reflects how significantly the feature parameters influence the prediction made by the model. Meanwhile, the Shapley value’s sign determines whether this influence positively or negatively impacts the prediction.

2.7. Data Preparation for Temporal and Spatial Models

To comprehensively assess the impact of straw burning on PM2.5 from both temporal and spatial perspectives, we developed the following two distinct models: a temporal model and a spatial model. As straw burning takes place on farmland, the factors influencing PM2.5 levels slightly differ from typical scenarios, reflecting the unique conditions of agricultural landscapes. Consequently, we focused on meteorological conditions, DEM, AOD, and crop fire points as key elements to explore their combined effects on PM2.5 concentrations.
For the temporal model, we firstly identified the fire points located within agricultural territories by extracting these areas from land-cover datasets. Subsequently, we utilized the fire-point data to extract the values of the influencing factors at these specific locations on a daily basis. To mitigate the impact of spatial variability and enhance the representativeness of the data, we averaged these factors across the entire province for identical time frames. This process included a rigorous screening to eliminate records with null values, ensuring data integrity. Through this meticulous data preparation and validation process, we compiled a dataset comprising 749 valid records. For the spatial analysis, we constructed a provincial grid with a resolution of 0.05 degrees. Within each grid cell, we counted the number of fire points and extracted their corresponding influencing factors across different times. These factors were then averaged within each cell to provide a comprehensive view of the conditions associated with fire events. Through this approach, we obtained a total of 7843 valid records, each representing the averaged influencing factors of the fire points within a specific grid cell.

3. Results and Discussion

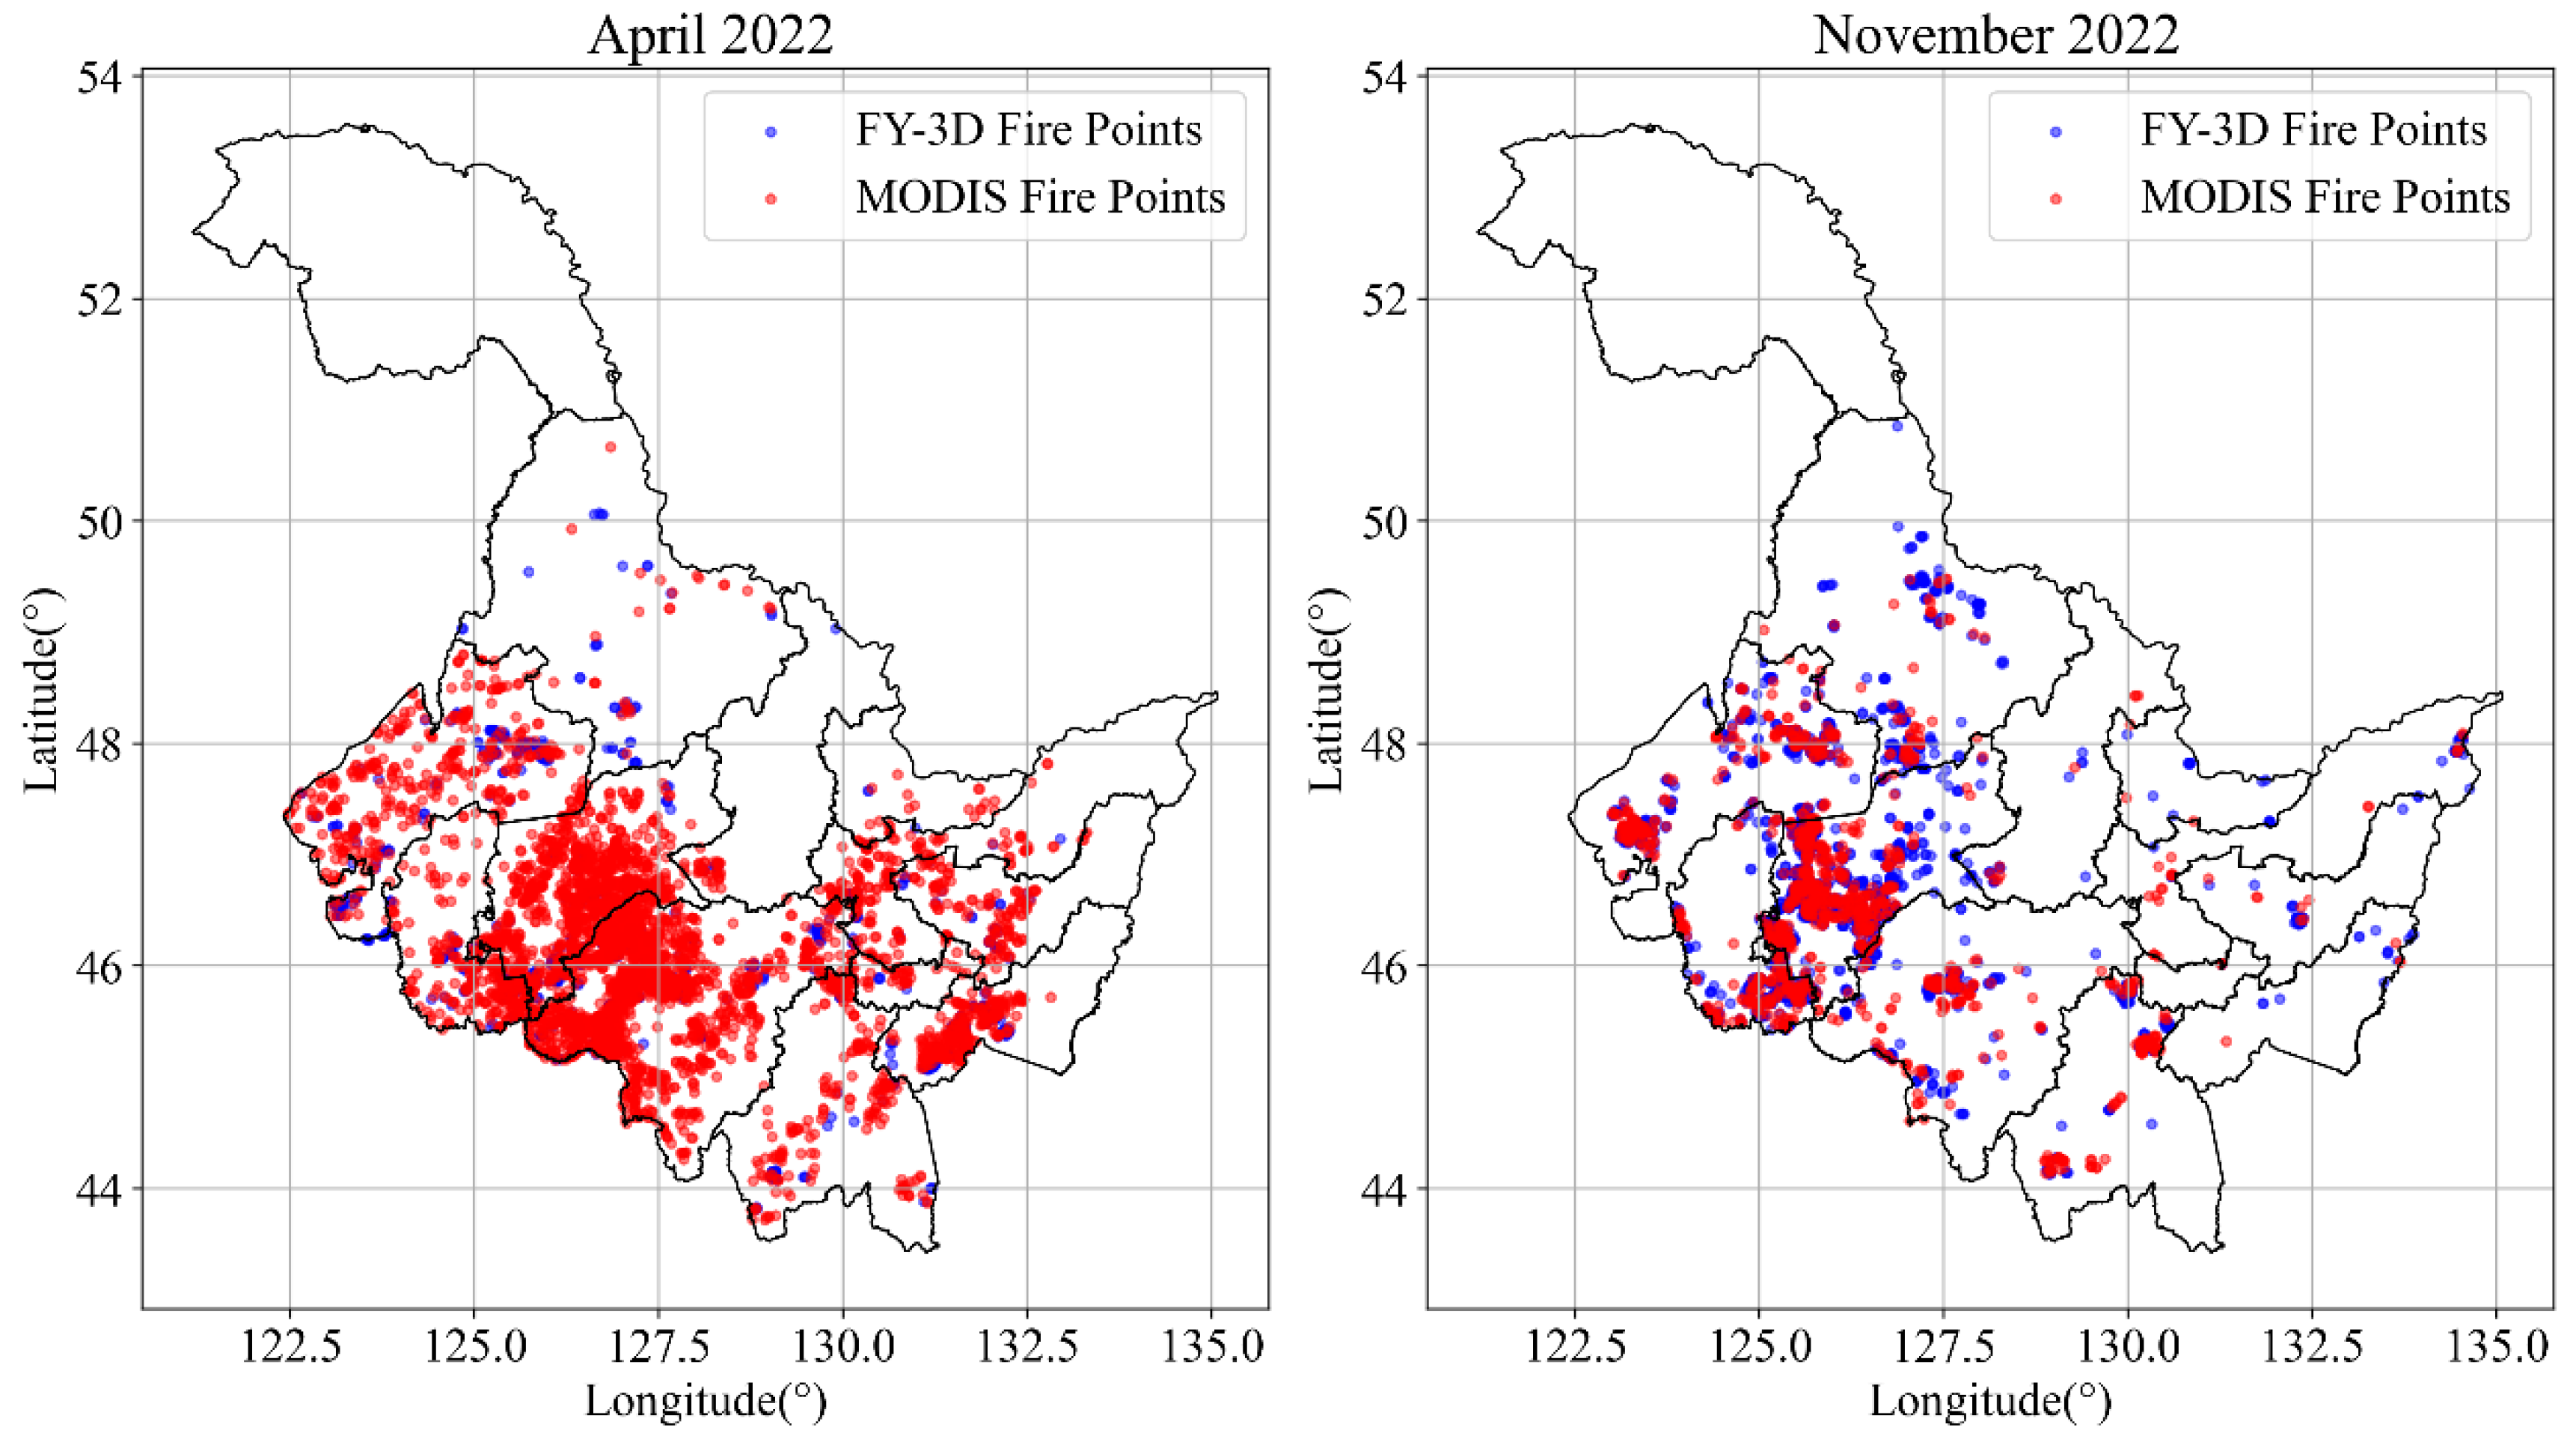
3.1. Comparison with MODIS Fire Points

To investigate the spatial alignment between FY-3D and MODIS fire-point data, we focused on April and November 2022, months characterized by a heightened occurrence of straw fires. In our analysis, we employed cKDTree, a data structure within the scipy spatial module of Python. cKDTree is specially designed to organize and query multidimensional point data efficiently, making it ideal for spatial analyses. By spatially indexing MODIS fire points using cKDTree, we pinpointed the nearest MODIS fire point relative to each FY-3D point. We then set a distance threshold of 0.05 degrees to effectively calculate the spatial match rates. Our findings revealed that the spatial congruence between the FY-3D and MODIS fire points in April and November reached 86% and 78% (Figure 1), respectively, indicating a high degree of correspondence.

3.2. Spatial Distribution of Fire Points

Figure 2 presents a detailed visualization of the fire-point distribution in Heilongjiang Province over the period from 2015 to 2023. It was evident that there was a pronounced aggregation of fire spots in both the western and eastern parts of the province. Notably, the cities of Qiqihar, Suihua, and Harbin, situated predominantly in the western and southern regions, emerged with the highest concentration of fire points. Together, they constituted about 54.2% of the total fire spots recorded in the province. These cities are situated in the agriculturally rich Songnen Plain, a factor that likely contributed to the prevalent practice of straw burning. This pattern underscored a clear link between intensive agricultural activities and the frequency of fire points, highlighting the impact of regional agricultural practices on fire incidence.

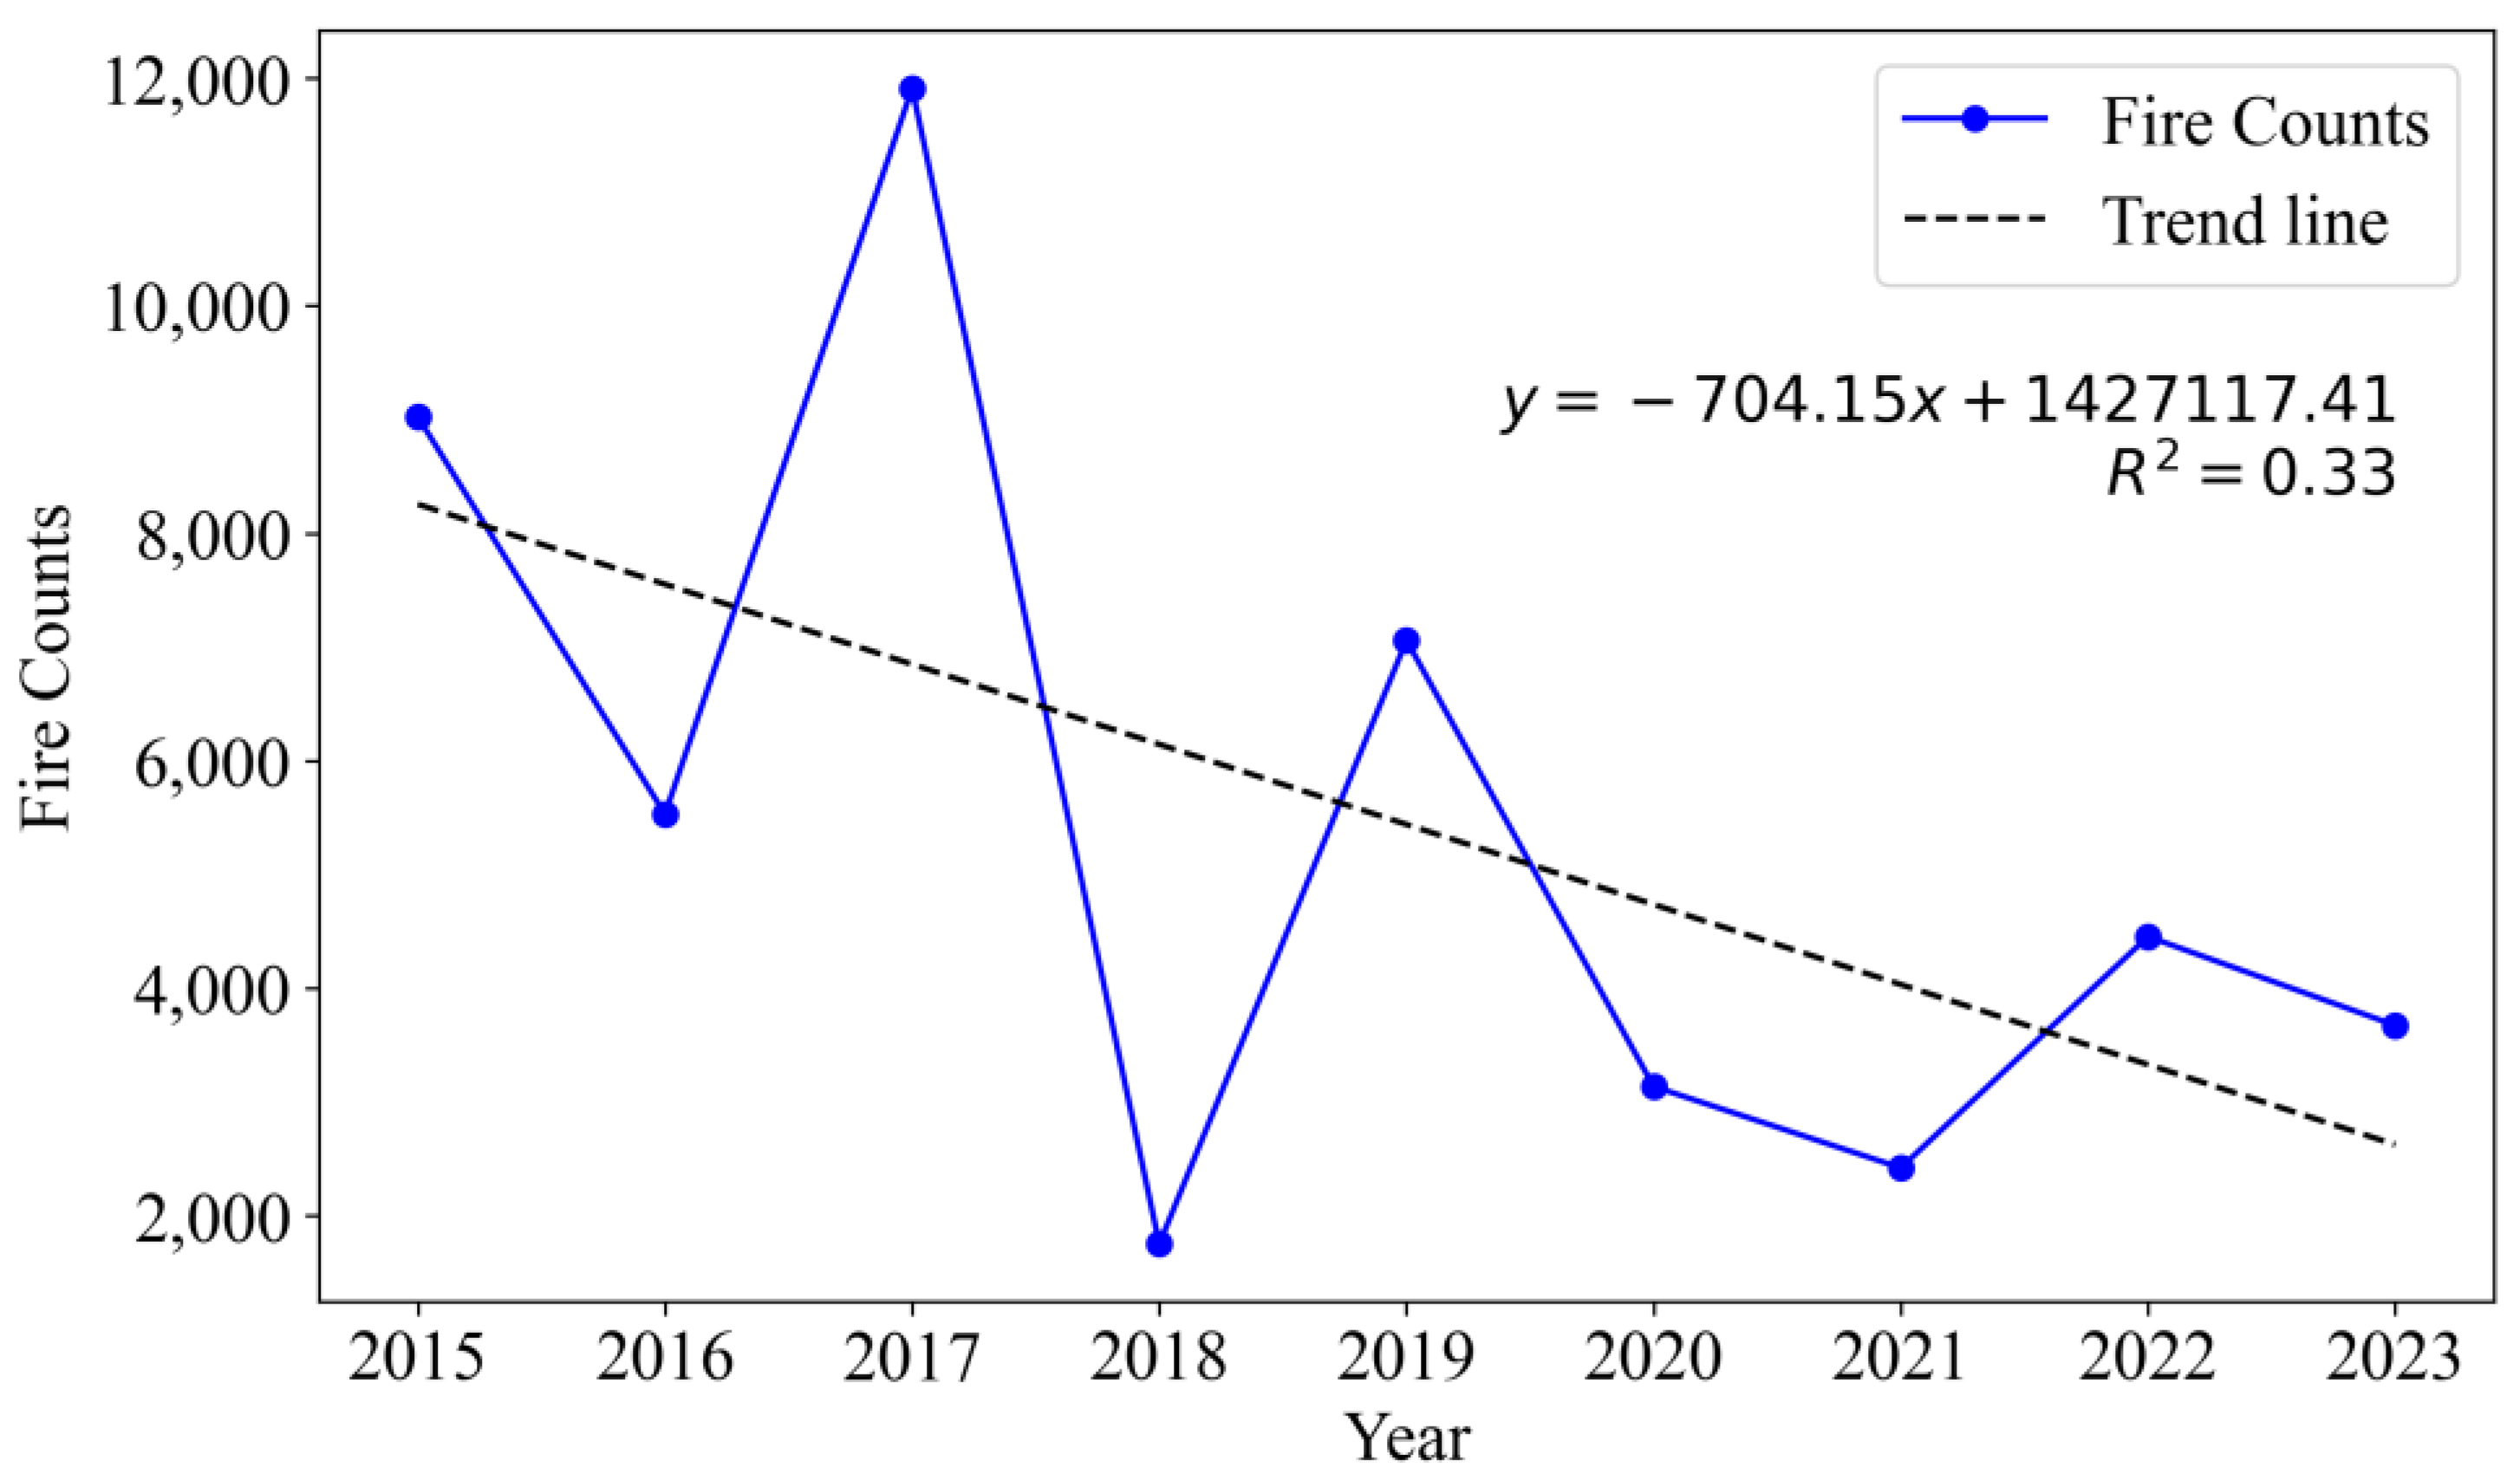
3.3. Temporal Patterns and Variations

An analysis of crop fire counts from 2015 to 2023 indicated that there was no significant overall downward trend. As depicted in Figure 3, the rate of fire incidents in 2016 was relatively low, but there was a marked peak in 2017, which represented the highest number of straw-burning fire points during the study period. This peak then sharply decreased in 2018, primarily due to the effective implementation of the “Air Pollution Prevention and Control Action Plan” by the Chinese government, which strictly regulates open biomass burning, including crop residues [43]. In the subsequent years, the fire counts fluctuated, with another peak occurring in 2021 followed by a downward trend in 2022. The rate of fire incidents continued to decline in 2023, sustaining the downward trend from the previous year. Despite the Chinese government’s enactment of policies regarding straw burning, the substantial volume of crop residues and the high costs associated with residue collection imply that agricultural burning remains commonplace [44]. It was evident that while instances of straw burning decreased, they occasionally fluctuated and demonstrated a gradual trend toward stability.

3.4. Monthly Variations in Crop Fire Points

Figure 4 depicts the average monthly distribution of crop fire incidents between 2015 and 2023, highlighting a prominent peak in April and a substantial uptick starting in October, culminating in a second peak in November. The number of fire points in February–April and October–November accounted for 54.6% and 42.5% of the whole year, respectively. The two periods exhibiting increased fire incidents corresponded with the spring and autumn plowing seasons, respectively. The observed pattern of fire activity, with minimal occurrences from May to September and significant rises in the months of intensive farming practices, suggested a strong linkage between agricultural activities and the frequency of crop fires.

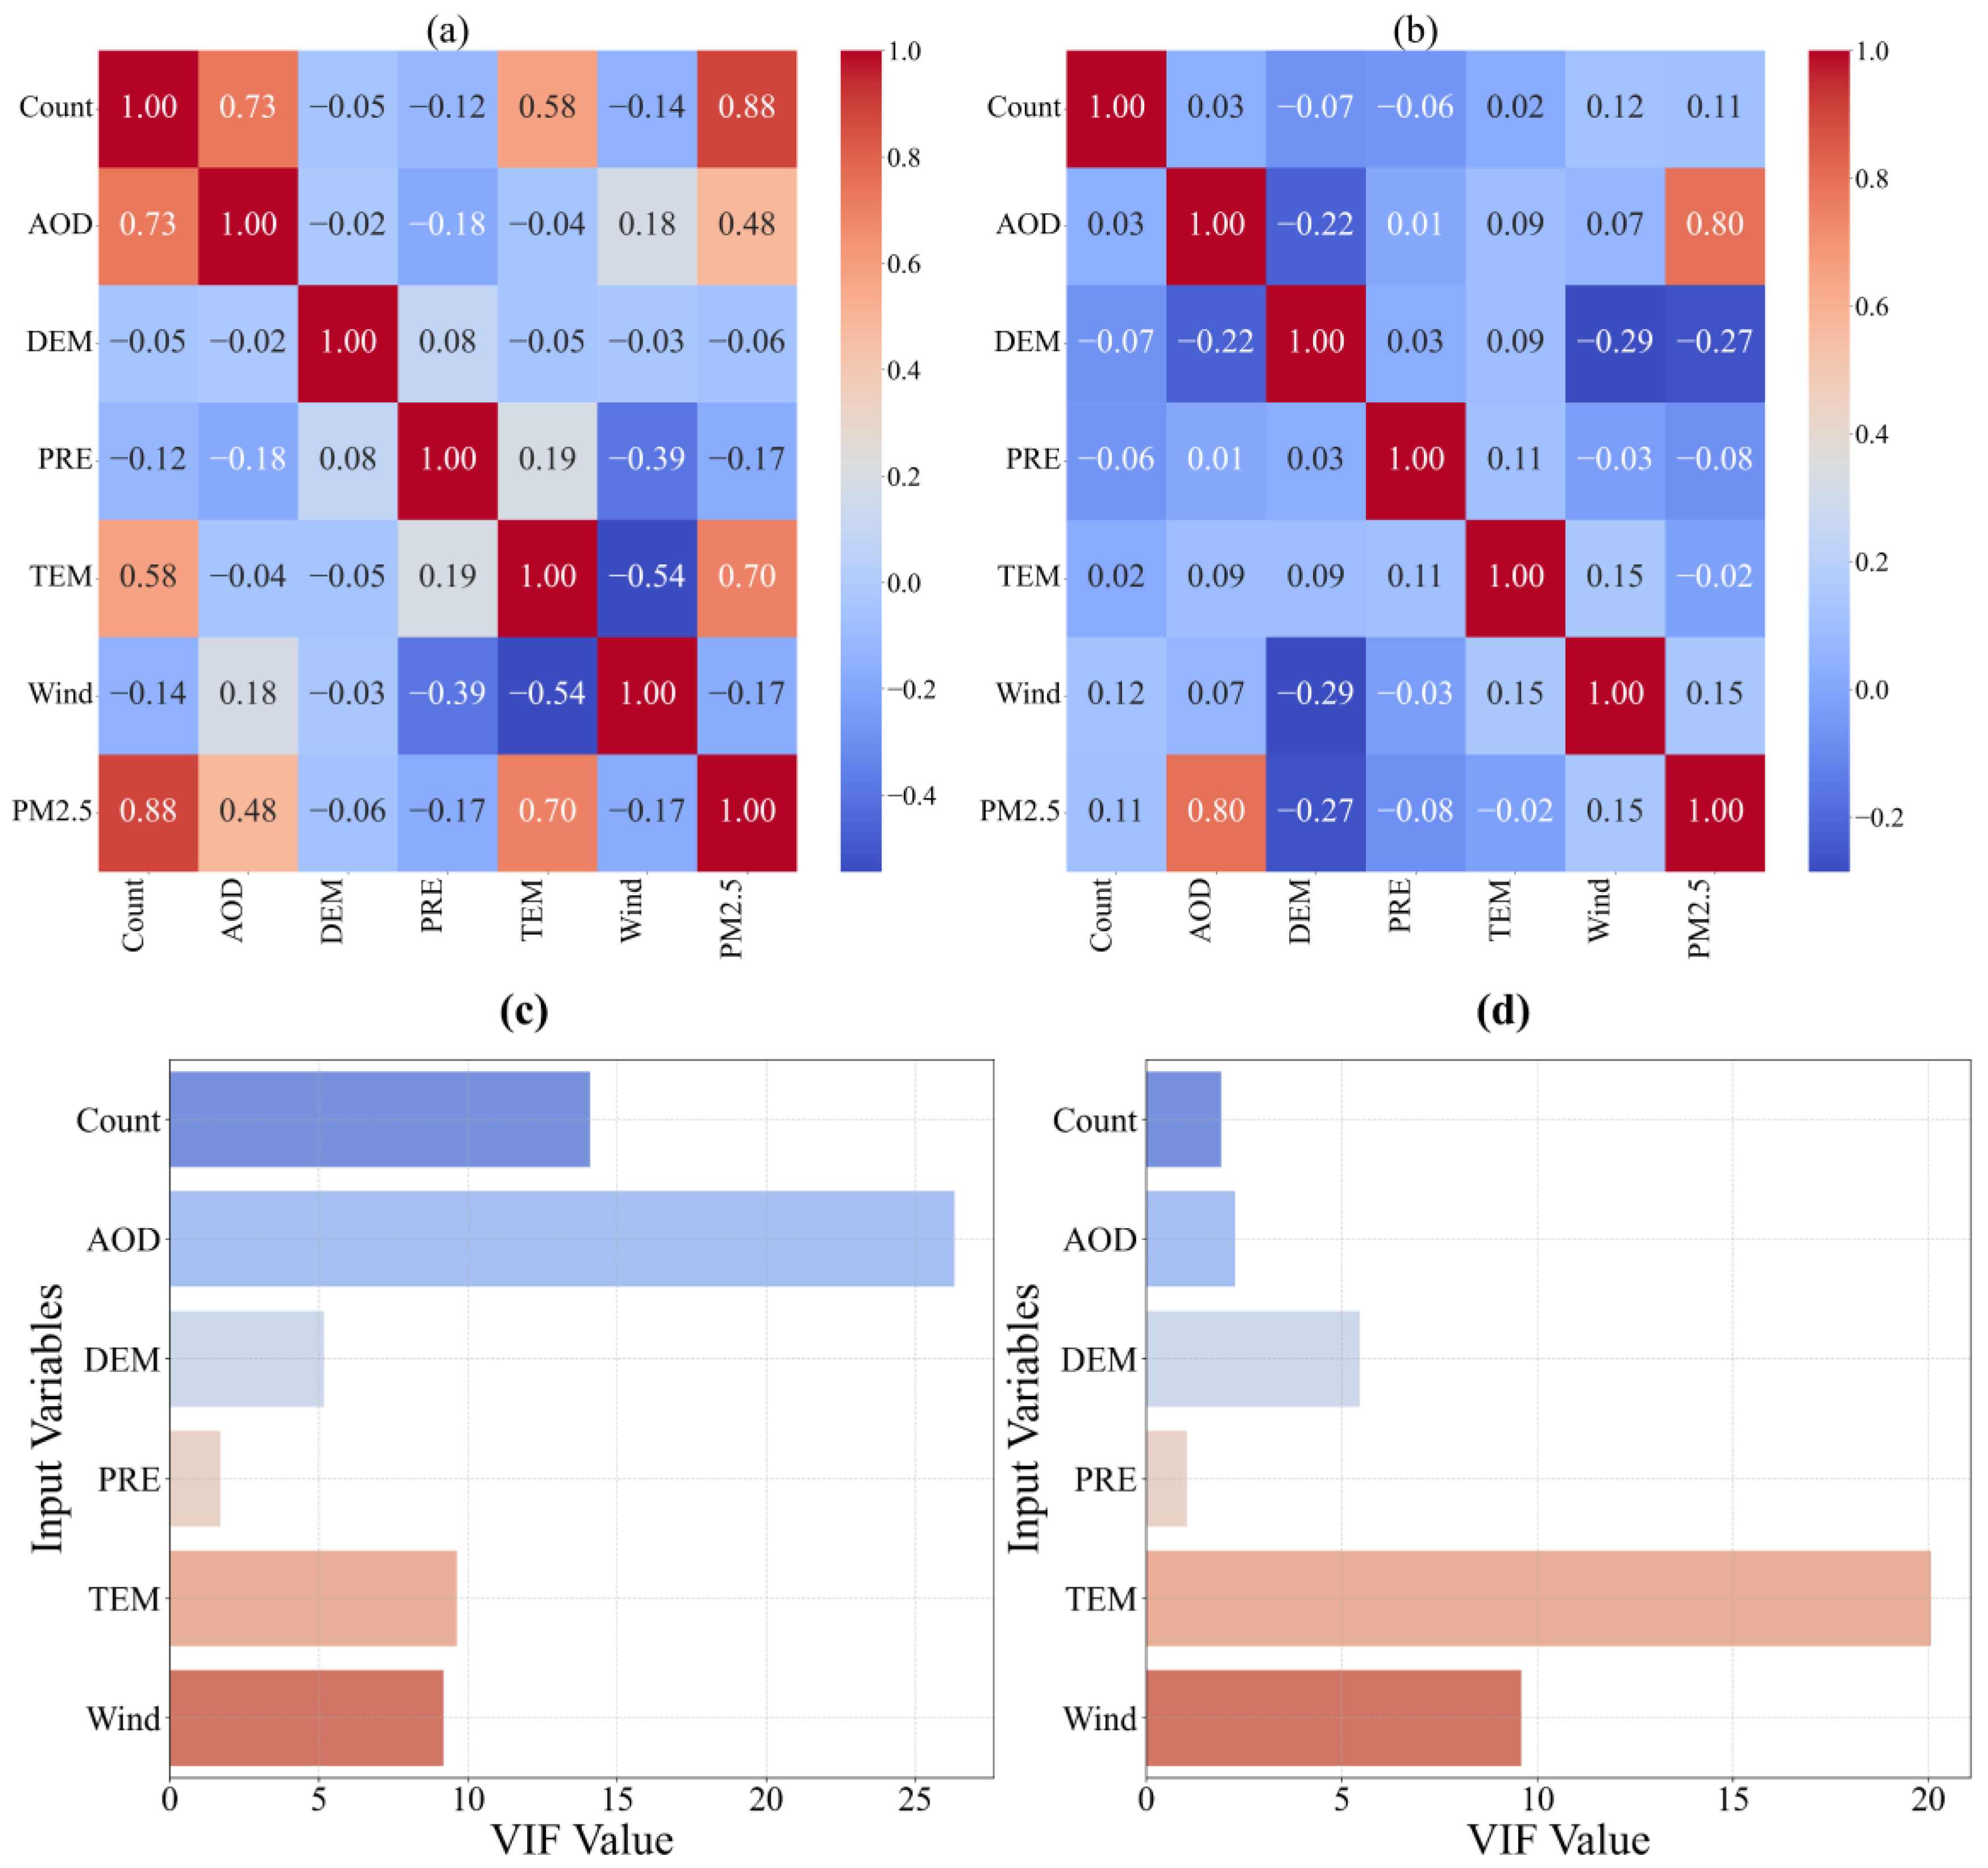
3.5. Correlation and Collinearity Analyses of Input Features

To assess multicollinearity among the variables and avoid redundant or duplicated information, the optimal combination to estimate PM2.5 concentrations was selected based on the Pearson correlation coefficients and variance inflation factor (VIF) values of the input features (Figure 5). VIF values were calculated for all input variables and the variables with the highest values were sequentially removed until the VIF values for all remaining variables were less than 10. Based on the Pearson correlation coefficient and VIF, the final model excluded AOD (VIF = 26.3, Pearson correlation coefficient between Count and AOD = 0.73, and R > 0.7) in the temporal model and TEM (VIF = 20.1) in the spatial model because the correlation coefficients were greater than 0.7 or the VIFs were greater than 10.

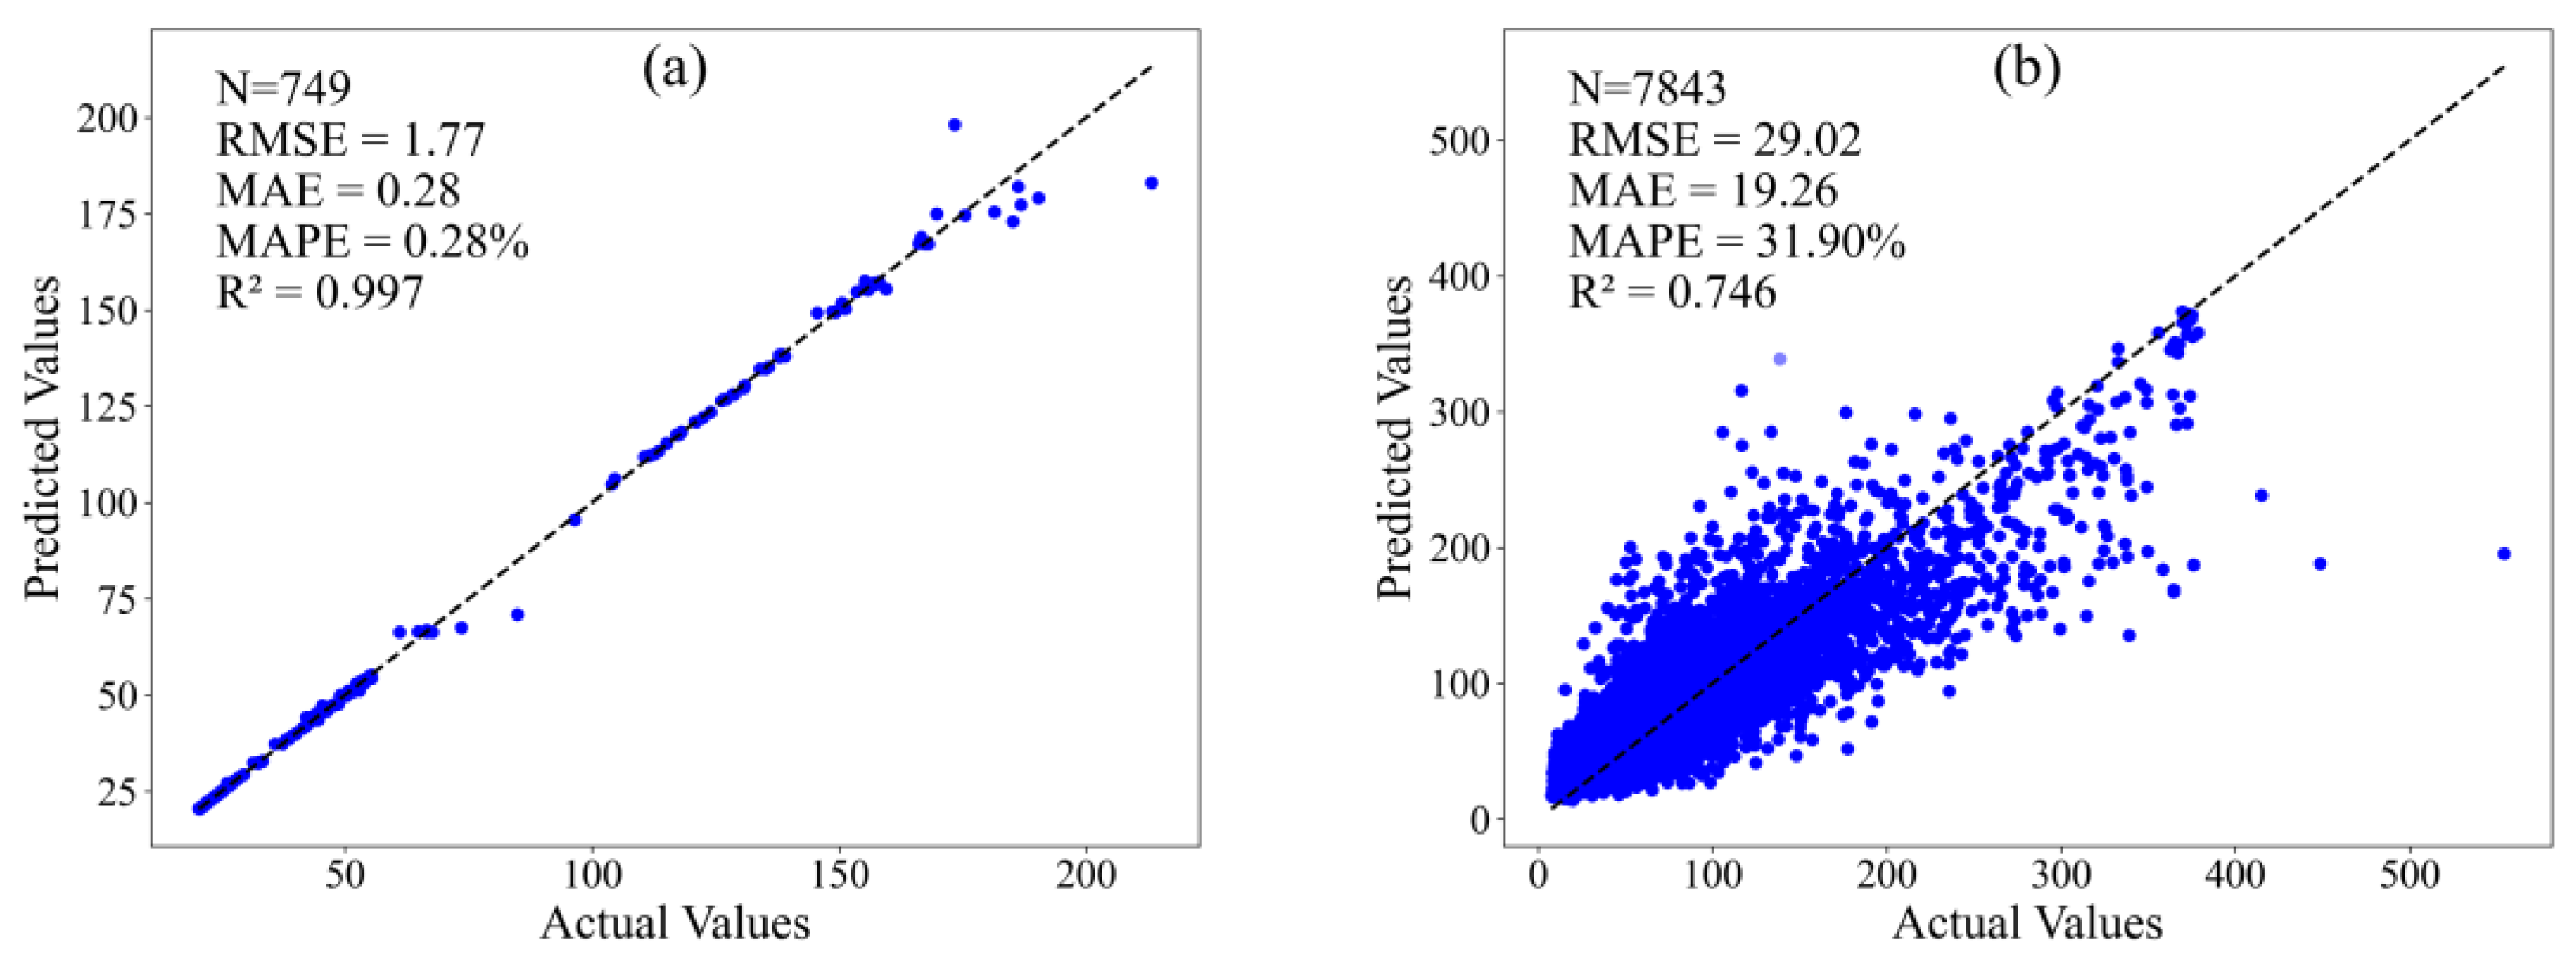
3.6. Accuracy of the Temporal and Spatial Models

In this research, to evaluate the influence of six variables on PM2.5 levels, we developed two machine learning models utilizing the random forest (RF) algorithm, focusing on temporal and spatial aspects. The data were split into the following two distinct groups: 70% for training purposes and 30% for testing. The effectiveness of the models was assessed using the widely accepted method of 10-fold cross-validation [25]. Through Bayesian optimization, the study identified the optimal parameters for the temporal model as follows: max_depth at 28, min_samples_split at 3, and n_estimators at 10. For the spatial model, the optimal parameters were determined as follows: max_depth at 41, min_samples_split at 15, and n_estimators at 96. Figure 6 presents the performance indicators of the temporal and spatial RF regression models, including the sample size (N), coefficient of determination (R2), root mean square error (RMSE), mean absolute percentage error (MAPE), and mean absolute error (MAE). Both models demonstrated excellent performance (R2 = 0.997 for the temporal model and R2 = 0.746 for the spatial model). Therefore, the SHAP method was applied to quantify the impact of each variable on PM2.5 levels within each model.

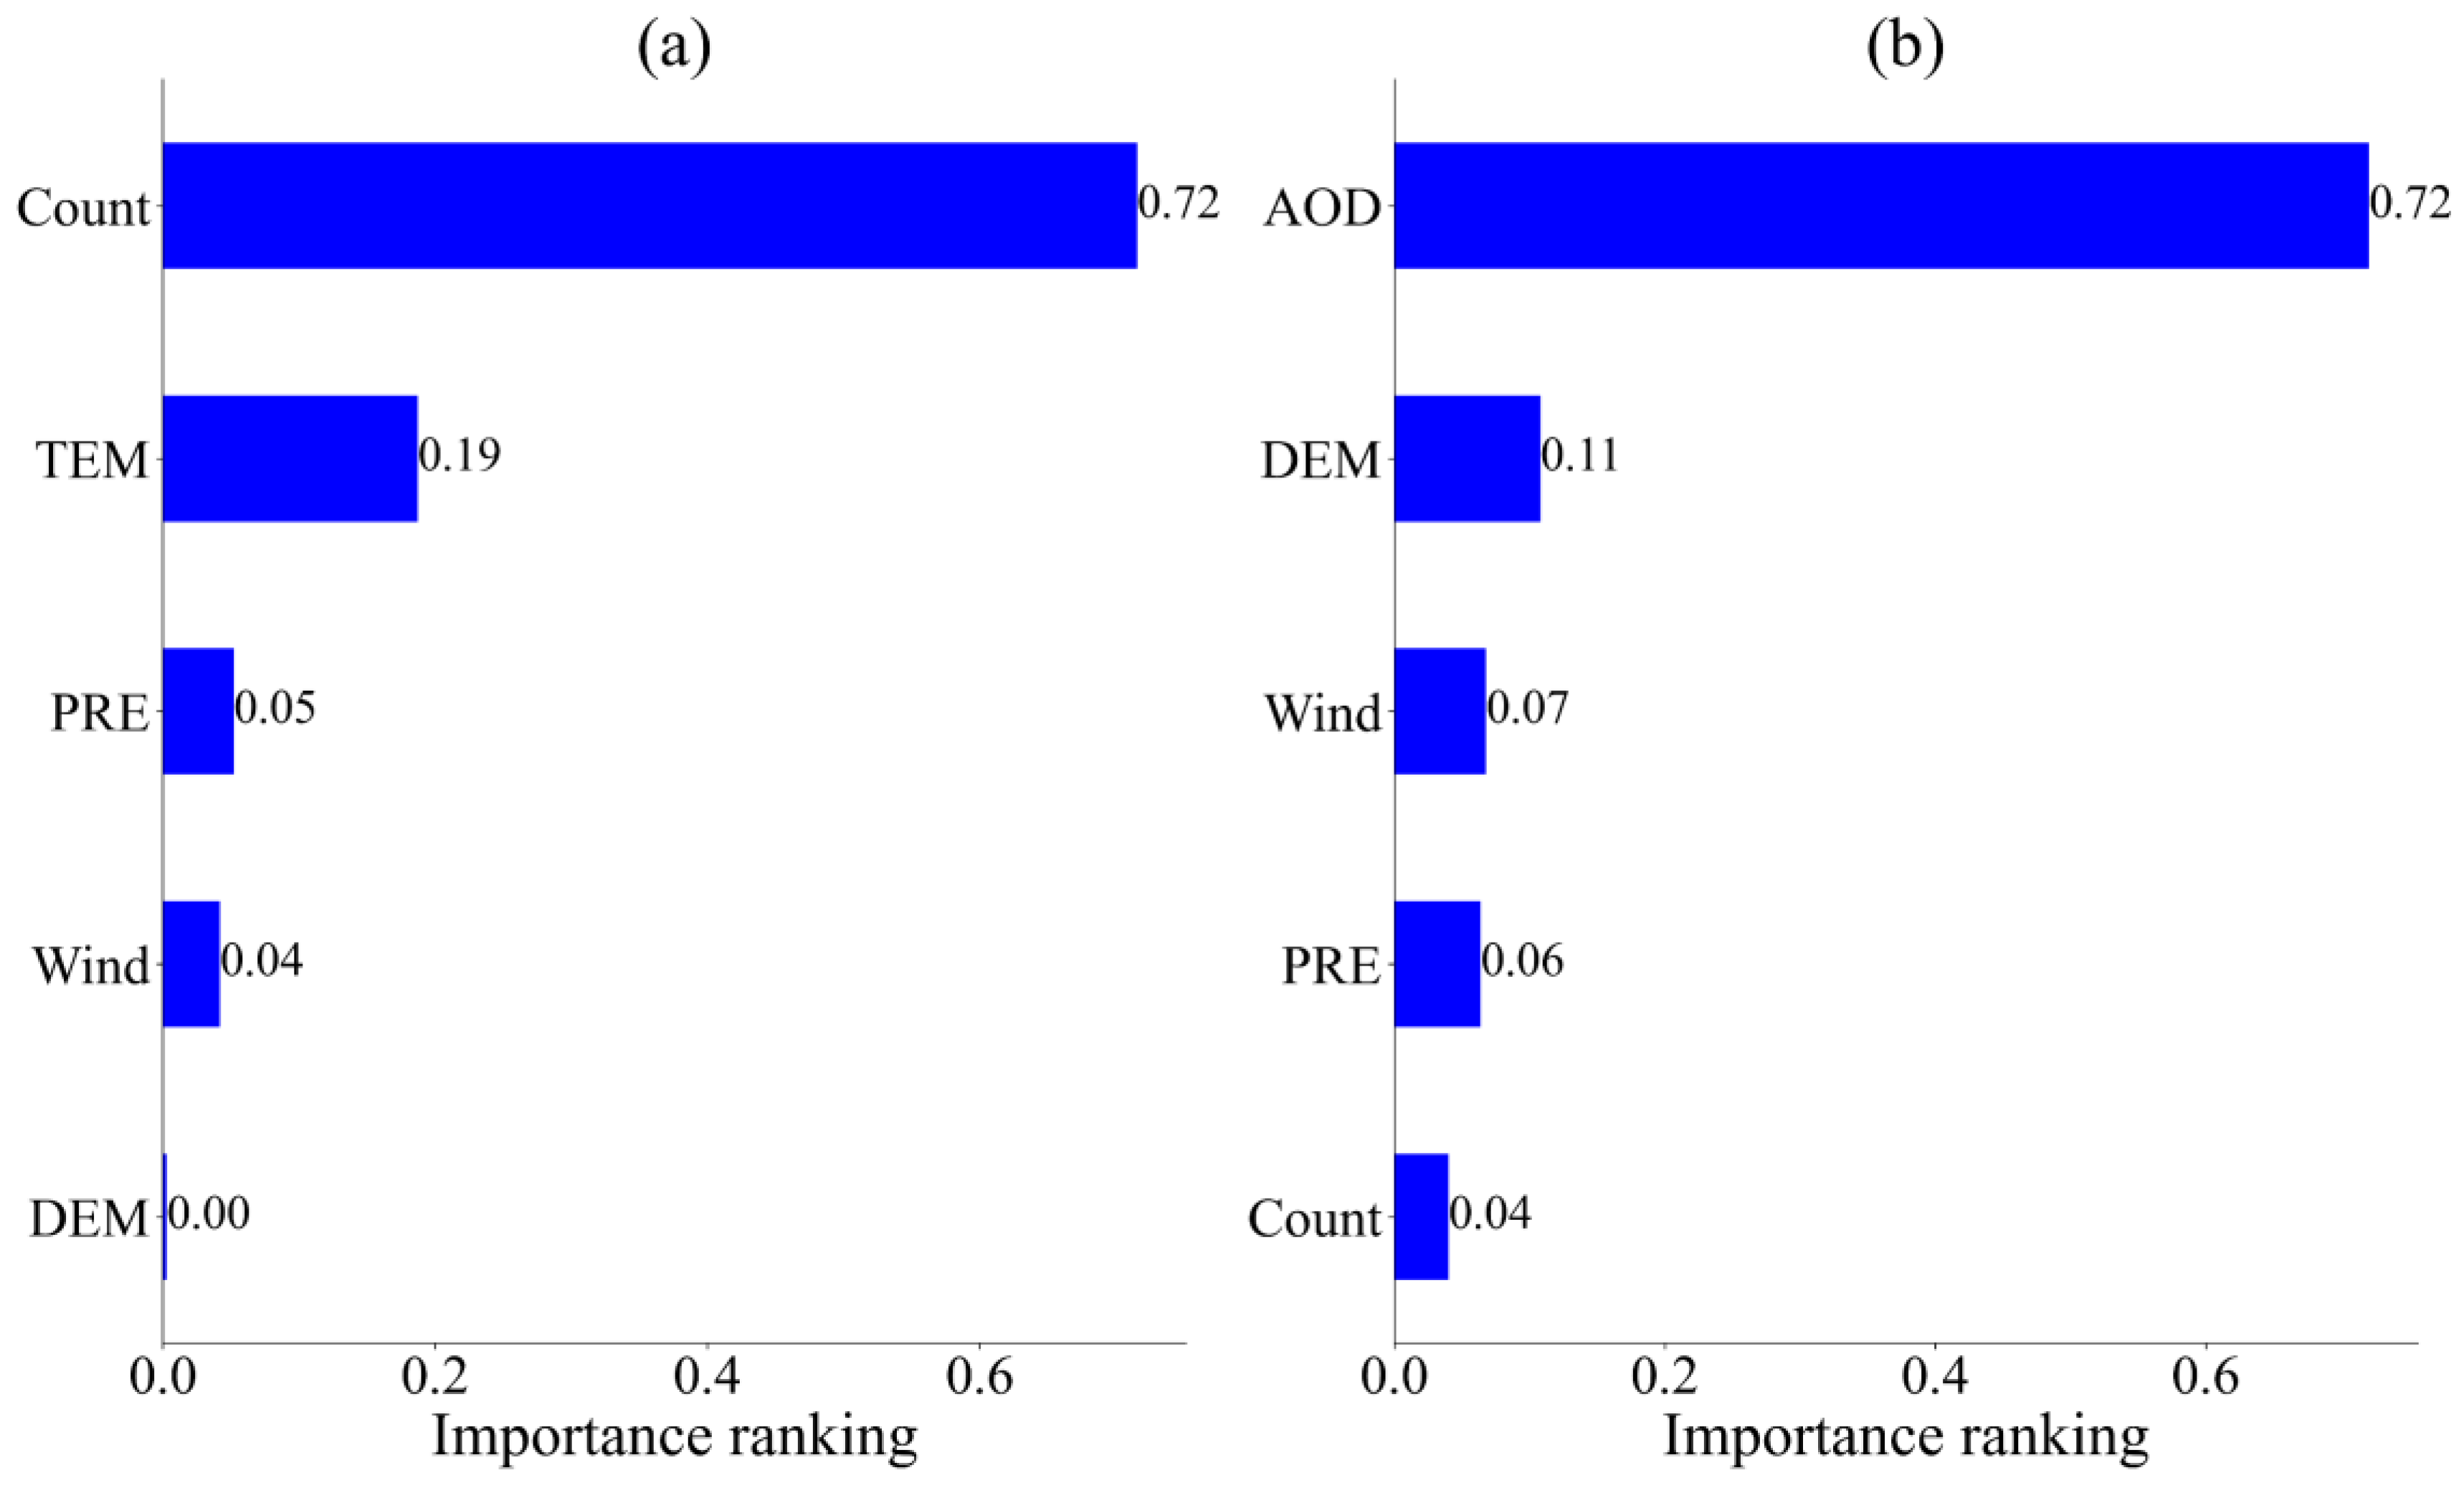
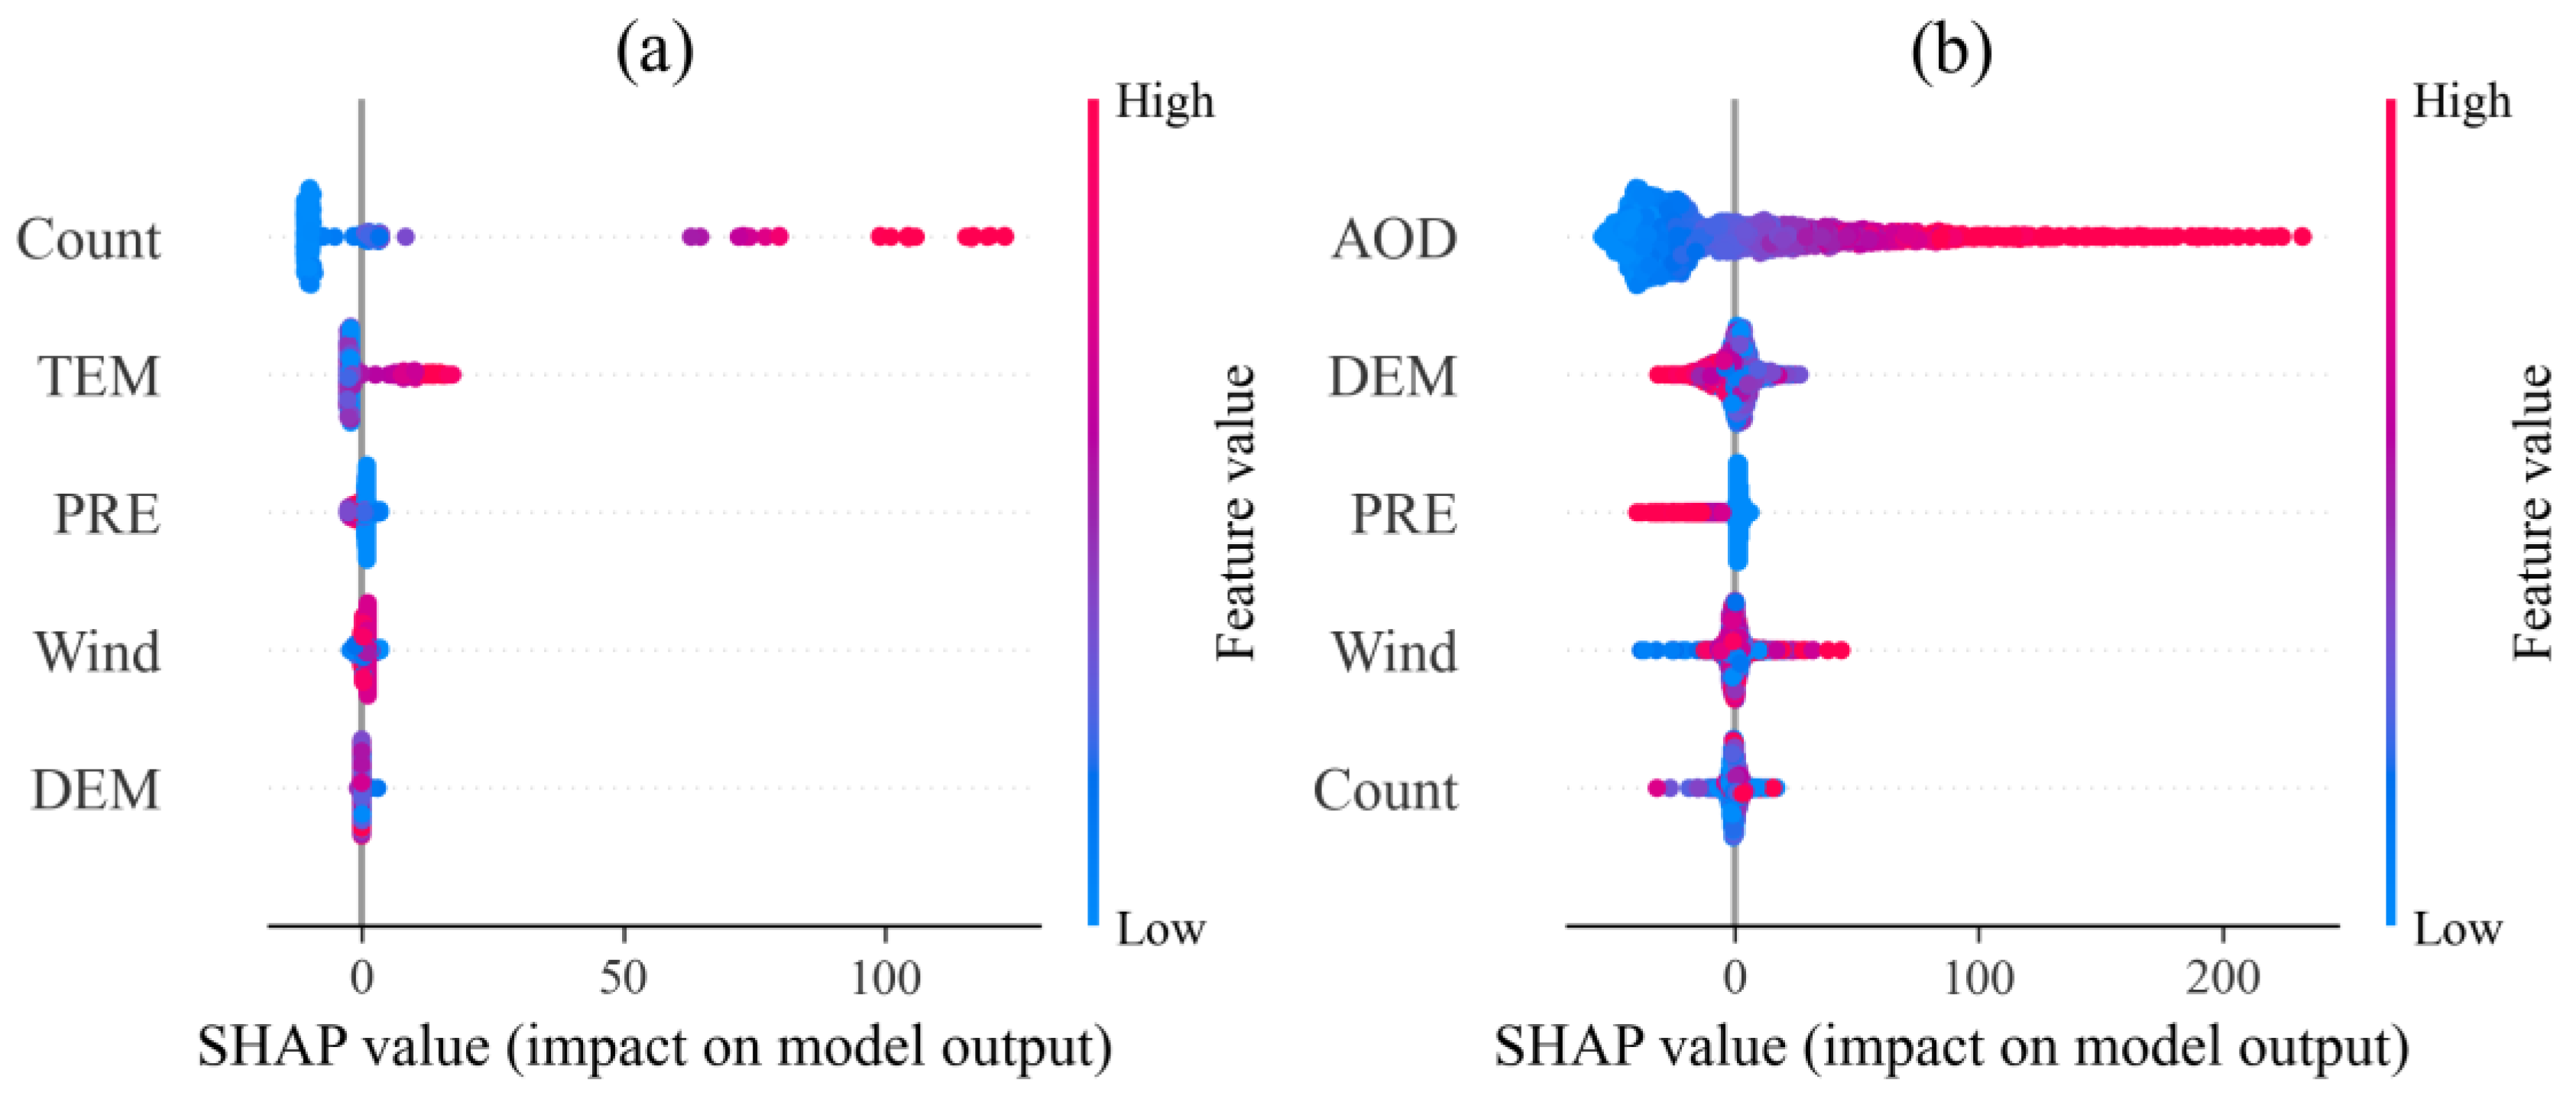
3.7. Impacts of Straw Burning and Other Influencing Factors on PM2.5

In this study, we utilized the Tree Explainer from SHAP—specifically designed for tree-based models [45]—for the entire dataset to calculate the Shapley values for each variable. These values were used to assess each variable’s importance, with their absolute values averaged to derive a global importance ranking. Crucially, we then normalized these average absolute values to sum up to 1, enabling a clear assessment of each variable’s proportional impact. The findings are depicted in the summary plots in Figure 7 and Figure 8.
Notably, the importance rankings of the six variables varied considerably between the temporal and spatial models. In the temporal model, the number of fire-point counts emerged as the predominant contributor to PM2.5 levels, with an importance value of 0.72 (Figure 7a), highlighting it as the critical factor influencing PM2.5 variations during straw-burning periods. TEM followed as the second significant factor, with an importance value of 0.19. Both the fire-point count and TEM had a positive impact on PM2.5 levels (Figure 8a), indicating that an increase in fire counts accompanied by rising temperatures contributed to the worsening of PM2.5 conditions. Other elements, including PRE, Wind, and DEM, had a smaller spread of SHAP values clustered around zero, indicating a lesser and more variable impact on PM2.5 levels.
In the spatial model, AOD exhibited the most significant positive impact on PM2.5 concentrations. This was demonstrated by the fact that positive values of AOD were clustered on the right-hand side (Figure 8b), indicating an increase in PM2.5 with higher AOD values. DEM was the second influential factor on PM2.5 levels, with an importance value of 0.11 (Figure 7b). Wind, PRE, and the number of fire points (Count) were characterized by minimal SHAP importance values, suggesting that these features exerted a relatively minor influence on PM2.5 levels. When integrating insights from both models, we ascertained that although agricultural fires were a key temporal factor for PM2.5 levels, spatial variations in PM2.5 were influenced by a broader range of environmental and geographical factors, with AOD serving as the primary spatial determinant.

4. Discussion

Although the FY-3D fire-detection products exhibit markedly higher accuracy than MODIS in China [12], a validation of their precision in Heilongjiang—the focus of our research—has not yet been conducted due to the absence of field validations. To address this, we conducted a comparative analysis of fire spots detected by the Fengyun-3 and MODIS satellites. We discovered a significant level of agreement between the datasets, indicating that the fire-point data from the Fengyun-3 satellite could effectively serve as a reliable data source to characterize regional fire-point occurrences. The Fengyun-3 satellite fire-point data, particularly from the Fengyun-3D variant utilized in this study, theoretically possess enhanced capabilities to detect fire points [12]. This improvement stems from the FY-3D’s fire-identification algorithm, which incorporates the strengths and technical concepts of both MODIS and VIIRS fire-detection algorithms. Moreover, the FY-3D fire products have undergone optimization for auxiliary parameters, fire detection, and subsequent re-identification processes [12].
In our investigation, the random forest (RF) methodology was effectively utilized to model the temporal and spatial dynamics of PM2.5 concentrations, demonstrating satisfactory performance. The RF algorithm, known for its proficiency in handling both regression and classification tasks [46], assigns feature importance scores that help gauge the influence of each variable on the model’s predictive accuracy [47]. However, the scores in RF models indicate global importance without detailing how feature values affect predictions across different domains. In contrast, the SHAP stands out by offering detailed insights into the influence of individual features on each sample, including the direction of their impact and whether positive or negative [48]. For instance, the SHAP analysis revealed a positive impact of Count on PM2.5 levels in the temporal model and a positive impact of AOD on PM2.5 levels in the spatial model. In contrast, positive values of PRE were clustered on the left-hand side in the spatial model, indicating a decrease in PM2.5 with higher PRE values. Therefore, by marrying the predictive prowess of an RF with the detailed explanatory insights provided by a SHAP analysis, our approach augmented the model’s interpretability and enriched our comprehension of the diverse influences on PM2.5 concentrations.
A comparative analysis of the temporal and spatial models revealed distinct determinants of fluctuations in PM2.5 levels, highlighting the complexity of air-pollution sources. A temporal analysis revealed that straw burning significantly influenced PM2.5 concentrations, underscoring the substantial effect of agricultural practices on air-quality dynamics. Implementing targeted strategies such as devising optimized burning schedules or minimizing the scale of burns could significantly improve the air quality during critical burning seasons. These interventions would not only mitigate the direct impact of straw burning on air quality, but also alleviate the burden of straw collection for farmers. Spatially, the study identified AOD as a pivotal factor influencing air quality across various regions. AOD’s significance lies in its ability to reflect a broad spectrum of sources affecting air quality, encompassing urban pollution, industrial emissions, agricultural burning, and natural phenomena like dust storms [49,50,51,52]. This positions AOD as a comprehensive indicator to assess the myriad contributors to spatial air-quality variances. Therefore, although managing straw burning is crucial, attributing air pollution solely to this activity oversimplifies the issue. Effective air-quality improvements require a multifaceted approach that considers the cumulative effects of both anthropogenic and natural pollution sources [53]. Implementing synergistic management strategies that address the complex interplay of these sources is essential to achieve substantial air-quality enhancements.
This study had several limitations. Under normal circumstances, a broader array of anthropogenic factors such as GDP and population density should be taken into account. These factors could be provided as gridded data products [54,55] to extract and analyze specific values in agricultural areas. However, the generation of these products often relies on night-time light and statistical data, which may not accurately characterize the population or GDP within an agricultural area. Hence, exploring more accurate methods to portray and express the impact of anthropogenic factors on agricultural areas warrants future consideration. Moreover, although the integration of AOD data with PM2.5 estimates indeed provides a more accurate reflection of air quality [35], it is essential to recognize that the dispersion of pollutants from agricultural fires through atmospheric diffusion can still obscure the direct contribution of fire counts on local PM2.5 levels. Furthermore, the 0.05 degree grid used in this study was empirical, potentially impacting the significance of the crop fire counts. Future studies are encouraged to explore a wider range of spatial scales to more precisely determine the effects of crop fires and various other factors on PM2.5 levels.
In summary, our approach leveraged high-precision remote sensing data, advanced machine learning techniques, and interpretable models to elucidate the relative significance and effects of straw burning and associated factors on PM2.5 levels across spatial and temporal dimensions on a farm scale. This research provides valuable insights for policymakers, enabling them to formulate more comprehensive strategies to effectively tackle air pollution.

5. Conclusions

In this study, the effects of various variables (including crop fire-point data, meteorological conditions, and AOD) on PM2.5 levels were systematically assessed using a combination of a random forest (RF) model and Shapley Additive Explanations (SHAPs), specifically focusing on the effects of straw burning on PM2.5 levels.
This study revealed a fluctuated decline in crop fires throughout Heilongjiang Province from 2015 to 2023, a trend potentially linked to governmental policies addressing straw burning in China. Spatially, the cities of Qiqihar, Suihua, and Harbin—situated predominantly in the western and southern regions—emerged with the highest concentration of fire points. On a monthly scale, straw burning occurred mainly from February to April and from October to November, accounting for 97% of the annual number of fires, which was primarily attributed to the agricultural practices of spring and fall plowing.
The RF model exhibited outstanding performance across both temporal and spatial dimensions, achieving R2 values of 0.997 and 0.746, respectively. The SHAP analysis revealed that the counts of crop fires were the predominant factor influencing the temporal variations in PM2.5 levels during straw-burning periods, accounting for 72 percent of the variation. However, its significance was markedly lower in the spatial analysis. For the spatial model, the PM2.5 concentrations were primarily determined by AOD. In both models, TEM and DEM were identified as secondary factors, with different degrees and directions of influence on PM2.5 concentrations, respectively.
Despite certain limitations in spatial matching and scale selection, the impact of straw burning on PM2.5 across spatial and temporal dimensions on a farmland scale was revealed through the utilization of high-precision remote sensing data, advanced machine learning techniques, and interpretable models. Concurrently, additional crucial factors influencing PM2.5 concentrations were illuminated by our analysis, providing policymakers with essential insights to devise more effective strategies to combat air pollution.

Author Contributions

Conceptualization, W.W. and Z.Z.; methodology, B.L. and W.Q.; formal analysis, Z.X., Z.Z. and W.Q.; investigation, B.L., W.W., Z.Z. and W.Q.; data curation, Z.X.; writing—original draft, Z.X.; writing—review & editing, B.L. and W.W.; visualization, Z.X.; supervision, B.L. and W.W. All authors have read and agreed to the published version of the manuscript.

Funding

This research received no external funding.

Institutional Review Board Statement

Not applicable.

Informed Consent Statement

Not applicable.

Data Availability Statement

The data presented in this study are available on request from the corresponding author.

Conflicts of Interest

The authors declare no conflict of interest.

References

  1. Shi, Y.; Gong, S.; Zang, S.; Zhao, Y.; Wang, W.; Lv, Z.; Matsunaga, T.; Yamaguchi, Y.; Bai, Y. High-resolution and multi-year estimation of emissions from open biomass burning in Northeast China during 2001–2017. J. Clean. Prod. 2021, 310, 127496. [Google Scholar] [CrossRef]
  2. Yin, S.; Guo, M.; Wang, X.; Yamamoto, H.; Ou, W. Spatiotemporal variation and distribution characteristics of crop residue burning in China from 2001 to 2018. Environ. Pollut. 2021, 268, 115849. [Google Scholar] [CrossRef] [PubMed]
  3. Huang, L.; Zhu, Y.; Wang, Q.; Zhu, A.; Liu, Z.; Wang, Y.; Allen, D.T.; Li, L. Assessment of the effects of straw burning bans in China: Emissions, air quality, and health impacts. Sci. Total Environ. 2021, 789, 147935. [Google Scholar] [CrossRef]
  4. Cheng, Z.; Wang, S.; Fu, X.; Watson, J.G.; Jiang, J.; Fu, Q.; Chen, C.; Xu, B.; Yu, J.; Chow, J.C.; et al. Impact of biomass burning on haze pollution in the Yangtze River delta, China: A case study in summer 2011. Atmos. Chem. Phys. 2014, 14, 4573–4585. [Google Scholar] [CrossRef]
  5. Singh, J. Paddy and wheat stubble blazing in Haryana and Punjab states of India: A menace for environmental health. Environ. Qual. Manag. 2018, 28, 47–53. [Google Scholar] [CrossRef]
  6. Wu, X.; Chen, W.; Zhang, S.; Li, R.; Zhang, M.; Liu, J.; Jiang, Y.; Liu, Y. Temporal variation and chemical components of rural ambient PM2.5 during main agricultural activity periods in the black soil region of Northeast China. Atmosphere 2019, 10, 510. [Google Scholar] [CrossRef]
  7. Zha, S.; Zhang, S.; Cheng, T.; Chen, J.; Huang, G.; Li, X.; Wang, Q. Agricultural fires and their potential impacts on regional air quality over China. Aerosol Air Qual. Res. 2013, 13, 992–1001. [Google Scholar] [CrossRef]
  8. Qiu, X.; Duan, L.; Chai, F.; Wang, S.; Yu, Q.; Wang, S. Deriving high-resolution emission inventory of open biomass burning in China based on satellite observations. Environ. Sci. Technol. 2016, 50, 11779–11786. [Google Scholar] [CrossRef]
  9. Wu, J.; Kong, S.; Wu, F.; Cheng, Y.; Zheng, S.; Qin, S.; Liu, X.; Yan, Q.; Zheng, H.; Zheng, M.; et al. The moving of high emission for biomass burning in China: View from multi-year emission estimation and human-driven forces. Environ. Int. 2020, 142, 105812. [Google Scholar] [CrossRef] [PubMed]
  10. Zhou, Y.; Xing, X.; Lang, J.; Chen, D.; Cheng, S.; Wei, L.; Wei, X.; Liu, C. A comprehensive biomass burning emission inventory with high spatial and temporal resolution in China. Atmos. Chem. Phys. 2017, 17, 2839–2864. [Google Scholar] [CrossRef]
  11. Wu, J.; Kong, S.; Wu, F.; Cheng, Y.; Zheng, S.; Yan, Q.; Zheng, H.; Yang, G.; Zheng, M.; Liu, D.; et al. Estimating the open biomass burning emissions in central and eastern China from 2003 to 2015 based on satellite observation. Atmos. Chem. Phys. 2018, 18, 11623–11646. [Google Scholar] [CrossRef]
  12. Chen, J.; Yao, Q.; Chen, Z.; Li, M.; Hao, Z.; Liu, C.; Zheng, W.; Xu, M.; Chen, X.; Yang, J.; et al. The Fengyun-3D (FY-3D) global active fire product: Principle, methodology and validation. Earth Syst. Sci. Data 2022, 14, 3489–3508. [Google Scholar] [CrossRef]
  13. Lin, Z.; Chen, F.; Niu, Z.; Li, B.; Yu, B.; Jia, H.; Zhang, M. An active fire detection algorithm based on multi-temporal FengYun-3C VIRR data. Remote Sens. Environ. 2018, 211, 376–387. [Google Scholar] [CrossRef]
  14. Zhang, L.; Liu, Y.; Hao, L. Contributions of open crop straw burning emissions to PM2.5 concentrations in China. Environ. Res. Lett. 2016, 11, 014014. [Google Scholar] [CrossRef]
  15. He, G.; Liu, T.; Zhou, M. Straw burning, PM2.5, and death: Evidence from China. J. Dev. Econ. 2020, 145, 102468. [Google Scholar] [CrossRef]
  16. Mehmood, K.; Bao, Y.; Saifullah; Bibi, S.; Dahlawi, S.; Yaseen, M.; Abrar, M.M.; Srivastava, P.; Fahad, S.; Faraj, T.K. Contributions of open biomass burning and crop straw burning to air quality: Current research paradigm and future outlooks. Front. Environ. Sci. 2022, 10, 852492. [Google Scholar] [CrossRef]
  17. Chen, W.; Li, J.; Bao, Q.; Gao, Z.; Cheng, T.; Yu, Y. Evaluation of straw open burning prohibition effect on provincial air quality during October and November 2018 in Jilin Province. Atmosphere 2019, 10, 375. [Google Scholar] [CrossRef]
  18. Zhang, H.; Hu, J.; Qi, Y.; Li, C.; Chen, J.; Wang, X.; He, J.; Wang, S.; Hao, J.; Zhang, L.; et al. Emission characterization, environmental impact, and control measure of PM2.5 emitted from agricultural crop residue burning in China. J. Clean. Prod. 2017, 149, 629–635. [Google Scholar] [CrossRef]
  19. Mehmood, K.; Wu, Y.; Wang, L.; Yu, S.; Li, P.; Chen, X.; Li, Z.; Zhang, Y.; Li, M.; Liu, W.; et al. Relative effects of open biomass burning and open crop straw burning on haze formation over central and eastern China: Modeling study driven by constrained emissions. Atmos. Chem. Phys. 2020, 20, 2419–2443. [Google Scholar] [CrossRef]
  20. Cui, S.; Song, Z.; Zhang, L.; Shen, Z.; Hough, R.; Zhang, Z.; An, L.; Fu, Q.; Zhao, Y.; Jia, Z. Spatial and temporal variations of open straw burning based on fire spots in northeast China from 2013 to 2017. Atmos. Environ. 2021, 244, 117962. [Google Scholar] [CrossRef]
  21. Wang, Z.; Zhao, J.; Xu, J.; Jia, M.; Li, H.; Wang, S. Influence of straw burning on urban air pollutant concentrations in Northeast China. Int. J. Environ. Res. Public Health 2019, 16, 1379. [Google Scholar] [CrossRef] [PubMed]
  22. Grange, S.K.; Lee, J.D.; Drysdale, W.S.; Lewis, A.C.; Hueglin, C.; Emmenegger, L.; Carslaw, D.C. COVID-19 lockdowns highlight a risk of increasing ozone pollution in European urban areas. Atmos. Chem. Phys. 2021, 21, 4169–4185. [Google Scholar] [CrossRef]
  23. Zhang, Z.; Xu, B.; Xu, W.; Wang, F.; Gao, J.; Li, Y.; Li, M.; Feng, Y.; Shi, G. Machine learning combined with the PMF model reveal the synergistic effects of sources and meteorological factors on PM2.5 pollution. Environ. Res. 2022, 212, 113322. [Google Scholar] [CrossRef] [PubMed]
  24. Cheng, Y.; Huang, X.-F.; Peng, Y.; Tang, M.-X.; Zhu, B.; Xia, S.-Y.; He, L.-Y. A novel machine learning method for evaluating the impact of emission sources on ozone formation. Environ. Pollut. 2023, 316, 120685. [Google Scholar] [CrossRef]
  25. Zhang, L.; Wang, L.; Ji, D.; Xia, Z.; Nan, P.; Zhang, J.; Li, K.; Qi, B.; Du, R.; Sun, Y.; et al. Explainable ensemble machine learning revealing the effect of meteorology and sources on ozone formation in megacity Hangzhou, China. Sci. Total Environ. 2024, 922, 171295. [Google Scholar] [CrossRef]
  26. García, M.V.; Aznarte, J.L. Shapley additive explanations for NO2 forecasting. Ecol. Inform. 2020, 56, 101039. [Google Scholar] [CrossRef]
  27. Zheng, W.; Chen, J.; Yan, H.; Liu, C.; Tang, S.H. Global fire monitoring products of FY-3D/MERSI-II and their applications. J. Remote Sens. 2020, 24, 521–530. [Google Scholar] [CrossRef]
  28. Lin, Z.; Chen, F.; Li, B.; Yu, B.; Shirazi, Z.; Wu, Q.; Wu, W. FengYun-3C VIRR active fire monitoring: Algorithm description and initial assessment using MODIS and Landsat data. IEEE Trans. Geosci. Remote Sens. 2017, 55, 6420–6430. [Google Scholar] [CrossRef]
  29. Buchhorn, M.; Lesiv, M.; Tsendbazar, N.-E.; Herold, M.; Bertels, L.; Smets, B. Copernicus global land cover layers—Collection 2. Remote Sens. 2020, 12, 1044. [Google Scholar] [CrossRef]
  30. Muñoz Sabater, J. ERA5-Land monthly averaged data from 1981 to present. Copernicus Climate Change Service (C3S) Climate Data Store (CDS). 2019. [Google Scholar]
  31. Terblanche, D.; Lynch, A.; Chen, Z.; Sinclair, S. ERA5-Derived Precipitation: Insights from Historical Rainfall Networks in Southern Africa. J. Appl. Meteorol. Climatol. 2022, 61, 1473–1484. [Google Scholar] [CrossRef]
  32. Farr, T.G.; Rosen, P.A.; Caro, E.; Crippen, R.; Duren, R.; Hensley, S.; Kobrick, M.; Paller, M.; Rodriguez, E.; Roth, L.; et al. The shuttle radar topography mission. Rev. Geophys. 2007, 45. [Google Scholar] [CrossRef]
  33. Bai, K.; Li, K.; Shao, L.; Li, X.; Liu, C.; Li, Z.; Ma, M.; Han, D.; Sun, Y.; Zheng, Z.; et al. LGHAP v2: A global gap-free aerosol optical depth and PM2.5 concentration dataset since 2000 derived via big earth data analytics. Earth Syst. Sci. Data Discuss. 2024, 2024, 1–29. [Google Scholar] [CrossRef]
  34. Wei, J.; Li, Z.; Lyapustin, A.; Sun, L.; Peng, Y.; Xue, W.; Su, T.; Cribb, M. Reconstructing 1-km-resolution high-quality PM2.5 data records from 2000 to 2018 in China: Spatiotemporal variations and policy implications. Remote Sens. Environ. 2021, 252, 112136. [Google Scholar] [CrossRef]
  35. Wei, J.; Li, Z.; Cribb, M.; Huang, W.; Xue, W.; Sun, L.; Guo, J.; Peng, Y.; Li, J.; Lyapustin, A.; et al. Improved 1 km resolution PM2.5 estimates across China using enhanced space–time extremely randomized trees. Atmos. Chem. Phys. 2020, 20, 3273–3289. [Google Scholar] [CrossRef]
  36. Islam, A.R.M.T.; Al Awadh, M.; Mallick, J.; Pal, S.C.; Chakraborty, R.; Fattah, M.A.; Ghose, B.; Kakoli, M.K.A.; Islam, M.A.; Naqvi, H.R.; et al. Estimating ground-level PM2.5 using subset regression model and machine learning algorithms in Asian megacity, Dhaka, Bangladesh. Air Qual. Atmos. Health 2023, 16, 1117–1139. [Google Scholar] [CrossRef] [PubMed]
  37. Chen, B.; Hu, J.; Wang, Y. Synergistic observation of FY-4A&4B to estimate CO concentration in China: Combining interpretable machine learning to reveal the influencing mechanisms of CO variations. npj Clim. Atmos. Sci. 2024, 7, 9. [Google Scholar]
  38. Xu, Z.; Wang, Z.; Zhang, X. Mapping the forest litterfall mercury deposition in China. Sci. Total Environ. 2022, 839, 156288. [Google Scholar] [CrossRef] [PubMed]
  39. Li, S.; Yuan, W.; Ciais, P.; Viovy, N.; Ito, A.; Jia, B.; Zhu, D. Benchmark estimates for aboveground litterfall data derived from ecosystem models. Environ. Res. Lett. 2019, 14, 084020. [Google Scholar] [CrossRef]
  40. Yang, C.; Wang, Y.; Zhang, A.; Fan, H.; Guo, L. A Random Forest Algorithm Combined with Bayesian Optimization for Atmospheric Duct Estimation. Remote Sens. 2023, 15, 4296. [Google Scholar] [CrossRef]
  41. Berdugo, M.; Gaitán, J.J.; Delgado-Baquerizo, M.; Crowther, T.W.; Dakos, V. Prevalence and drivers of abrupt vegetation shifts in global drylands. Proc. Natl. Acad. Sci. USA 2022, 119, e2123393119. [Google Scholar] [CrossRef]
  42. Qian, S.; Qiao, X.; Zhang, W.; Yu, Z.; Dong, S.; Feng, J. Machine learning-based prediction for settling velocity of microplastics with various shapes. Water Res. 2024, 249, 121001. [Google Scholar] [CrossRef] [PubMed]
  43. Zhou, Y.; Zhang, Y.; Zhao, B.; Lang, J.; Xia, X.; Chen, D.; Cheng, S. Estimating air pollutant emissions from crop residue open burning through a calculation of open burning proportion based on satellite-derived fire radiative energy. Environ. Pollut. 2021, 286, 117477. [Google Scholar] [CrossRef]
  44. Chen, D.; Pereira, J.M.; Masiero, A.; Pirotti, F. Mapping fire regimes in China using MODIS active fire and burned area data. Appl. Geogr. 2017, 85, 14–26. [Google Scholar] [CrossRef]
  45. Lundberg, S.M.; Erion, G.G.; Lee, S.-I. Consistent individualized feature attribution for tree ensembles. arXiv 2018, arXiv:1802.03888. [Google Scholar]
  46. Prasad, A.M.; Iverson, L.R.; Liaw, A. Newer classification and regression tree techniques: Bagging and random forests for ecological prediction. Ecosystems 2006, 9, 181–199. [Google Scholar] [CrossRef]
  47. Cui, L.; Wang, S. Mapping the daily nitrous acid (HONO) concentrations across China during 2006–2017 through ensemble machine-learning algorithm. Sci. Total Environ. 2021, 785, 147325. [Google Scholar] [CrossRef] [PubMed]
  48. Gu, X.; Wu, Z.; Liu, X.; Qiao, R.; Jiang, Q. Exploring the Nonlinear Interplay between Urban Morphology and Nighttime Thermal Environment. Sustain. Cities Soc. 2024, 101, 105176. [Google Scholar] [CrossRef]
  49. Logothetis, S.A.; Salamalikis, V.; Gkikas, A.; Kazadzis, S.; Amiridis, V.; Kazantzidis, A. 15-year variability of desert dust optical depth on global and regional scales. Atmos. Chem. Phys. 2021, 21, 16499–16529. [Google Scholar] [CrossRef]
  50. Zhai, S.; Jacob, D.J.; Brewer, J.F.; Li, K.; Moch, J.M.; Kim, J.; Lee, S.; Lim, H.; Lee, H.C.; Kuk, S.K.; et al. Relating geostationary satellite measurements of aerosol optical depth (AOD) over East Asia to fine particulate matter (PM2.5): Insights from the KORUS-AQ aircraft campaign and GEOS-Chem model simulations. Atmos. Chem. Phys. 2021, 21, 16775–16791. [Google Scholar] [CrossRef]
  51. Zhang, F. Factors Influencing the Spatio–Temporal Variability of Aerosol Optical Depth over the Arid Region of Northwest China. Atmosphere 2023, 15, 54. [Google Scholar] [CrossRef]
  52. Wang, Y.; Yang, L.; Xie, D.; Hu, Y.; Cao, D.; Huang, H.; Zhao, D. Investigation of Spatiotemporal Variation and Drivers of Aerosol Optical Depth in China from 2010 to 2020. Atmosphere 2023, 14, 477. [Google Scholar] [CrossRef]
  53. Wen, Y.; Zhang, S.; Wang, Y.; Yang, J.; He, L.; Wu, Y.; Hao, J. Dynamic Traffic Data in Machine-Learning Air Quality Mapping Improves Environmental Justice Assessment. Environ. Sci. Technol. 2024, 58, 3118–3128. [Google Scholar] [CrossRef] [PubMed]
  54. Zhao, N.; Liu, Y.; Cao, G.; Samson, E.L.; Zhang, J. Forecasting China’s GDP at the pixel level using nighttime lights time series and population images. GISci. Remote Sens. 2017, 54, 407–425. [Google Scholar] [CrossRef]
  55. Bondarenko, M. Individual Countries 1 km Population Density (2000–2020). 2020. [Google Scholar] [CrossRef]
Figure 1. Spatial comparison of Fengyun-3D fire points and MODIS fire points in April and November 2022, Heilongjiang Province, China.
Sustainability 16 07315 g001
Figure 2. Distribution map of cropland fire points and number of fire points in each city in Heilongjiang Province from 2015 to 2023.
Sustainability 16 07315 g002
Figure 3. Changes in the fire counts of croplands in Heilongjiang Province from 2015 to 2023.
Sustainability 16 07315 g003
Figure 4. Changes in the fire counts of croplands on a monthly scale in Heilongjiang Province from 2015 to 2023.
Sustainability 16 07315 g004
Figure 5. Correlation coefficients and variance inflation factors (VIFs) of input variables in (a,c) temporal and (b,d) spatial models.
Sustainability 16 07315 g005
Figure 6. Density scatter plots of cross-validation results for predicted and actual PM2.5 from (a) temporal and (b) spatial models.
Sustainability 16 07315 g006
Figure 7. Importance rankings of six variables on PM2.5 from (a) temporal and (b) spatial models.
Sustainability 16 07315 g007
Figure 8. Contribution rankings of six variables on PM2.5 from (a) temporal and (b) spatial models using a SHAP interpreter.
Sustainability 16 07315 g008
Disclaimer/Publisher’s Note: The statements, opinions and data contained in all publications are solely those of the individual author(s) and contributor(s) and not of MDPI and/or the editor(s). MDPI and/or the editor(s) disclaim responsibility for any injury to people or property resulting from any ideas, methods, instructions or products referred to in the content.

