Article

Mapping Benggang Erosion Susceptibility: An Analysis of Environmental Influencing Factors Based on the Maxent Model

1
School of Geography and Remote Sensing, Guangzhou University, Guangzhou 510006, China
2
Institute of Eco-Environmental and Soil Sciences, Guangdong Academy of Sciences, Guangzhou 510650, China
3
Meizhou International Institute of Soil and Water Conservation, Meizhou 514000, China
4
Rural Non-Point Source Pollution Comprehensive Management Technology Center of Guangdong Province, Guangzhou University, Guangzhou 510006, China
5
Research Center for Climate Change, Nong Lam University, Ho Chi Minh City 70000, Vietnam
6
Land Development Department, Bangkok 10900, Thailand
*
Author to whom correspondence should be addressed.
Sustainability 2024, 16(17), 7328; https://doi.org/10.3390/su16177328
Submission received: 24 July 2024 / Revised: 19 August 2024 / Accepted: 23 August 2024 / Published: 26 August 2024
(This article belongs to the Special Issue Landslide Hazards and Soil Erosion)

Abstract

:
Benggang erosion is one of the most severe geomorphological hazards occurring on deeply weathered crusts in the hilly regions of southern China. Unraveling the susceptibility and pinpointing the risk areas of Benggang erosion are essential for developing effective prevention and management strategies. This study introduced the Maxent model to investigate Benggang erosion susceptibility (BES) and compared the evaluation results with the widely used Random Forest (RF) model. The findings are as follows: (1) the incidence of Benggang erosion is rising initially with an increase in elevation, slope, topographic wetness index, rainfall erosivity, and fractional vegetation cover, followed by a subsequent decline, highlighting its distinct characteristics compared to typical types of gully erosion; (2) the AUC values from the ROC curves for the Maxent and RF models are 0.885 and 0.927, respectively. Both models converge on elevation, fractional vegetation cover, rainfall erosivity, Lithology, and topographic wetness index as the most impactful variables; (3) both models adeptly identified regions prone to potential Benggang erosion. However, the Maxent model demonstrated superior spatial correlation in its susceptibility assessment, contrasting with the RF model, which tended to overestimate the BES in certain regions; (4) the Maxent model’s advantages include no need for absence samples, direct handling of categorical data, and more convincing results, suggesting its potential for widespread application in the BES assessment. This research contributes empirical evidence to study the Benggang erosion developing conditions in the hilly regions of southern China and provides an important consideration for the sustainability of the regional ecological environment and human society.

1. Introduction

Soil erosion is a pervasive global environmental challenge, resulting in soil degradation, water contamination, diminished agricultural yields, and infrastructure deterioration. These consequences profoundly affect ecological systems and the well-being of human communities, emerging as a significant impediment to the sustainable advancement of society [1,2,3,4,5]. Benggang erosion is a severe erosion geomorphic hazard occurring on deeply weathered crusts in the hilly regions of southern China. The term “Benggang” translates to “collapsing hills” in Chinese [6]. Benggang is widely distributed across seven provinces in China, including Hunan, Hubei, Anhui, Jiangxi, Guangdong, Guangxi, and Fujian [7,8]. Due to its widespread occurrence and extensive erosion, it is vividly referred to as an “ecological ulcer”. Benggang erosion exhibits massive erosion rates, with annual erosion rates exceeding 50,000 t km−2 [9], approximately four times the severe erosion standard (>15,000 t km−2 a−1) set by China’s Ministry of Water Resources (SL190-2007) [10]. From 1949 to 2005, Benggang erosion led to the destruction of approximately 360,000 hm2 of farmland, the collapse of 521,000 houses, the siltation of 9000 reservoirs, the abandonment of numerous roads and bridges, resulted in direct economic losses of USD 2.8 billion, and affected over 9 million people [11,12]. Consequently, the mitigation and management of Benggang erosion are of paramount importance for ensuring the sustainability of regional ecological environments and safeguarding the livelihoods of communities in the hilly areas of southern China.
Benggang refers to a unique erosional landform characterized by the detachment, collapse, and deposition of rock masses or soils on slopes of deeply weathered crusts in tropical or subtropical regions, driven by hydraulic and gravitational forces. Typical Benggang consists of five parts: the upper catchment, collapsing wall, colluvial deposit, scour channel, and alluvial fan. International counterparts to Benggang erosion can be found in the form of Madagascar’s lavakas, Brazil’s vocorocas, and Japan’s “collapse” landforms. These geomorphic features share some similarities with Benggang, but they exhibit distinct differences in terms of their developmental conditions, constituent elements, and their characteristics of erosion [8,13].
The process of Benggang erosion is inextricably linked to the presence of soil or rock bodies with a sufficiently thick weathered crust. Initially, relatively exposed catchment slopes undergo splash erosion, sheet erosion, and rill erosion due to rainfall and runoff scouring. Erosional gullies emerge at points of depression and along cracks in the topsoil layer. As hydraulic erosion persists, the depth-to-width ratio of these gullies increases, leading to the evolution of rills into more pronounced gullies. In the intermediate stage, the deepening of gullies extends beyond the red soil and sandy soil layers. When the soil’s shear strength is overcome by gravitational forces, slope collapse ensues [14,15], and the collapsing walls and colluvial deposits are formed. At this juncture, gravitational erosion begins to dominate over hydraulic erosion, with the red soil and sandy soil layers becoming nearly exposed. In the advanced stages, the collapsing walls and colluvial deposits continue to be subject to erosion and collapse under the combined influences of hydraulic and gravitational forces. The erosion process repeats continuously, causing the collapsing wall to retreat and the collapse edge to expand [16,17,18,19]. Some large Benggang areas can reach several thousand square meters (Figure 1).
In terms of Benggang erosion disaster prevention and control, China’s government water resources departments have specifically formulated the “Technical Specifications for Benggang Control” [20]. In January 2023, the State Council of China issued the “Opinions on Strengthening Soil and Water Conservation Work in the New Era,” explicitly advocating for the comprehensive management of Benggang in the hilly mountainous areas of southern China [21]. A mature Benggang control model has been developed, involving “upper interception, lower blockage, and internal and external greening” [22,23]. Equally important as managing existing Benggang is the identification of potential areas prone to Benggang erosion through specific research methods and technical means and employing techniques such as check dams for sediment storage, flexible vegetation barriers, and revegetation of exposed areas to curb the further development of Benggang erosion landforms. However, in the realm of spatial prediction of Benggang erosion, the predictive accuracy of related studies is still insufficient.
Spatial prediction of Benggang erosion is closely integrated with geographical environmental factors. In recent years, there has been significant advancement in the methods for observing and assessing the risks of Benggang erosion. Previous studies [24,25] have approached these from the concept of sensitivity, using spatial data overlay and niche suitability methods or models to establish the relationship between geographical environmental factors and Benggang erosion sensitivity. Other researchers [26,27] have introduced the concept of risk assessment into the spatial prediction of Benggang, employing information acquisition methods, bivariate information entropy, logistic regression analysis [28,29], and the RF model [30] to analyze the distribution of environmental factors. They have identified high-risk areas of Benggang erosion based on both broad (risk of occurrence and hazard risk) and narrow (risk of occurrence) concepts of risk, finding that the RF model outperforms the information acquisition method. More studies have directly approached the concept of susceptibility, utilizing multinomial logistic regression, multilayer perceptrons [31], and Random Forest models [32,33,34,35] for the identification and classification of Benggang erosion susceptibility. The RF model has emerged as a primary method for predicting the distribution of Benggang erosion. In essence, whether the focus is on sensitivity, risk, or susceptibility, the ultimate goal of these research endeavors is to delineate potential areas where Benggang erosion may occur and to quantify the likelihood of such occurrences. Susceptibility refers to the degree to which a combination of conditions conducive to the formation of a geographical event predisposes an area to the event in question. The higher the susceptibility index, the greater the possibility that the event will manifest. In this context, the term “susceptibility” more precisely encapsulates the focal point of this study, predicting the spatial distribution of Benggang based on the concept of BES.
The Maxent model and the RF model are both general machine-learning techniques. The RF model is recognized for its high accuracy and robustness to noise, with its ensemble decision trees yielding highly interpretable and comprehensible classification outcomes [36]. However, the RF model requires a high-quality dataset and necessitates the inclusion of at least two categories of samples: positive samples and absence samples. The absence samples significantly influence the model’s classification outcomes, and they are primarily obtained through random sampling techniques. A limitation of this approach is that the absence of a phenomenon in the current dataset does not preclude its historical occurrence. Additionally, the RF model’s capacity to directly process categorical data during feature selection is limited. The Maxent model, developed by Phillips et al. [37], was initially applied to species distribution prediction. It leverages only positive sample data to identify the environmental variable distribution with the maximum entropy, constructing a predictive model that maps the geographic distribution of phenomena by optimizing the likelihood of observed occurrences. Due to its simplicity and practicality, and no need for absence samples, the Maxent model has been widely used for susceptibility assessments of landslides [38,39,40,41], forest fires [42], epidemics [43], and urban waterlogging [44]. To date, there has been no document applying the Maxent model to assess the susceptibility of Benggang erosion. To explore the effectiveness of the Maxent model in spatial prediction of Benggang erosion, this study treats Benggang as a “species” and applies the Maxent model within the densely Benggang-prone area of Huacheng Town, Guangdong Province, China, utilizing 10 key geographical and environmental factors influencing Benggang occurrence. Both the Maxent and RF models are engaged to perform susceptibility assessments, with spatial correlation analysis introduced to evaluate and contrast the spatial predictive effect of the two models. This study endeavors to offer empirical support for understanding the developmental conditions of Benggang erosion in the hilly regions of southern China and to provide beneficial guidance for its prevention and management.

2. Materials and Processing
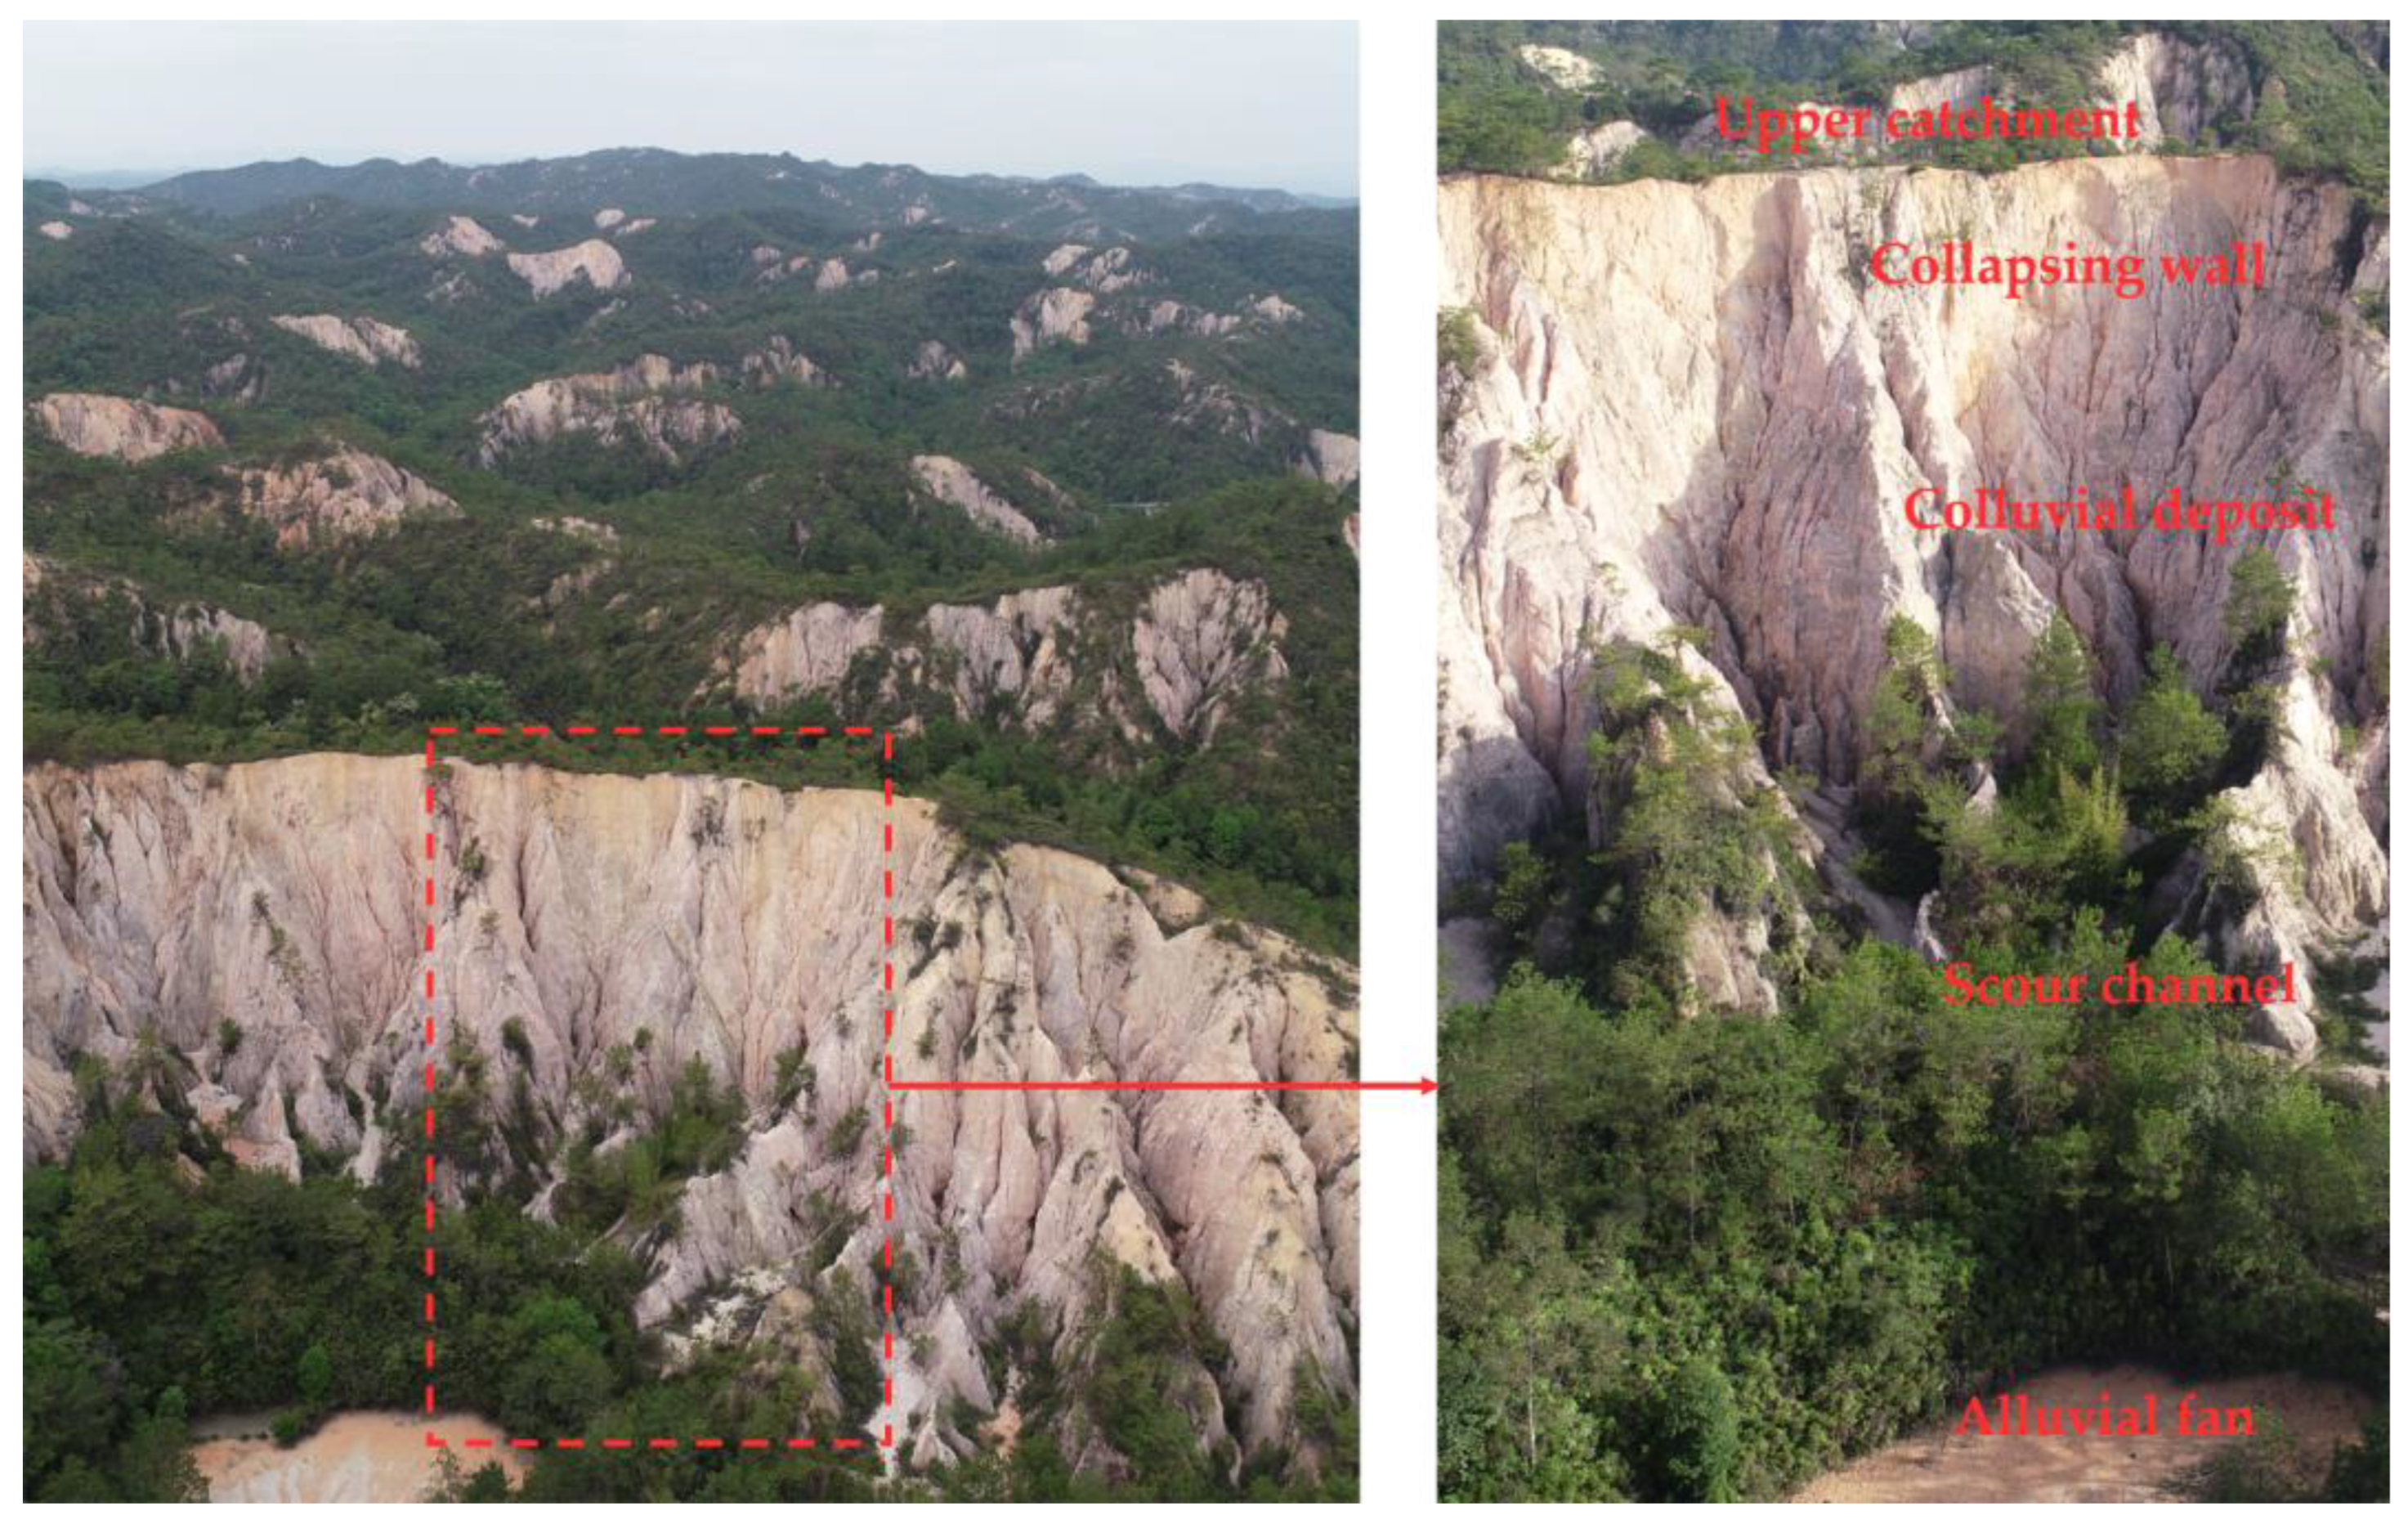
2.1. Study Area

The study area is located in Huacheng Town, Wuhua County, Meizhou City, Guangdong Province (115°29′–115°39′ E, 24°01′–24°11′ N). Wuhua County is one of the most densely distributed areas of Benggang erosion in Guangdong Province, with Huacheng Town being the most representative. According to the first comprehensive survey of Benggang in the red soil region of southern China conducted in 2004–2005, there are approximately 240,000 Benggangs across seven provinces, with Wuhua County accounting for about one-tenth of the total [11,12]. Huacheng Town is divided into northern and southern parts by the Wuhua River, covering a total area of 224.16 km2. The town falls within a subtropical monsoon climate zone, with an average annual temperature of 21.2 °C and average annual precipitation ranging from 1500 to 1600 mm [45]. Based on previous studies [46], the Yuankengshui small watershed in northern Huacheng Town has nearly 300 Benggangs within an area of 3.2 km2, resulting in a Benggang density of 100 per km2. Such a high density of Benggangs is extremely rare throughout the Benggang distribution areas in southern China. In contrast, the higher-altitude regions in the northwest of Huacheng Town exhibit a sparser distribution of Benggangs. This sample heterogeneity within the proximate hilly areas facilitates the analysis of the geographical and environmental determinants influencing the genesis and progression of Benggangs. Consequently, North Huacheng Town has been designated as the study area (Figure 2).

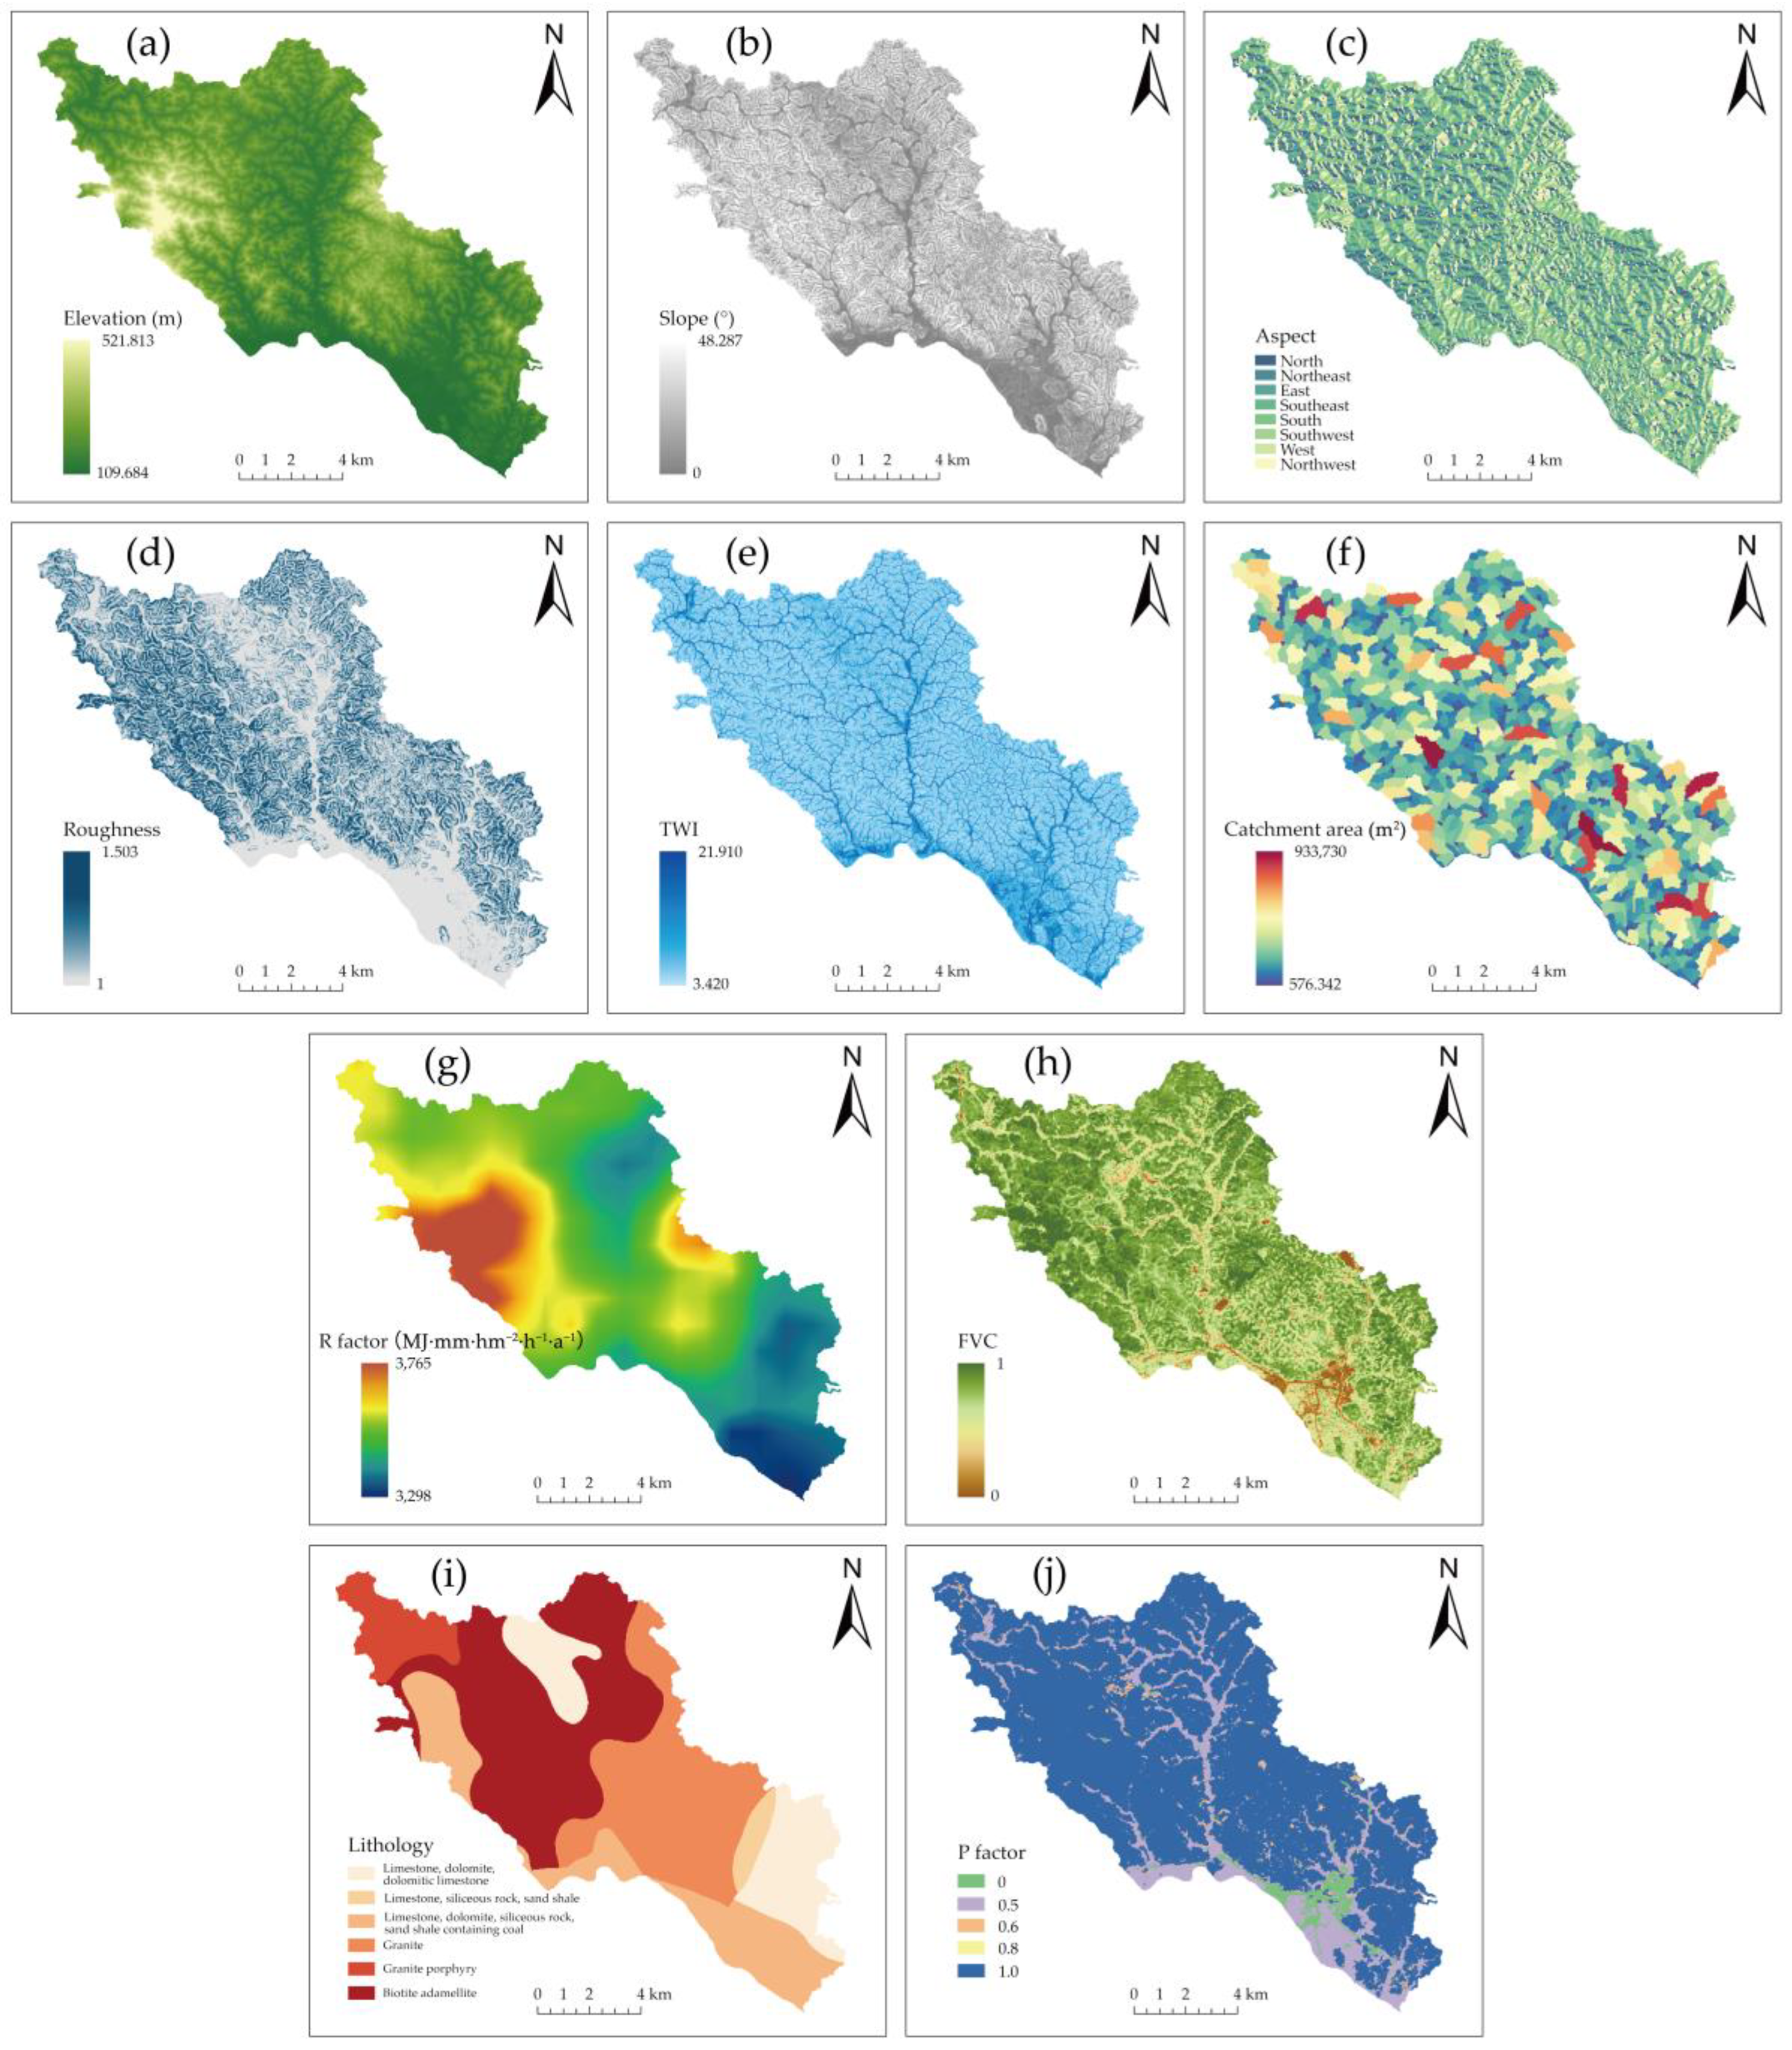
2.2. Environment Variable Selection and Data Source

The Benggang survey data for Wuhua County in 2005 was obtained from the Institute of Water Resources and Hydropower Research of Guangdong Province. According to the authors’ long-term work experience in Wuhua County, many Benggangs have undergone considerable changes over the years due to human activities and natural processes, such as being cultivated into terraced fields or orchards, managed for reforestation, and merged with other developing Benggangs. In a relatively small area like North Huacheng Town, to ensure higher accuracy of the Benggang point data for further analysis, the survey data were interactively corrected using online images from Map World (https://map.tianditu.gov.cn, accessed on 10 May 2024). Based on expert experience and previous unmanned aerial vehicle surveys [46], a total of 1069 Benggang points in North Huacheng Town were finally identified (Figure 2).
Despite the highly stochastic nature of Benggang collapses, Benggang erosion is difficult to observe, and the continuous expansion and intensified erosion of Benggang require certain material and energy conditions [47,48], which include rainfall erosion, hillside topography, geological and soil properties, and vegetation cover. Human activities can also exacerbate or delay the formation and development of Benggangs. Building on the aforementioned existing research [28,30,32,33,49,50,51], 10 representative factors are selected to analyze the relationship between the distribution of Benggang points in North Huacheng Town and the environmental variables. These factors include elevation, slope gradient, slope aspect, surface roughness, topographic wetness index (TWI), catchment area, rainfall erosivity (R factor), fractional vegetation cover (FVC), Lithology, and soil and water conservation measures (P factor).
For the acquisition of environmental variables, topographic factors including elevation, slope, aspect, surface roughness, TWI, and catchment area were generated from the digital elevation model (DEM) obtained by the ALOS-1 satellite (https://search.asf.alaska.edu/#/, accessed on 10 May 2024), with a spatial resolution of 12.5 m.
(1)
Elevation
Elevation significantly influences the development of the weathered crust’s thickness. Typically, as elevation diminishes, the weathered crust becomes thicker, adhering to a vertical gradient. This phenomenon occurs as lower altitude regions benefit from more favorable thermal and moisture conditions, coupled with reduced tectonic uplift, thus fostering an environment ripe for rock weathering and the aggregation of weathered materials [52].
(2)
Slope gradient
Slope plays an important role in influencing water erosion on slopes. The effect of slope on Benggang development is characterized by a dual nature. This contrasts with the typical soil erosion patterns observed in regions such as the Loess Plateau in China, where rill and gully erosion escalate with increasing slope gradients [53,54].
(3)
Slope aspect
Aspect affects the occurrence of Benggang erosion by influencing light conditions. In this study, aspects were divided into eight directions: north, northeast, east, southeast, south, southwest, west, and northwest. For the hilly region in southern China, south-facing slopes are generally sunny slopes. During the rainy season, the prevailing winds are southerly and southeasterly from the sea. Sunny slopes receive more rainfall than shady slopes and are more prone to erosion due to the intensity of raindrop splashing, especially during the rainy season [50].
(4)
Surface roughness
Surface roughness is an indicator reflecting the undulation changes and degree of erosion on the ground surface, which can be defined as the ratio of the curved surface area of a ground unit to its projection area on a horizontal plane. Benggang erosion originates from the development of gullies on the hillside. Although not all gullies will collapse to form Benggang landforms, surface roughness, which characterizes the degree of slope erosion, can still reflect the impact of topographic undulations on the occurrence of Benggang. In this study, the surface roughness Kr was calculated using an approximate formula, where S represents the slope gradient:
K r = 1 / cos S
(5)
Topographic wetness index
The TWI is a physical indicator of the influence of local topography on the direction and accumulation of surface runoff. This index is a function of slope gradient and the contributing area upstream. It aids in identifying rainfall runoff patterns, areas with potential increases in soil moisture, and zones prone to water accumulation. On sloped terrain, microtopographies with a greater capacity for water retention are more likely to generate runoff during heavy rainfall events, which can further develop into gully erosion. It is important to note that areas with the most extensive water accumulation are typically valley or downstream gentle slope regions, which do not possess the topographic conditions necessary for soil collapse. According to Beven et al. [55], the calculation formula for the TWI is as follows:
T W I = l n C A / S
where C A is the catchment area and S is the slope gradient.
(6)
Catchment Area
The catchment area, defined as the geographical region where surface and subsurface water converges to a common outlet, is typically surrounded by mountains or highlands. The size of the catchment area influences the density of gullies on the microtopography, which in turn affects the likelihood of Benggang erosion. Although the upper catchment area of the Benggang landscape continuously decreases and retreats towards the source due to ongoing rainfall erosion, the area of the slope catchment remains an important indicator of the potential for collapsing wall development before it retreats to the watershed divide.
(7)
Rainfall Erosivity
The R factor refers to the capacity of rain to erode soil, which depends on various factors including the intensity, duration, volume, and distribution characteristics of rainfall. Raindrop impact causes splash and sheet erosion on the slope, creating complex microtopography that, combined with soil fractures, develops into surface runoff and erosion gullies, forming the basis for Benggang erosion. However, excessive rainfall erosivity may result in the washing away and lack of accumulation of weathered materials, and since the thickness of the weathered crust directly affects Benggang formation and development [56], rainfall beyond a certain threshold may deprive soil collapse of a sufficient material basis.
The R factor was calculated based on the method of Zhang et al. [57] using China’s rainfall data published by Peng et al. [58], with a spatial resolution of 1 km. The calculation formula is as follows:
R = 0.1833 F 1.9957
F = 1 n i = 1 n j = 1 12 P i . j 2 / j = 1 12 P i , j
In the formula, R represents the annual average rainfall erosivity (MJ·mm·hm−2·h−1·a−1), where F is the modified Fournier index (mm), n is the number of years of rainfall records, and P i , j is the rainfall amount of the j-th month in the i-th year (mm).
(8)
Fractional Vegetation Cover
FVC is a metric that measures the degree to which vegetation covers the ground surface, expressing the proportion of vegetation area relative to the total area. Typically represented as a decimal or percentage, a value of 1 indicates complete coverage, while 0 signifies the absence of vegetation. Vegetation plays a significant role in soil erosion. Above ground, it intercepts rainwater and reduces its erosive force. While below ground, it improves soil properties through root growth and secretions, enhancing the soil’s shear strength. However, the relationship between Benggang erosion and vegetation cover may not be a simple negative correlation. Studies by Ding et al. [59] found that Benggang erosion areas accounted for 9.41%, 71.69%, and 18.90% of the total Benggang area in Fujian Province at vegetation cover levels below 0.3, between 0.3 and 0.6, and above 0.6, respectively.
The FVC is obtained from the Normalized Difference Vegetation Index (NDVI) calculated using Landsat surface reflectance data on the Google Earth Engine, with a spatial resolution of 30 m.
N D V I = N I R R e d N I R + R e d
F V C = N D V I N s o i l N v e g N s o i l
In the formula, N I R represents the reflectance in the near-infrared band, R e d represents the reflectance in the red band, N s o i l is the NDVI value of bare soil, and N v e g is the NDVI value of areas completely covered by vegetation.
(9)
Lithology
Lithology directly affects the properties of the weathered crust and soil, thereby influencing the susceptibility and resistance of slope soil to erosion. Liao et al. [56] found that Benggang can develop on rocks such as granite, sandstone, mudstone, conglomerate, shale, and tuff, with the characteristics of the weathered crust of different rocks significantly influencing Benggang development, especially in terms of rock joints.
Lithological data are obtained from the 1:2.5 million geological map of China (China Geological Survey, https://www.cgs.gov.cn/, accessed on 10 May 2024).
(10)
Soil and Water Conservation Measures
Human activities influence the occurrence of Benggang erosion by disrupting both vegetation and the mountainous terrain. Practices such as deforestation, reclamation of cultivated land, and mining may indirectly contribute to the collapse of hillsides. Conversely, soil and water conservation measures, such as planting fruit trees on exposed soils and cultivating crops on various slopes, can mitigate the occurrence of erosion. The impact of human activities on the incidence of Benggang erosion can thus be quantified in conjunction with land use practices.
The P factor is generated following the method of Li et al. [60], using DEM and land use data [61]. Croplands with slope gradients of 0–10, 10–25, 25–40, and 40–90 degrees are assigned P factor values of 0.5, 0.6, 0.8, and 1, respectively. Grasslands and forests are assigned a P factor of 1, and impervious surfaces are assigned a value of 0, with a spatial resolution of 30 m.
All raster data for the ten environmental variables are resampled to a spatial resolution of 30 m and the same projection for model analysis (Figure 3).

3. Modeling Approaches and Validation

3.1. Model Description: Maxent and Random Forest

The Maxent model is constructed based on the Principle of Maximum Entropy (POME). POME was first proposed by Jaynes in 1957 [62]. It successfully addresses the common ill-posed problem in information science, which arises when the data at hand are either incomplete, contaminated by noise, or a combination of both, thereby rendering the available information inadequate to ascertain a definitive solution [63]. According to POME, when confronted with an ill-posed problem, the solution that exhibits the maximum entropy should be selected from all viable options. The maximization of entropy signifies that the assumptions made due to incomplete data are minimized, yielding a solution that is inherently the most objective, impartial, and least subject to bias or deviation [64]. Applying the Maxent model to evaluate BES requires two sets of data: the known geographical distribution points of Benggang within the study area, denoted as X, represented in coordinates; and the various environmental variables related to the occurrence of Benggang within this area, denoted as Y. Assuming the predicted Benggang points X = {x1, x2, …, xn}, the entropy is given by the following:
H X = i n P ( X ) ln P ( X )
where P ( X ) is the probability distribution function of Benggang occurrence. By overlaying the environmental variables Y with the coordinates of the Benggang points X, a training dataset X Y composed of environmental variables and Benggang points can be obtained. Introducing the environmental variables Y changes the probability and information content affecting the distribution of X. At this point, the entropy of X is given by
H X Y = i n P X , Y lnP X , Y
The model assumes that the probability distribution with the maximum entropy, which satisfies all known conditions and makes no assumptions about unknowns, is the most uniform and has the least prediction bias [65]. The Maxent model is trained based on the input sample dataset and the following objective function:
X * = a r g m a x H X Y
The model continuously trains and retrieves parameters from the maximum entropy through a random seed generation algorithm, ensuring that the calculated values closely match the actual data. To achieve better results, the original samples are divided into two distinct categories (training samples and test samples) to facilitate cross-validation. The susceptibility probabilities obtained from a single model run may have some randomness, so the average of multiple runs is considered a more reliable final result.
Similarly, the RF model evaluates the importance of various environmental variables (Y1, Y2, …, Yk) on the distribution of the dependent variable X. If the dependent variable X has n observed points and is related to k independent variables, the random forest will randomly reselect n observations from the training data during the construction of the classification tree. Some observations may be selected multiple times, while others may not be selected at all, a method known as Bootstrap resampling [66]. Furthermore, the RF model employs a stochastic process to select a subset of the k independent variables for determining the classification tree nodes. The importance of each variable in the final model (summing to 1) explains the role of each variable in the development of the Benggangs.

3.2. Variable Integration and Result Grading

Due to the inability of the RF model to directly analyze categorical variables, this study follows the approach of Guo et al. [32,33] by dividing the environmental variables into different levels at equal intervals. The frequency ratio model is then combined with the RF model to analyze the susceptibility of Benggangs. The frequency ratio model is a statistical method widely used in disaster susceptibility assessment. This model evaluates the likelihood of a specific disaster occurring in a region, such as landslides, debris flows, and floods, by calculating the frequency ratio of various influencing factors. For an environmental variable j, the frequency ratio is calculated as follows:
F R i = P i Q i = S D i / S D S i / S
F R i  is the frequency ratio value of the variable at level i, P i is the frequency of Benggangs occurring at level i of that variable, S D i is the number of Benggangs at that level, and S D is the total number of Benggangs. Q i is the frequency of the i-th level of the environmental variable in the entire region, S i is the total area of the i-th level, and S is the total area of the study region. The formula for calculating the raster-based Benggang susceptibility using the RF model is as follows:
H R F = j = 1 n q j F R i j
q j is the importance of variable j calculated by the RF model, ranging from 0 to 1. The coordinates of Benggang points were exported using ArcGIS Pro 3.0, and the raster data of the 10 environmental variables were converted from TIFF to ASC format and imported into Maxent 3.4.4 [67] for maximum entropy distribution prediction. The environmental variables were sampled using the raster data of the grid cells and the point shapefile data, and then imported into Excel for frequency ratio calculation. Finally, the BES assessment using the RF model was calculated using the raster calculator tool. After obtaining the BES for each grid cell, the natural breakpoint method was used to classify the susceptibility levels into five categories.

3.3. ROC Analysis and Spatial Autocorrelations

The Receiver Operating Characteristic (ROC) curve is a common tool for evaluating the performance of binary classification models and can be used to assess the accuracy of geographical event prediction models. The ROC curve reflects the consistency between observed data and predicted data by calculating the true positive rate (TPR) and false positive rate (FPR) at different thresholds (susceptibility indices), or the model’s classification ability for positive and absence samples. The closer the ROC curve is to the upper-left corner, the better the model performance. The upper-left corner represents high TPR and low FPR, and an ideal classifier should approach the corner as closely as possible. The Area Under Curve (AUC) is the area enclosed by the ROC curve and the horizontal axis, with values typically ranging from 0.5 to 1. A value closer to 1 indicates better predictive performance of the model.
Historically, within the field of the BES assessment, models with higher AUC values have been deemed superior in evaluating potential Benggang incidence. Yet, this method predominantly concentrates on the classification accuracy of the data, often sidelining the spatial interplay between susceptibility distribution and tangible geographic environmental determinants. An ideal susceptibility assessment should exhibit characteristics where high and low susceptibility areas are distinctly concentrated, with outliers or insignificant values comprising a minimal proportion of the overall evaluation results.
Spatial autocorrelation refers to the similarity or correlation between the values of a variable in a geographic space and the values in its surrounding areas. In other words, spatial autocorrelation describes whether the distribution pattern of a phenomenon in geographic space is regular, that is, whether similar values are clustered together spatially or distributed randomly [68,69,70]. Based on the fundamental assumption that there is a statistical correlation between the occurrence of Benggang and environmental factors, the susceptibility assessment results calculated based on existing environmental variables should exhibit better spatial autocorrelation.
Both global and local spatial autocorrelation analyses were conducted on the susceptibility assessment results of the Maxent model and the RF model. Global spatial autocorrelation was analyzed using Moran’s I, and local spatial autocorrelation was analyzed using Anselin’s Local Moran’s I. Moran’s I values generally range from −1 to 1. Values closer to 1 indicate stronger positive autocorrelation, values closer to −1 indicate stronger negative autocorrelation, and values close to 0 indicate random distribution. Anselin’s Local Moran’s I [71] is used to detect spatial clustering or dispersion in local regions of geographical data. It can identify local patterns in the data, including High–High (H-H) clusters, Low–Low (L-L) clusters, High–Low (H-L) outliers, and Low–High (L-H) outliers. The first two patterns indicate that a unit and its neighboring units all have high values or low values, while the latter two indicate that a unit has a high value (or low value), while its neighboring units have low values (or high values), indicating outliers of high values (low values).
The above methods are applied to the assessment of the BES and the comparison of the evaluation results of the Maxent model and RF model. The research process of this study is shown in Figure 4.

4. Results

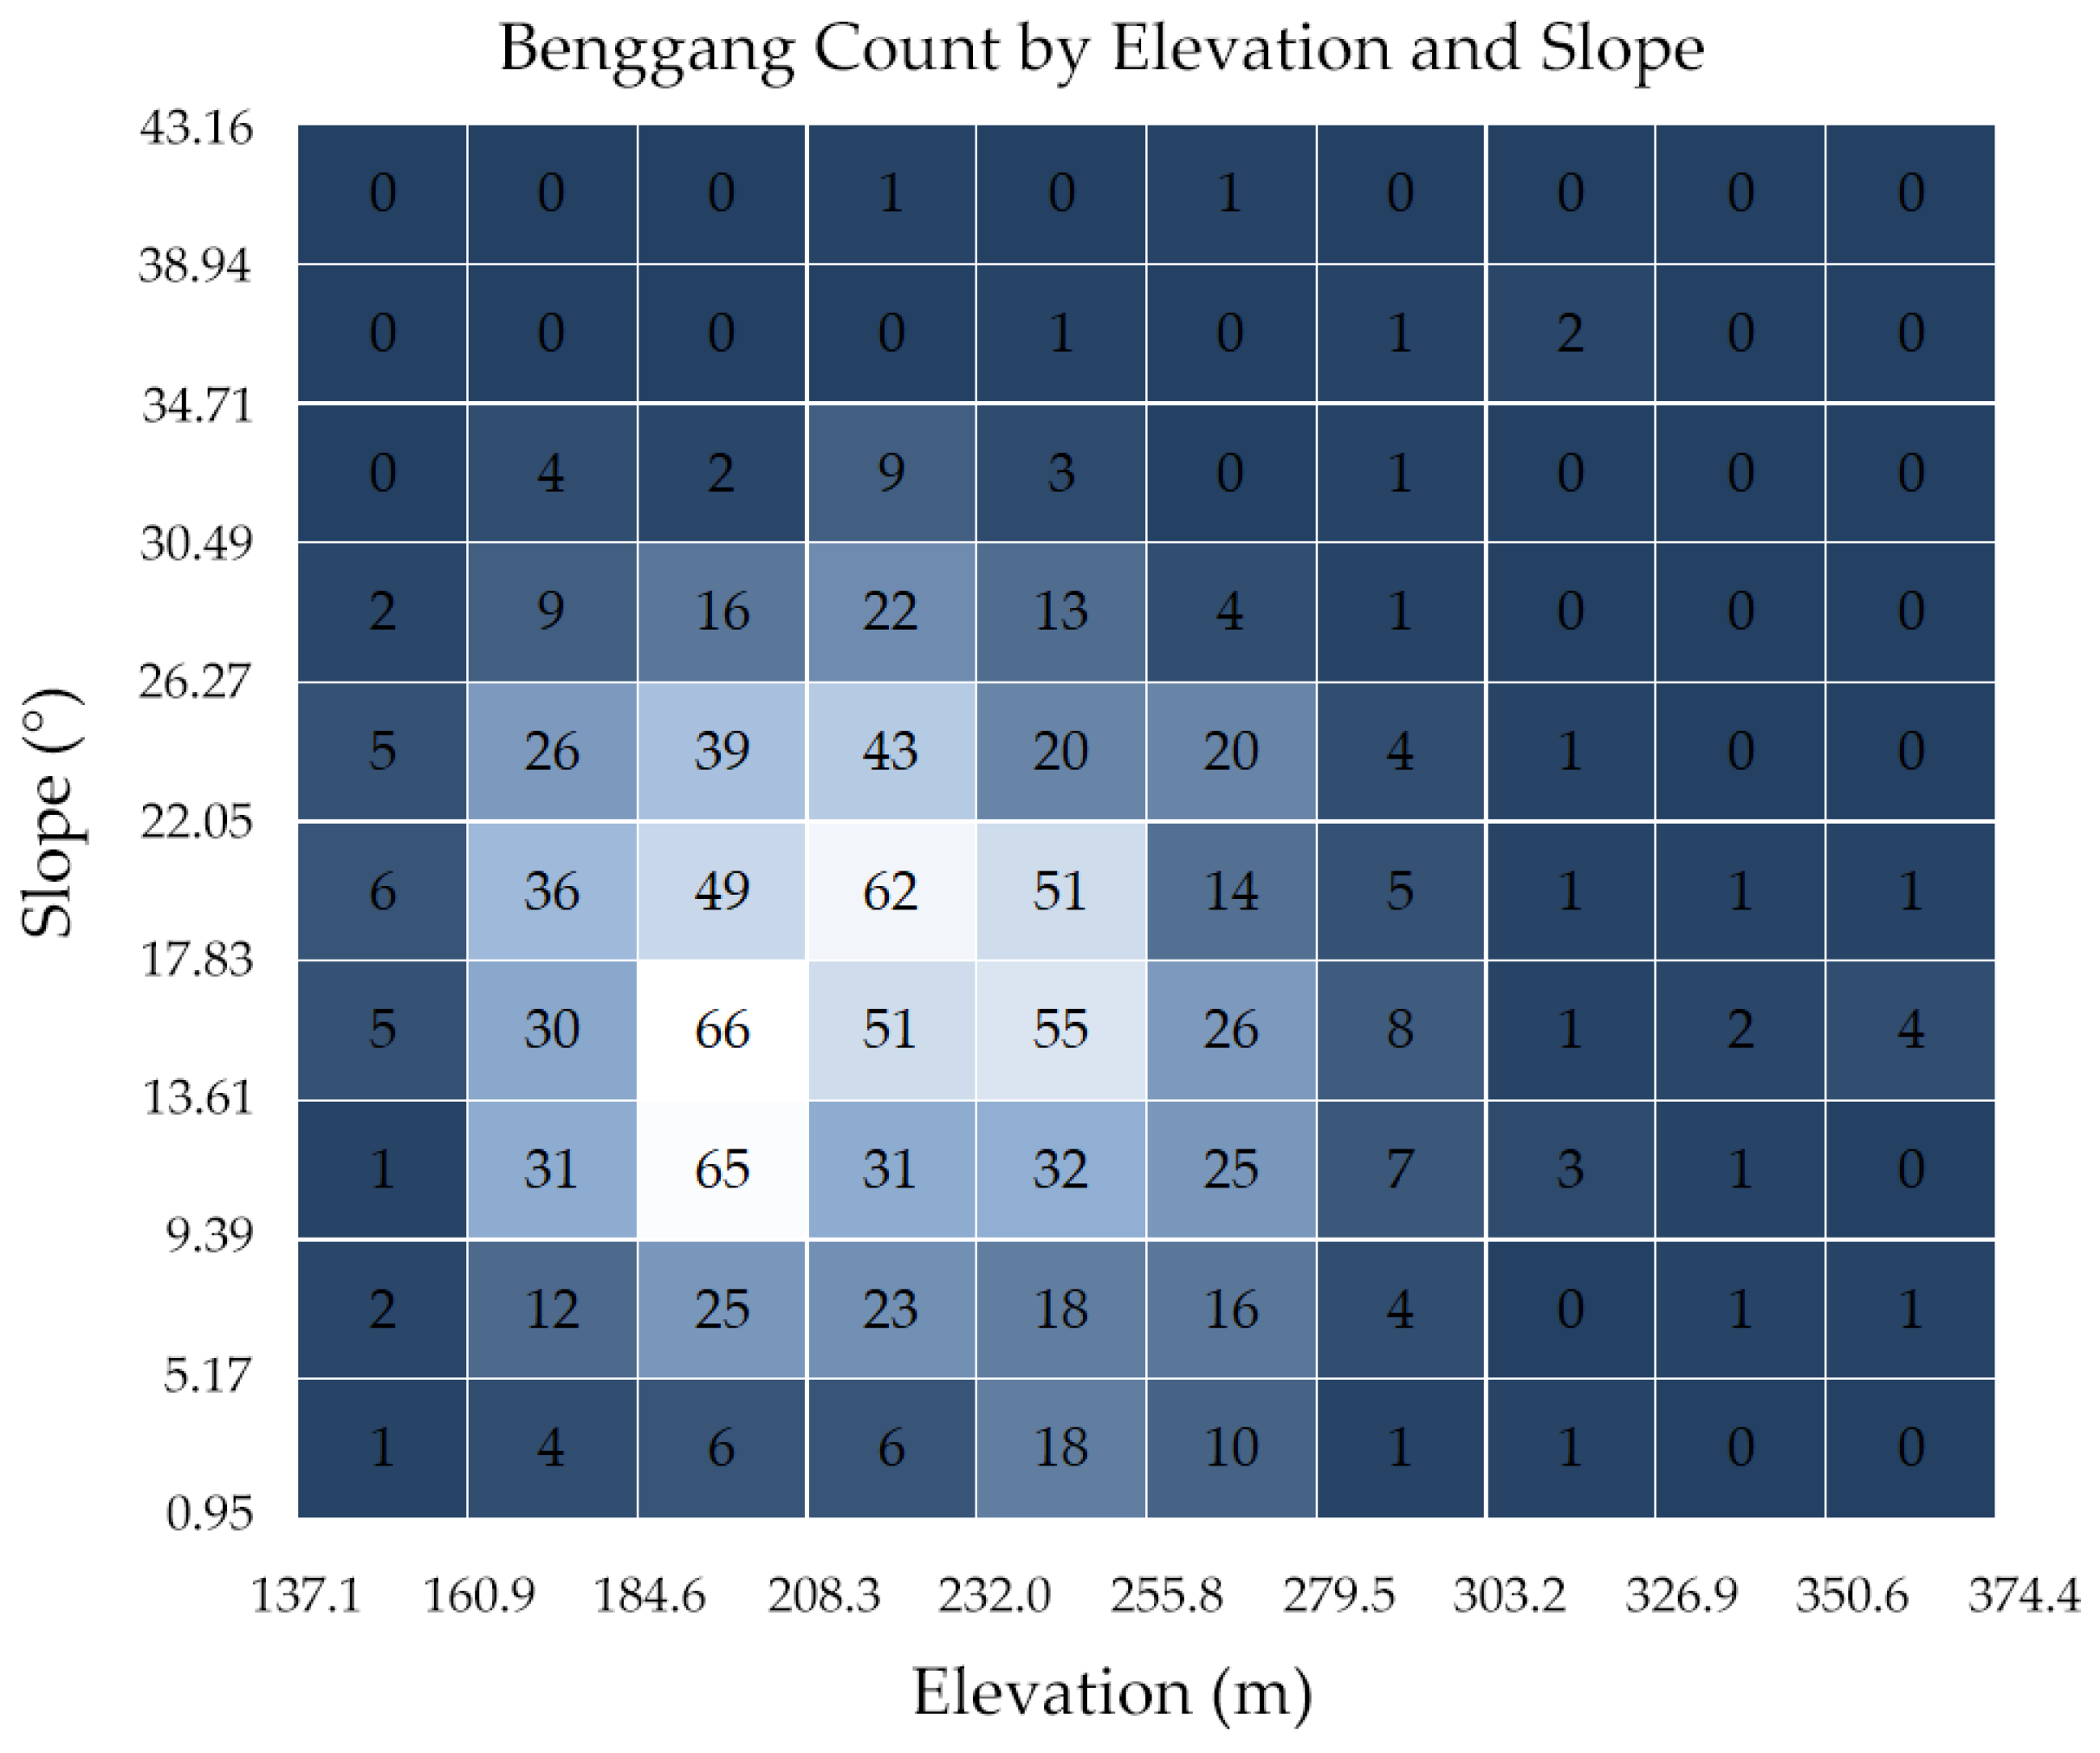
4.1. Importance Analysis of Environmental Variables

The genesis of Benggang is influenced by a spectrum of environmental factors. These encompass intrinsic elements like geological and pedological attributes, alongside extrinsic influences such as topography, vegetation, climate, and human activities. For the 10 selected environmental influencing factors, the importance of environmental variables was analyzed using both the Maxent model and the RF model. Seventy-five percent of the Benggang point samples were used to train the Maxent model, and 25% were used to test the model’s accuracy. After running the model 10 times, the importance of each variable was obtained (Table 1), with an average AUC value reaching 0.885 (Figure 5), demonstrating good computational precision.
The training of the RF model requires a certain number of absence samples, i.e., data points from areas where Benggang has not occurred, to distinguish the importance of environmental variables affecting the occurrence of Benggang. A total of 1069 non-Benggang site data points were generated using the random point generation tool. Of a total of 2138 samples, 70% were used for model sampling training, and 30% were used for model testing. Based on Python 3.10, the Random Forest Classifier from the Scikit-Learn library was employed for the analysis of the importance of factors in the distribution of Benggang in North Huacheng Town. The AUC of the model’s classification ROC curve reached 0.927 (Figure 6), the overall accuracy rate reached 0.84, the recall rate for positive samples reached 0.85, and the f1-score achieved 0.85, deeming the model’s outcomes reliable for subsequent analysis.
As seen in Table 1, in the Maxent model, the five environmental variables with the highest importance for the occurrence of Benggang erosion are elevation, FVC, R factor, Lithology, and TWI, with the other five variables having comparatively lower importance. In the analysis of the RF model, FVC, elevation, R factor, TWI, and Lithology are the top five important variables, which is consistent with the analysis results of the Maxent model. However, the RF model’s analysis indicates a hierarchy where FVC is deemed more critical than elevation, and TWI surpasses Lithology in importance. Additionally, the RF model places the significance of Lithology on par with that of aspect, roughness, and catchment area. The convergence of these variable importance assessments from both models substantiates the pivotal role of elevation, FVC, R factor, Lithology, and TWI among the environmental variables in the genesis of Benggang in North Huacheng Town.

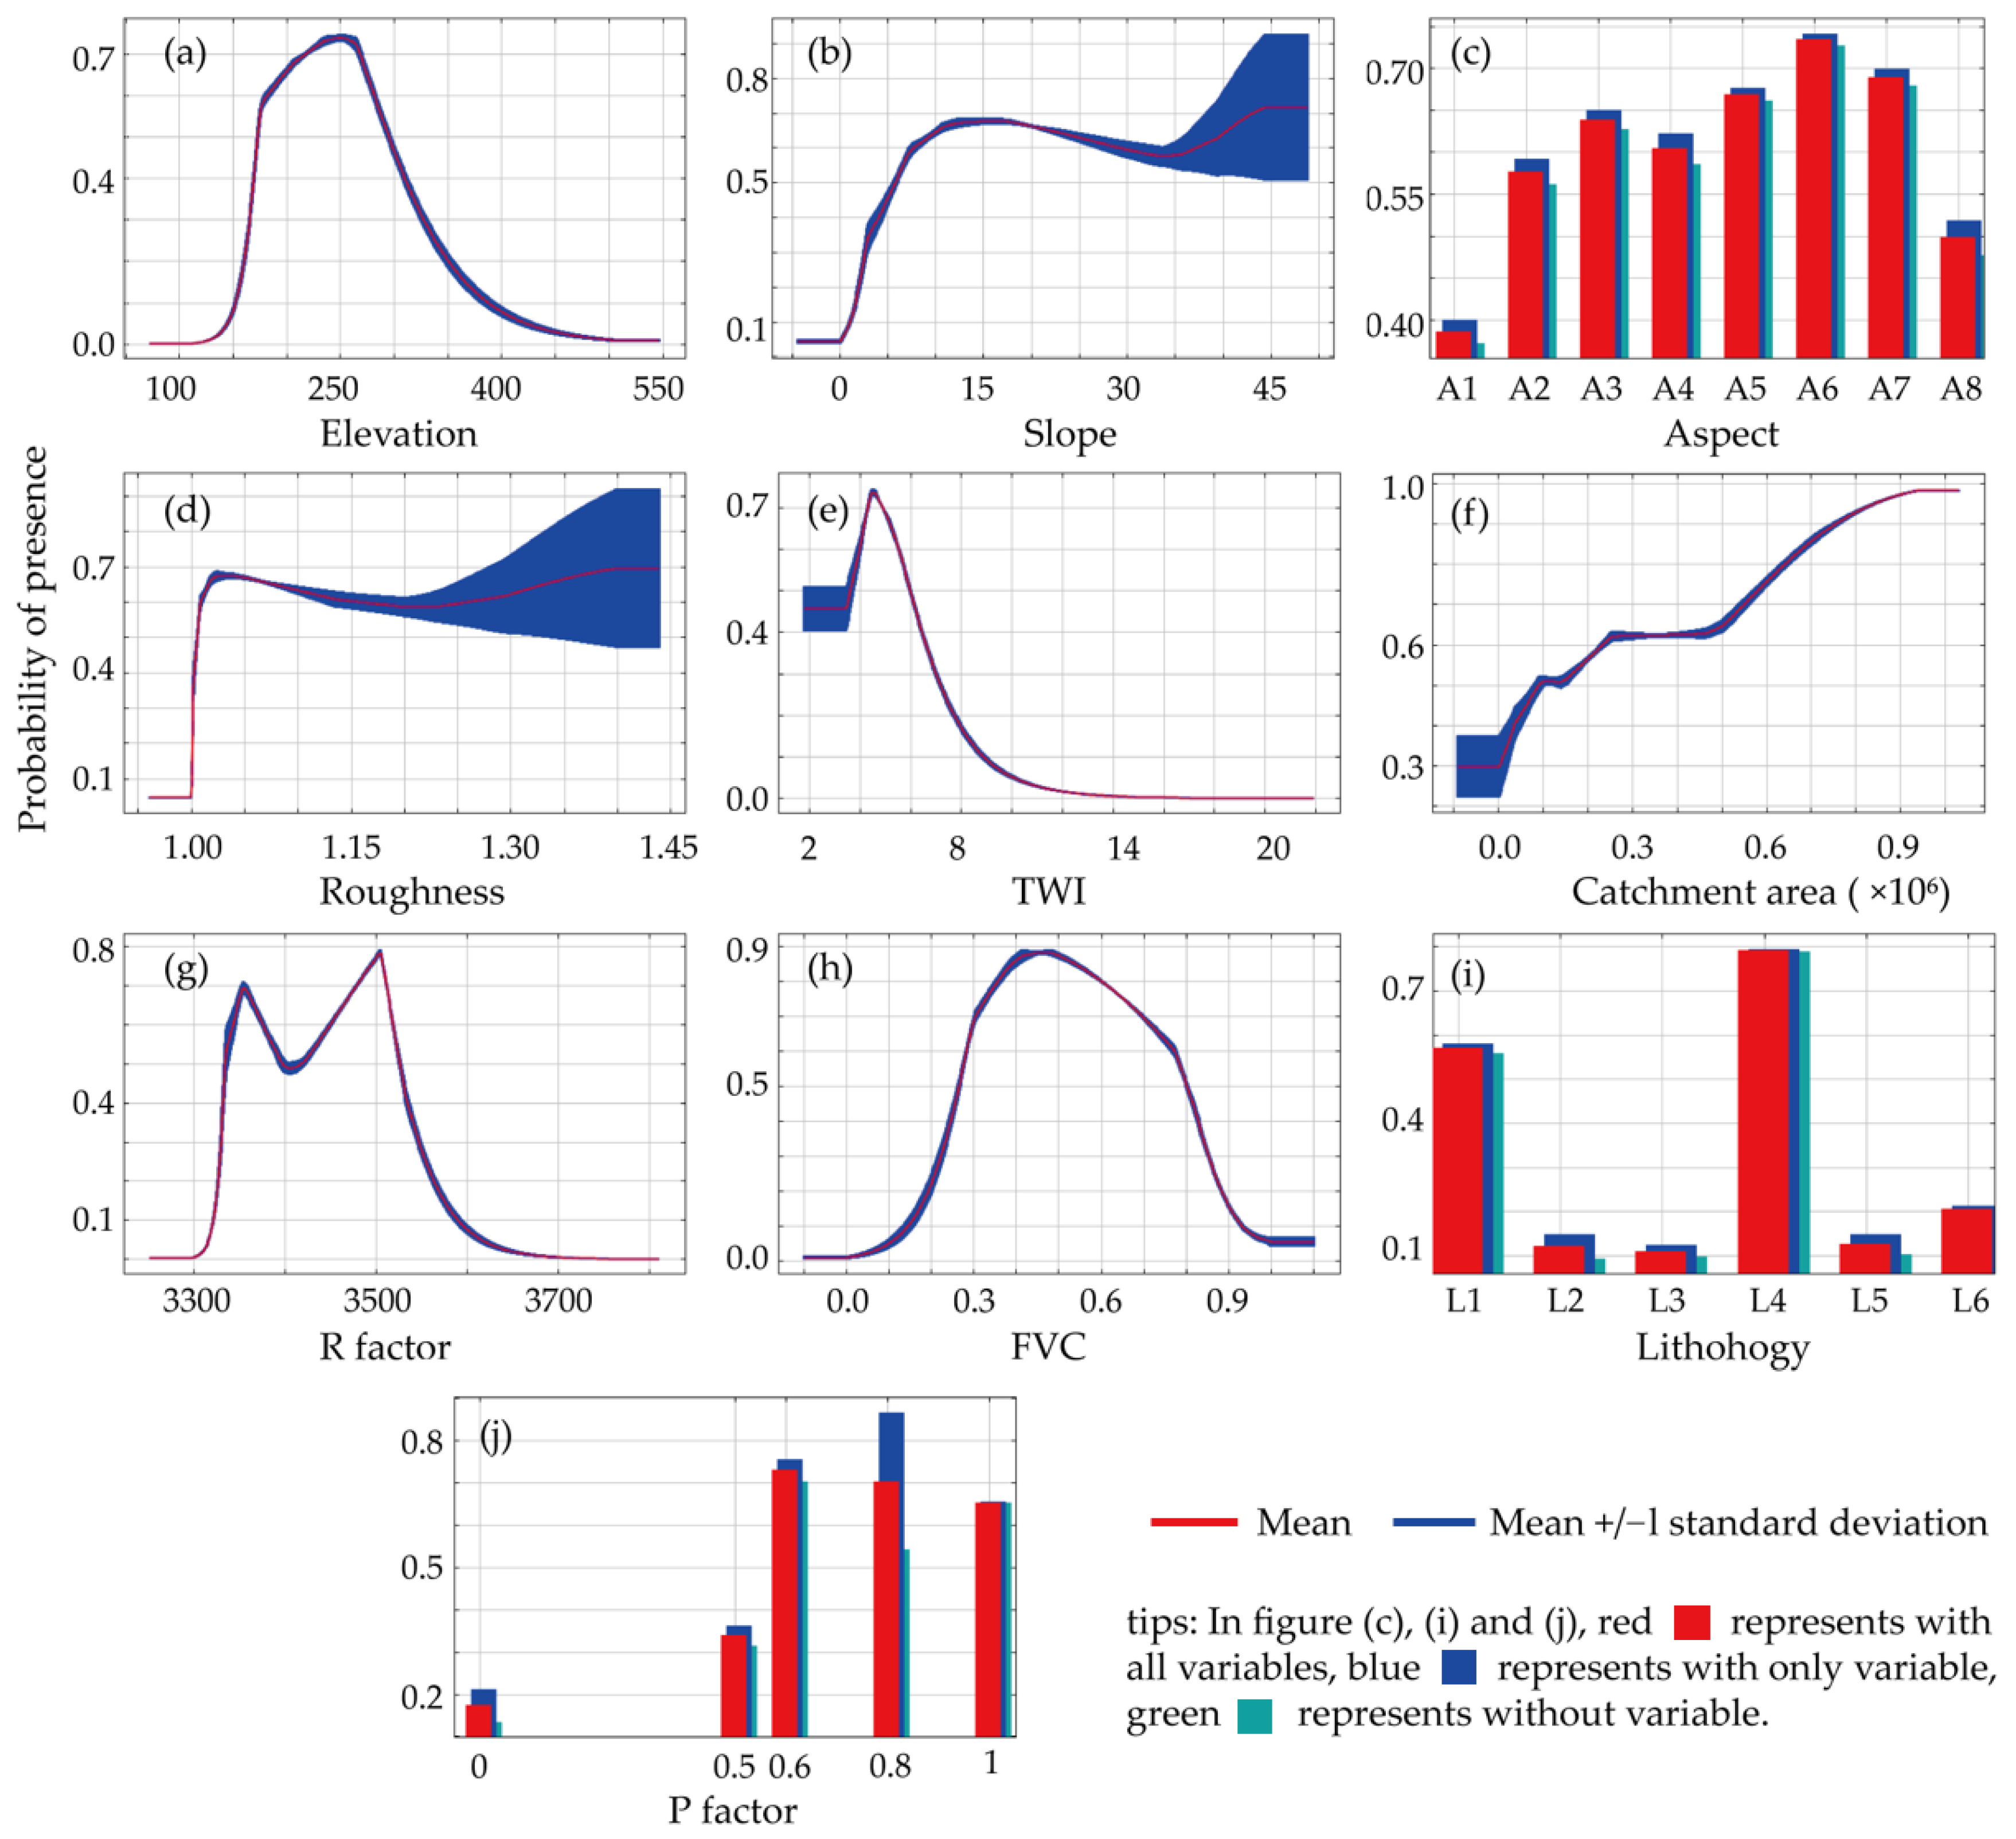
4.2. Interpretation of Environmental Variables on the Benggang Erosion Susceptibility

Figure 7 presents the response curves that illustrate the relationship between the probability of Benggang occurrence and various environmental variables, as gleaned from 10 iterations of the Maxent model analysis.
In Figure 7a, high values (>0.7) of Benggang occurrence probability are observed at an elevation of 250 m, with a notably higher probability in the 180–280 m elevation range compared to other elevations. Furthermore, in Figure 7b, the Benggang occurrence probability is greater at slopes between 10 and 25 degrees, where the standard deviation is relatively low, compared to other slopes. These observations hint at the substantial influence of fundamental topographic attributes on the distribution of Benggang erosion. Further elucidation is provided by the heatmap in Figure 8, which plots the elevation and slope of Benggang points within the study area. It demonstrates that the highest concentration of Benggang occurrences aligns with the previously mentioned elevation and slope ranges, corroborating earlier research [46,56]. Historical studies [72,73] echo this pattern, noting that 85% of Benggang in Fujian Province are clustered in regions with an altitude of 150–300 m and slopes between 10 and 25°. This distribution suggests that while lower elevations boast more favorable hydrothermal conditions, their gentler slopes are less likely to foster the occurrence of major collapse. Conversely, higher elevations, characterized by steep slopes and exposed bedrock, fail to provide the necessary soil base for Benggang erosion to take hold.
In Figure 7c, the southwest-facing slopes, denoted as aspect A6 (as per Figure 3), exhibit the highest probability of Benggang occurrence, with the west and south slopes following closely behind. Within the study area, south-facing slopes, which are sunny slopes, are likely to have an elevated likelihood of Benggang development. Figure 7d, however, shows a negligible correlation between the probability of Benggang erosion and surface roughness, suggesting that surface roughness may exert minimal influence on Benggang occurrence. In Figure 7e, the probability of Benggang erosion occurrence initially increases and then decreases with the increase in the TWI, with high values observed when the TWI is between 4 and 5. The TWI serves as a physical indicator that measures the impact of regional topography on runoff direction and accumulation. Figure 7e indicates that the occurrence of Benggang erosion is not entirely positively correlated with the TWI. Beyond certain conditions, such as adequate slope and elevation, areas with a high TWI are typically characterized by flat terrains, like valley zones or plain farmlands, where the geological or soil conditions are not conducive to the development of Benggang erosion. Figure 7f demonstrates that the likelihood of Benggang occurrence escalates with increasing catchment area, implying that larger catchment slopes are more prone to Benggang collapses.
In Figure 7g, the overall trend of Benggang erosion occurrence probability first increases and then decreases, with high values appearing around 3500 MJ·mm·hm−2·h−1·a−1. Drawing on the research by Liao et al. [56], it is deduced that lower rainfall erosivity exerts a reduced scouring effect on the soil, thereby diminishing its contribution to Benggang erosion. Conversely, higher rainfall erosivity hinders the accumulation of weathered crust soil, which in turn directly undermines the foundational material necessary for collapse. In Figure 7h, the probability of Benggang occurrence increases in the FVC range of 0–0.45 and decreases in the range of 0.45–1. This partial negative correlation could be attributed to the specific types and arrangements of vegetation [74]. The flora in the hilly and mountainous regions of North Huacheng Town, predominantly Masson pine and rose myrtle, are not particularly effective at mitigating the kinetic energy of rainfall. Moreover, the presence of vegetation exerts additional pressure on slope soils, leading to an increased likelihood of Benggang occurrence as vegetation coverage rises, especially in areas where coverage is initially low. Studies [59,75] have observed a significant expansion in the area affected by Benggangs in regions where the vegetation coverage rate falls between 0.3 and 0.6. The susceptibility of Benggang erosion to rainfall erosivity and vegetation coverage gives it unique characteristics that distinguish it from general gully erosion phenomena, such as the world-famous gully landforms of the Loess Plateau in China [76] and the Dry-hot Valley landforms of the Qinghai-Tibet Plateau [77,78], where the occurrence of these erosion phenomena is clearly positively and negatively correlated with rainfall action and vegetation coverage, respectively.
In Figure 7i, the highest probabilities of Benggang occurrence are associated with lithologies L1 and L4, namely Limestone, Dolomite, Dolomitic Limestone, and Granite (as per Figure 3), with the most occurrences found on Granite. This is largely consistent with the findings of Ding [59] and Liao et al. [56], which suggest that Granite, a rock type with widely distributed joints, is the primary geological foundation for Benggang development. Finally, in Figure 7j, areas with a P factor of 0 exhibit an extremely low probability of Benggang occurrence. These regions are typically densely populated and characterized by relatively flat terrains. In areas with a P factor of 0.5, corresponding to gentle slopes with gradients of 0–10 degrees, the likelihood of Benggang occurrence is significantly lower than in areas with P factors of 0.6, 0.8, and 1, which include moderate or steep slope farmlands and grasslands or forests without soil and water conservation measures. This suggests that soil and water conservation measures on gentle slopes may be more effective in preventing the occurrence of Benggang erosion. When the P factor is 0.8, considering only the P factor variable, which corresponds to steep slopes with gradients of 25–40 degrees, the probability of Benggang occurrence is noticeably higher than in areas with other levels of soil and water conservation measures. This indicates that agricultural activities on steep slopes are conducive to the development of Benggang, increasing its occurrence probability to a level that even surpasses that of areas with a P factor of 1, where there is no human activity. Thus, human activities also have a dual nature in the occurrence of Benggang erosion, potentially having opposite effects at different levels of soil and water conservation.
In summary, Benggang erosion, influenced by a complex interplay of factors including rainfall, vegetation, geology, topography, and human activities, exhibits distinctive characteristics that set it apart from typical gully erosion. Under the influence of relatively strong rainfall erosion, in areas with elevations ranging from 150 to 300 m and facing south with moderate slopes on granite Lithology, an FVC of 0.4–0.5, or slopes that have been cultivated as arable land, are highly susceptible to the occurrence of Benggang erosion.

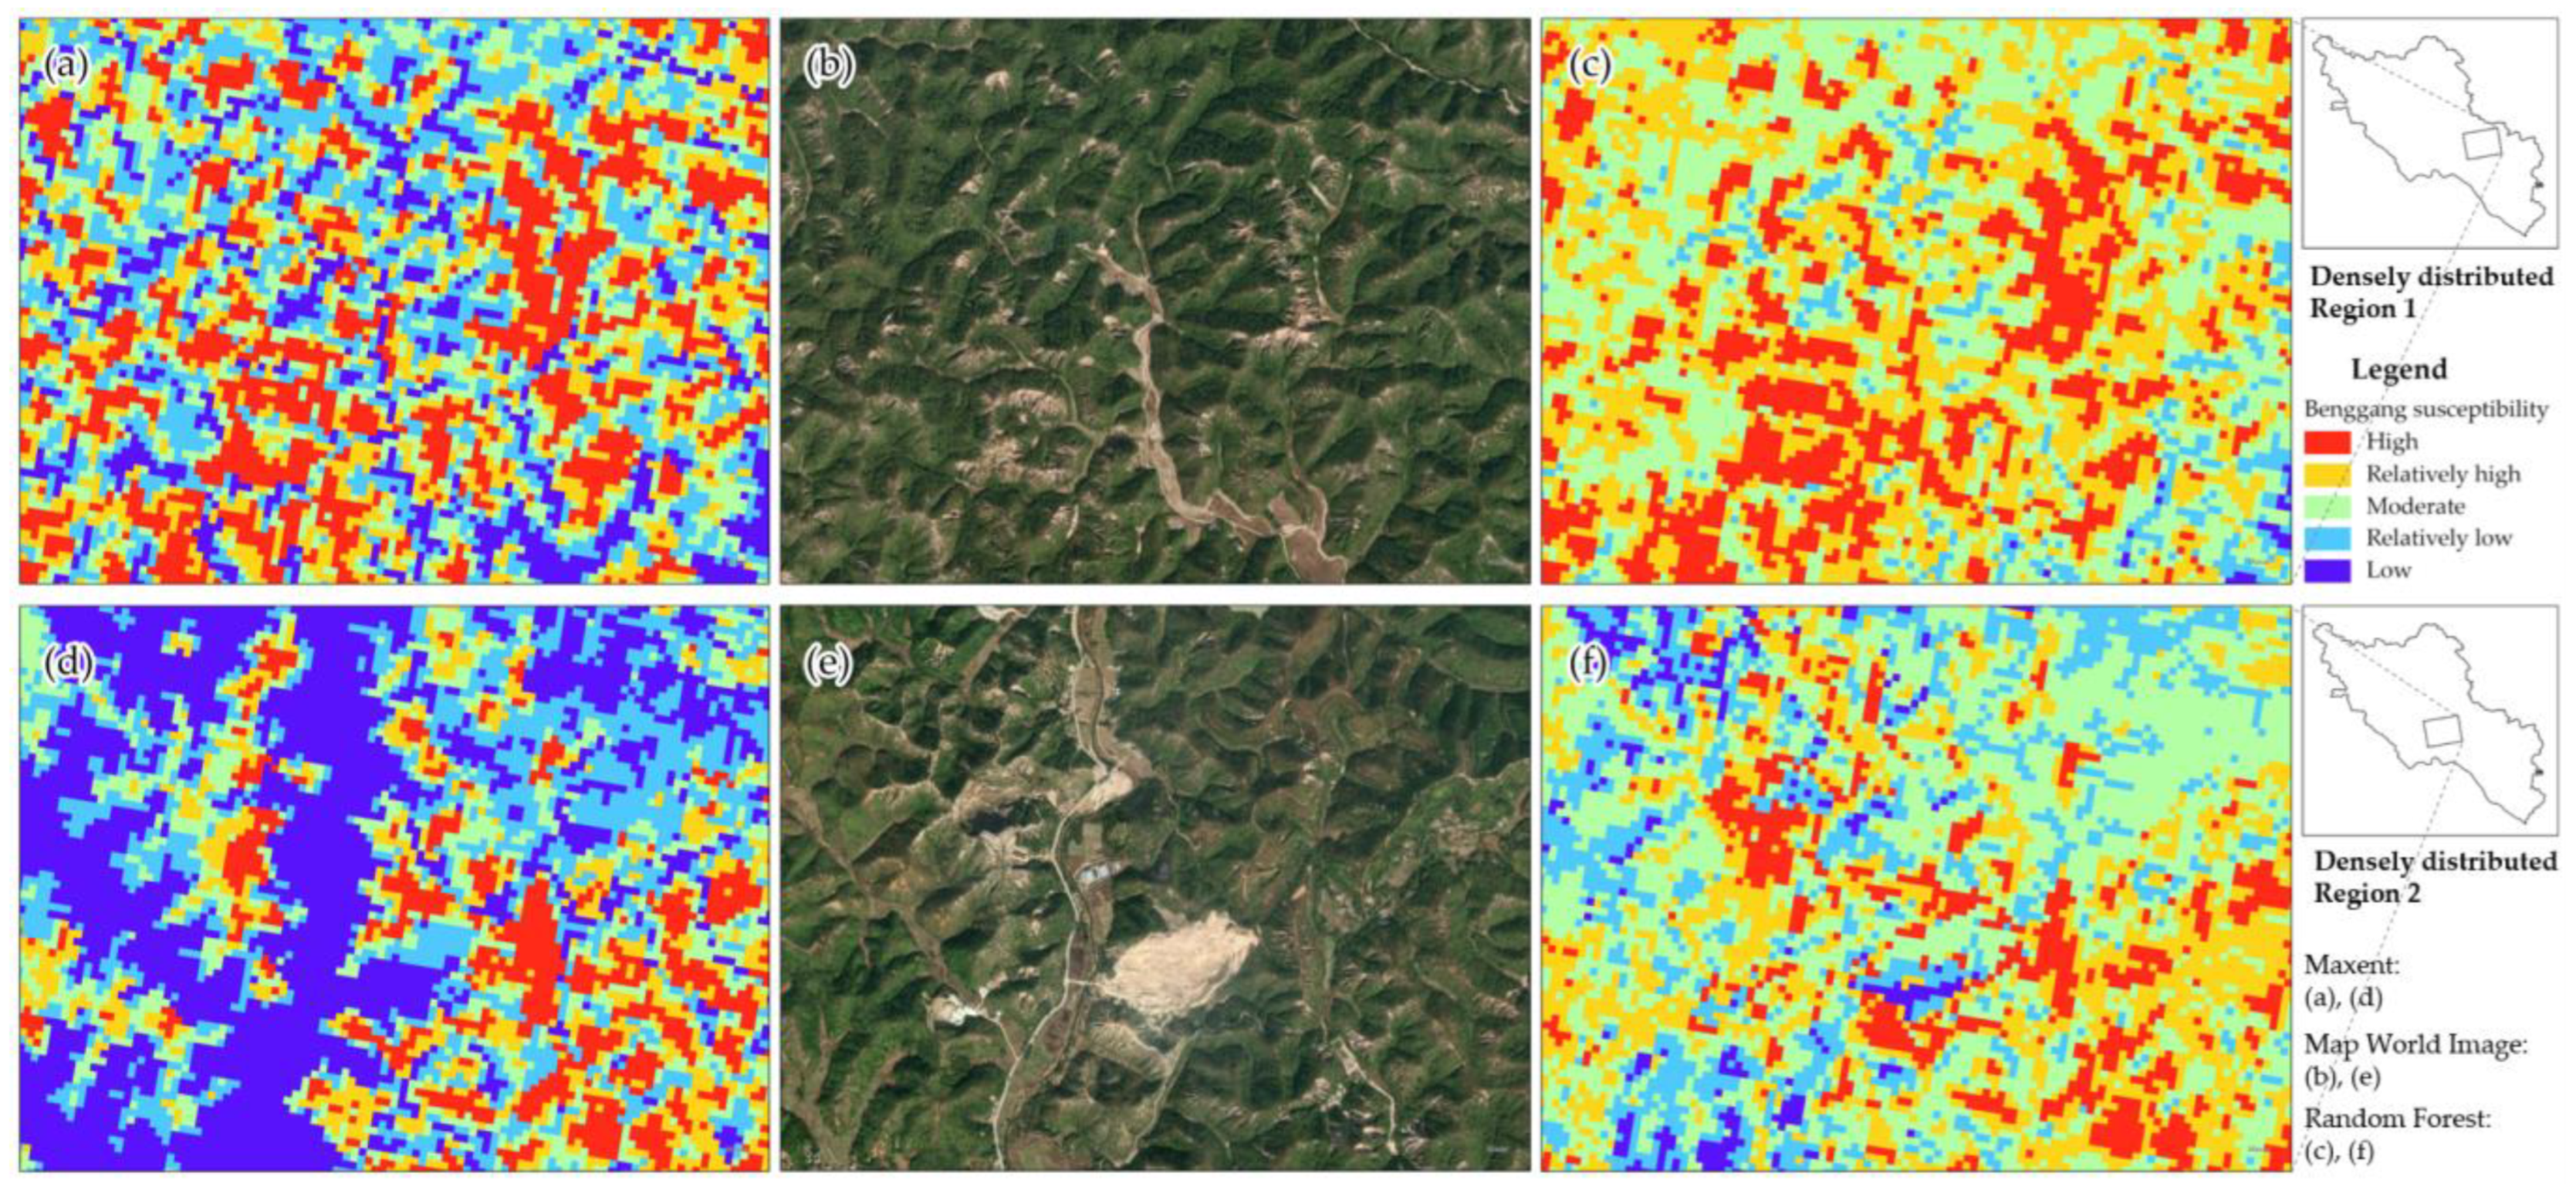
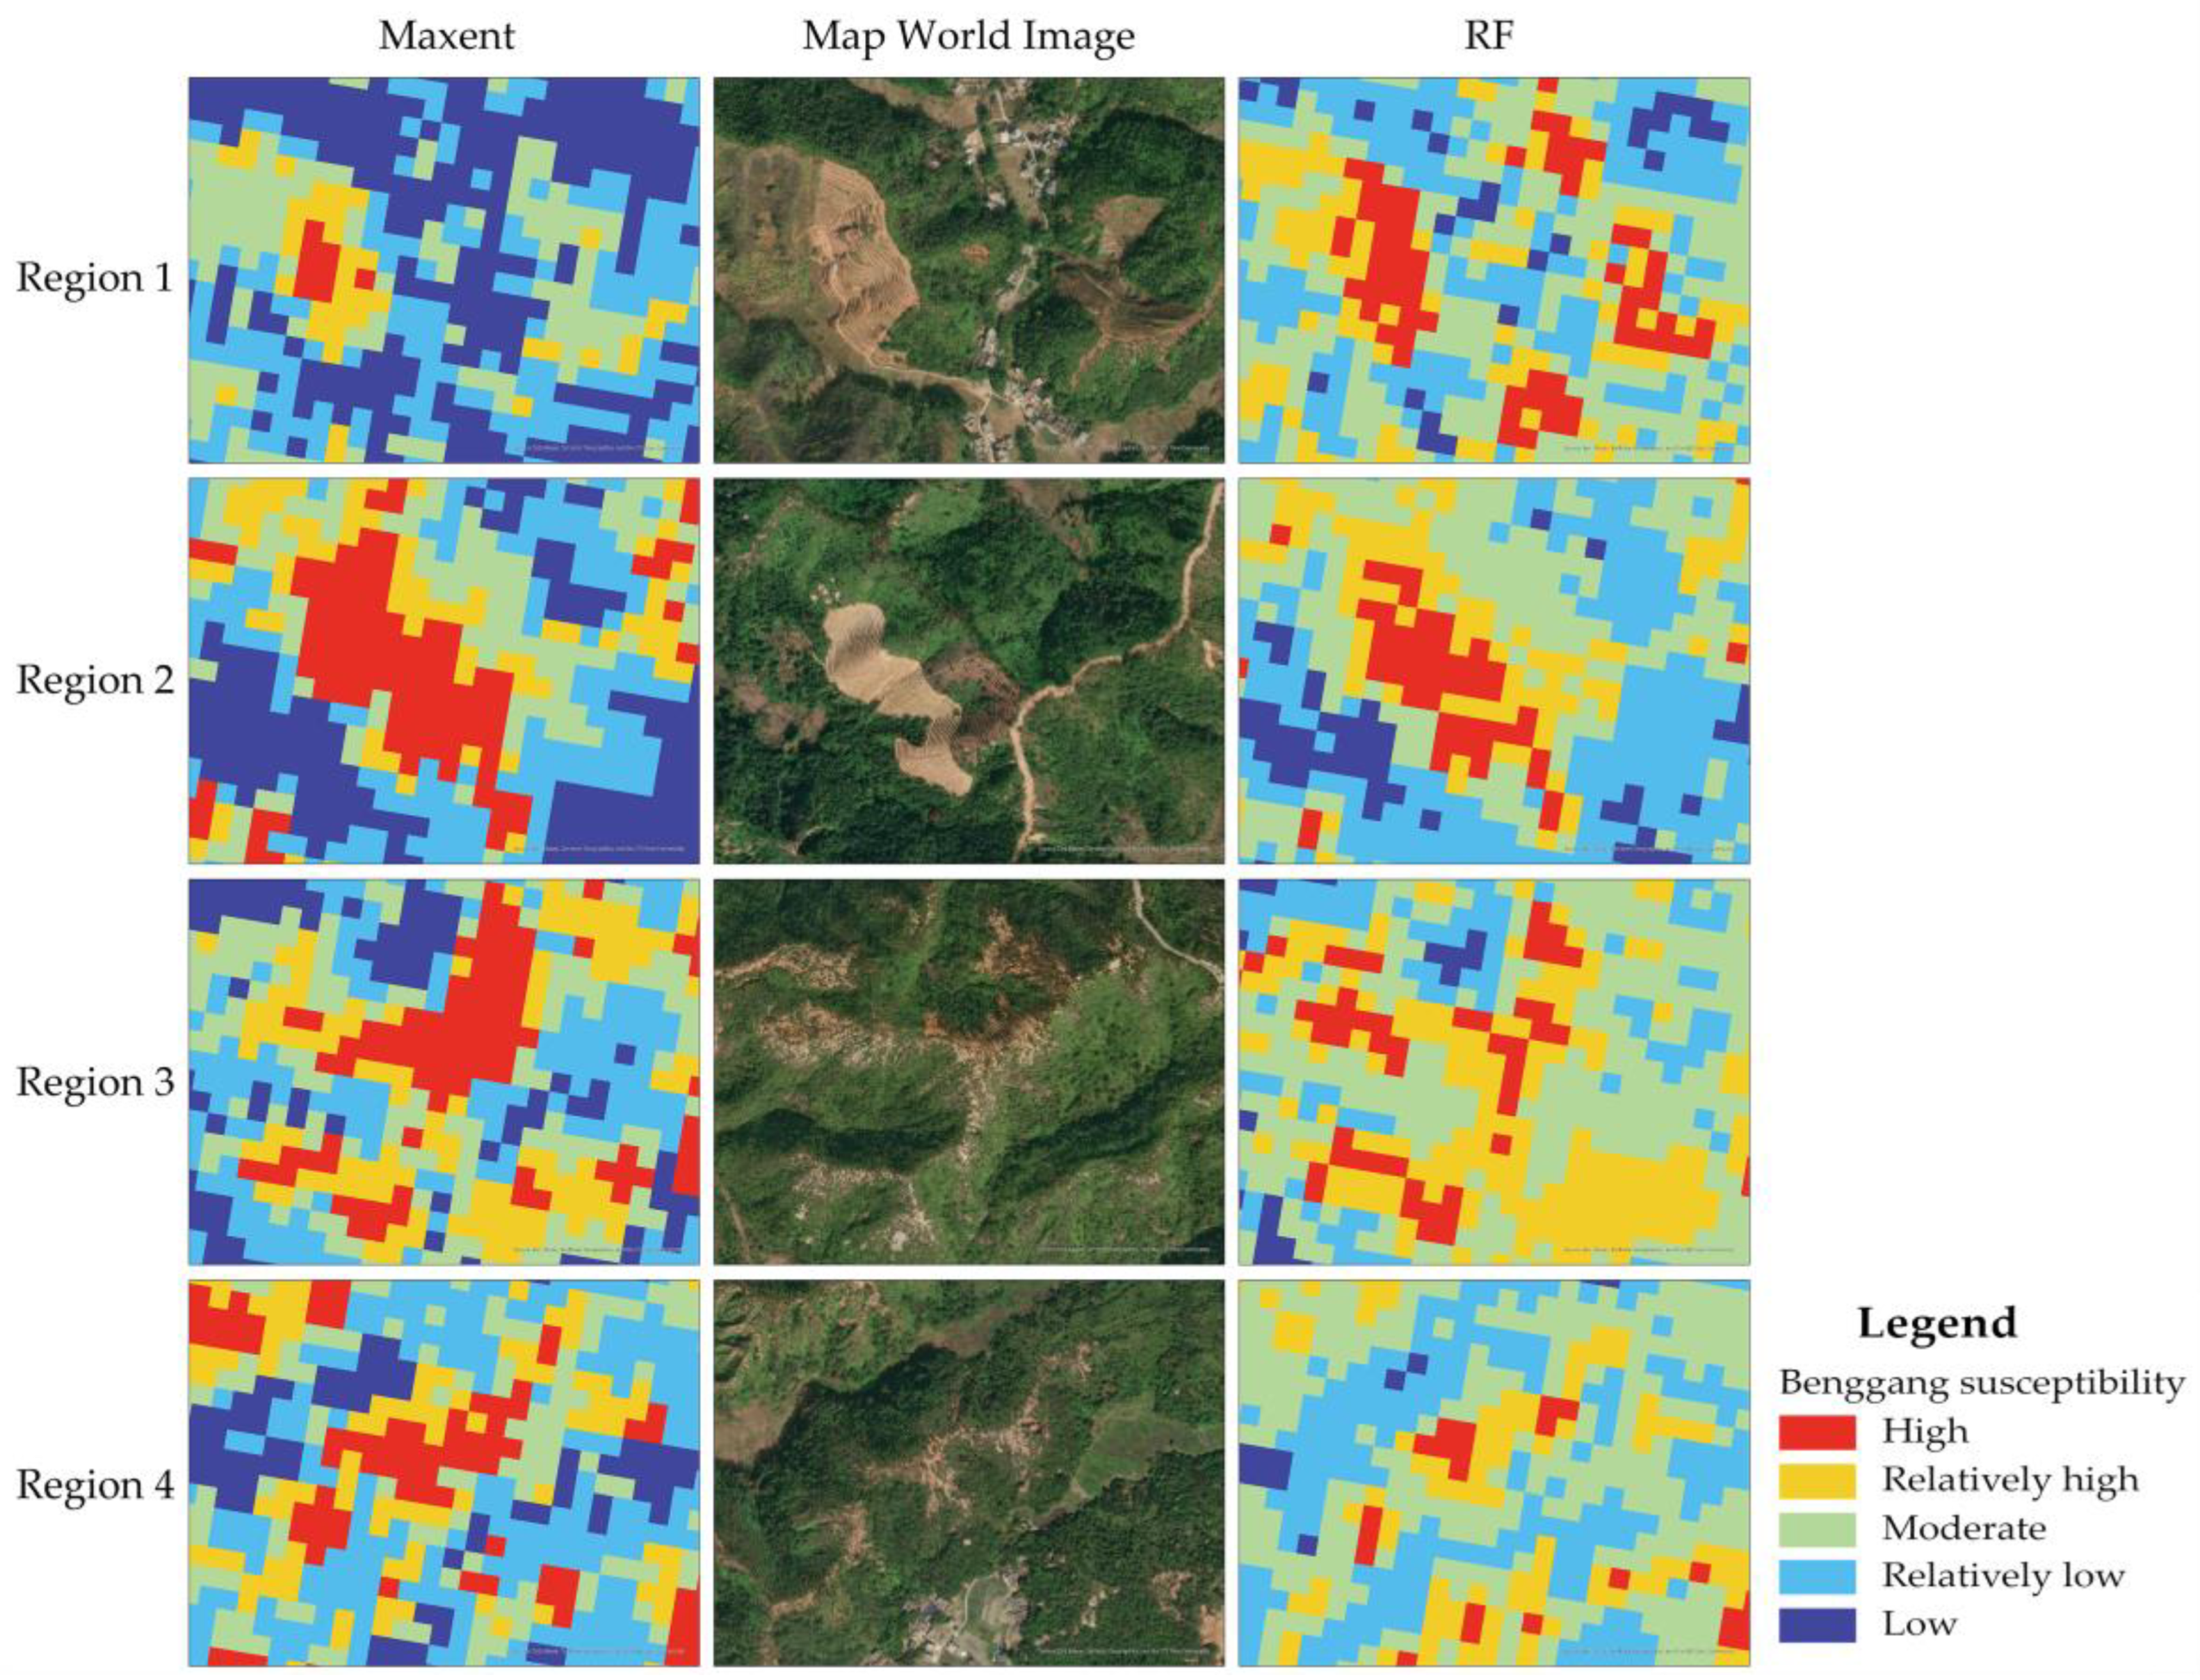
4.3. Susceptibility Evaluation Results and Comparisons

The variable importance derived from the analysis of both models is utilized for further evaluation of Benggang erosion susceptibility. The Maxent model calculates susceptibility based on the principle of maximum entropy, using the average of 10 iterations as the final outcome. In contrast, the RF model’s susceptibility evaluation is predicated on the product of variable importance and the frequency ratio model. The BES is categorized into five grades, using the natural break method, as depicted in Figure 9.
In the predictive results yielded by the Maxent model, regions of high and relatively high susceptibility are notably confined to hilly and mountainous landscapes. The model not only pinpoints areas where Benggangs have already manifested but also discerns zones of high susceptibility that have yet to be affected by Benggang erosion. A case in point is the fragmented hilly and mountainous region at the study area’s core, where, despite a dense concentration of Benggangs, numerous large gullies with intense erosion are present, indicating a substantial risk for further Benggang development. The RF model, too, detects areas of high susceptibility in the central part of the study area that have been unexposed to Benggang erosion (Figure 10). However, it diverges by classifying numerous agricultural plots on gentle slopes (Figure 10e) within the high susceptibility bracket—a pattern infrequently mirrored in the Maxent model’s findings. This discrepancy may signal a limitation inherent in the RF model’s analytical approach, especially given the earlier analysis that suggests agricultural lands on gentle slopes are generally less likely to experience Benggang erosion.
The proportion of each grade’s area relative to the entire study area was calculated. Furthermore, the Bh rate, which denotes the proportion of Benggang points within the high susceptibility category, was ascertained, culminating in the compilation of Table 2. The Bh rate in the Maxent model’s susceptibility evaluation is 54.16, which is higher than the 48.92 of the RF model. Moreover, the proportion of areas classified as high and relatively high susceptibility is only half that of the RF model. This indicates that the Maxent model’s susceptibility evaluation is more conservative but still identifies a significant number of Benggang areas as highly susceptible. The proportion of areas with low susceptibility in the RF model is 15.06, significantly lower than the 57.43 of the Maxent model. Both models use the natural break method for grading susceptibility, yet the RF model’s overall susceptibility index tends to be skewed towards higher grades compared to the Maxent model. This bias is counterproductive for accurately pinpointing areas of high BES, as an inflated evaluation broadens the delineation of high-risk areas, thereby intensifying the challenges associated with further Benggang prevention and management initiatives.
Global and local spatial autocorrelation analyses were performed on the susceptibility assessment outcomes of the two models, with the findings systematically documented in Table 3 and Figure 11. The Maxent model yielded a global Moran’s I index of 0.7289 (p < 0.001), surpassing the RF model’s index of 0.7021 (p < 0.001). The positive Moran’s I values for both models, exceeding zero, signify the presence of significant positive spatial autocorrelation within their global assessments. Notably, the Maxent model exhibited a more pronounced level of correlation, underscoring its enhanced spatial coherence in the susceptibility evaluation. The High–High (H-H) and Low–Low (L-L) clusters, which are indicative of areas of concordance in susceptibility, were observed within the high and low susceptibility zones, respectively, according to the evaluations of each model. However, the proportions of H-H and L-L clusters in the Maxent model’s evaluation results were 19.34% and 38.41%, respectively, which are significantly higher than those in the RF model. Additionally, the non-significant rate in the Maxent model’s evaluation results was considerably lower than the RF model’s non-significant rate of 72.04%, implying that the Maxent model’s susceptibility evaluation results have greater statistical significance. This enhanced significance is crucial for the BES evaluation as it suggests that the Maxent model’s results have a stronger evidential basis. Consequently, despite the RF model having a higher AUC value than the Maxent model, the overall performance of the Maxent model is deemed more rational and superior based on the aforementioned analytical results.

5. Discussion

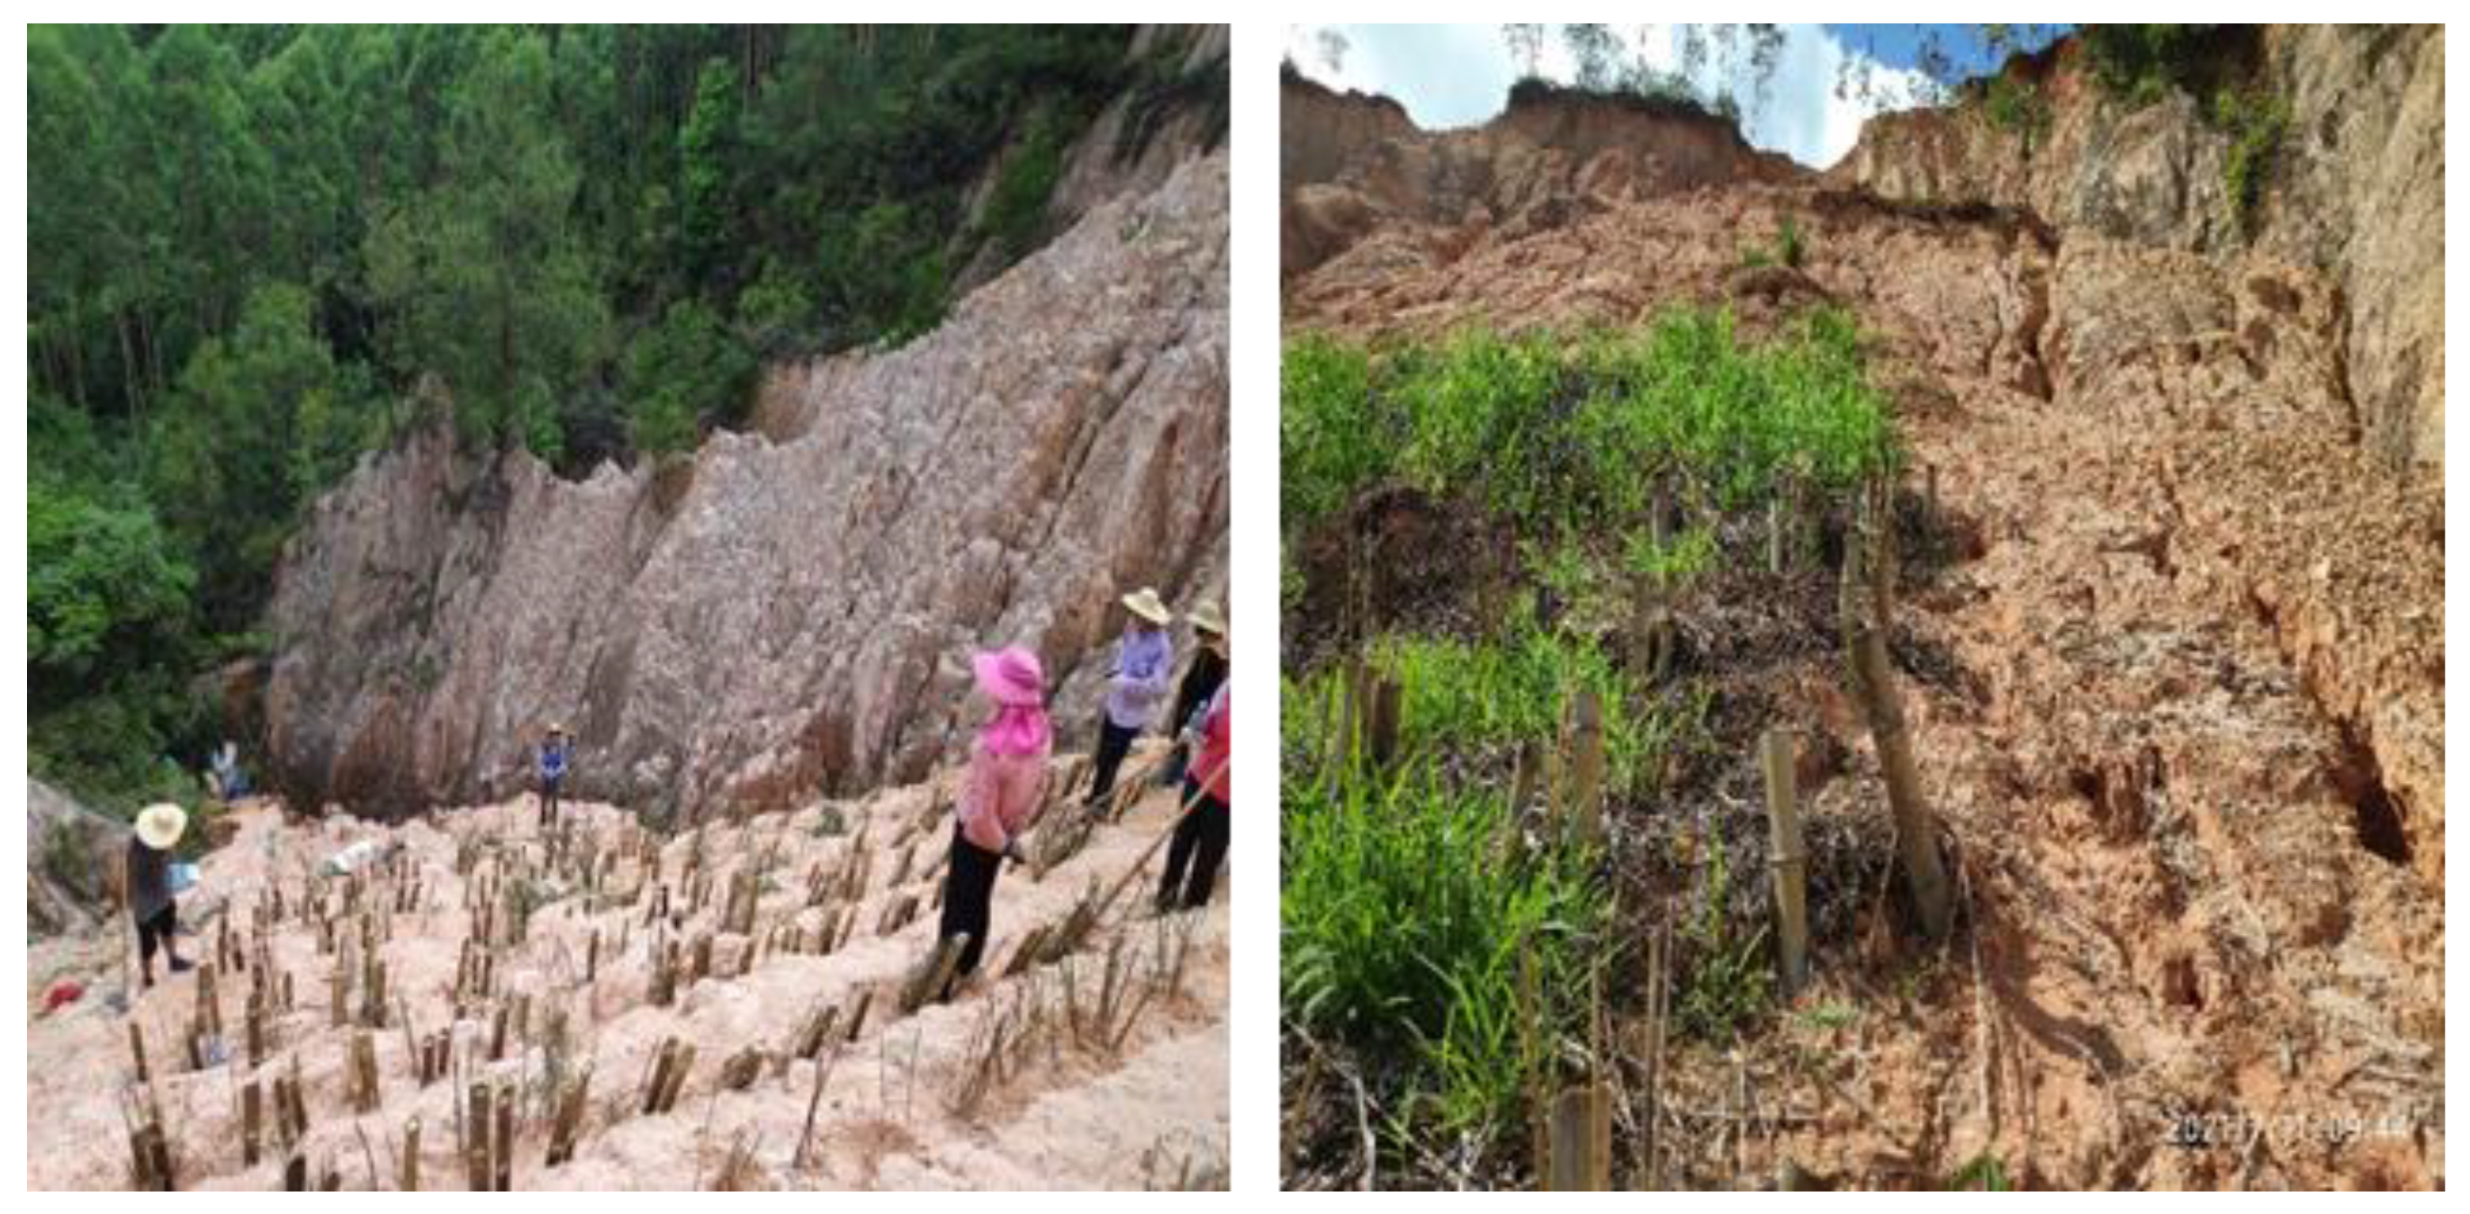
5.1. Typical High-Susceptibility Regions Identified

Figure 12 illustrates four typical areas within the susceptibility evaluation results of the two models, which have not experienced Benggang erosion but are classified as high BES areas. Based on imagery from Map World, Regions 1 and 2 are artificially cultivated terraced fields. These terraced fields have been identified by both models as areas highly likely to experience Benggang erosion, despite the maintenance by field managers that makes large-scale collapses of the exposed soil unlikely. However, current research methodologies do not provide a viable way to distinguish these areas from Benggangs in susceptibility assessments. Moreover, during periods of heavy rainfall, the erosion of these soils and the subsequent transport of sediment into downstream watercourses is foreseeable, potentially causing damage to downstream agricultural lands, housing, and infrastructure. Therefore, soil erosion in these areas warrants attention, and measures for soil retention and effective drainage systems should be considered.
Regions 3 and 4, as identified by the Maxent model, are marked by high susceptibility to Benggang erosion, whereas the RF model predominantly labels them with a relatively high susceptibility rating. These areas are distinguished by a concentration of gully erosion sites and the presence of bare surfaces along watershed ridges, making them exceedingly vulnerable to Benggang formation. The infiltration of rainwater through these exposed soil layers triggers soil expansion and initiates chemical reactions within the soil matrix, particularly at points of slope discontinuity. The warmer climatic conditions prevalent in these regions exacerbate these processes, heightening the risk of gravitational collapses. Given the critical nature of these areas in the spectrum of Benggang mitigation and management, they should be afforded priority status for intervention efforts.
However, both the Maxent model and the RF model’s susceptibility evaluation results, based on the spatial resolution of the data currently in use, are unable to identify the morphological characteristics of Benggangs. In fact, due to the differences in the foundation of slope erosion, Benggangs can exhibit various forms such as arc-shaped, linear-shaped, claw-shaped, ladle-shaped, and composite-shaped at different stages of development [47]. For Benggangs of different morphologies, the methods and focal points of erosion control vary. For instance, for large areas with gentle slopes, such as arc-shaped Benggangs, the control typically involves the use of a flexible vegetation barrier to intercept sediment from the slope and to intercept slope runoff (Figure 13). To obtain more refined scale identification results of the BES for the management of Benggang erosion, large-scale, high spatial resolution remote sensing imagery data should be utilized in susceptibility evaluation.

5.2. Absence Sample Acquisition and Variable Processing

In Figure 12, Region 1, the northern and southern areas identified as high susceptibility by the RF model are examples of the model incorrectly classifying gentle slope farmland as high susceptibility areas. The emergence of this issue may be due to the lack of additional constraints in the method combining the RF model with the frequency ratio model, necessitating the imposition of more anthropogenic conditions before calculating susceptibility. A solution could be to manually set non-Benggang points in these gentle slope farmland areas, which may enhance the RF model’s classification capabilities in these regions. This shortcoming precisely illustrates that the RF model has higher demands for sample data, and the selection of absence samples significantly influences the model’s classification outcomes and the evaluation of the BES. The pathways to obtain positive samples are precise, while the selection of absence samples is much more complex. The absence samples in this paper were acquired using a random point generation tool, which ensures an unbiased distribution of absence samples across the study area without additional human intervention, thereby better reflecting the model’s inherent recognition efficacy.
In contrast, the Maxent model has a significant advantage in this regard, as it does not require absence samples and can identify high Benggang susceptibility areas based on single-period data, circumventing the issue of absence sample acquisition. Additionally, the RF model’s inability to directly process categorical data requires anthropogenic assignment of values. The frequency ratio model also necessitates the stratification of continuous variables, where an excessive number of strata may dilute the impact of significant variables on the results, while too few strata may compromise the precision of susceptibility differentiation. There is ample room for improvement in the application of the RF model to susceptibility assessments.
The two models differ in the calculation method of the BES. Based on the spatial scope of the study area and the amount of sample point data selected in this study, it is difficult to reflect the difference between the two models in the data accessibility of environmental variables. A broader spatial scope and more environmental variables may achieve this purpose. Nevertheless, in light of the aforementioned analysis, although the AUC value of the Maxent model is lower than that of the RF model, the Maxent model has stronger applicability, and its susceptibility evaluation results are relatively more persuasive.

6. Conclusions

This study introduced the Maxent model for the susceptibility assessment of Benggang erosion and compared the results with the widely used RF model using spatial correlation analysis. The findings revealed the following:
(1) The AUC values for the importance analysis of the 10 selected environmental variables in the Maxent and RF models reached 0.885 and 0.927, respectively. In both models, identifying the elevation, FVC, R factor, Lithology, and TWI are the most important variables.
(2) Based on the Maxent model, the probability of Benggang occurrence in North Huacheng Town initially increases and then decreases with the rise in elevation, slope, TWI, R factor, and FVC. Benggang is predominantly distributed in granite Lithology areas, and exhibits unique characteristics distinct from typical gully erosion phenomena.
(3) The susceptibility evaluation of the Maxent model outcomes demonstrates superior spatial correlation compared with the RF model’s results. Both models adeptly identify zones potentially prone to Benggang erosion, yet the Maxent model presents a more conservative estimation. In contrast, the RF model tends to overstate Benggang susceptibility in certain areas characterized by gentle slopes and farmland.
(4) The Maxent model has the advantages of not requiring absence samples, being able to directly handle categorical data, and providing more convincing results. Therefore, it has the potential for wide application in the evaluation of Benggang erosion susceptibility.
The most recent comprehensive survey of Benggangs in China was completed over 20 years ago, and since then, the landscape has transformed considerably, with many Benggangs experiencing notable evolution. The distribution patterns of Benggang erosion differ markedly among provinces in southern China. With the progression of remote sensing and field survey technologies, there is an urgent need for updated, comprehensive surveys to bolster the foundation of Benggang research. In different research areas, the environmental variables selected in this study may exhibit varying performances, suggesting the potential benefit of incorporating additional variables for a more nuanced analysis of the natural environmental factors contributing to Benggang formation.
In summary, the acquisition of more precise field data, encompassing a broader geographical scope and incorporating a diverse array of variables, is pivotal for enhancing the spatial prediction accuracy of Benggang erosion. This research offers valuable insights into the predictive modeling of Benggang distribution and provides an important consideration for the sustainability of the regional ecological environment and human society.

Author Contributions

Conceptualization, H.O. and Z.Y.; data curation, H.O. and X.M.; writing—original draft preparation, H.O.; writing—review and editing, X.M., X.Y., Y.L., K.L.N. and S.S.; supervision, Z.Y. All authors have read and agreed to the published version of the manuscript.

Funding

The National Natural Science Foundation of China (42377349), the Guangdong Provincial Science and Technology Project (2021B1212050019, 2022A050509005), GDAS’ Project of Science and Technology Development (2022GDASZH-2022010203, 2022GDASZH-2022010105), and The National Key R&D Program of China (2021YFE0117300).

Institutional Review Board Statement

Not applicable.

Informed Consent Statement

Not applicable.

Data Availability Statement

Data are contained within the article.

Acknowledgments

The authors are very grateful to the Guangdong Academy of Sciences for the financial support of this study, and to the staff of the Soil and Water Conservation Science and Technology Demonstration Park in Huacheng Town for their help in our field research. They also thank the editor and the anonymous reviewers for their professional and pertinent comments and suggestions.

Conflicts of Interest

The authors declare no conflicts of interest.

References

  1. Pimentel, D. Soil Erosion: A Food and Environmental Threat. Environ. Dev. Sustain. 2006, 8, 119–137. [Google Scholar] [CrossRef]
  2. García-Ruiz, J.M.; Beguería, S.; Nadal-Romero, E.; González-Hidalgo, J.C.; Lana-Renault, N.; Sanjuán, Y. A Meta-Analysis of Soil Erosion Rates across the World. Geomorphology 2015, 239, 160–173. [Google Scholar] [CrossRef]
  3. Igwe, P.U.; Onuigbo, A.A.; Chinedu, O.C.; Ezeaku, I.I.; Muoneke, M.M. Soil Erosion: A Review of Models and Applications. Int. J. Adv. Eng. Res. Sci. 2017, 4, 138–150. [Google Scholar] [CrossRef]
  4. Nearing, M.A.; Xie, Y.; Liu, B.; Ye, Y. Natural and Anthropogenic Rates of Soil Erosion. Int. Soil Water Conserv. Res. 2017, 5, 77–84. [Google Scholar] [CrossRef]
  5. Borrelli, P.; Robinson, D.A.; Fleischer, L.R.; Lugato, E.; Ballabio, C.; Alewell, C.; Meusburger, K.; Modugno, S.; Schütt, B.; Ferro, V.; et al. An Assessment of the Global Impact of 21st Century Land Use Change on Soil Erosion. Nat. Commun. 2017, 8, 2013. [Google Scholar] [CrossRef] [PubMed]
  6. Jiongxin, X. Benggang Erosion: The Influencing Factors. CATENA 1996, 27, 249–263. [Google Scholar] [CrossRef]
  7. Wei, Y.; Liu, Z.; Wu, X.; Zhang, Y.; Cui, T.; Cai, C.; Guo, Z.; Wang, J.; Cheng, D. Can Benggang Be Regarded as Gully Erosion? CATENA 2021, 207, 105648. [Google Scholar] [CrossRef]
  8. Zhang, W.; Yuan, Z.; Li, D.; Zheng, M.; Liao, Y.; Cai, Q.; Huang, Y.; Cai, C.; Niu, D.; Wang, Q. Discussion of the “Benggang” concept and its English translation. Sci. Soil Water Conserv. 2020, 18, 136–143. [Google Scholar] [CrossRef]
  9. Liang, Y.; Yang, X.; Pan, Z.; Zhang, B.; Shi, D. Characteristics and control measures of soil and water loss in southern hilly region of red soil. Soil Water Conserv. China 2008, 12, 50–53. [Google Scholar] [CrossRef]
  10. Zhong, B.; Peng, S.; Zhang, Q.; Ma, H.; Cao, S. Using an Ecological Economics Approach to Support the Restoration of Collapsing Gullies in Southern China. Land Use Policy 2013, 32, 119–124. [Google Scholar] [CrossRef]
  11. Feng, H.; Liao, C.; Li, S.; Lu, S. Investigation on status of benggang erosion in southern China. Yangtze River 2009, 40, 66–75. [Google Scholar] [CrossRef]
  12. Liang, Y.; Ning, D.; Pan, X.; Li, D.; Zhang, B. Characteristics and treatment of benggang erosion in southern red soil region. Soil Water Conserv. China 2009, 1, 31–34. [Google Scholar] [CrossRef]
  13. Zhu, X.; Gao, L.; Wei, X.; Li, T.; Shao, M. Progress and Prospect of Studies of Benggang Erosion in Southern China. Geoderma 2023, 438, 116656. [Google Scholar] [CrossRef]
  14. Wu, Y.; Li, N.; Wang, X.; Cui, J.; Chen, Y.; Wu, Y.; Yamamoto, H. Experimental Investigation on Mechanical Behavior and Particle Crushing of Calcareous Sand Retrieved from South China Sea. Eng. Geol. 2021, 280, 105932. [Google Scholar] [CrossRef]
  15. Wu, Y.; Yamamoto, H.; Cui, J.; Cheng, H. Influence of Load Mode on Particle Crushing Characteristics of Silica Sand at High Stresses. Int. J. Geomech. 2020, 20, 04019194. [Google Scholar] [CrossRef]
  16. Zhang, S.; Zhong, C. The mechanism and types of the benggang forming in Guangdong province. Bull. Soil Water Conserv. 1990, 3, 8–16. [Google Scholar] [CrossRef]
  17. Deng, Y.; Shen, X.; Xia, D.; Cai, C.; Ding, S.; Wang, T. Soil Erodibility and Physicochemical Properties of Collapsing Gully Alluvial Fans in Southern China. Pedosphere 2019, 29, 102–113. [Google Scholar] [CrossRef]
  18. Deng, Y.; Duan, X.; Ding, S.; Cai, C. Effect of Joint Structure and Slope Direction on the Development of Collapsing Gully in Tuffaceous Sandstone Area in South China. Int. Soil Water Conserv. Res. 2020, 8, 131–140. [Google Scholar] [CrossRef]
  19. Gao, C.; Li, P.; Hu, J.; Yan, L.; Latifi, H.; Yao, W.; Hao, M.; Gao, J.; Dang, T.; Zhang, S. Development of Gully Erosion Processes: A 3D Investigation Based on Field Scouring Experiments and Laser Scanning. Remote Sens. Environ. 2021, 265, 112683. [Google Scholar] [CrossRef]
  20. Local Standard Information Service Platform. Available online: https://dbba.sacinfo.org.cn/stdDetail/5805d01e1052d1b2e8387ca6c5cef746c7c623d7f33e99a61ea33f0ee8bd8b90 (accessed on 10 May 2024).
  21. General Office of the CPC Central Committee and General Office of the State Council issued Opinions on Strengthening Soil and Water Conservation in the New Era. Available online: https://www.gov.cn/gongbao/content/2023/content_5738894.htm (accessed on 10 May 2024).
  22. Liao, Y.; Tang, C.; Yuan, Z.; Zhuo, M.; Huang, B.; Nie, X.; Xie, Z.; Li, D. Research Progress on Benggang Erosion and Its Prevention Measure in Red Soi Region of Southern China. Acta Pedol. Sin. 2018, 55, 1297–1312. [Google Scholar]
  23. Xie, F.; Liang, Z.; Deng, Y.; Li, M.; Cai, Z.; Huang, Z. Spatial Distribution Characteristics and Control Measures of Different Forms of Collapsing Slopes in Guangxi. Soil Water Conserv. China 2020, 7, 53–57+5. [Google Scholar] [CrossRef]
  24. Chen, Y. Sensitivity Analysis of River Basin Collapsed Gully Based on RS and GIS. Master’s Thesis, Fujian Normal University, Fuzhou, China, 2010. Available online: https://chn.oversea.cnki.net/KCMS/detail/detail.aspx?dbcode=CMFD&dbname=CMFD2012&filename=1011062084.nh&uniplatform=OVERSEA&v=0U5BNMqXMwn3yh_Q9ruoPUcMxRhaQNIyMLDaWiVY6MgDpjSNRJLAiwKqZxJ57VnG (accessed on 10 May 2024).
  25. Ji, X.; Huang, Y.; Lin, J.; Jiang, F.; Chen, J. Sensitivity assessment method of collapsed gully occurrence in granite region of South China based on niche-fitness. J. China Agric. Univ. 2017, 22, 159–168. [Google Scholar] [CrossRef]
  26. Cheng, D.; Zhang, P. Conception of Risk Assessment of Collapse Gully Erosion in South China. Bull. Soil Water Conserv. 2016, 36, 346–350. [Google Scholar] [CrossRef]
  27. Cheng, D.; Zhao, Y.; Zhang, P.; Zhao, J. Risk Assessment of Collapse Gully Erosion in Jiangxi Province Based on Bivariate Statistical Analysis of Entropy Information. J. Chang. River Sci. Res. Inst. 2019, 36, 27–32+38. [Google Scholar] [CrossRef]
  28. Sun, K.; Cheng, D.; He, J.; Zhao, Y. Comparative Study on Risk Assessment Methods for Collapse Gully Erosion: A Case of Guangdong Province. Soil Water Conserv. China 2018, 3, 51–54+69. [Google Scholar] [CrossRef]
  29. Sun, K.; Cheng, D.B.; He, J.J.; Zhao, Y.L. Comparison of Two Occurrence Risk Assessment Methods for Collapse Gully Erosion —A Case Study in Guangdong Province. Iop Conf. Ser. Earth Environ. Sci. 2018, 113, 012209. [Google Scholar] [CrossRef]
  30. Guan, J.; Huang, Y.; Lin, J.; Jiang, F.; Yao, Y.; Ji, X. Comparisons Between Benggang Risk Assessments Based on Information Model and Random Forest Model. Mt. Res. 2021, 39, 539–551. [Google Scholar] [CrossRef]
  31. Wei, Y.; Wu, X.; Wang, J.; Yu, H.; Xia, J.; Deng, Y.; Zhang, Y.; Xiang, Y.; Cai, C.; Guo, Z. Identification of Geo-Environmental Factors on Benggang Susceptibility and Its Spatial Modelling Using Comparative Data-Driven Methods. Soil Tillage Res. 2021, 208, 104857. [Google Scholar] [CrossRef]
  32. Guo, F.; Lai, P.; Chen, Y.; Wang, X.; Xia, D.; Cao, Y. Influence of Different Environmental Factor Connection Methods on Benggang Susceptibility Assessment. Bull. Soil Water Conserv. 2022, 42, 123–130. [Google Scholar] [CrossRef]
  33. Guo, F.; Wu, D.; Wang, X.; Dai, Q.; Lai, Z.; Chen, Y.; Xia, D. Susceptibility Assessment of Benggang Based on Random Forests Model and Geodetector in Xingguo County of South Jiangxi. J. China Three Gorges Univ. 2023, 45, 44–50. [Google Scholar] [CrossRef]
  34. Guo, F.; Jiang, G.; Huang, X.; Wang, X.; Xia, D.; Chen, Y.; Li, X. Impact of environmental factor combinations and negative samples election on Benggang susceptibility assessment in granite areas. Trans. Chin. Soc. Agric. Eng. 2024, 40, 191–200. [Google Scholar] [CrossRef]
  35. Guo, F.; Zhang, J.; Shan, H.; Cheng, D.; Li, X.; Xia, D.; Chen, Y. Evaluation of the Susceptibility to Benggang in Shicheng County, Ganzhou City Under Different Raster Cell Resolutions. J. China Three Gorges Univ. 2024, 46, 63–70. [Google Scholar] [CrossRef]
  36. Dou, J.; Yunus, A.P.; Bui, D.T.; Merghadi, A.; Sahana, M.; Zhu, Z.; Chen, C.-W.; Han, Z.; Pham, B.T. Improved Landslide Assessment Using Support Vector Machine with Bagging, Boosting, and Stacking Ensemble Machine Learning Framework in a Mountainous Watershed, Japan. Landslides 2020, 17, 641–658. [Google Scholar] [CrossRef]
  37. Phillips, S.J.; Dudık, M. Modeling of Species Distributions with Maxent: New Extensions and a Comprehensive Evaluation. Ecography 2010, 31, 161–175. [Google Scholar] [CrossRef]
  38. Kornejady, A.; Ownegh, M.; Bahremand, A. Landslide Susceptibility Assessment Using Maximum Entropy Model with Two Different Data Sampling Methods. CATENA 2017, 152, 144–162. [Google Scholar] [CrossRef]
  39. Qu, X.; Li, D.; He, Y.; Yu, L.; Yan, W. Evaluation of Landslide Susceptibility Based on MaxEnt Model—Taking Panzhihua City as an Example. Res. Soil Water Conserv. 2021, 28, 224–229. [Google Scholar] [CrossRef]
  40. Wu, B.; Qi, S.; Guo, Z.; Hu, Y. Attribution of Superficial Landslide Risk of Forestland in Huaying MountainsBased on MaxEnt Model. Sci. Silvae Sin. 2024, 60, 32–46. [Google Scholar]
  41. Pandey, V.K.; Pourghasemi, H.R.; Sharma, M.C. Landslide Susceptibility Mapping Using Maximum Entropy and Support Vector Machine Models along the Highway Corridor, Garhwal Himalaya. Geocarto Int. 2020, 35, 168–187. [Google Scholar] [CrossRef]
  42. Yang, X.; Jin, X.; Zhou, Y. Wildfire Risk Assessment and Zoning by Integrating Maxent and GIS in Hunan Province, China. Forests 2021, 12, 1299. [Google Scholar] [CrossRef]
  43. Gwitira, I.; Murwira, A.; Masocha, M.; Zengeya, F.M.; Shekede, M.D.; Chirenda, J.; Tinago, W.; Mberikunashe, J.; Masendu, R. GIS-Based Stratification of Malaria Risk Zones for Zimbabwe. Geocarto Int. 2019, 34, 1163–1176. [Google Scholar] [CrossRef]
  44. Lin, J.; He, P.; Yang, L.; He, X.; Lu, S.; Liu, D. Predicting Future Urban Waterlogging-Prone Areas by Coupling the Maximum Entropy and FLUS Model. Sustain. Cities Soc. 2022, 80, 103812. [Google Scholar] [CrossRef]
  45. Wuhua County People’s Government Portal. Available online: https://www.wuhua.gov.cn/xxgk/index.html (accessed on 13 May 2024).
  46. Liao, Y.; Yuan, Z.; Li, D.; Zheng, M.; Huang, B.; Xie, Z.; Wu, X.; Luo, X. What Kind of Gully Can Develop into Benggang? CATENA 2023, 225, 107024. [Google Scholar] [CrossRef]
  47. Wu, Z.; Deng, N.; Wang, J. Erosion Geomorphology and Process in Avalanching Hill Areas. Soil Water Conserv. China 1999, 4, 12–14+48. [Google Scholar] [CrossRef]
  48. Wu, Z.; Li, D.; Qiu, S. Systematic Analysis of Slope Disintegration ErosionLandform in South China. Bull. Soil Water Conserv. 1999, 5, 24–26. [Google Scholar] [CrossRef]
  49. Yao, Y.; Huang, Y.; Lin, J.; Jiang, F.; Guan, J.; Ji, X. Benggang (collapsing hill) erosion hazard zoning based on the minimum cumulative resistance mode: A case study of a small watershed in Anxi County, Fujian, China. Chin. J. Appl. Ecol. 2022, 33, 1370–1376. [Google Scholar] [CrossRef]
  50. Liao, Y.; Zheng, M.; Li, D.; Wu, X.; Liang, C.; Nie, X.; Huang, B.; Xie, Z.; Yuan, Z.; Tang, C. Relationship of Benggang Number, Area, and Hypsometric Integral Values at Different Landform Developmental Stages. Land Degrad. Dev. 2020, 31, 2319–2328. [Google Scholar] [CrossRef]
  51. Liao, K.; Song, Y.; Xie, S.; Luo, Y.; Liu, Q.; Lin, H. Quantitative Analysis of the Factors Influencing the Spatial Distribution of Benggang Landforms Based on a Geographical Detector. ISPRS Int. J. Geo-Inf. 2022, 11, 337. [Google Scholar] [CrossRef]
  52. Ruan, F.; Zhou, F.; Nie, B.; Lin, W.; Chen, M.; Wu, X.; Shi, Y.; Xu, J. Study on corrosion resistance characteristics of granite weathering crust—Physical characteristics of granite weathering crust. Soil Water Conserv. Fujian 1995, 4, 37–42. [Google Scholar]
  53. He, X.; Tang, K.; Zhang, X. Soil Erosion Dynamics on the Chinese Loess Plateau in the Last 10,000 Years. Mt. Res. Dev. 2004, 24, 342–347. [Google Scholar] [CrossRef]
  54. Li, P.; Chen, J.; Zhao, G.; Holden, J.; Liu, B.; Chan, F.K.S.; Hu, J.; Wu, P.; Mu, X. Determining the Drivers and Rates of Soil Erosion on the Loess Plateau since 1901. Sci. Total Environ. 2022, 823, 153674. [Google Scholar] [CrossRef] [PubMed]
  55. Beven, K.J.; Kirkby, M.J. A Physically Based, Variable Contributing Area Model of Basin Hydrology/Un Modèle à Base Physique de Zone d’appel Variable de l’hydrologie Du Bassin Versant. Hydrol. Sci. Bull. 1979, 24, 43–69. [Google Scholar] [CrossRef]
  56. Liao, Y.; Yuan, Z.; Zheng, M.; Li, D.; Nie, X.; Wu, X.; Huang, B.; Xie, Z.; Tang, C. The Spatial Distribution of Benggang and the Factors That Influence It. Land Degrad. Dev. 2019, 30, 2323–2335. [Google Scholar] [CrossRef]
  57. Zhang, W.; Fu, J. Rainfall erosivity estimation under different rainfall amount. Resour. Sci. 2003, 25, 35–41. [Google Scholar]
  58. Peng, S.; Ding, Y.; Liu, W.; Li, Z. 1 Km Monthly Temperature and Precipitation Dataset for China from 1901 to 2017. Earth Syst. Sci. Data 2019, 11, 1931–1946. [Google Scholar] [CrossRef]
  59. Ding, G. Causes and Control Patterns of Collapse Gully Erosion in Fuiian Province. Bull. Soil Water Conserv. 2001, 5, 10–15. [Google Scholar] [CrossRef]
  60. Li, J.; Sun, H.; Xiong, M.; Yang, G. Estimation of soil erosion based on the RUSLE model in China. Acta Ecol. Sin. 2020, 40, 3473–3485. [Google Scholar] [CrossRef]
  61. Yang, J.; Huang, X. 30 m Annual Land Cover and Its Dynamics in China from 1990 to 2019. Earth Syst. Sci. Data Discuss. 2021, 2021, 3907–3925. [Google Scholar] [CrossRef]
  62. Jaynes, E.T. Information Theory and Statistical Mechanics. Phys. Rev. 1957, 106, 620–630. [Google Scholar] [CrossRef]
  63. Wang, D.; Zhu, Y. Principle of Maximum Entropy andIts Application in Hydrology and Water Resources. Adv. Water Sci. 2001, 12, 424–430. [Google Scholar]
  64. Xing, D.; Hao, Z. The principle of maximum entropy and its applications in ecology. Biodivers. Sci. 2011, 19, 295–302. [Google Scholar] [CrossRef]
  65. Phillips, S.J.; Anderson, R.P.; Schapire, R.E. Maximum Entropy Modeling of Species Geographic Distributions. Ecol. Model. 2006, 190, 231–259. [Google Scholar] [CrossRef]
  66. Breiman, L. Random Forests. Mach. Learn. 2001, 45, 5–32. [Google Scholar] [CrossRef]
  67. Phillips, S.J.; Research, T. A Brief Tutorial on Maxent. 2021. Available online: https://biodiversityinformatics.amnh.org/open_source/maxent/ (accessed on 10 May 2024).
  68. Baltagi, B.H.; Li, D. Prediction in the Panel Data Model with Spatial Correlation. In Advances in Spatial Econometrics; Springer: Berlin/Heidelberg, Germany, 2004; Available online: https://surface.syr.edu/cgi/viewcontent.cgi?article=1080&context=cpr (accessed on 10 May 2024).
  69. Liu, L.; Li, S.; Li, X.; Jiang, Y.; Wei, W.; Wang, Z.; Bai, Y. An Integrated Approach for Landslide Susceptibility Mapping by Considering Spatial Correlation and Fractal Distribution of Clustered Landslide Data. Landslides 2019, 16, 715–728. [Google Scholar] [CrossRef]
  70. Yang, X.; Liu, R.; Yang, M.; Chen, J.; Liu, T.; Yang, Y.; Chen, W.; Wang, Y. Incorporating Landslide Spatial Information and Correlated Features among Conditioning Factors for Landslide Susceptibility Mapping. Remote Sens. 2021, 13, 2166. [Google Scholar] [CrossRef]
  71. Anselin, L. Local Indicators of Spatial Association—LISA. Geogr. Anal. 1995, 27, 93–115. [Google Scholar] [CrossRef]
  72. Shi, D. Analysis of Benggang erosion in tropical and subtropical in China. Bull. Soil Water Conserv. 1984, 3, 32–37. [Google Scholar] [CrossRef]
  73. Ruan, F. Study on Slump Gully Erosion and Its Control in Fuiian Province. Mt. Res. 2003, 21, 675–680. [Google Scholar] [CrossRef]
  74. Li, W.; Jin, P.; Li, L.; Li, H.; Qiu, C.; Xian, M.; Qin, J. Research progress on the genetic mechanism of avalanche in red soil hilly area of South China. Subtrop. Soil Water Conserv. 2014, 26, 30–33+43. [Google Scholar]
  75. Chen, S. Study on the Evolution of Soil Erosion in a Typical Small Watershed of Red Loam and Its Improvement Paradigms. Master’s Thesis, Fujian Normal University, Fuzhou, China, 2010. Available online: https://chn.oversea.cnki.net/KCMS/detail/detail.aspx?dbcode=CMFD&dbname=CMFD2010&filename=2010034246.nh&uniplatform=OVERSEA&v=PA9zG31V8wbF5O0Fxha14V_3at1shsF37fatkNfSwWPw_Tqk93y59QmaYIeZU945 (accessed on 10 May 2024).
  76. Zhang, Y.; Zhao, Y.; Liu, B.; Wang, Z.; Zhang, S. Rill and Gully Erosion on Unpaved Roads under Heavy Rainfall in Agricultural Watersheds on China’s Loess Plateau. Agric. Ecosyst. Environ. 2019, 284, 106580. [Google Scholar] [CrossRef]
  77. Dong, Y.; Xiong, D.; Su, Z.; Li, J.; Yang, D.; Shi, L.; Liu, G. The Distribution of and Factors Influencing the Vegetation in a Gully in the Dry-Hot Valley of Southwest China. CATENA 2014, 116, 60–67. [Google Scholar] [CrossRef]
  78. Ding, L.; Qin, F.; Fang, H.; Liu, H.; Zhang, B.; Shu, C.; Deng, Q.; Liu, G.; Yang, Q. Morphology and Controlling Factors of the Longitudinal Profile of Gullies in the Yuanmou Dry-Hot Valley. J. Mt. Sci. 2017, 14, 674–693. [Google Scholar] [CrossRef]
Figure 1. Unmanned aerial vehicle photographs of Benggangs in North Huacheng Town (taken in June 2018).
Sustainability 16 07328 g001
Figure 2. (a) Land-cover types and the distribution of Benggang points in North Huacheng Town; (b) the position of Guangdong Province in China; (c) the position of Meizhou City in Guangdong Province; (d) the position of North Huacheng Town in Meizhou City.
Sustainability 16 07328 g002
Figure 3. Distribution of values for 10 environment variables, in order: (a) Elevation; (b) Slope; (c) Aspect; (d) Roughness; (e) TWI; (f) Catchment area; (g) R factor; (h) FVC; (i) Lithology; (j) P factor. In Figure (c), aspect is assigned A1−8 in the order of north to northwest. Lithology is assigned L1−6 from top to bottom in Figure (i).
Sustainability 16 07328 g003
Figure 4. Research process of this study.
Sustainability 16 07328 g004
Figure 5. ROC curve of Maxent model.
Sustainability 16 07328 g005
Figure 6. The (left) figure shows the Benggang and non-Benggang points, and the (right) figure shows the ROC curve of the RF model.
Sustainability 16 07328 g006
Figure 7. Response curve between each environment variable and Benggang probability based on the Maxent model, in order: (a) Elevation; (b) Slope; (c) Aspect; (d) Roughness; (e) TWI; (f) Catchment area; (g) R factor; (h) FVC; (i) Lithology; (j) P factor.
Sustainability 16 07328 g007
Figure 8. Statistics of the number of Benggangs at different elevations and slope intervals.
Sustainability 16 07328 g008
Figure 9. Grade distribution of Benggang erosion susceptibility in the (a) Maxent model and (b) RF model.
Sustainability 16 07328 g009
Figure 10. The dense distribution areas of high Benggang erosion susceptibility: where Figure (a,d) from Maxent, Figure (b,e) from Map World Image, and Figure (c,f) from RF model.
Sustainability 16 07328 g010
Figure 11. Cluster/outlier distribution of the (a) Maxent model and (b) RF model.
Sustainability 16 07328 g011
Figure 12. Typical regions of high Benggang susceptibility.
Sustainability 16 07328 g012
Figure 13. Constructing flexible vegetation barriers (mainly Dendrocalamus barbatus) on the colluvial deposits of arc-shaped Benggangs (photographed in July 2021).
Sustainability 16 07328 g013
Table 1. Importance of environmental variables based on Maxent model and RF model (data ×100).
ElevationSlopeAspectRoughnessTWICatchment AreaR FactorFVCLithologyP Factor
Maxent40.20.10.90.25.00.514.432.16.00.6
RF18.93.66.46.510.16.512.027.66.81.6
Table 2. The proportion of different grades of Benggang erosion susceptibility (%).
Bh RateHighRelatively HighModerateRelatively LowLow
Maxent54.164.906.0310.1821.4657.43
RF48.925.9817.1431.4330.3915.06
Table 3. Spatial correlation analysis statistics.
AUCMoran’s IH-H RateL-L RateNon-Significant Rate
Maxent0.8850.729819.3438.4140.75
RF0.9270.702113.8413.0372.04
Disclaimer/Publisher’s Note: The statements, opinions and data contained in all publications are solely those of the individual author(s) and contributor(s) and not of MDPI and/or the editor(s). MDPI and/or the editor(s) disclaim responsibility for any injury to people or property resulting from any ideas, methods, instructions or products referred to in the content.

