

A Multi-Objective Optimization Approach for Solar Farm Site Selection: Case Study in Maputo, Mozambique


Abstract
1. Introduction
2. Literature Review
3. Materials and Methods
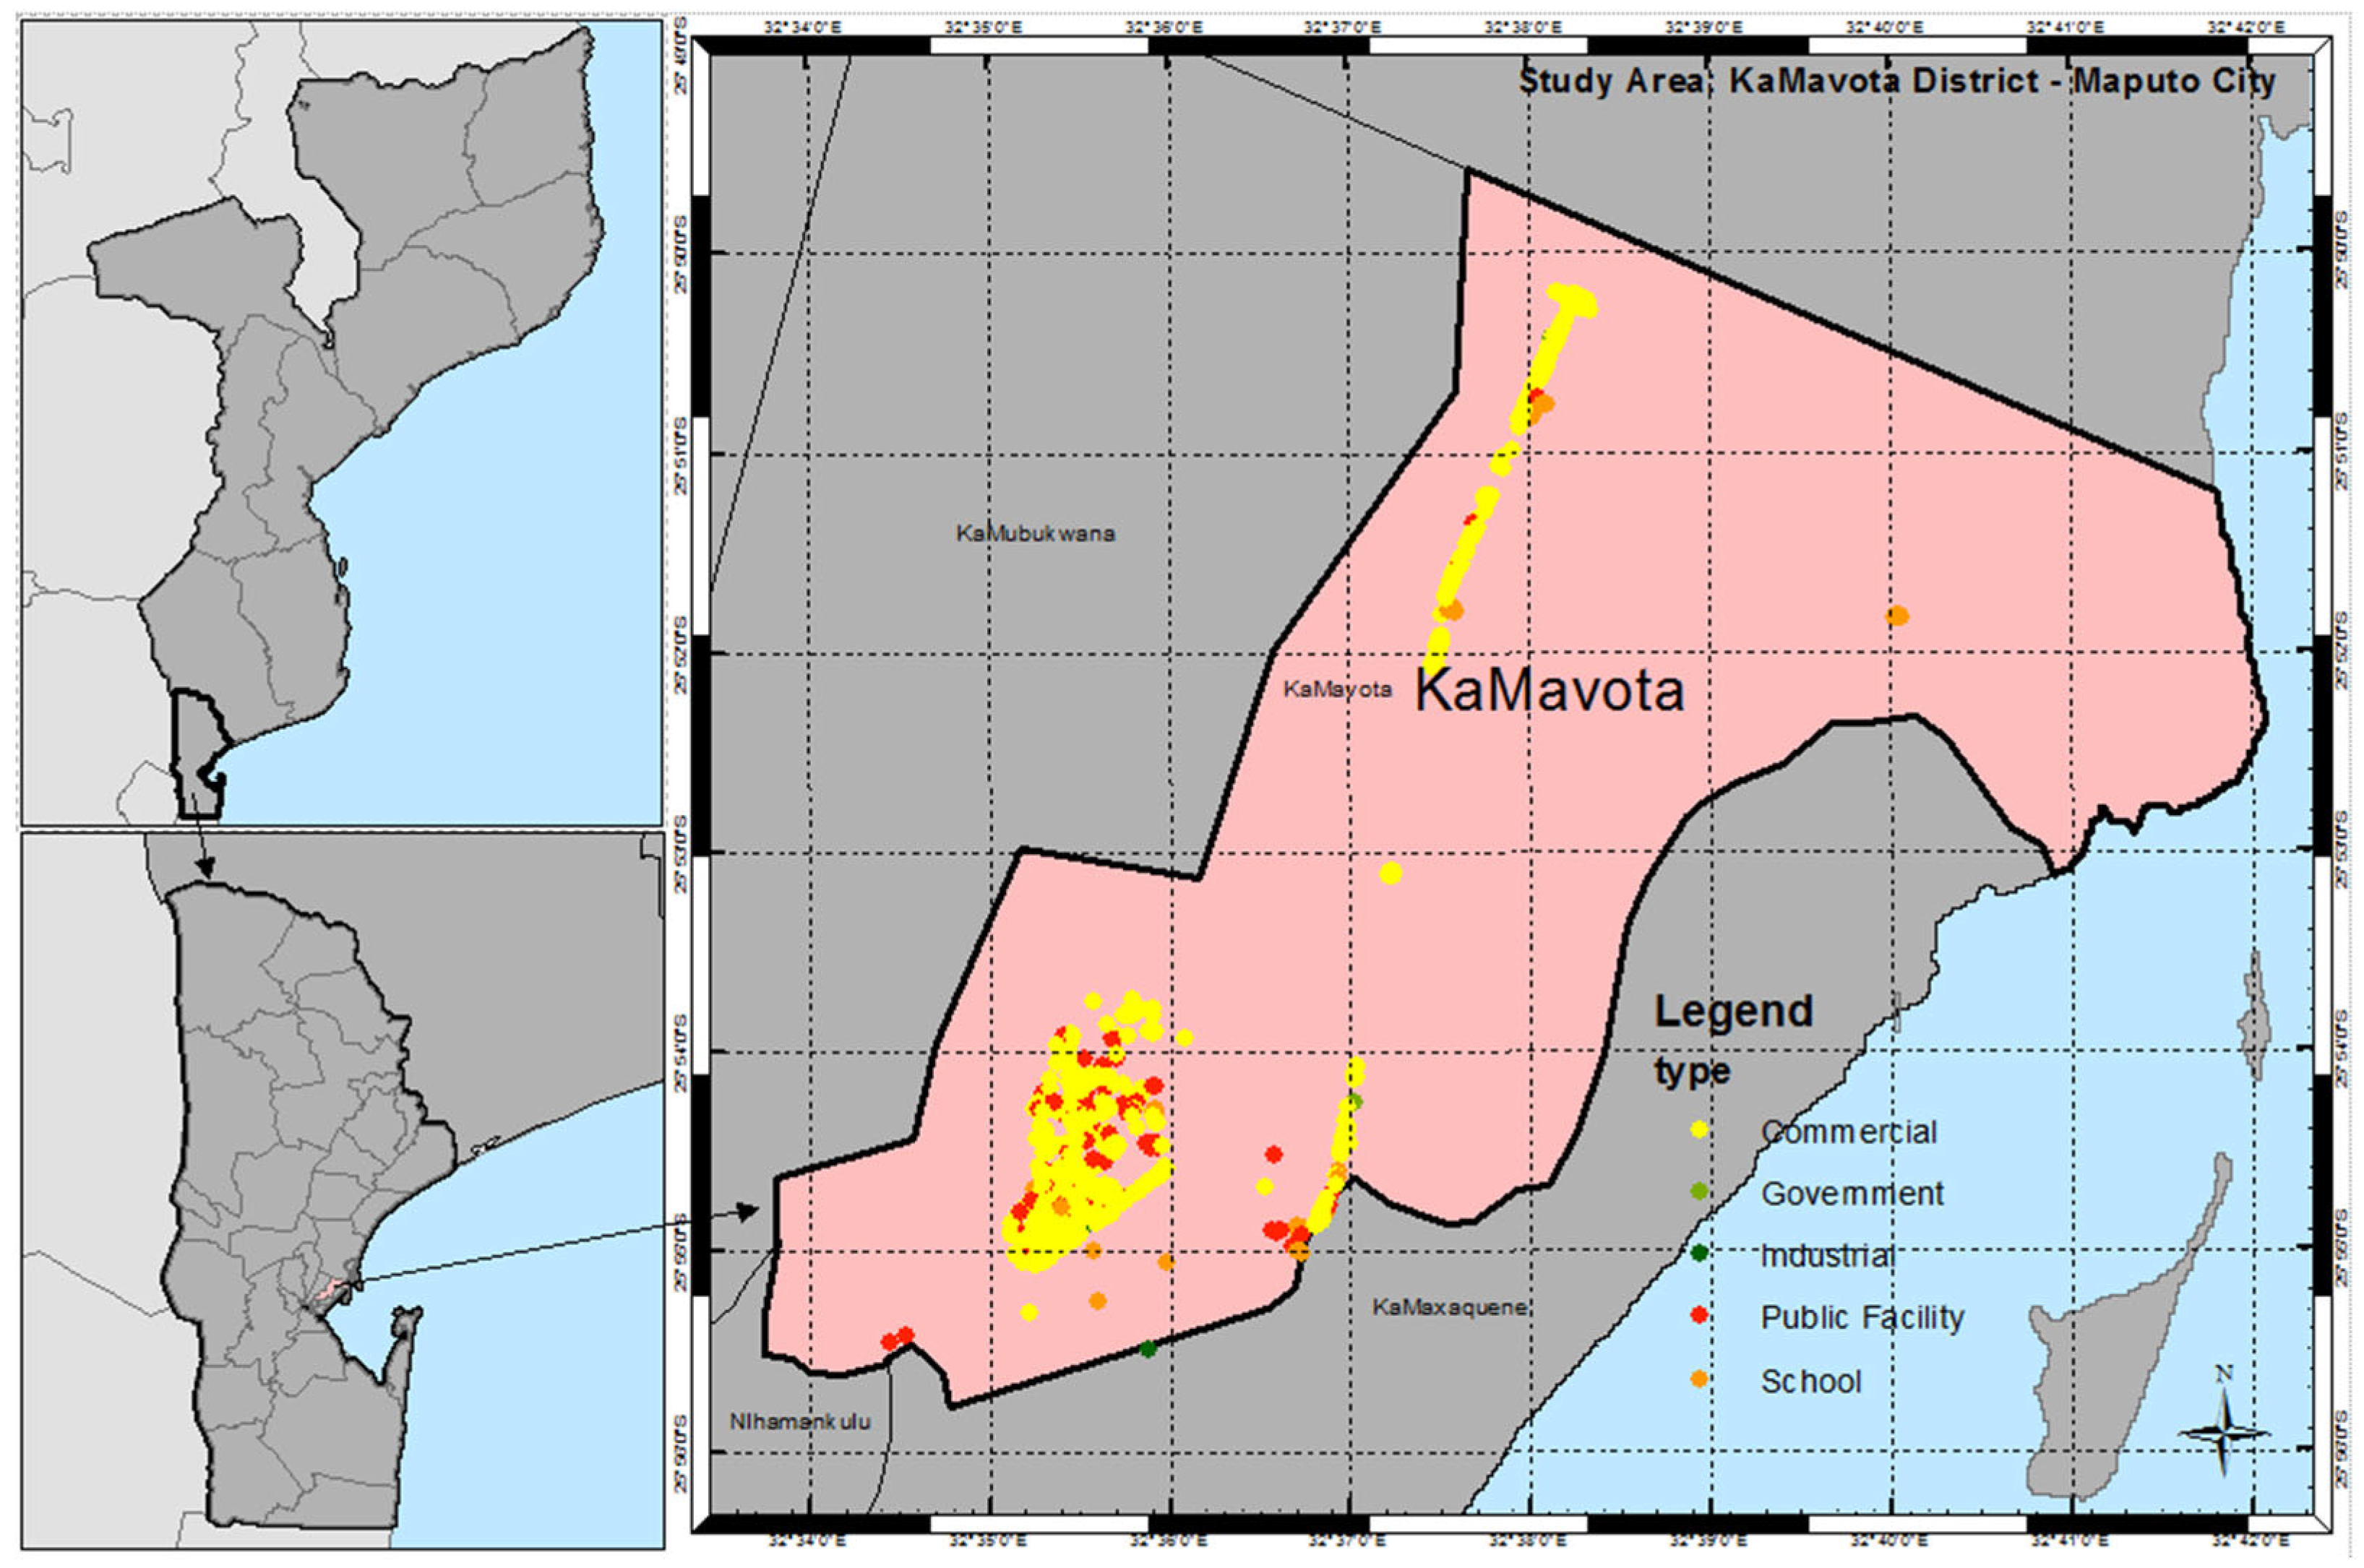
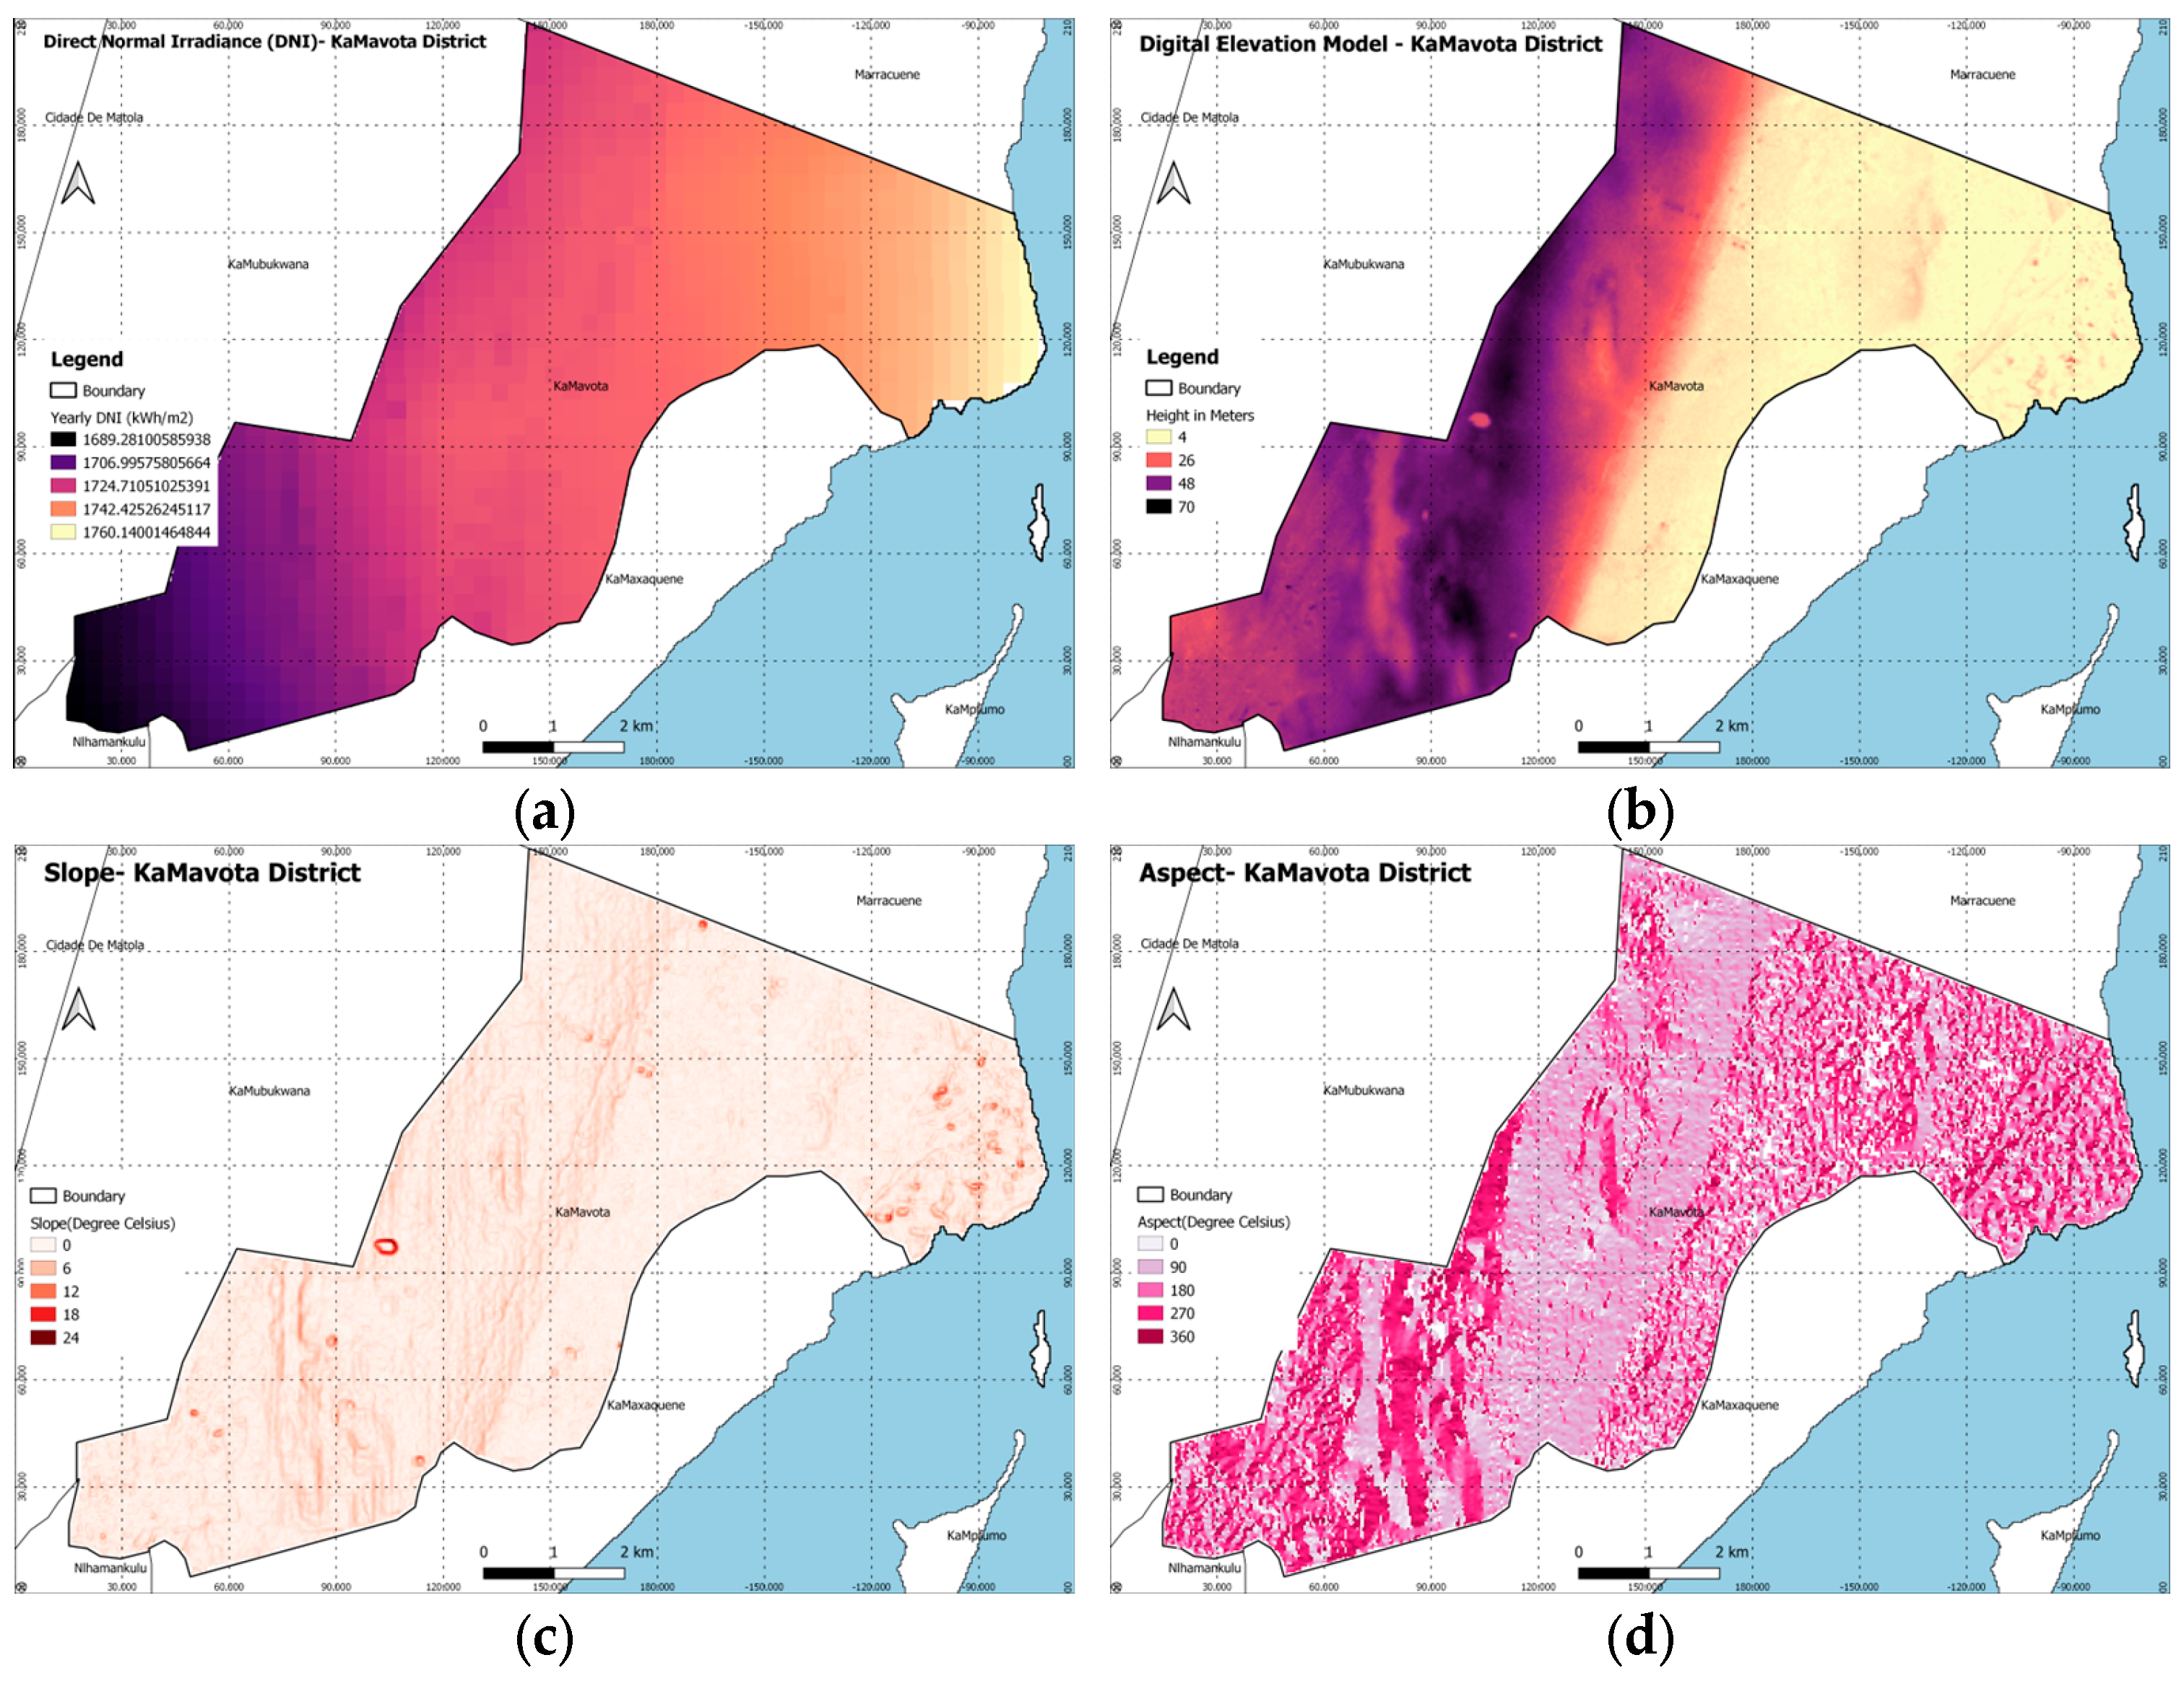
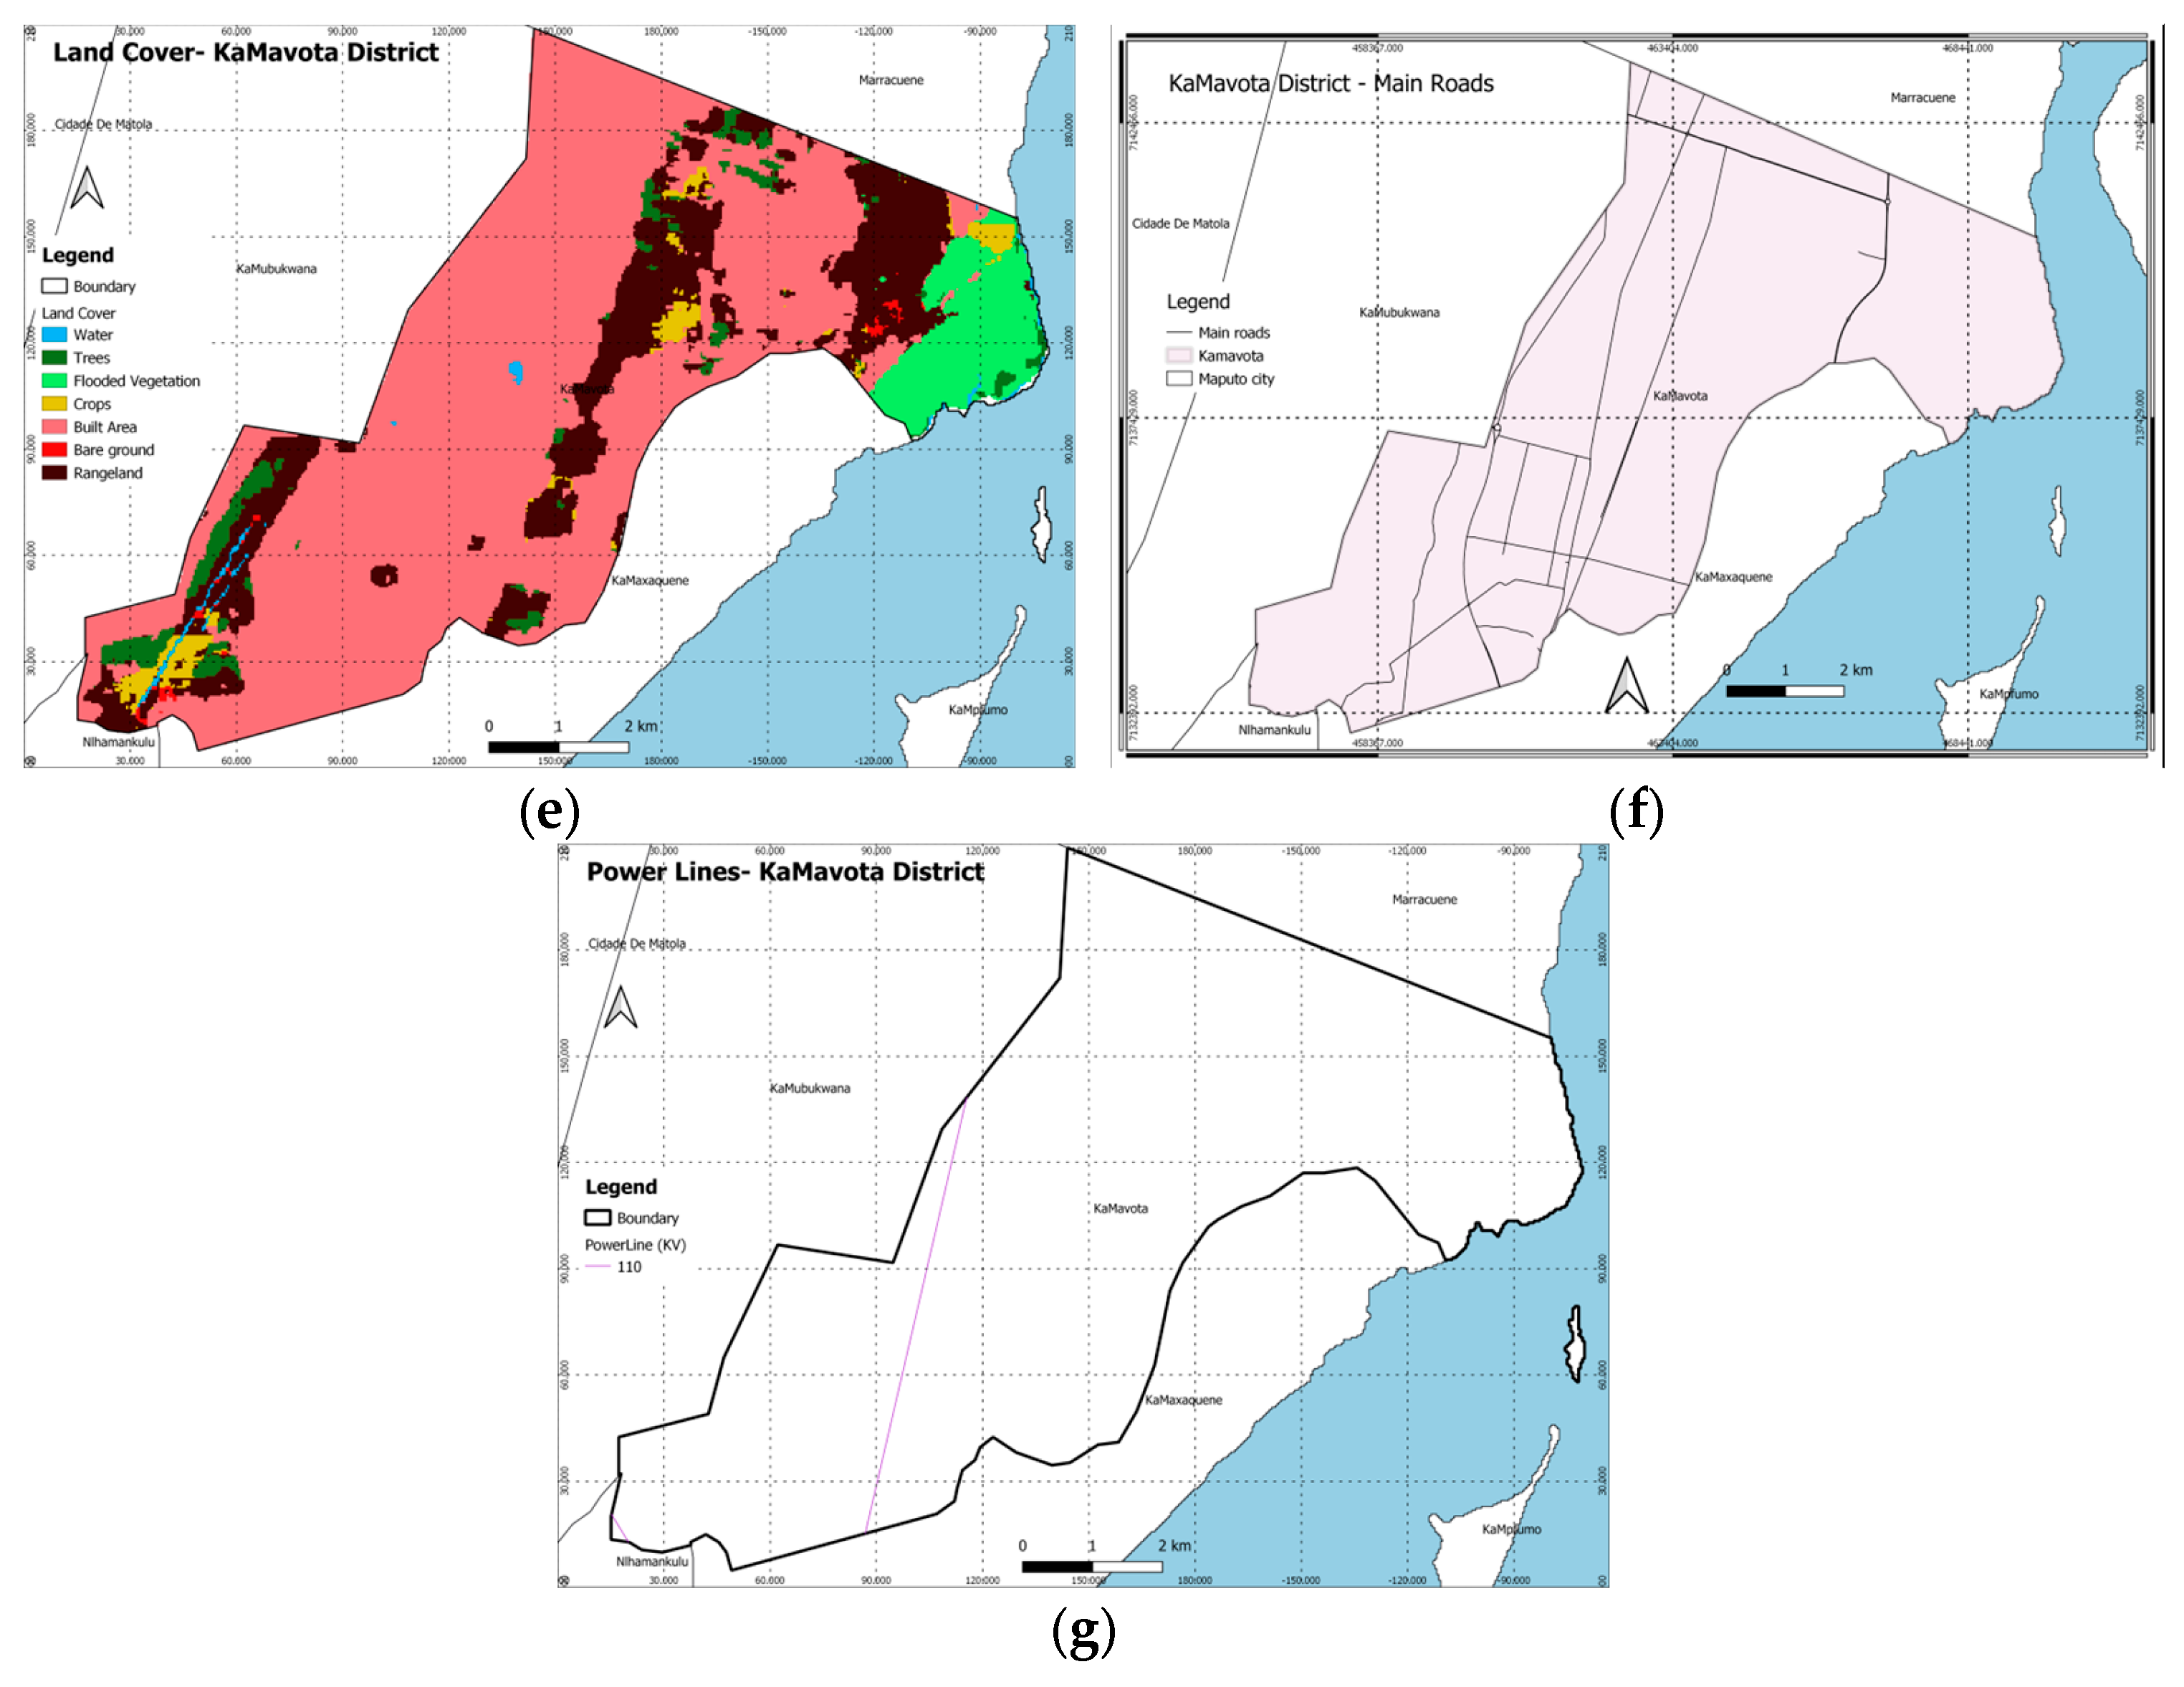
3.1. Study Area and Data Preparation
- Digital Elevation Models (DEMs): Detailed elevation data of the Earth’s surface at a resolution of about 30 m.
- Slope and Aspect Maps: Information on the steepness (slope) and orientation (aspect) of the land, extracted from the DEM data as shown in Figure 2c,d.
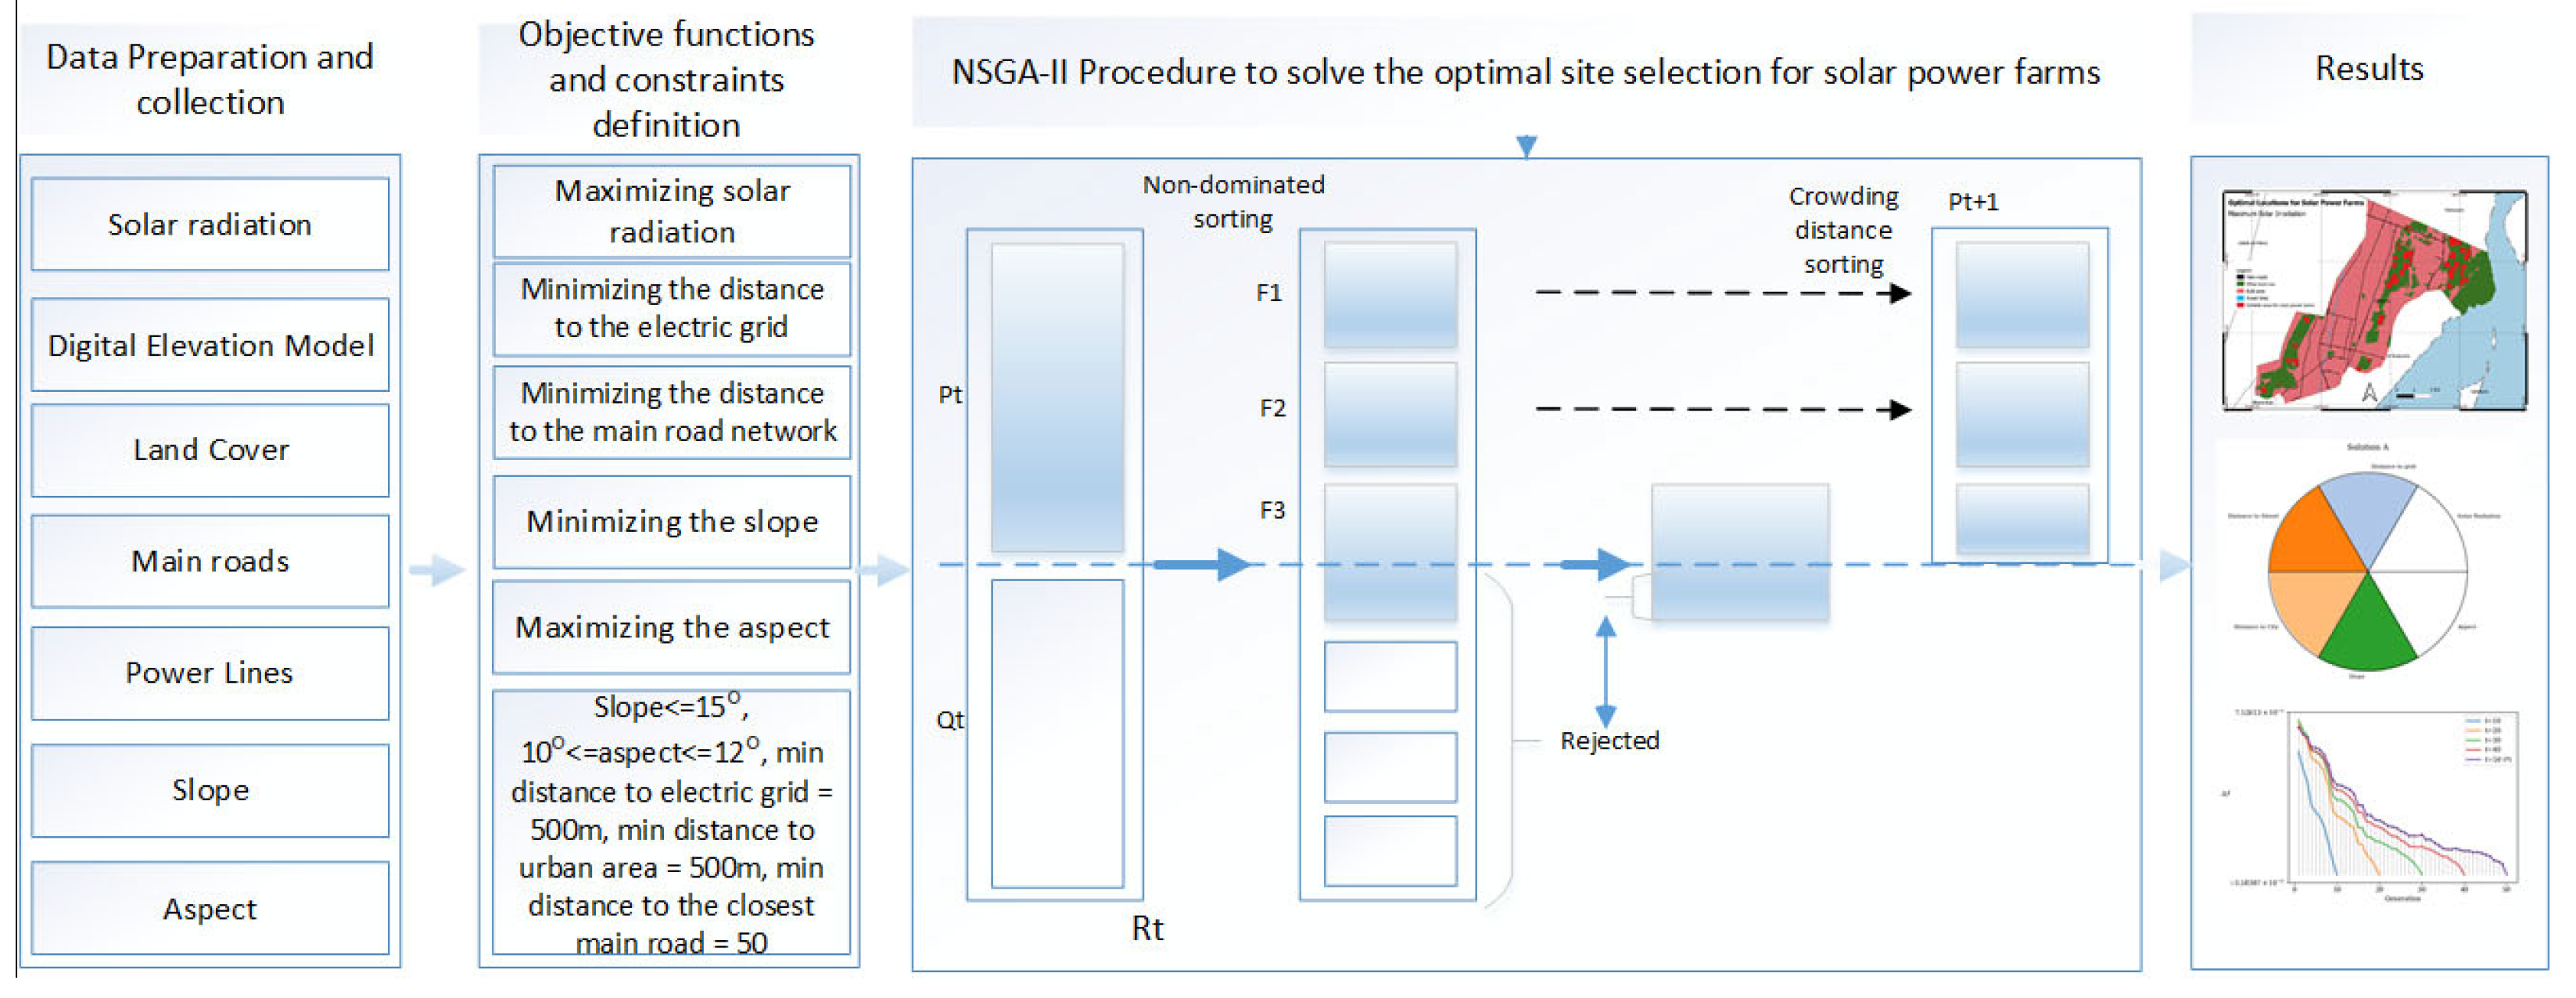
3.2. Methodology
3.2.1. Multi-Objective Optimization Model
- Maximizing the solar radiation
- 2.
- Minimizing the distance to the electric grid
- 3.
- Minimizing the distance to road network
- 4.
- Minimizing distance to the urban area
- 5.
- Minimizing the slope
- 6.
- Maximizing the aspect
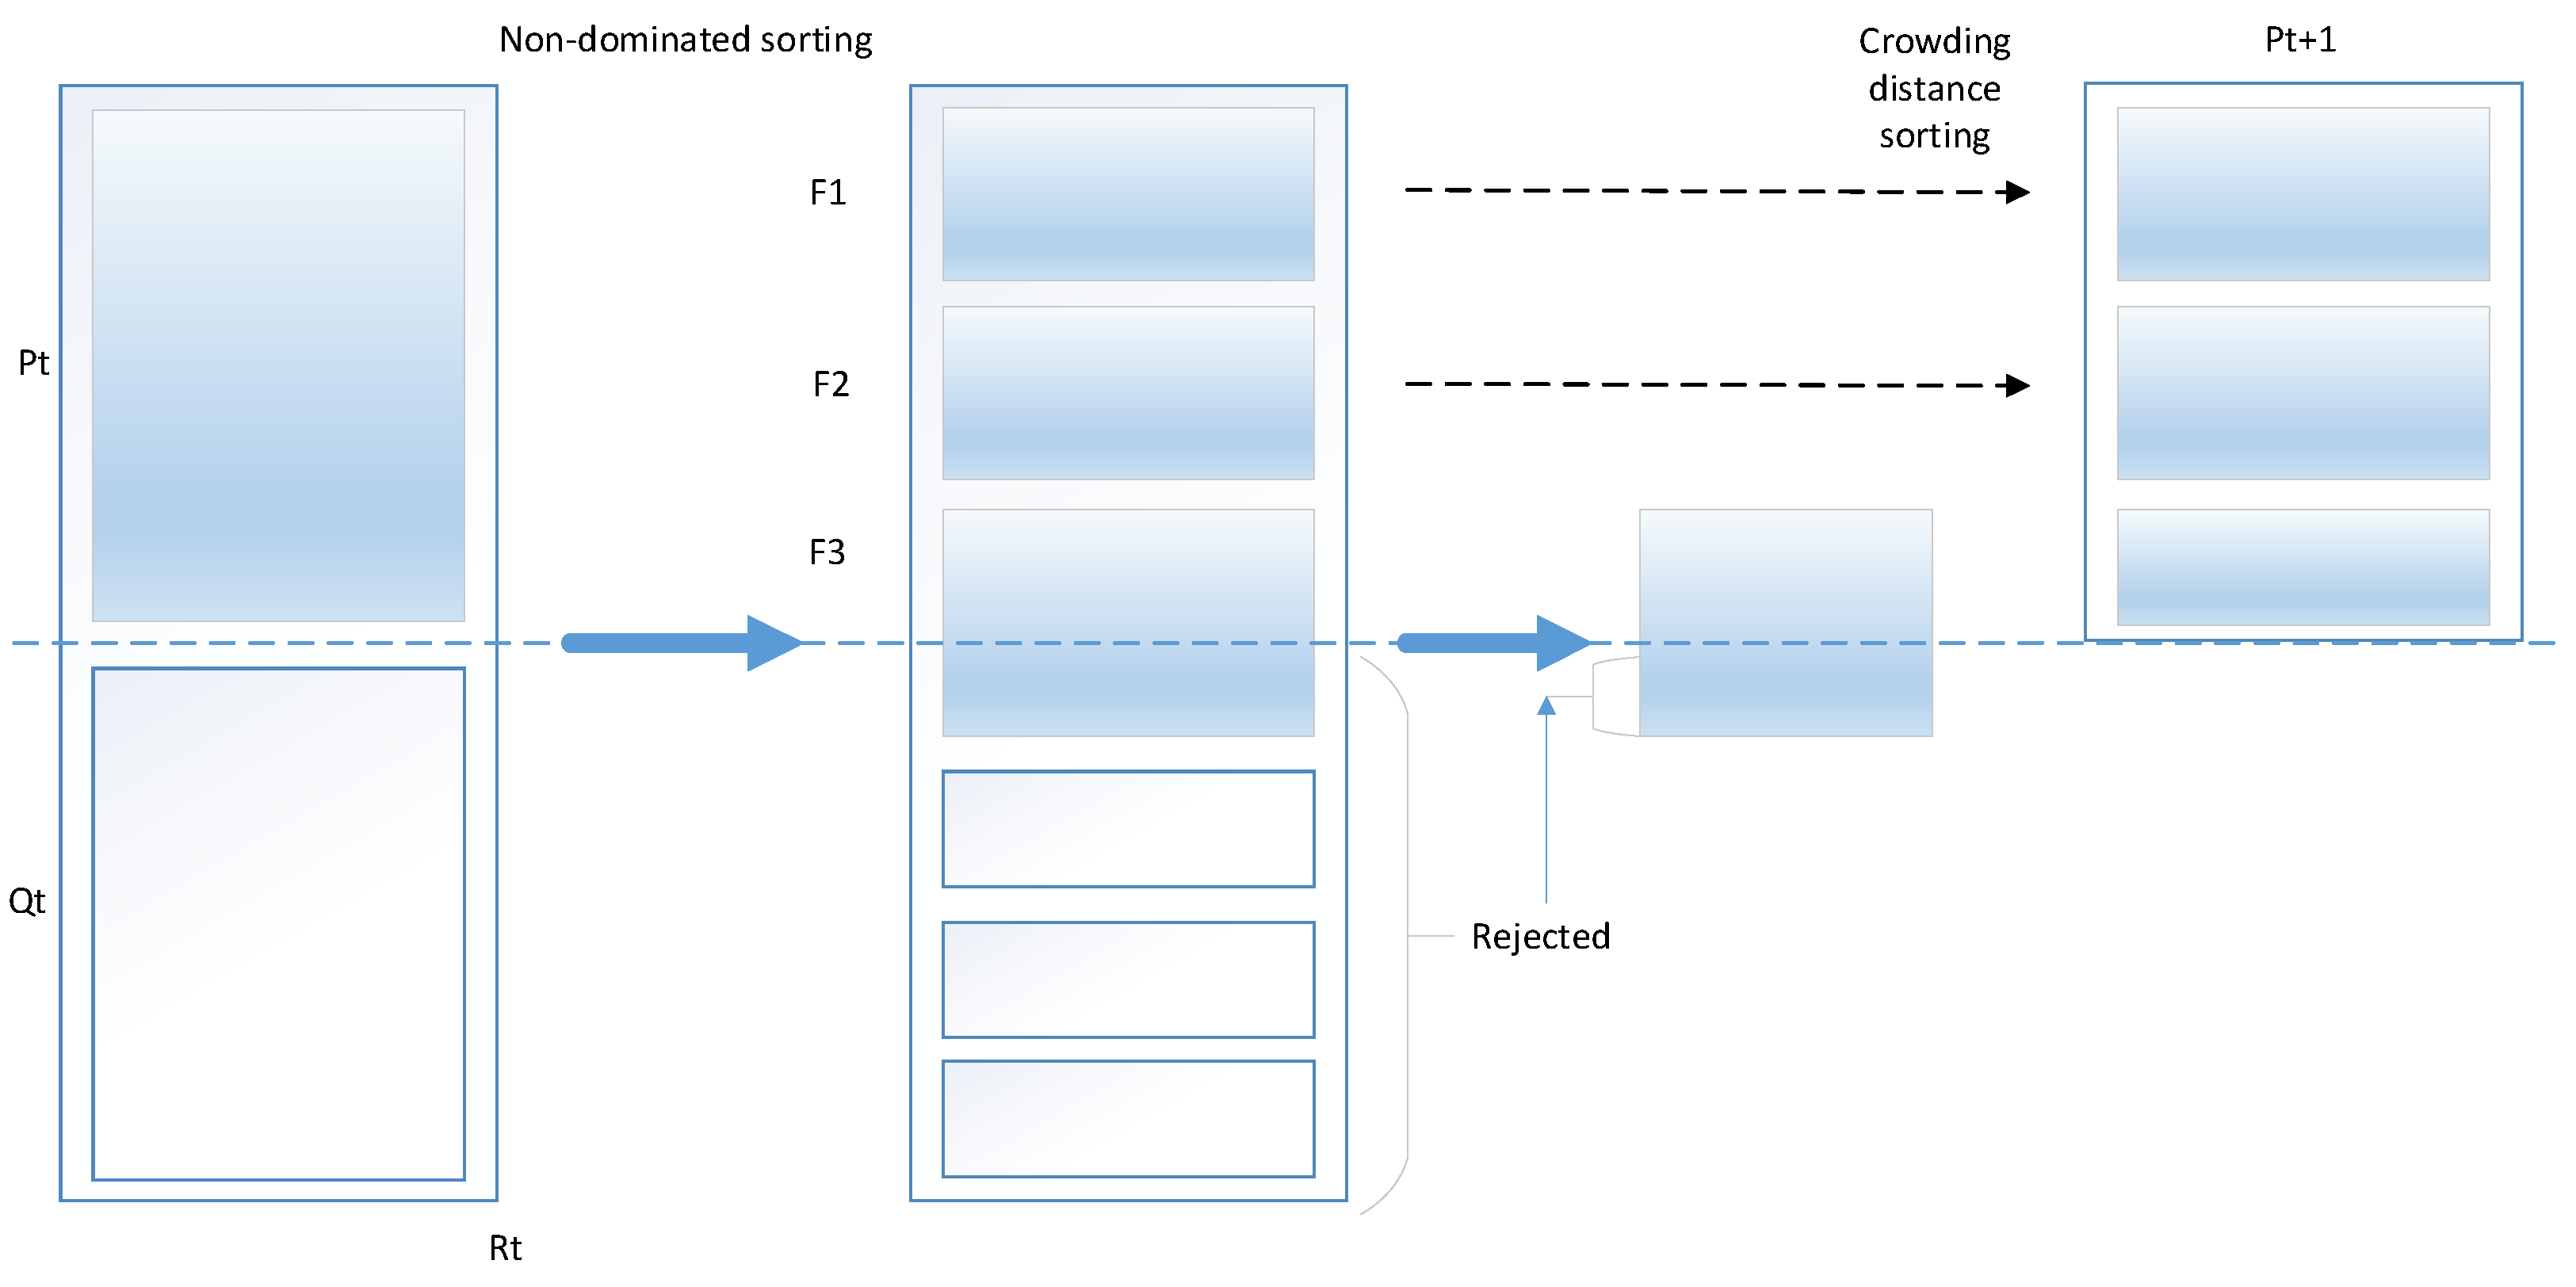
3.2.2. NSGA-II
4. Results
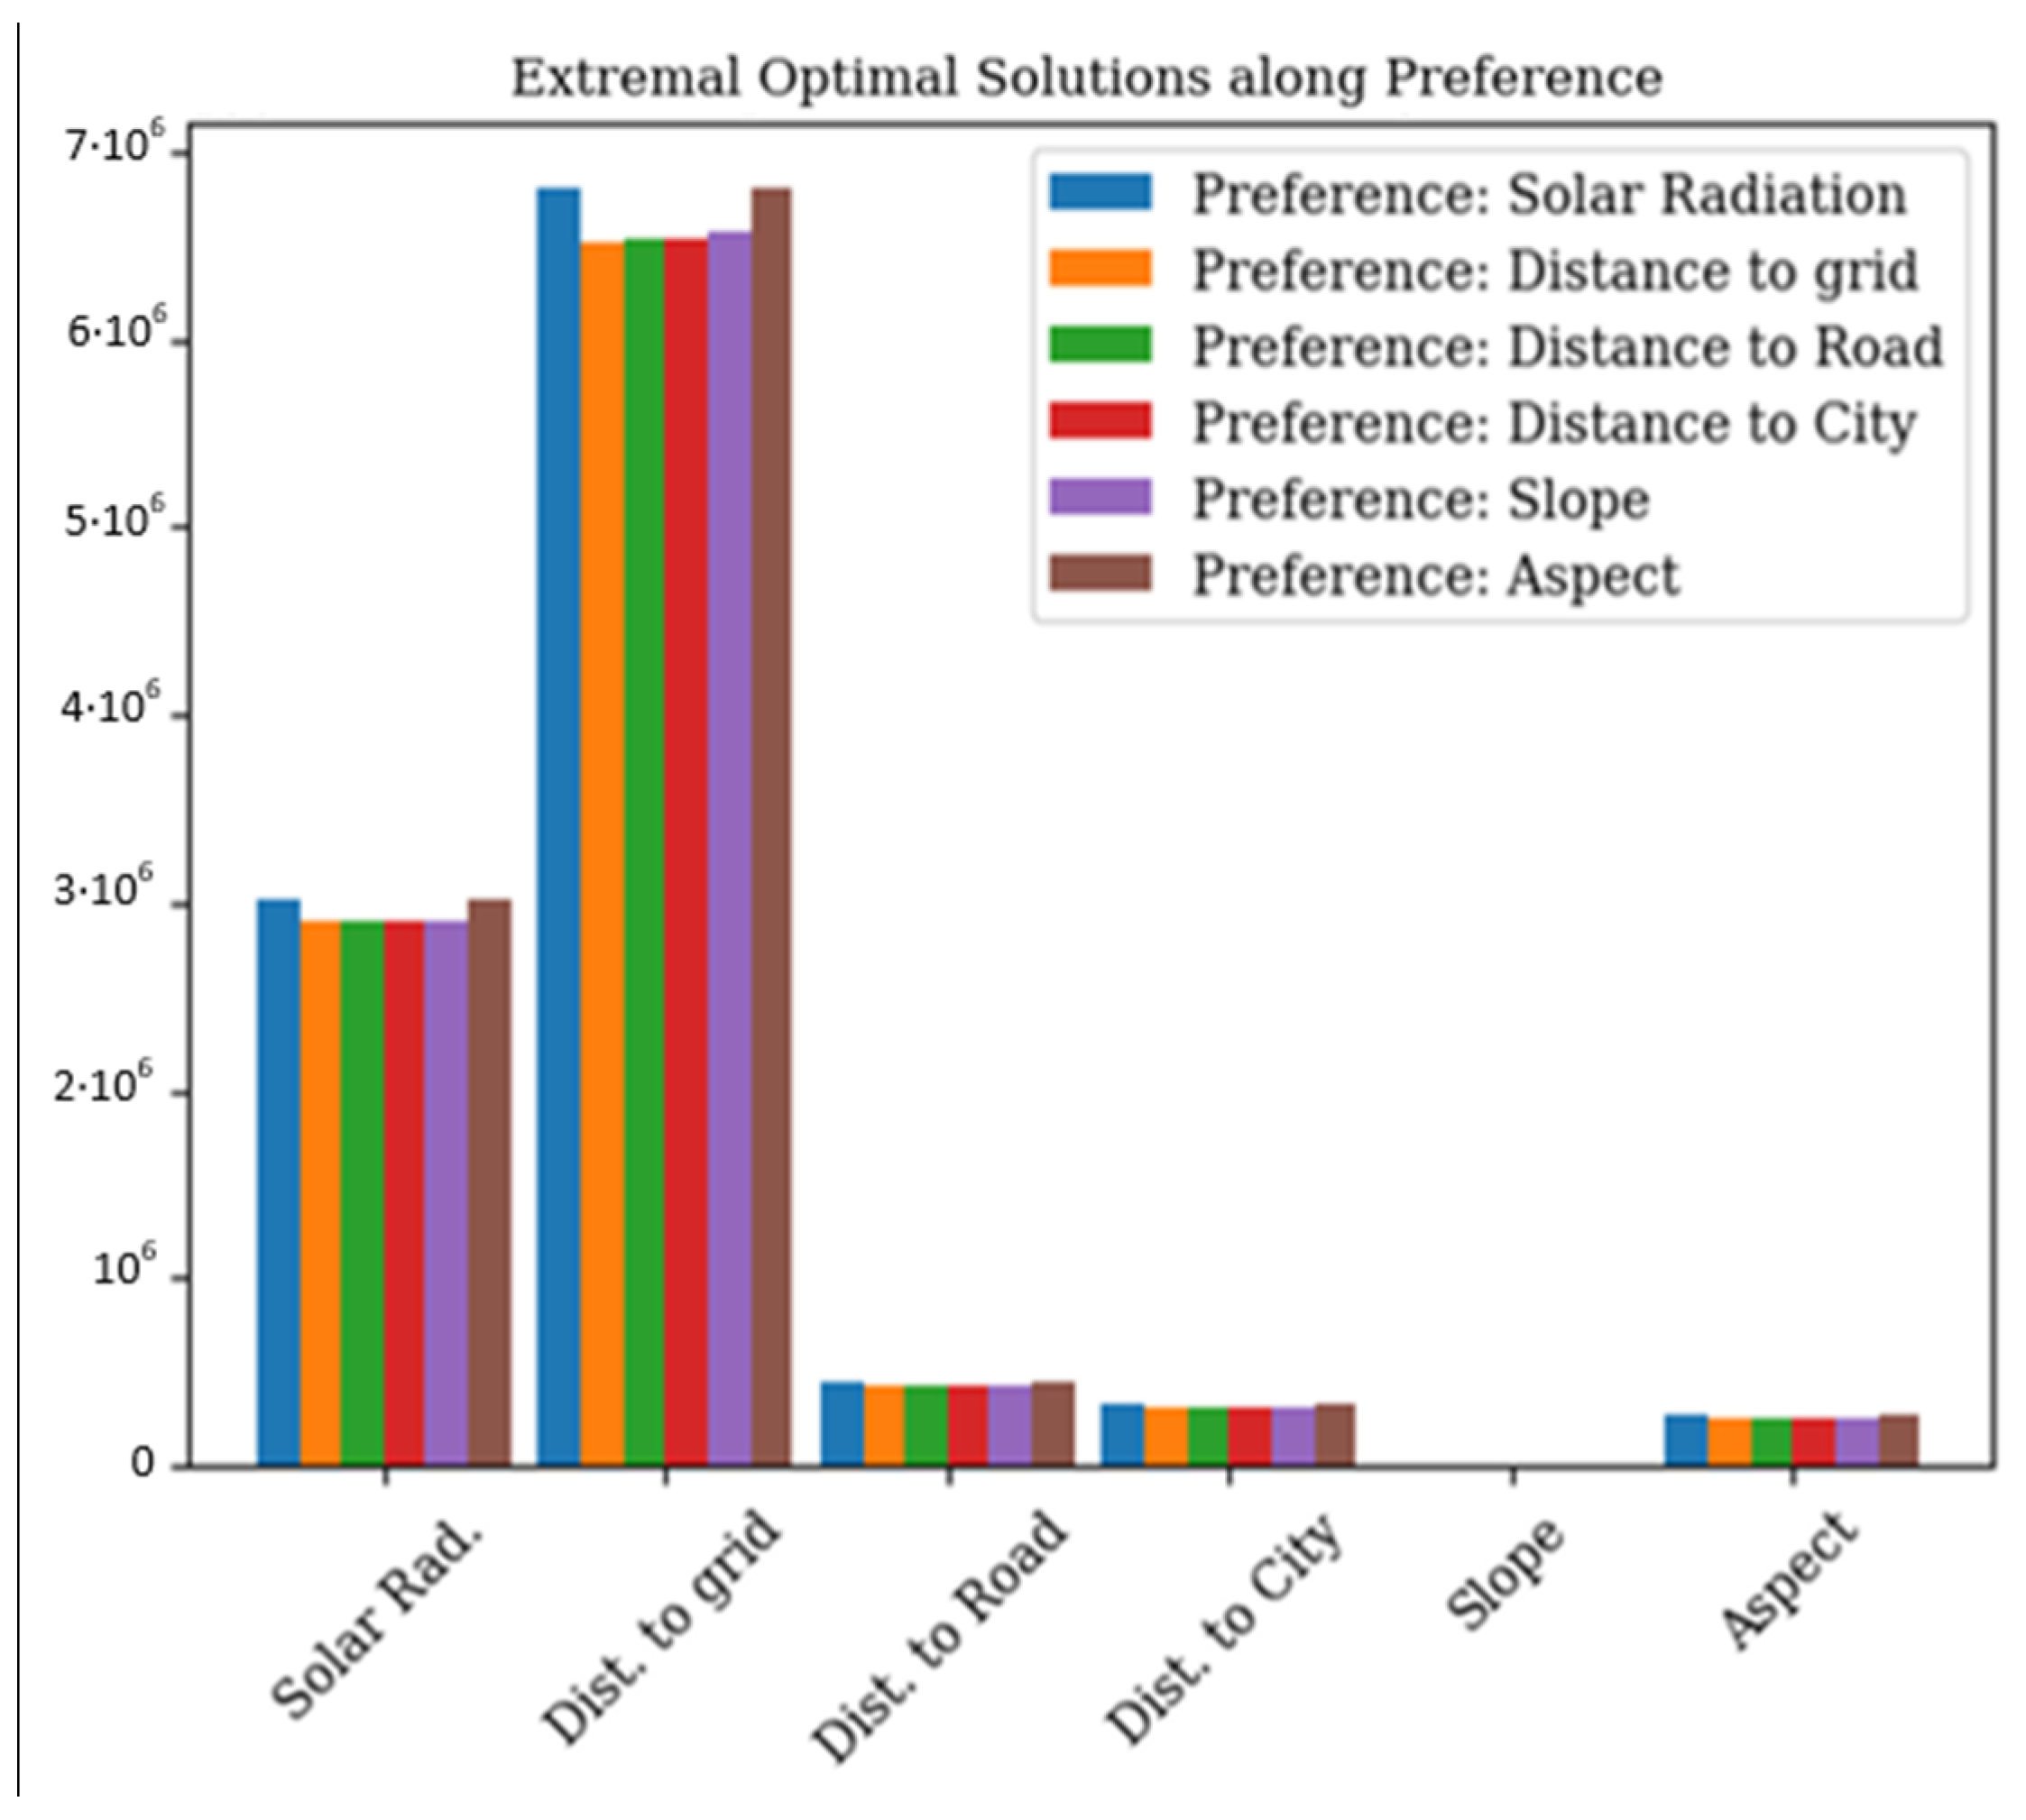
4.1. Pareto Front Analysis
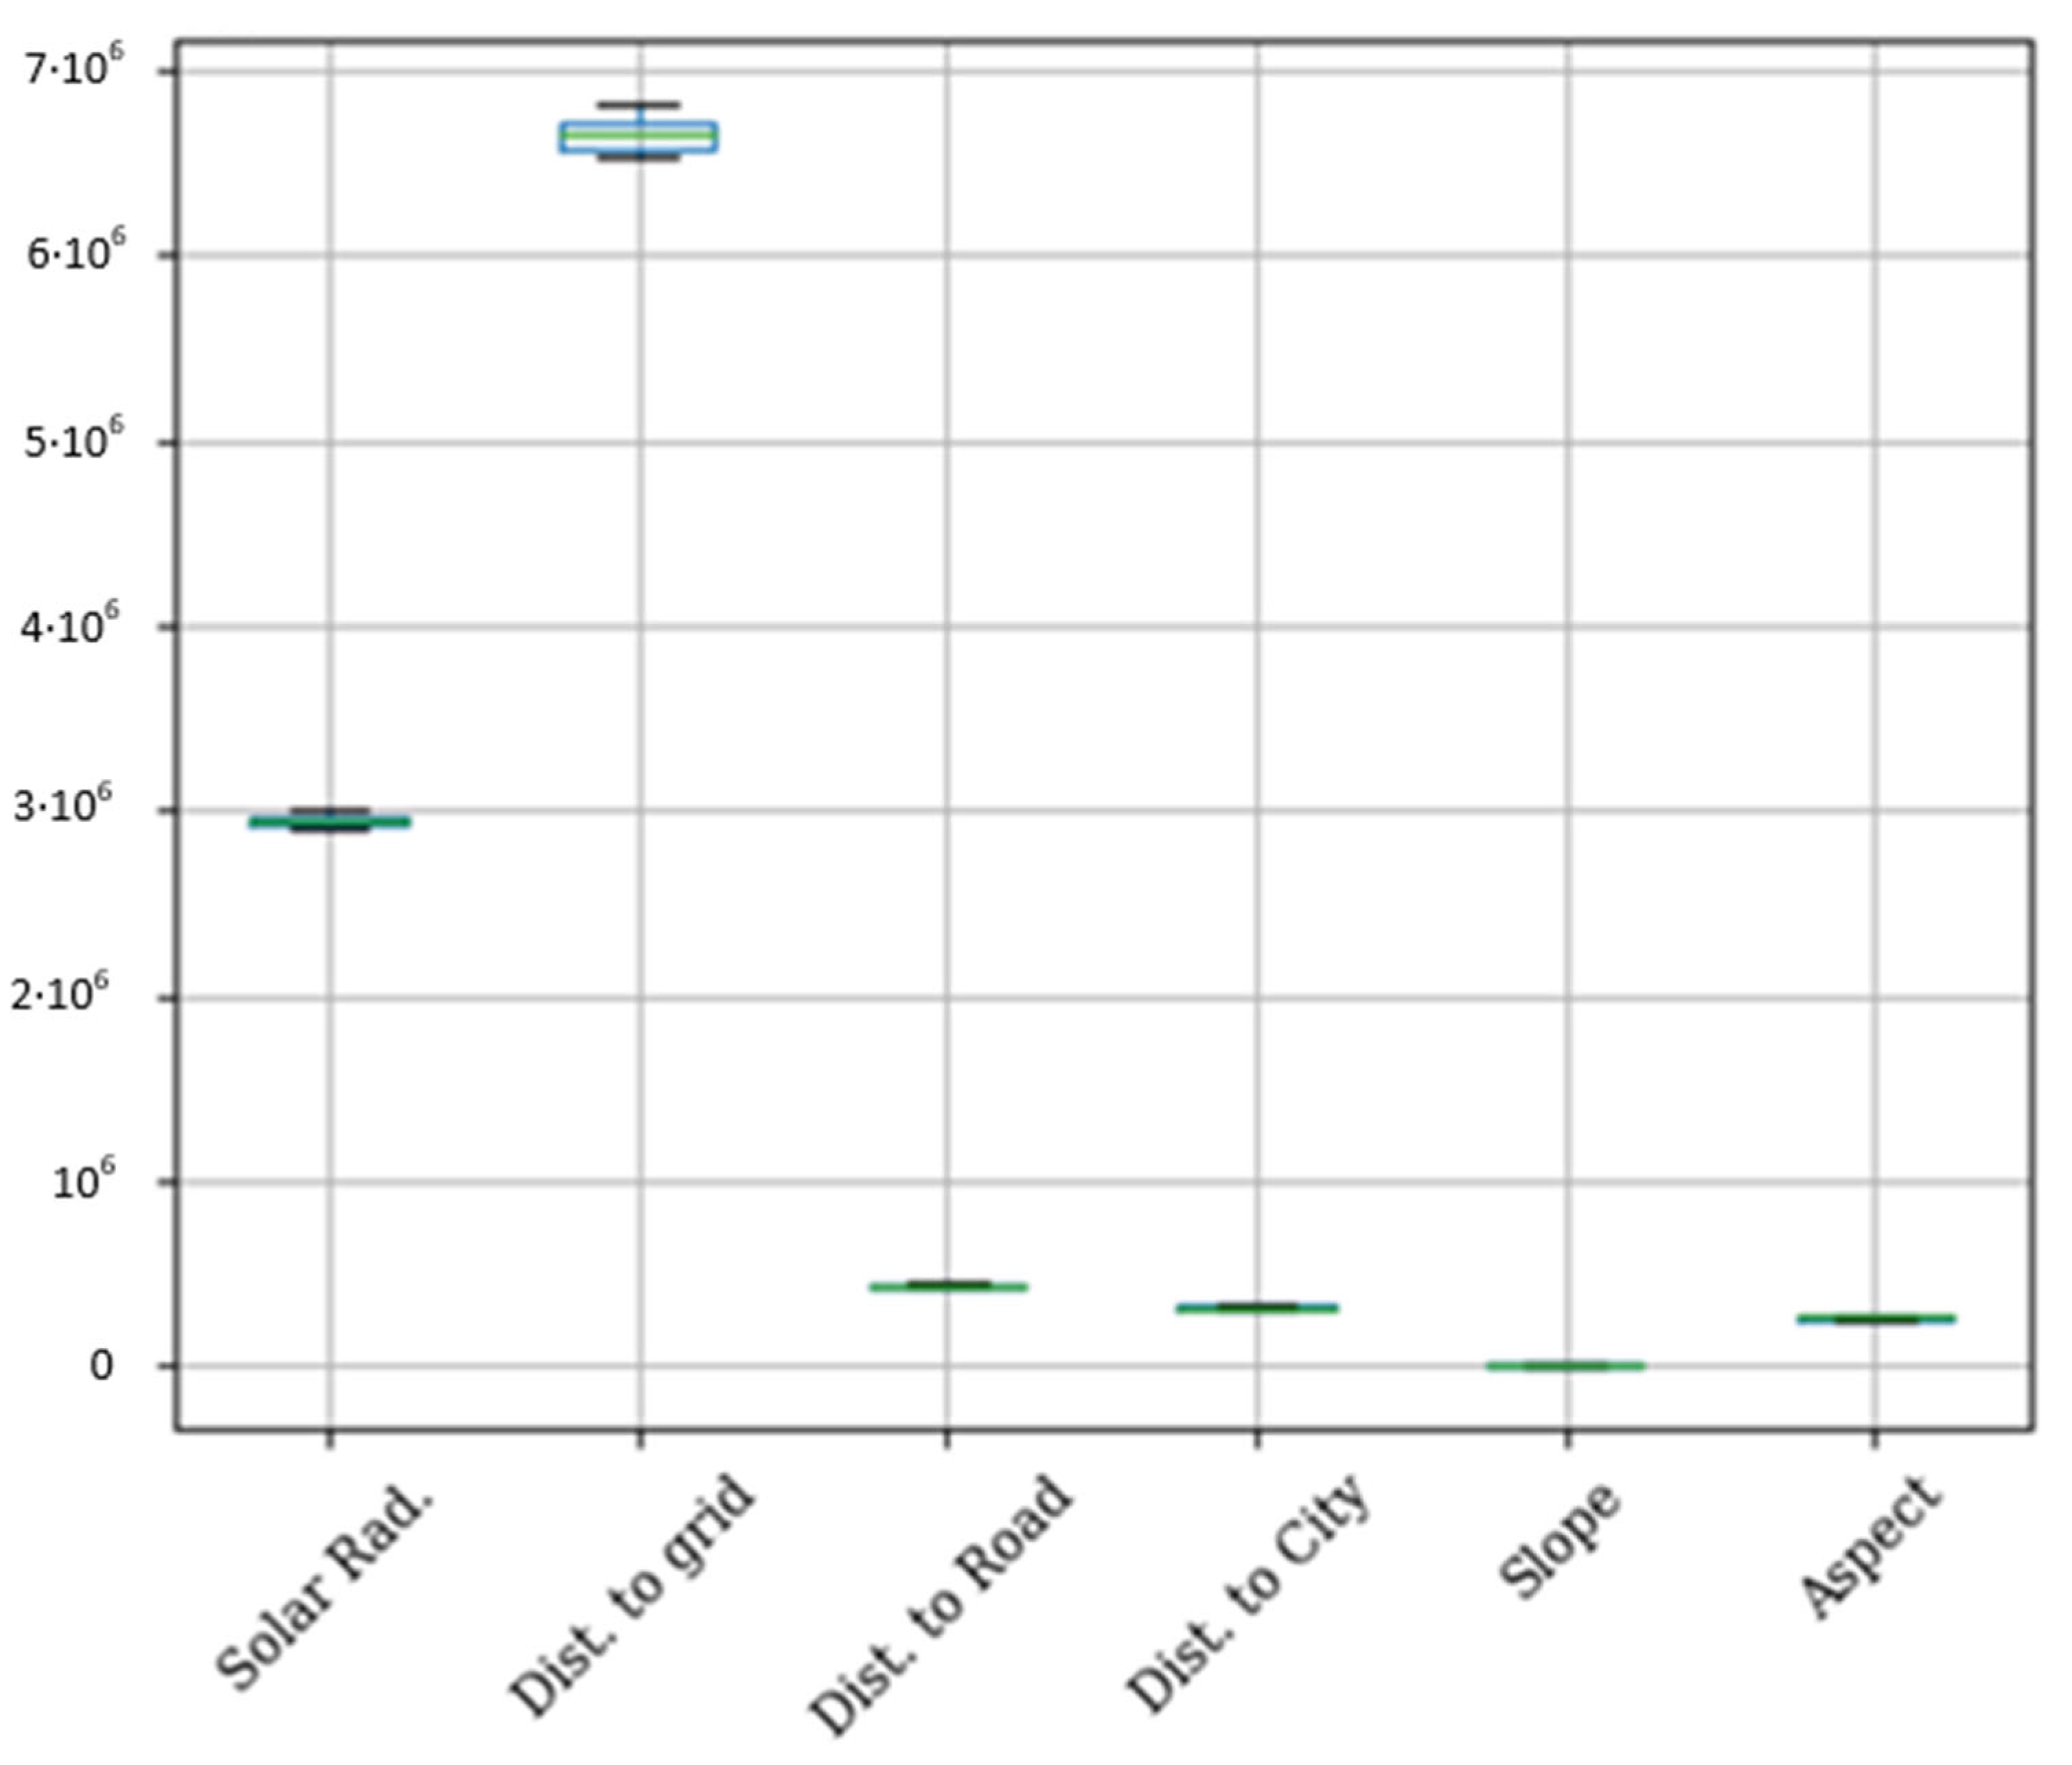
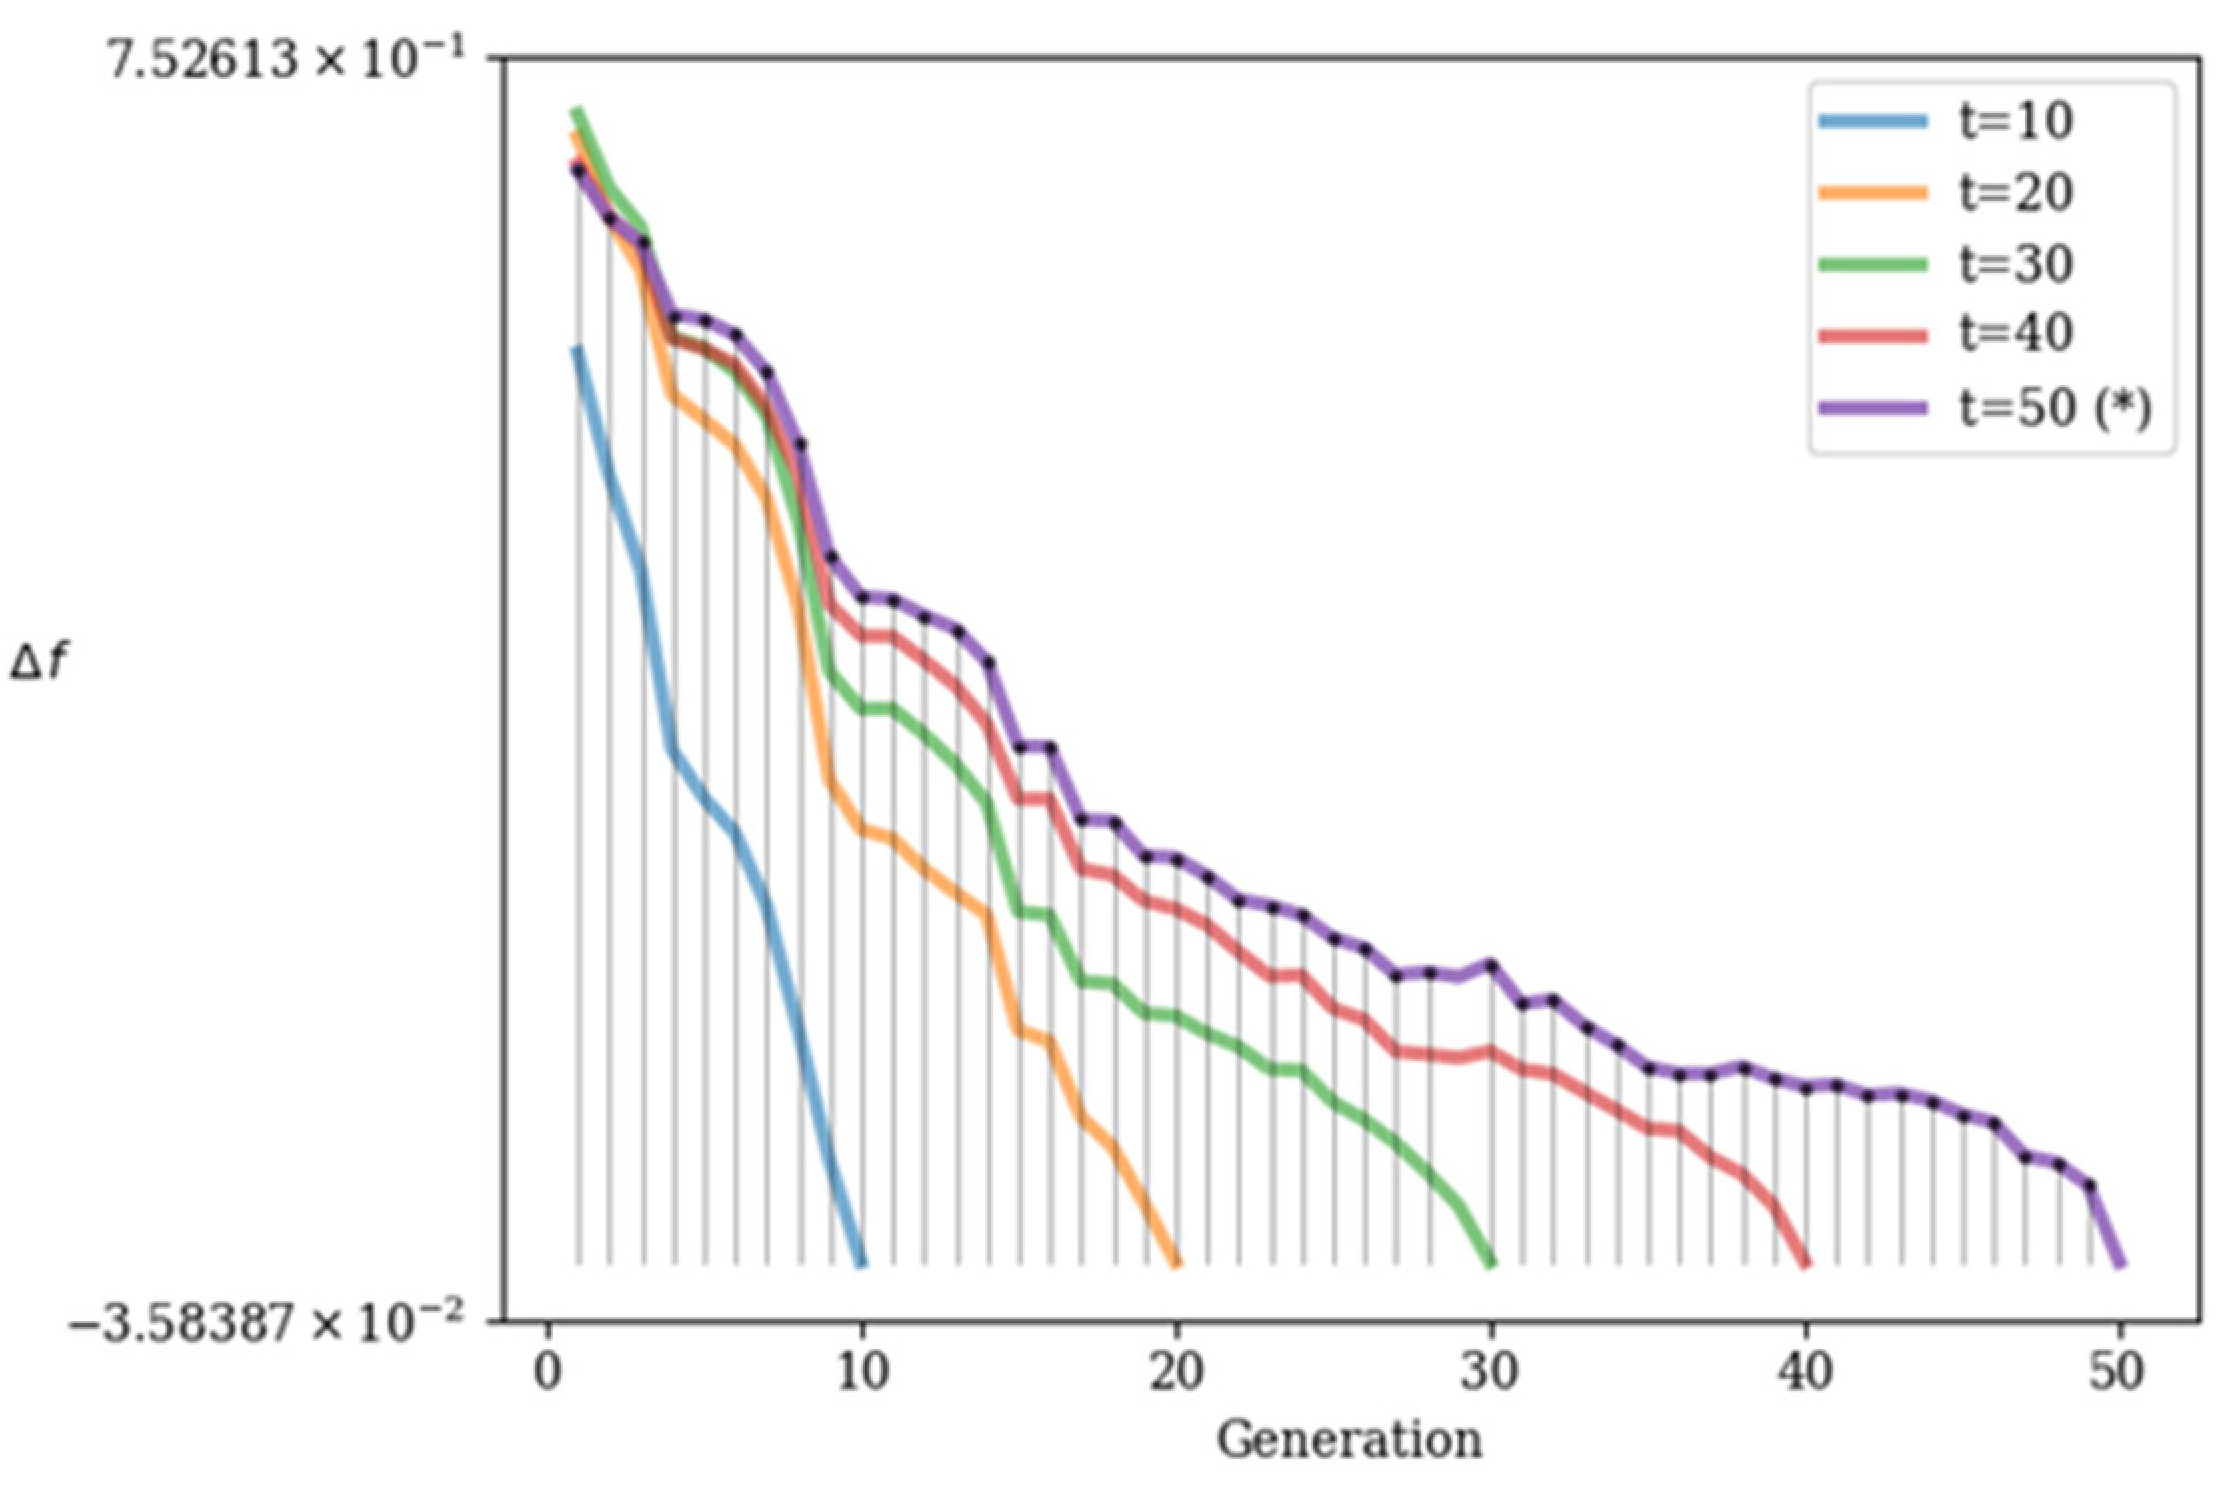
4.2. Variability Analysis
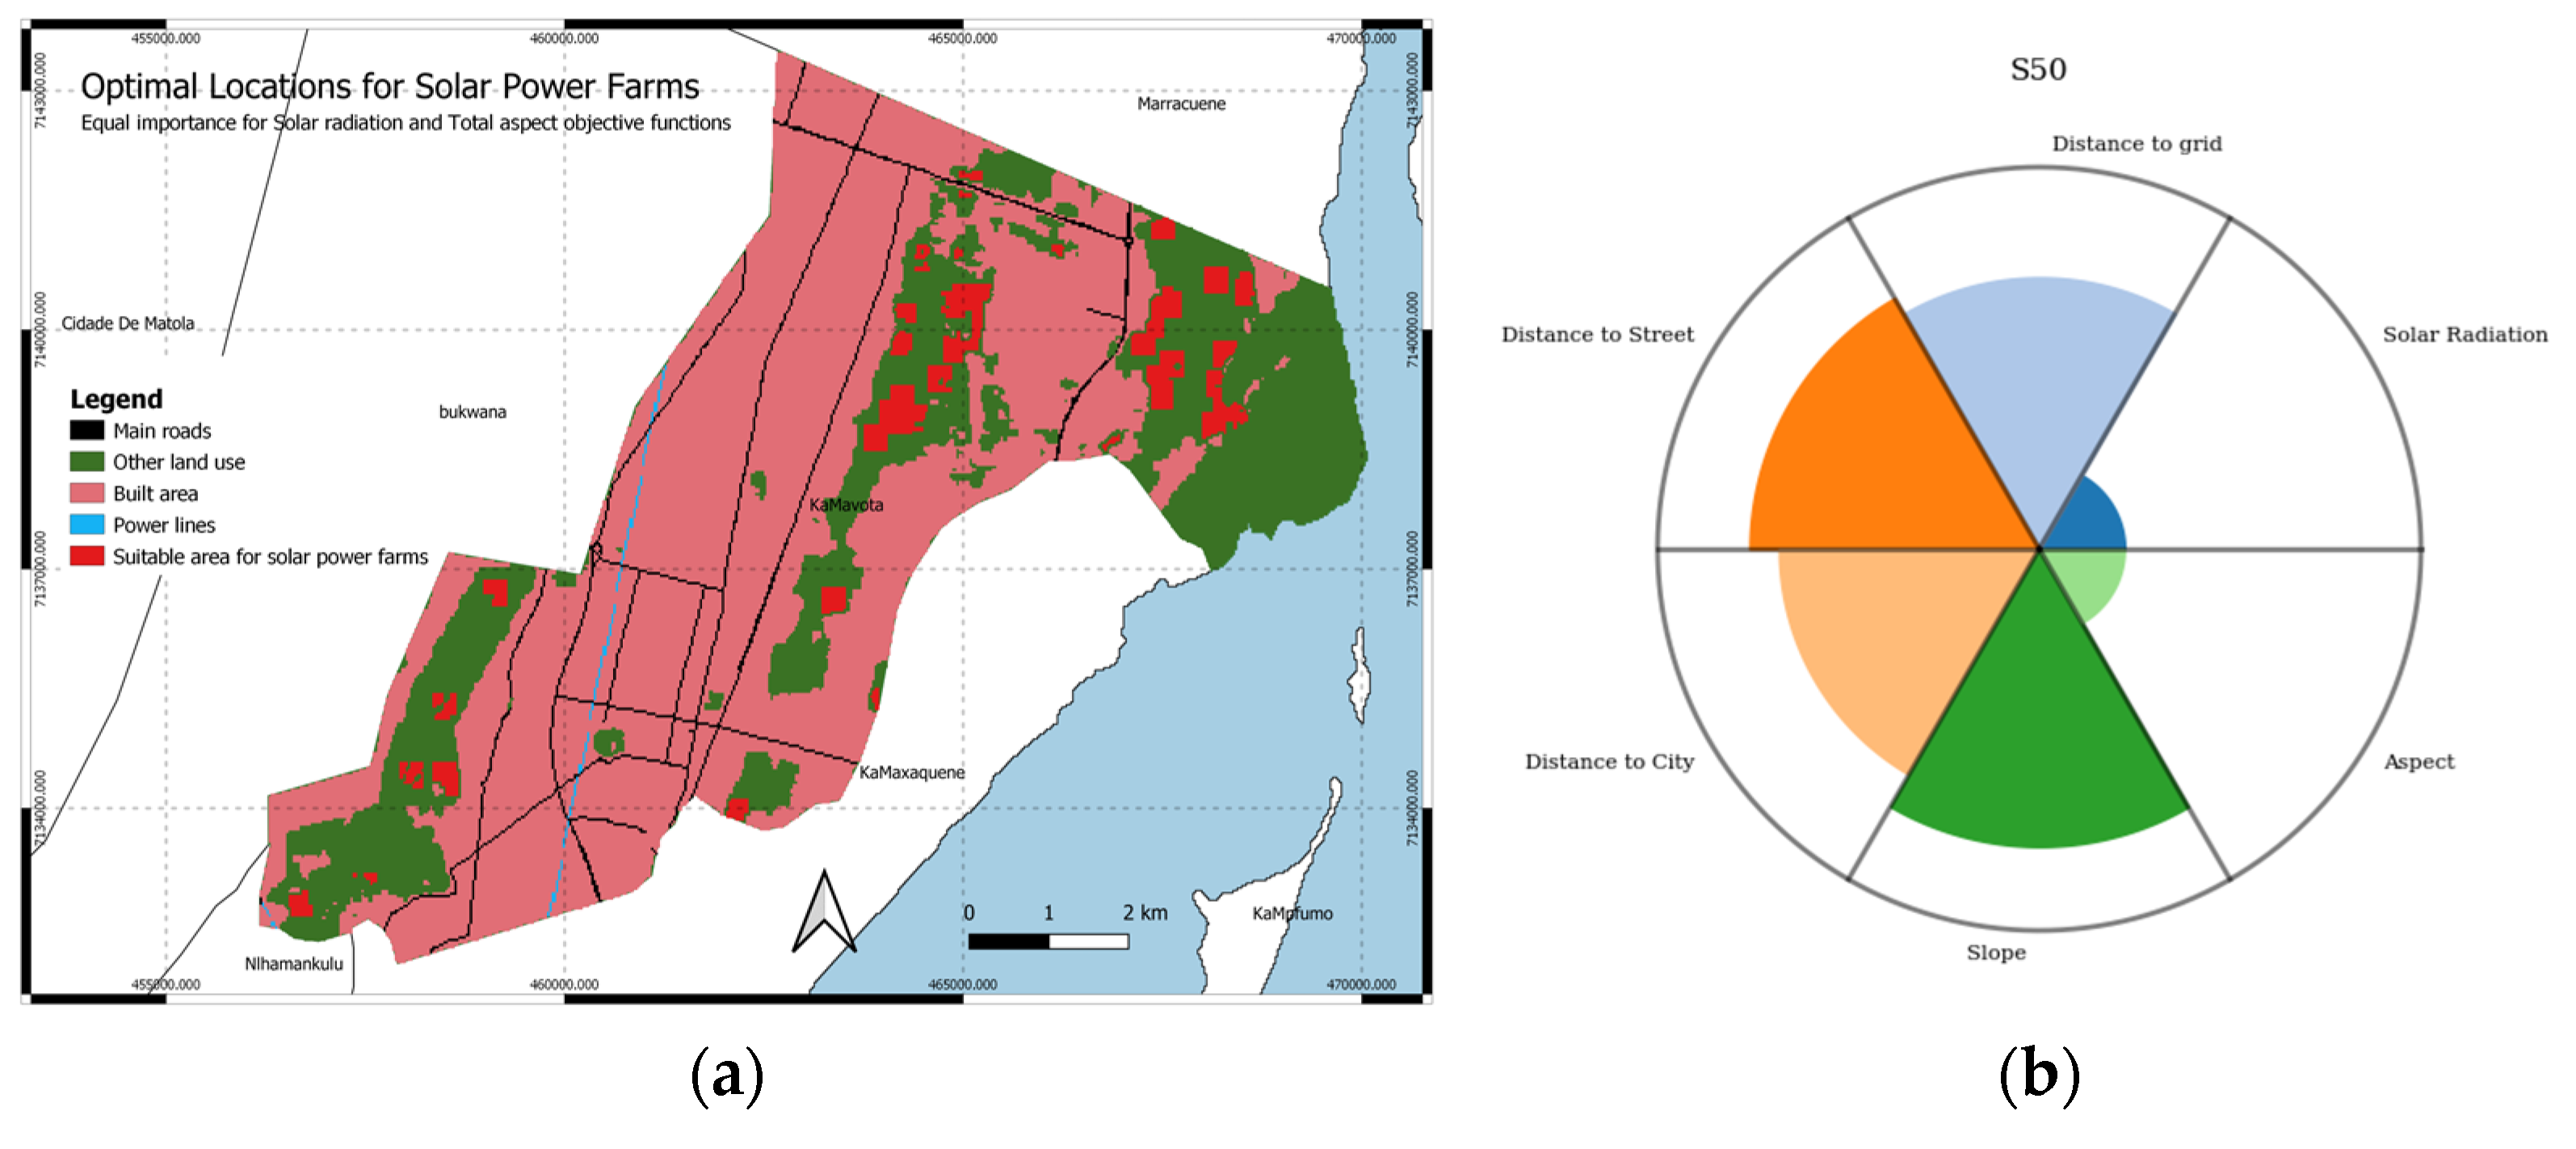
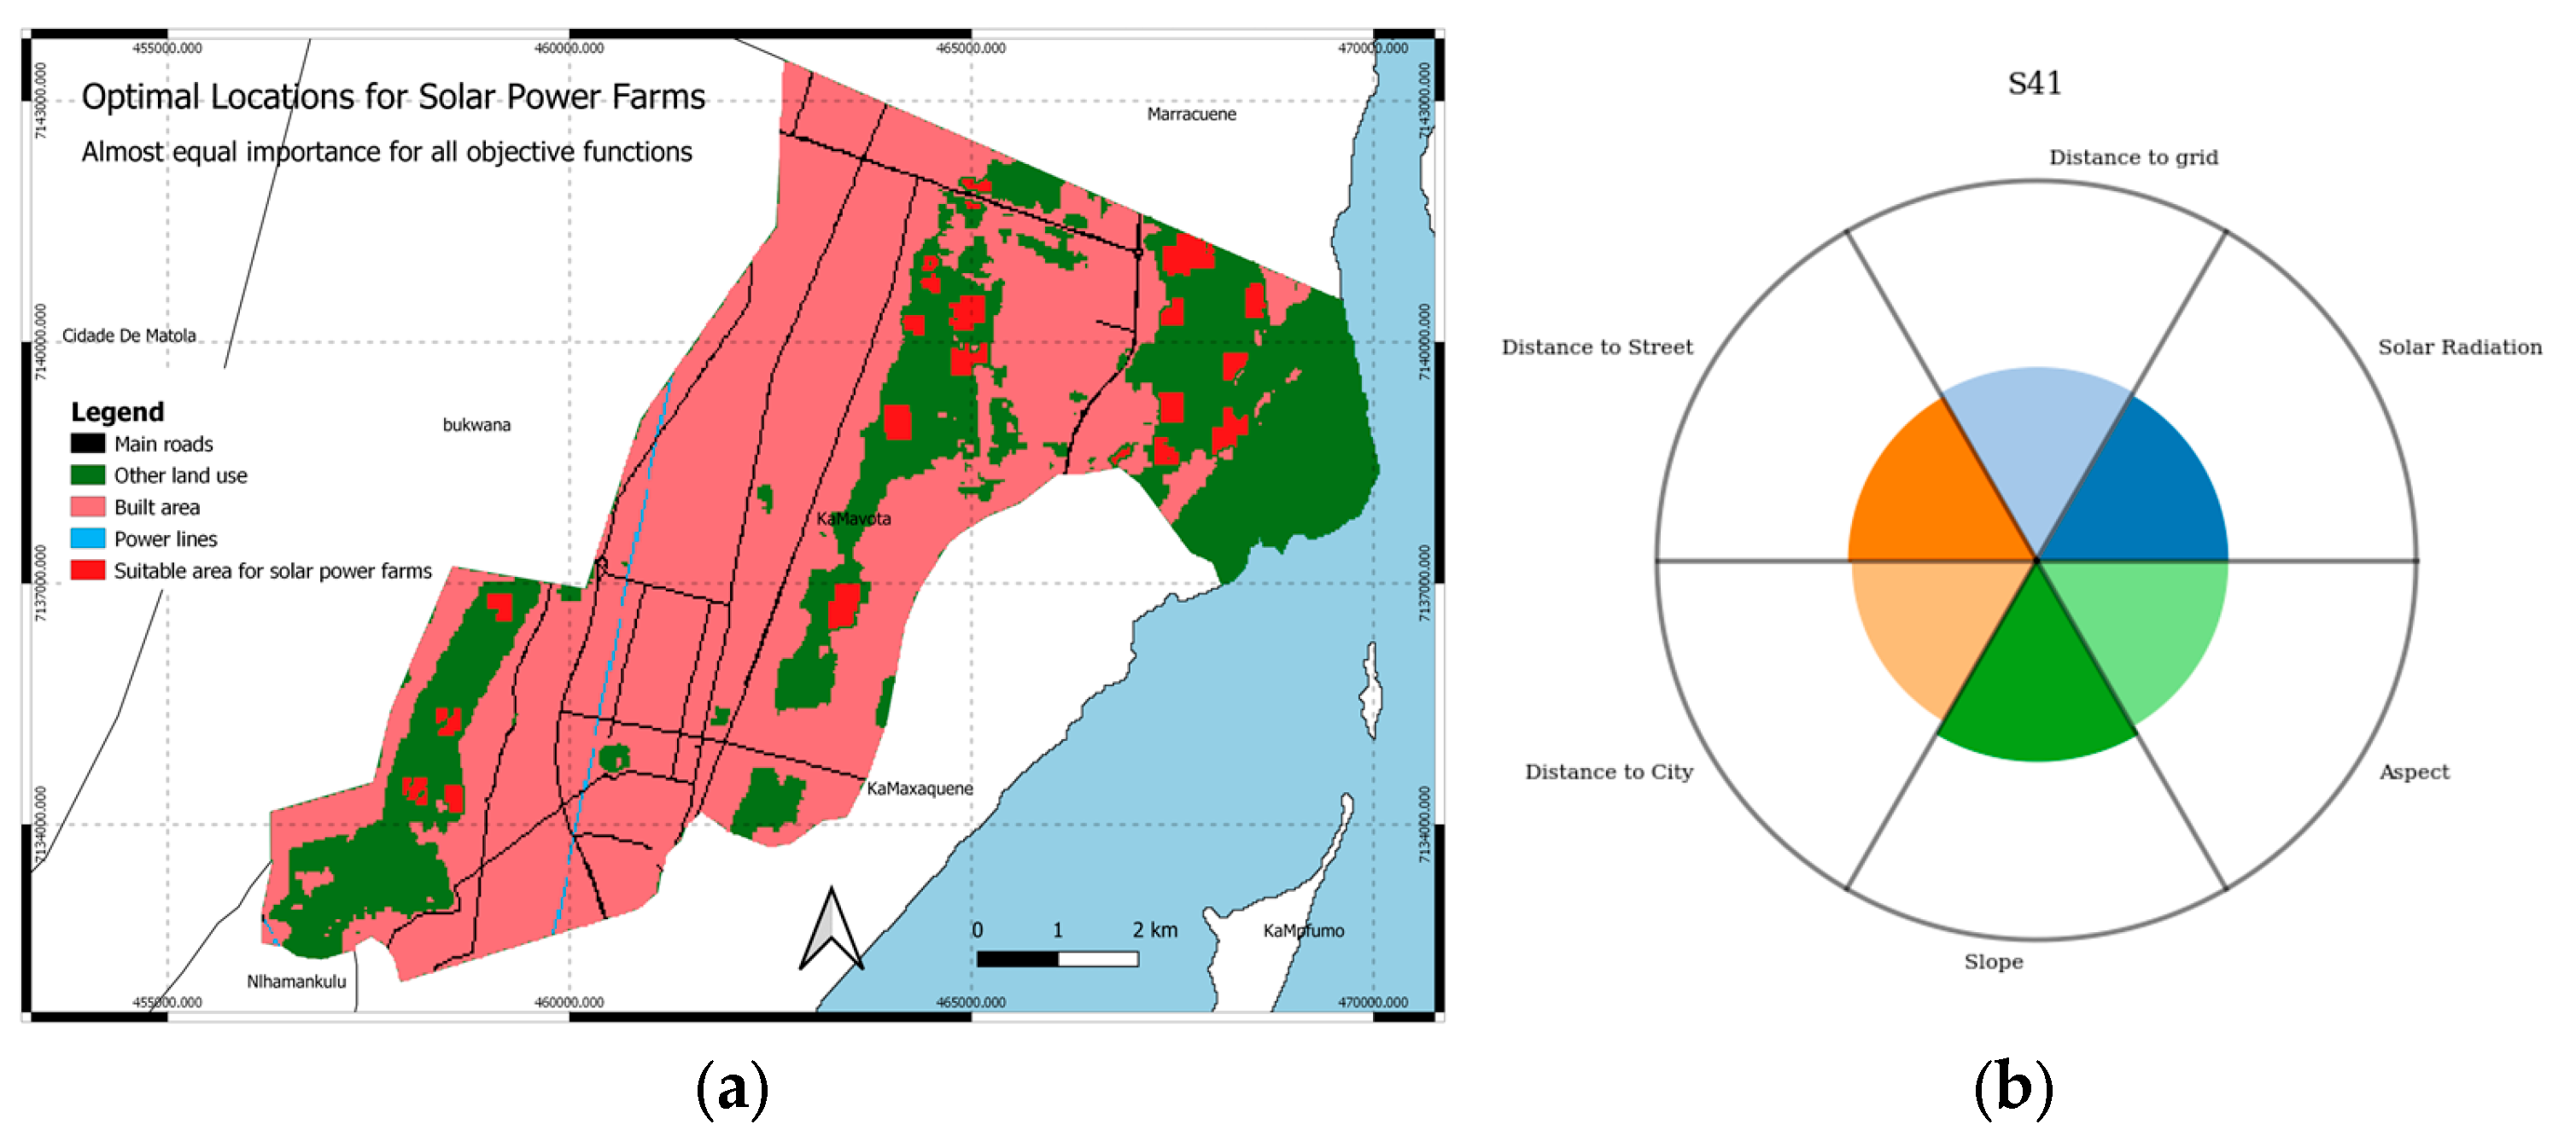
4.3. Optimal Solution Maps
5. Discussion
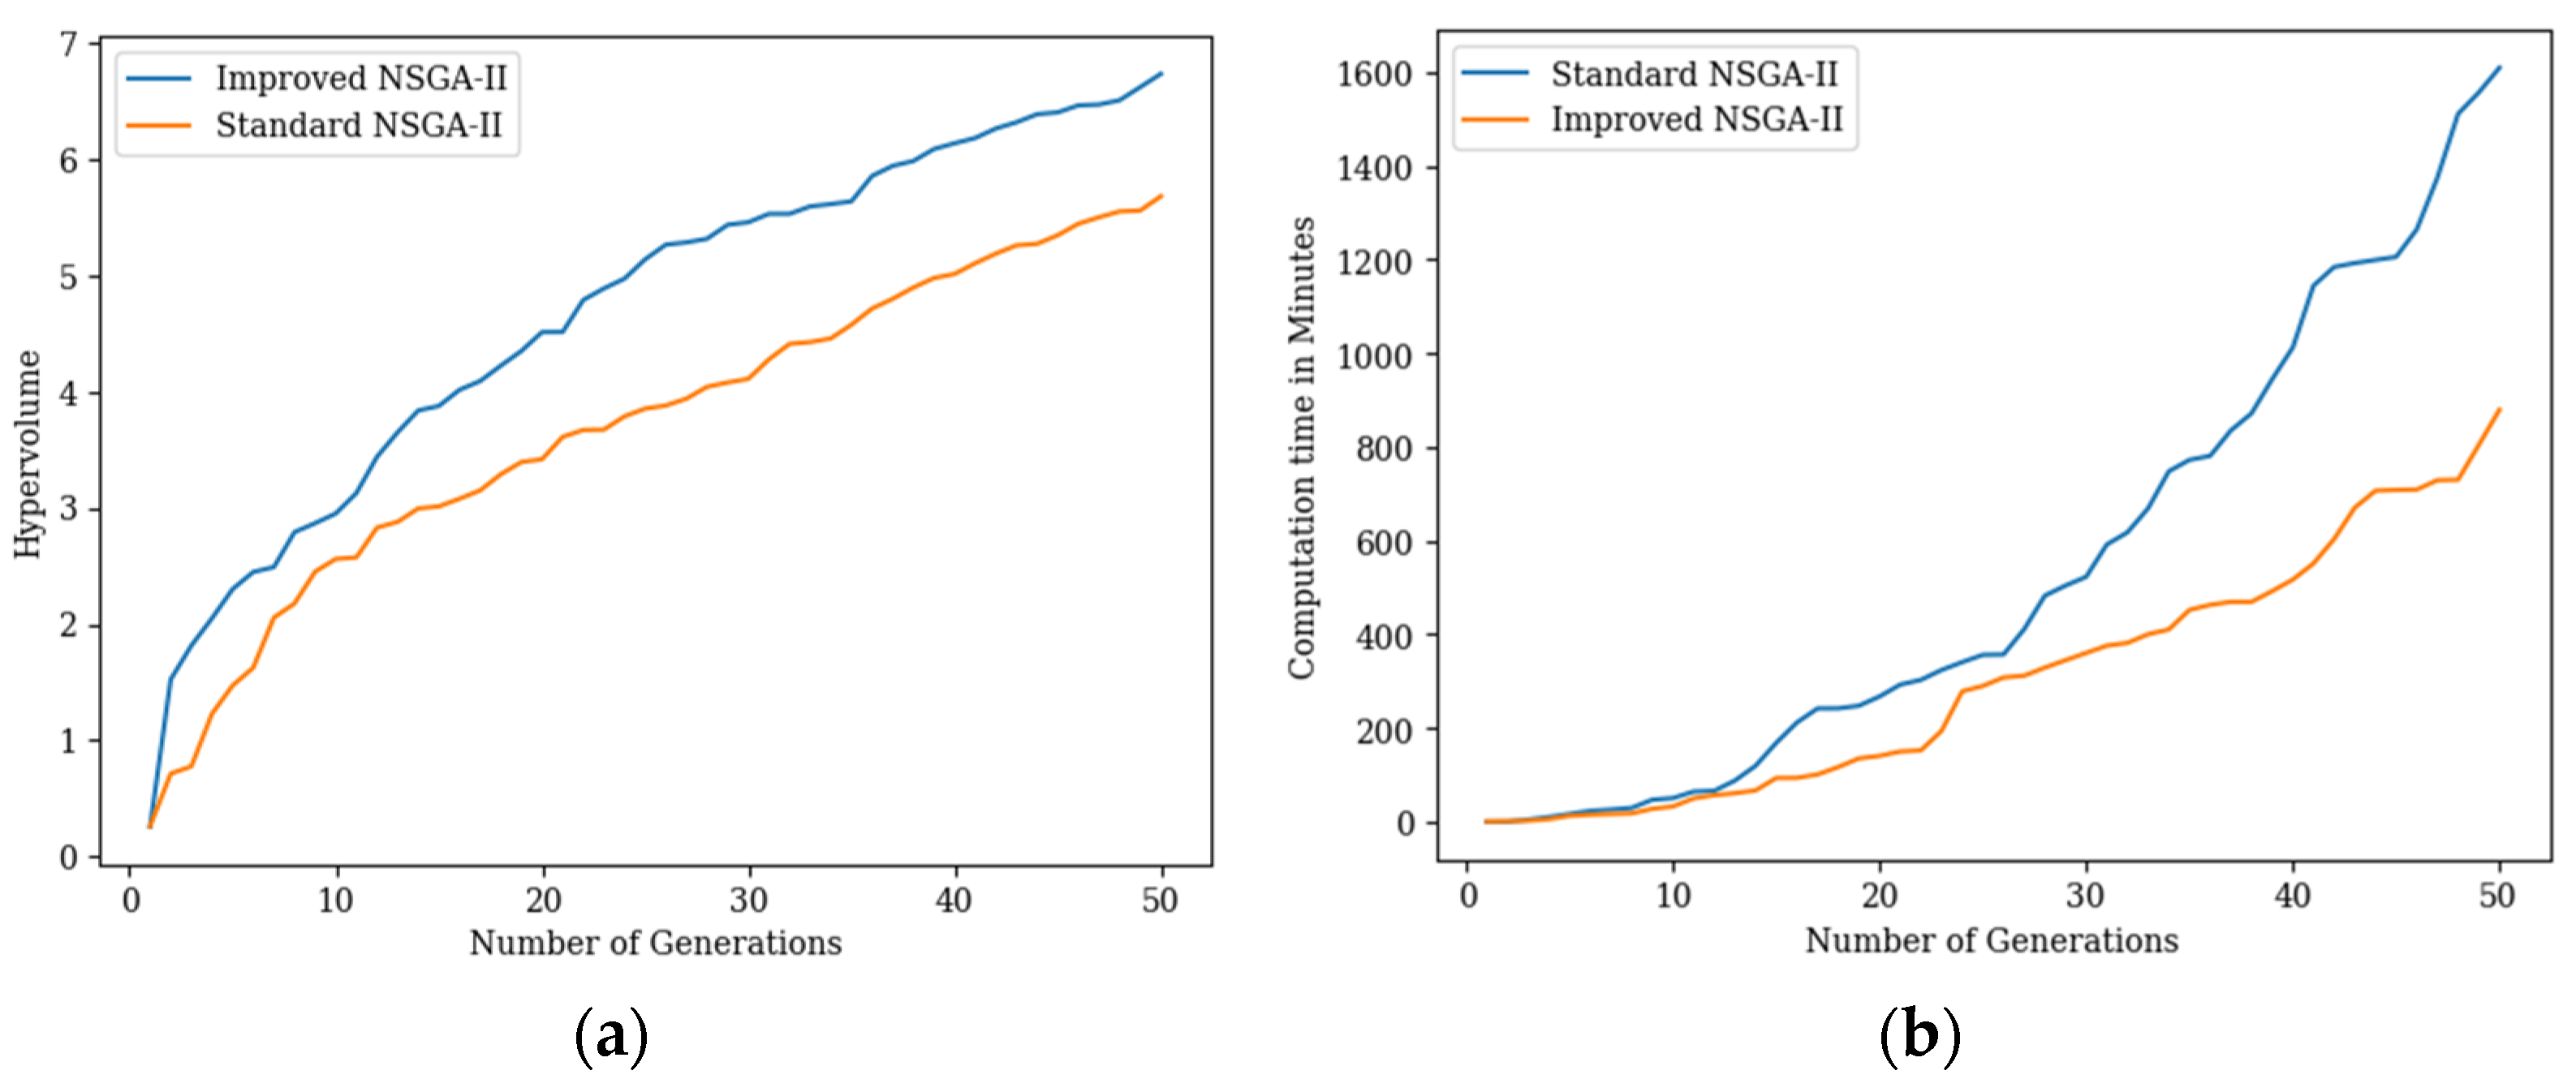
5.1. Running Performance Metrics
5.2. Performance Tracking
6. Conclusions
Author Contributions
Funding
Institutional Review Board Statement
Informed Consent Statement
Data Availability Statement
Conflicts of Interest
References
- Owusu, P.A.; Asumadu-Sarkodie, S. A review of renewable energy sources, sustainability issues and climate change mitigation. Cogent Eng. 2016, 3, 1167990. [Google Scholar] [CrossRef]
- Olabi, A.G.; Abdelkareem, M.A. Renewable energy and climate change. Renew. Sustain. Energy Rev. 2022, 158, 112111. [Google Scholar] [CrossRef]
- Ellabban, O.; Abu-Rub, H.; Blaabjerg, F. Renewable energy resources: Current status, future prospects and their enabling technology. Renew. Sustain. Energy Rev. 2014, 39, 748–764. [Google Scholar] [CrossRef]
- Islam, M.T.; Huda, N.; Abdullah, A.B.; Saidur, R. A comprehensive review of state-of-the-art concentrating solar power (CSP) technologies: Current status and research trends. Renew. Sustain. Energy Rev. 2018, 91, 987–1018. [Google Scholar] [CrossRef]
- Cristóvão, L.; Chichango, F.; Massinga, P., Jr.; Macanguisse, J. The Potential of Renewable Energy in Mozambique: An Overview. J. Energy Technol. Policy 2021, 11. [Google Scholar] [CrossRef]
- Hankins, M. A Renewable Energy Plan for Mozambique; Justica Ambiental: Maputo, Mozambique, 2009. [Google Scholar]
- Wasinee, W. The Potential of Biomass Fuel and Land Suitability for Biomass Power Plant based on GIS Spatial Analysis in the Nakhon Ratchasima Province, Thailand. Chem. Eng. Trans. 2020, 78, 325–330. [Google Scholar] [CrossRef]
- Xu, Y.; Li, Y.; Zheng, L.; Cui, L.; Li, S.; Li, W.; Cai, Y. Site selection of wind farms using GIS and multi-criteria decision making method in Wafangdian, China. Energy 2020, 207, 118222. [Google Scholar] [CrossRef]
- Aldrin Wiguna, K.; Sarno, R.; Ariyani, N.F. Optimization Solar Farm site selection using Multi-Criteria Decision Making Fuzzy AHP and PROMETHEE: Case study in Bali. In Proceedings of the 2016 International Conference on Information & Communication Technology and Systems (ICTS), Surabaya, Indonesia, 12 October 2016; IEEE: New York, NY, USA, 2016; pp. 237–243. [Google Scholar]
- Noorollahi, Y.; Ghenaatpisheh Senani, A.; Fadaei, A.; Simaee, M.; Moltames, R. A framework for GIS-based site selection and technical potential evaluation of PV solar farm using Fuzzy-Boolean logic and AHP multi-criteria decision-making approach. Renew. Energy 2022, 186, 89–104. [Google Scholar] [CrossRef]
- Barros, E.G.D.; Van Aken, B.B.; Burgers, A.R.; Slooff-Hoek, L.H.; Fonseca, R.M. Multi-Objective optimization of solar park design under climatic uncertainty. Sol. Energy 2022, 231, 958–969. [Google Scholar] [CrossRef]
- Breen, M.; Upton, J.; Murphy, M.D. Photovoltaic systems on dairy farms: Financial and renewable multi-objective optimization (FARMOO) analysis. Appl. Energy 2020, 278, 115534. [Google Scholar] [CrossRef]
- Sengupra, R.N.; Gupta, A.; Dutta, J. Decision Sciences. Theory and Practice; Taylor & Francus Group: Boca Raton, FL, USA, 2017. [Google Scholar]
- Sicuaio, T.; Zhao, P.; Pilesjo, P.; Shindyapin, A.; Mansourian, A. Sustainable and Resilient Land Use Planning: A Multi-Objective Optimization Approach. ISPRS Int. J. Geo-Inf. 2024, 13, 99. [Google Scholar] [CrossRef]
- Giagkiozis, I.; Fleming, P.J. Methods for multi-objective optimization: An analysis. Inf. Sci. 2015, 293, 338–350. [Google Scholar] [CrossRef]
- Klamroth, K.; Lacour, R.; Vanderpooten, D. On the representation of the search region in multi-objective optimization. Eur. J. Oper. Res. 2015, 245, 767–778. [Google Scholar] [CrossRef]
- Yousefi, H.; Hafeznia, H.; Yousefi-Sahzabi, A. Spatial Site Selection for Solar Power Plants Using a GIS-Based Boolean-Fuzzy Logic Model: A Case Study of Markazi Province, Iran. Energies 2018, 11, 1648. [Google Scholar] [CrossRef]
- Uyan, M. GIS-based solar farms site selection using analytic hierarchy process (AHP) in Karapinar region, Konya/Turkey. Renew. Sustain. Energy Rev. 2013, 28, 11–17. [Google Scholar] [CrossRef]
- Chiarani, E.; Antunes, A.F.B.; Drago, D.; Oening, A.P.; Paschoalotto, L.A.C. Optimal Site Selection Using Geographical Information System (GIS) Based Multi-criteria Decision Analysis (MCDA): A Case Study To Concentrated Solar Power Plants (CSP) In Brazil. Anu. Inst. Geociênc. 2023, 46, 48188. [Google Scholar] [CrossRef]
- Colak, H.E.; Memisoglu, T.; Gercek, Y. Optimal site selection for solar photovoltaic (PV) power plants using GIS and AHP: A case study of Malatya Province, Turkey. Renew. Energy 2020, 149, 565–576. [Google Scholar] [CrossRef]
- Uyan, M. Optimal site selection for solar power plants using multi-criteria evaluation: A case study from the Ayranci region in Karaman, Turkey. Clean Technol. Environ. Policy 2017, 19, 2231–2244. [Google Scholar] [CrossRef]
- Kazemi, R.; Moeini-Aghtaie, M.; Omidvar, H.; Sharifi, A.; Javadian, M. Multi-objective optimization for solar farm site selection considering environmental, social, and economic aspects. J. Clean. Prod. 2020, 243. [Google Scholar] [CrossRef]
- Blanc, P.; Espinar, B.; Geuder, N.; Gueymard, C.; Meyer, R.; Pitz-Paal, R.; Reinhardt, B.; Renné, D.; Sengupta, M.; Wald, L.; et al. Direct normal irradiance related definitions and applications: The circumsolar issue. Sol. Energy 2014, 110, 561–577. [Google Scholar] [CrossRef]
- Karra, K.; Kontgis, C.; Statman-Weil, Z.; Mazzariello, J.C.; Mathis, M.; Brumby, S.P. Global land use/land cover with Sentinel 2 and deep learning. In Proceedings of the 2021 IEEE International Geoscience and Remote Sensing Symposium IGARSS, Brussels, Belgium, 11–16 July 2021; IEEE: New York, NY, USA, 2021; pp. 4704–4707. [Google Scholar]
- OpenStreetMap Contributors Planet Dump. 2023. Available online: https://planet.osm.org (accessed on 12 December 2023).
- Torres-Sibille, A.D.C.; Cloquell-Ballester, V.-A.; Cloquell-Ballester, V.-A.; Artacho Ramírez, M.Á. Aesthetic impact assessment of solar power plants: An objective and a subjective approach. Renew. Sustain. Energy Rev. 2009, 13, 986–999. [Google Scholar] [CrossRef]
- Zhou, Q.; Liu, X. Analysis of errors of derived slope and aspect related to DEM data properties. Comput. Geosci. 2004, 30, 369–378. [Google Scholar] [CrossRef]
- Hillier, F.S.; Frederick, S. Hillier. 2021. Available online: https://doi.org/10.1287/0da64ca6-e17a-473d-b876-2df3a5ce2760 (accessed on 12 June 2023).
- Roque, P.M.J.; Chowdhury, S.P.D.; Huan, Z. Improvement of Stand-Alone Solar PV Systems in the Maputo Region by Adapting Necessary Parameters. Energies 2021, 14, 4357. [Google Scholar] [CrossRef]
- Tafula, J.E.; Justo, C.D.; Moura, P.; Mendes, J.; Soares, A. Multicriteria Decision-Making Approach for Optimum Site Selection for Off-Grid Solar Photovoltaic Microgrids in Mozambique. Energies 2023, 16, 2894. [Google Scholar] [CrossRef]
- Blank, J.; Deb, K. Pymoo: Multi-Objective Optimization in Python. IEEE Access 2020, 8, 89497–89509. [Google Scholar] [CrossRef]
- Izzo, D. Pygmo and Pykep: Open Source Tools for Massively Parallel Optimization in Astrodynamics (The Case of Interplanetary Trajectory Optimization). In Proceedings of the International Conference on Astrodynamics Tools and Techniques—ICATT 2012, Noordwijk, The Netherlands, 29 May–1 June 2012. [Google Scholar]
- Tettelaar, K. Towards Multi-objective Bayesian Global Optimization for Space Missions. Bachelor’s Thesis, Leiden University, Leiden, The Netherlands, August 2020. [Google Scholar]
- Censor, Y. Pareto optimality in multiobjective problems. Appl. Math. Optim. 1977, 4, 41–59. [Google Scholar] [CrossRef]
- Stiglitz, J.E. Pareto Optimality and Competition. J. Finance 1981, 36, 235–251. [Google Scholar] [CrossRef]
- Tan, Y.S.; Fraser, N.M. The modified star graph and the petal diagram: Two new visual aids for discrete alternative multicriteria decision making. J. Multi-Criteria Decis. Anal. 1998, 7, 20–33. [Google Scholar] [CrossRef]
- Bravi, A.; Longtin, A.; Seely, A.J. Review and classification of variability analysis techniques with clinical applications. Biomed. Eng. OnLine 2011, 10, 90. [Google Scholar] [CrossRef]
- Laumanns, M.; Thiele, L.; Deb, K.; Zitzler, E. Combining Convergence and Diversity in Evolutionary Multiobjective Optimization. Evol. Comput. 2002, 10, 263–282. [Google Scholar] [CrossRef]
- Blank, J.; Deb, K. A Running Performance Metric and Termination Criterion for Evaluating Evolutionary Multi- and Many-objective Optimization Algorithms. In Proceedings of the 2020 IEEE Congress on Evolutionary Computation (CEC), Glasgow, UK, 19–24 July 2020; IEEE: New Yor, NY, USA, 2020; pp. 1–8. [Google Scholar]
- Zitzler, E.; Brockhoff, D.; Thiele, L. The Hypervolume Indicator Revisited: On the Design of Pareto-compliant Indicators via Weighted Integration. In Evolutionary Multi-Criterion Optimization; Lecture Notes in Computer Science; Obayashi, S., Deb, K., Poloni, C., Hiroyasu, T., Murata, T., Eds.; Springer: Berlin/Heidelberg, Germany, 2007; Volume 4403, pp. 862–876. ISBN 978-3-540-70927-5. [Google Scholar]

Disclaimer/Publisher’s Note: The statements, opinions and data contained in all publications are solely those of the individual author(s) and contributor(s) and not of MDPI and/or the editor(s). MDPI and/or the editor(s) disclaim responsibility for any injury to people or property resulting from any ideas, methods, instructions or products referred to in the content. |
© 2024 by the authors. Licensee MDPI, Basel, Switzerland. This article is an open access article distributed under the terms and conditions of the Creative Commons Attribution (CC BY) license (https://creativecommons.org/licenses/by/4.0/).
Share and Cite
Sicuaio, T.; Zhao, P.; Pilesjö, P.; Shindyapin, A.; Mansourian, A. A Multi-Objective Optimization Approach for Solar Farm Site Selection: Case Study in Maputo, Mozambique. Sustainability 2024, 16, 7333. https://doi.org/10.3390/su16177333
Sicuaio T, Zhao P, Pilesjö P, Shindyapin A, Mansourian A. A Multi-Objective Optimization Approach for Solar Farm Site Selection: Case Study in Maputo, Mozambique. Sustainability. 2024; 16(17):7333. https://doi.org/10.3390/su16177333
Chicago/Turabian StyleSicuaio, Tomé, Pengxiang Zhao, Petter Pilesjö, Andrey Shindyapin, and Ali Mansourian. 2024. "A Multi-Objective Optimization Approach for Solar Farm Site Selection: Case Study in Maputo, Mozambique" Sustainability 16, no. 17: 7333. https://doi.org/10.3390/su16177333
APA StyleSicuaio, T., Zhao, P., Pilesjö, P., Shindyapin, A., & Mansourian, A. (2024). A Multi-Objective Optimization Approach for Solar Farm Site Selection: Case Study in Maputo, Mozambique. Sustainability, 16(17), 7333. https://doi.org/10.3390/su16177333