Article

Response of Surface Runoff Evolution to Landscape Patterns in Karst Areas: A Case Study of Yun–Gui Plateau

1
College of Landscape Architecture, Central South University of Forestry and Technology, Changsha 410004, China
2
Hunan Provincial Nature Reserve Landscape Resources Big Data Engineering Technology Research Center, Changsha 410004, China
3
Institute of Urban and Rural Landscape Ecology, Central South University of Forestry and Technology, Changsha 410004, China
*
Author to whom correspondence should be addressed.
Sustainability 2024, 16(17), 7338; https://doi.org/10.3390/su16177338
Submission received: 27 June 2024 / Revised: 21 August 2024 / Accepted: 22 August 2024 / Published: 26 August 2024
(This article belongs to the Section Environmental Sustainability and Applications)

Abstract

:
To control and improve the phenomena of rocky desertification and soil erosion in karst landform areas, which are caused by a series of human factors that include social and economic development and human activities, China has successively introduced many policies, resulting in spatial and temporal changes in the landscape pattern of the southern karst area. In this study, land use transfer intensity maps, the grid method, the sample line method, the semivariogram method, and the Spearman analysis method are used to explore the spatial and temporal evolutions in surface runoff as responses to landscape pattern and policy factors in karst landform area. Therefore, this study provides theoretical and policy support for improving the regional landscape structure, optimizing the landscape layout, introducing regional policies, reducing surface runoff, and alleviating soil erosion. The results show that the best scale for the study of landscape patterns in the southern karst area is 3000 m. Forests are the land type that make up the highest proportion in the southern karst area, and they have the strongest interception capacity for surface runoff. The spatial and temporal distributions of the surface runoff are significantly different, and urban expansion has led to an increase in impervious runoff year over year. Runoff is positively correlated with the Shannon diversity index (SHDI), patch density (PD), and landscape shape index (LSI). The stronger the landscape heterogeneity, the more runoff. DIVISION is positively correlated with forest runoff and negatively correlated with other land types. The higher is the degree of aggregation of impervious patches, the higher the regional runoff rate. The more dispersed the forest patches are, the smaller the area proportion, and the greater the runoff. In addition, policy factors have a significant impact on surface runoff.

1. Introduction

A large proportion of China is covered by karst landforms, accounting for approximately one-third of its total land area [1]. The karst area in southern China is the largest, most widely distributed, and most concentrated in the world [2]. Because of the unique geological characteristics of the karst, this area is listed as one of China’s four major ecologically fragile areas [3,4,5,6,7]. The Yun–Gui Plateau is characterized by high altitudes, a thin surface soil layer, and slow formation. The amount of regional precipitation is significant, leading to continuous surface erosion by the runoff. Surface soil infiltrates underground karst caves via cracks in the stone along with the runoff, increasing the ratio of bare rock in the Yun–Gui Plateau and aggravating the rocky desertification problem. At the same time, the occurrence of soil erosion and bare rocks increase the impervious surface area, resulting in more surface runoff. The increase in surface runoff accelerates the ecological destruction of the Yun–Gui Plateau, which is the most urgent ecological problem in the region at present and is related to the sustainable economic development of the plateau and to people’s livelihoods and wellbeing there.
The underlying surface of the region is a crucial factor affecting runoff, and policy and social development continue to change the land use type of the underlying surface and regional landscape patterns. Landscape patterns are essential parts of landscape ecology research [8]. With the growth in research, the study of landscape patterns is gradually becoming enriched; this is not only limited to urban areas but also extends to basins on regional, national, and other large scales. Guo et al. have studied landscape patterns in Danjiang and found that the degree of fragmentation, landscape connectivity, and landscape richness has increased while regional runoff has decreased [9]. Spatial and temporal evolutions of landscape patterns affect the infiltration capacity of the underlying surface, resulting in spatial and temporal differences in regional runoff. Runoff is closely related to regional ecological security and social development, and surface runoff is a crucial factor affecting soil and water conservation. On large watershed scales, the spatial and temporal changes in the runoff are different because of the interaction of various factors, such as spatial heterogeneity and climate change [10]. Changes in the surface runoff will also affect the functions of other ecological services. For example, the surface runoff in karst areas influences the sediment yield, and sediment yield increases with the increase in surface runoff [11]. Studying the responses of landscape pattern evolution and surface runoff on different scales is conducive to establishing a synergistic relationship between landscape and regional hydrology [12]. Yang used the SWAT model to explore the effects of landscape patterns and climate change on runoff and sediment transport processes in the Loess Plateau [13]. G et al. used the SCS-CN method to explore the impacts of mountain forest landscape patterns on runoff in the arid region of northern Ethiopia, Africa [14].
Scholars have achieved fruitful results in large-scale surface runoff and landscape pattern studies. However, research on landscape patterns in large geomorphic units is in its infancy, with further study of the response relationship between landscape patterns and runoff in special landforms needed. Because of the particularity of this landform, many scholars are paying attention to the karst area of southern China but mainly from the two aspects of carbon storage and vegetation restoration. There are relatively few studies on the surface runoff in the karst area of southern China, and it is necessary to explore this further.

2. Materials and Methods

2.1. Background

The karst area of southern China is the most impressive and complex but is otherwise typical of the world’s three major karst distribution areas. The Yun–Gui Plateau (97°31′~112°17′ E, 21°8′~32°12′ N) lies in the middle of the southern karst area [15], in the southwest, and is one of the four major plateau areas in China. This karst landform is rich, and it is an excellent research area. The Yun–Gui Plateau (Figure 1) has a subtropical monsoon climate in a subtropical humid area. The vertical difference in climates is noticeable, and it is an area sensitive to climate change. The western side of the study area is a north–south mountain range, the eastern side consists of plains and hills [16], and the northern side is the Sichuan Basin. The region spans 42 cities in 6 provinces, including Guizhou Province, Yunnan Province, and Hunan Province, covering an area of approximately 980,000 square kilometers. At the national and regional levels, many policies, opinions, and plans have been issued for the economic development of this karst region and to curb the rocky desertification. These specific policies are summarized in Table 1 below.

2.2. Data Sources and Processing

To better understand the response relationship between landscape patterns and surface runoff, the Yun–Gui Plateau is divided into different land types according to their function, and the changes in the landscape pattern are analyzed. Combined with the changes in soil composition, altitude, and precipitation, the spatial and temporal distributions of the surface runoff are simulated. The coupling relationships with the landscape pattern are studied and the responses’ driving factors discussed. This study mainly used the following types of data: Yun–Gui Plateau land use data, elevation data, soil hydrological group raster data, precipitation data, population data, human footprint data, GDP data, surface temperature data, and normalized vegetation data. A complete set of data sources is provided in Table 2.
This study used ArcGIS10.7, Fragstats4.2, GS + 9.0, SPSS25, Origin2020, HEC-GeoHMS10.7, and other software for data processing and analysis. All referenced coordinates in the spatial data in this study use the WGS_1984 coordinate system and the WGS_1984 _UTM_Zone_48N projection. In addition, data on the Yun–Gui Plateau at different resolutions are resampled, and the resolution is unified to 250 m × 250 m. The specific technical process is shown in Figure 2.

2.3. Research Methods

The response relationships between the landscape patterns and surface runoff are studied using different methods, mostly on four levels. The landscape pattern is used to analyze the spatial and temporal changes in the land use types and patterns, the surface runoff is simulated using the SCS-CN method, and Spearman analysis is used to analyze the correlation between the two.

2.3.1. Analysis of Land Use Transfer

Land Use Transfer Matrix

The land use transfer matrix is an intuitive method by which to describe trends in changes in land use structures and the direction in which a land type is transferred using the Markov model. As the basis of structural and trend analyses, a land use transfer matrix clearly shows the distribution of land use types at the beginning and end of a study period, tracking the changes and compositions for various types of land use during a specified period. The analysis of the area of change for each land type over time shows the characteristics of land use evolution and the mutual transfer between different land types in a specific time range [17,18,19,20]. This study used the land use transfer matrix method to calculate the land use change in the Yun–Gui Plateau from 2000 to 2020. The calculation formula is as follows:
S m n = S 11   S 12     S 1 i   S 21   S 22     S 2 i           S i 1   S i 2     S i i  
where S represents the number of land use areas, m represents the land use type in the previous period, n is the land use type in the next period, Smn (m, n = 1, 2, 3... i) represents the total area of land use type m in the previous period to land use type n in the next period, and i is the total number of land use types in the study.

Land Use Transfer Intensity Map

A transfer matrix can fully reflect the degree and direction of changes in various land types, and a map can be used to further investigate the transfer trend among various types and their impact on land use structures [21]. According to the mutual conversion between the beginnings and ends of the periods, an enhanced map unit (Figure 3) is constructed, where x represents the land type at the beginning of the period and y represents the land type at the end of the period. Each cell represents the absolute, relative, transfer-in, and transfer-out situations. The different fill colors represent the tendency and inhibition. The absolute tendency indicates that the land type area at the beginning of the period is higher than the average and tended to transfer from the land type. The relative tendency shows that the land types at the end of the period inclined to transfer from the land types at the beginning of the period, and that the transformation process has a large impact on the initial area ratio of the land types at the beginning of the period. If all units are filled with the same color, this is expressed as “system tendency” or “system inhibition” [22].

2.3.2. Related Methods of Landscape Pattern Analysis

Grid Method

Different spatial scales will lead to significant differences in the results of landscape pattern research in a study area. If the scale is small, detailed data on landscape patterns will be recovered. However, if the scale is too small, critical information will be occluded or ignored, which will affect the results of the analysis [23]. Therefore, this study analyzed the landscape patterns of the Yun–Gui Plateau on different spatial scales and selected the best feature scale to reflect detailed characteristics of the study area at that spatial scale and to explore the spatial and temporal evolution characteristics of the landscape pattern from 2000 to 2020. Concerning existing research that used ArcGIS10.7 software and Fragstats4.2 software, the division standard of a scale grid is usually 2–5 times the average area of patches in the study area. Combined with the unified resolution of the existing data in the study area, the resolution is 250 times, and six grids of different sizes are set at intervals of 500. The radii are set to 1000 m, 1500 m, 2000 m, 2500 m, 3000 m, and 3500 m.

Sample Line Setting

Taking into account the scope and the distribution of the landscape types in the study area, with the aim of including all land types [24], the following three sample lines (Figure 4) are selected for the study area: the east–west sample line, 1240.8 km long; the northeast–southwest transect, 1571.7 km long; and the northwest–southeast line, 795 km long. Using these three sample lines, operations are carried out in ArcGIS10.7, and 4055 points with equal spacing are taken on the sample line. According to the research needs, the data are extracted, assigned to the points, and analyzed using index and scale selections.

Semivariogram Method

As a standard analysis tool in geostatistics, a semivariogram is often used to reveal the spatial heterogeneity of a landscape pattern index on the characteristic scale and to explore the best scale for the research. Therefore, this study used the semivariogram method to select the feature scale. The formula is as follows [24]:
r ( h ) = 1 2 N ( h ) i = 1 N ( h ) Z ( s i ) Z ( s i + h ) 2
In the above formula, r(h) is a semivariogram value, h is the sample selection interval distance, N(h) is the total number of all sample points with the interval distance, Z(si) is the landscape index value of the regionalized variable at point si, and Z(si + h) is the landscape index value of the regionalized variable at the interval h from the point si. It has been found that when the block base ratio C0/(C + C0) achieves stability, the landscape pattern index tends to be stable in its spatial variation, and that this scale can be used as the characteristic scale of the study area’s landscape.
The study selected three landscape pattern indexes—DIVISION, CONTAG, and LPI—for the feature scale analysis. Using GS + 9.0 software, a trend chart of the spatial heterogeneity characteristic values of the landscape pattern index for the Yun–Gui Plateau from 2000 to 2020 is created (Figure 5). The smaller the block base ratio C0/(C + C0), the more stable the space and the more significant the autocorrelation. The results tend to stabilize when the mesh radius is greater than 3000 m. Therefore, it is determined that 3000 m to 3500 m is the best scale range, but a grid scale that is too large will omit more spatial information. Therefore, a 3000 m scale is selected as the ideal scale for analyzing the landscape pattern of the Yun–Gui Plateau so as to better reflect the change in the pattern and retain the gradient characteristics.

Selection of Landscape Pattern Index

To measure the spatial and temporal heterogeneities and fragmentation degrees of the landscape pattern in the Yun–Gui Plateau, as well as to reflect the correlations among various land types, a total of 12 indicators are selected at the landscape- and patch-type levels on the basis of previous research on landscape patterns and in combination with the actual situation in the study area, and the spatial and temporal variation characteristics of the landscape pattern in the Yun–Gui Plateau are explored from the aspects of the shape complexity, dispersion degree, aggregation degree, and fragmentation degree of the landscape patches. On the basis of multiple stepwise regression analyses, the collinearity test tool is used to screen the landscape pattern index [25]. Fragstats4.2 is used to calculate the landscape pattern index at the patch level and landscape-type level [26,27]. At the landscape level, taking 2020 as an example, the collinearity among the landscape pattern indexes is tested using an assignment of 4055 points on the sample line (Table 3), and the indexes with variance inflation factors (VIFs) greater than ten are discarded. The obtained landscape pattern indices included patch density (PD), patch cohesion index (COHESION), Shannon’s diversity index (SHDI), patch area distribution (AREA_MN), contagion index (CONTAG), interspersion and juxtaposition index (IJI), largest patch index (LPI), landscape shape index (LSI), landscape division index (DIVISION), and percentage of landscape (PLAND).
Using the above indicators, the spatial differentiation characteristics of the landscape pattern evolution in the Yun–Gui Plateau are analyzed, and the response relationship between landscape pattern evolution and surface runoff in the study area is discussed.

2.3.3. SCS-CN Runoff Model

In the 1950s, the Soil Conservation Service curve number method (SCS-CN) was model developed by the Bureau of Soil and Water Conservation of the United States Department of Agriculture to simulate hydrological calculations of surface runoff [28]. The model is based on precipitation data, DEM data, hydrological soil groups (HSG), and land use type data. The Yun–Gui Plateau covers an extremely wide area, and measured hydrological data are difficult to obtain. The SCS-CN method is widely used in regional surface runoff simulations that lack hydrological and climate data [29]. The calculation formula of the SCS-CN model to simulate surface runoff is as follows:
  Q = ( P λ s ) 2 P + ( 1 λ ) s  
where Q represents the depth of the surface runoff in the study area, unit: mm; P represents the amount of rainfall in the study area, unit: mm; s is the retention coefficient, which represents the maximum water retention capacity of the soil, unit: mm; and λ represents the dimensionless initial loss coefficient. Usually, the standard value is 0.2, which is included in the formula to obtain the following equation to calculate the runoff:
Q =   ( P 0.2 s ) 2 P + 0.8 s   ,   P 0.2 S 0   ,   P < 0.2 S
The value of S in the formula is derived from the number of runoff curves, CN (dimensionless), and the calculation formula is as follows:
S = 25,400 C N 254 ( i n t e r n a t i o n a l   s y s t e m   o f   u n i t s )
CN reflects the runoff capacity of the underlying surface in the study area. The theoretical range is 0–100, which is related to the degree of soil moisture (AMC), land use type, hydrological soil type, and elevation [28]. According to the soil infiltration rate, the Yun–Gui Plateau’s soil is divided into the following four categories: A, B, C, and D (as shown in Table 4). There are three central states of soil moisture, as follows: dry state (AMC I), normal state (AMC II), and wet state (AMC III) [30]. This study mainly discusses the response of landscape pattern evolution to surface runoff in the Yun–Gui Plateau. It is assumed that the soil moisture in the previous period in the Yun–Gui Plateau is in a normal state (AMC II). By searching in the CN value lookup table of the National Engineering Manual of the United States, the CN values of various land use types in the Yun–Gui Plateau with different soil types are determined (the CN value of snow refers to that of wet grassland) as shown in Table 5. The range for the study area is 45~98.

2.3.4. Spearman Analysis Method

The data on the Yun–Gui Plateau are non-normally distributed, so the Spearman correlation analysis method is used. The Spearman correlation analysis method mainly uses the size of the rank of two variables for a linear correlation analysis, and the formula to calculate the coefficient, ρ is as follows [31]:
ρ = 1 6 d 2 n n 2 1
The value range of ρ is (−1~1), and the value is positive, which means positive correlation, and the value is negative, which means negative correlation. d = r x r y , r x and r y represent the rank of variables X and Y, respectively, and n represents the total number of observed samples.

3. Results and Analysis

3.1. Spatio-Temporal Evolution of Landscape Pattern in Yun–Gui Plateau

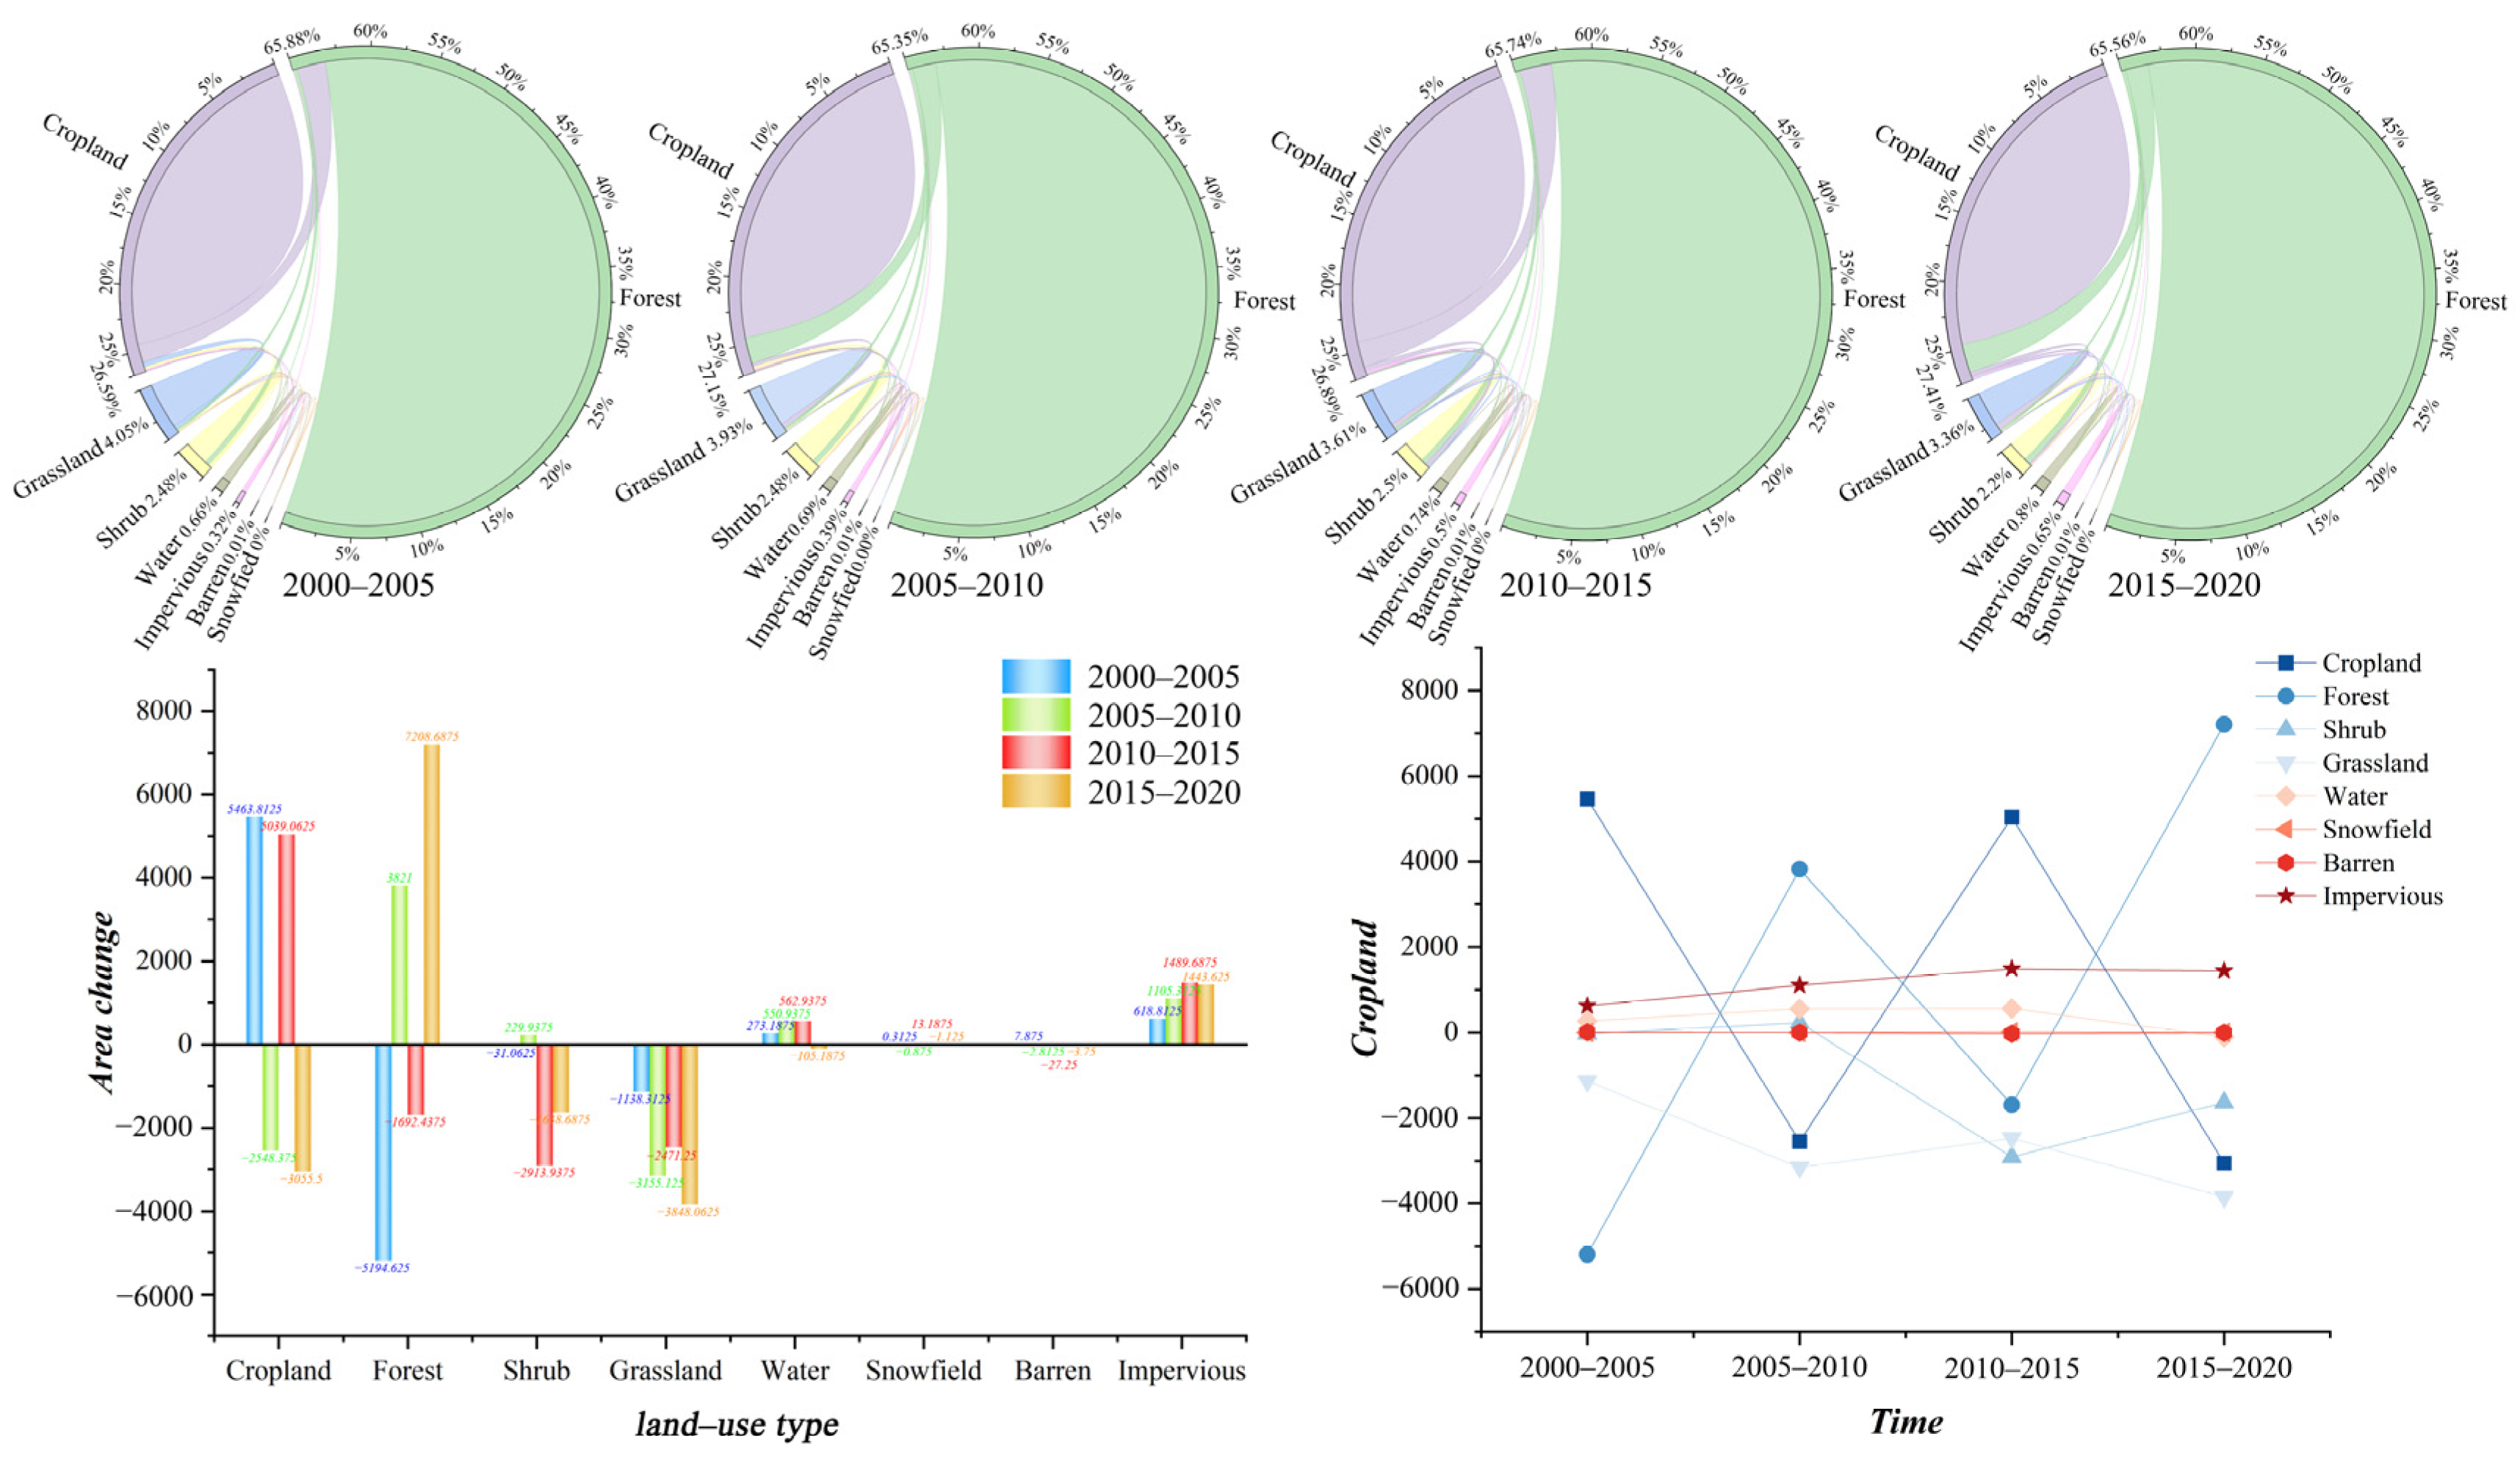
3.1.1. Spatio-Temporal Evolution of Land Use

China’s land cover data set divides land use in the Yun–Gui Plateau into nine categories, but the wetland areas at the site are still being determined. After resampling the data, the land at the site included the following eight categories, with a resolution of 250 m × 250 m: cropland, forest, shrub, grassland, water, snowfield, barren, and impervious, (Figure 6). It can be found that the proportions of forest and cropland in the Yun–Gui Plateau are relatively high, followed by grassland. This is consistent with previous research on karst land types [32]. Forests are evenly distributed in the study area. In contrast, croplands are concentrated in the central, northern, and northeastern corners, with the smallest proportions for snowfield and barren. Impervious areas are mainly distributed in urban areas.
From 2000 to 2005, to solve problems related to farmers’ access to food and clothing, many artificial deforestation and reclamation events led to the transformation of a large amount of forest into cropland. Since then, a pilot project reverting farmland to forest and an ecological restoration project have promoted increases in forest land converted from cropland in the Yun–Gui Plateau. Over five years, the land types showed an overall increase in cropland and a decrease in forests, which may be related to China’s five-year development plans. From 2005 to 2010, industrialization and modernization based on western development promoted increases to industrial land, urban-scale expansion, and impervious areas [33]. In addition to the implemented pilot project and ecological restoration project, another pilot project concerning the comprehensive management of rocky desertification in 2008 promoted the conversion of cropland into forests and shrublands, and grassland was also transferred to forest. From 2010 to 2015, the total increase in impervious areas reached the maximum value in four time periods because of socio-economic growth (Figure 7). The efficient use of land and the natural expansion of the ecology promoted the development of barren land, reducing its area. To maintain national and regional ecological security and sustainable socio-economic development, the Ministry of Environmental Protection issued the “National Ecological Protection Red Line” in 2014. The policy lag promoted an increase in forest areas from 2015 to 2020, which mainly came from cropland, shrubland, and grassland. At the same time, urbanization further increased, expanding the impervious area.

3.1.2. Analysis of Land Use Transfer Intensity Map

From 2000 to 2020, the transfer of cropland to forest always showed an absolute tendency. Forest areas tended to be transferred from cropland, and most of the transferred forest area came from croplands. The spatial distributions of the cropland and forest areas are relatively close. Transfers from grassland to shrubland, water to grassland, water to impervious, and barren to impervious always exhibited relative tendencies. Shrubland tended to be transferred from grassland, grassland tended to be transferred from water, and impervious areas tended to be transferred from water and barren lands. Transfers from cropland to snowfield, cropland to barren land, forest to grassland, forest to water, forest to snowfield, forest to barren, forest to impervious, shrubland to water, shrubland to snowfield, shrubland to barren, shrubland to impervious, water to forest, water to shrubland, water to snowfield, snowfield to forest, snowfield to shrub, snowfield to grassland, snowfield to impervious, barren to cropland, barren to forest, barren to shrubland, impervious to cropland, impervious to forest, impervious to shrubland, impervious to grassland, impervious to snowfield, and impervious to barren showed systemic inhibition (Figure 8).
From 2000 to 2010, the transfer from impervious land to water showed a systematic tendency; grassland to cropland exhibited systematic tendencies in 2005–2010 and 2015–2020, grassland to snowfield changed from a relative tendency to systematic inhibition in 2005, and water to barren showed relative tendencies in 2000 to 2005 and 2010 to 2015. From 2000 to 2010, the conversion of impervious areas to water showed a systematic tendency, and the conversions of impervious area to forest, cropland, and other land types has always been inhibited over the last 20 years.

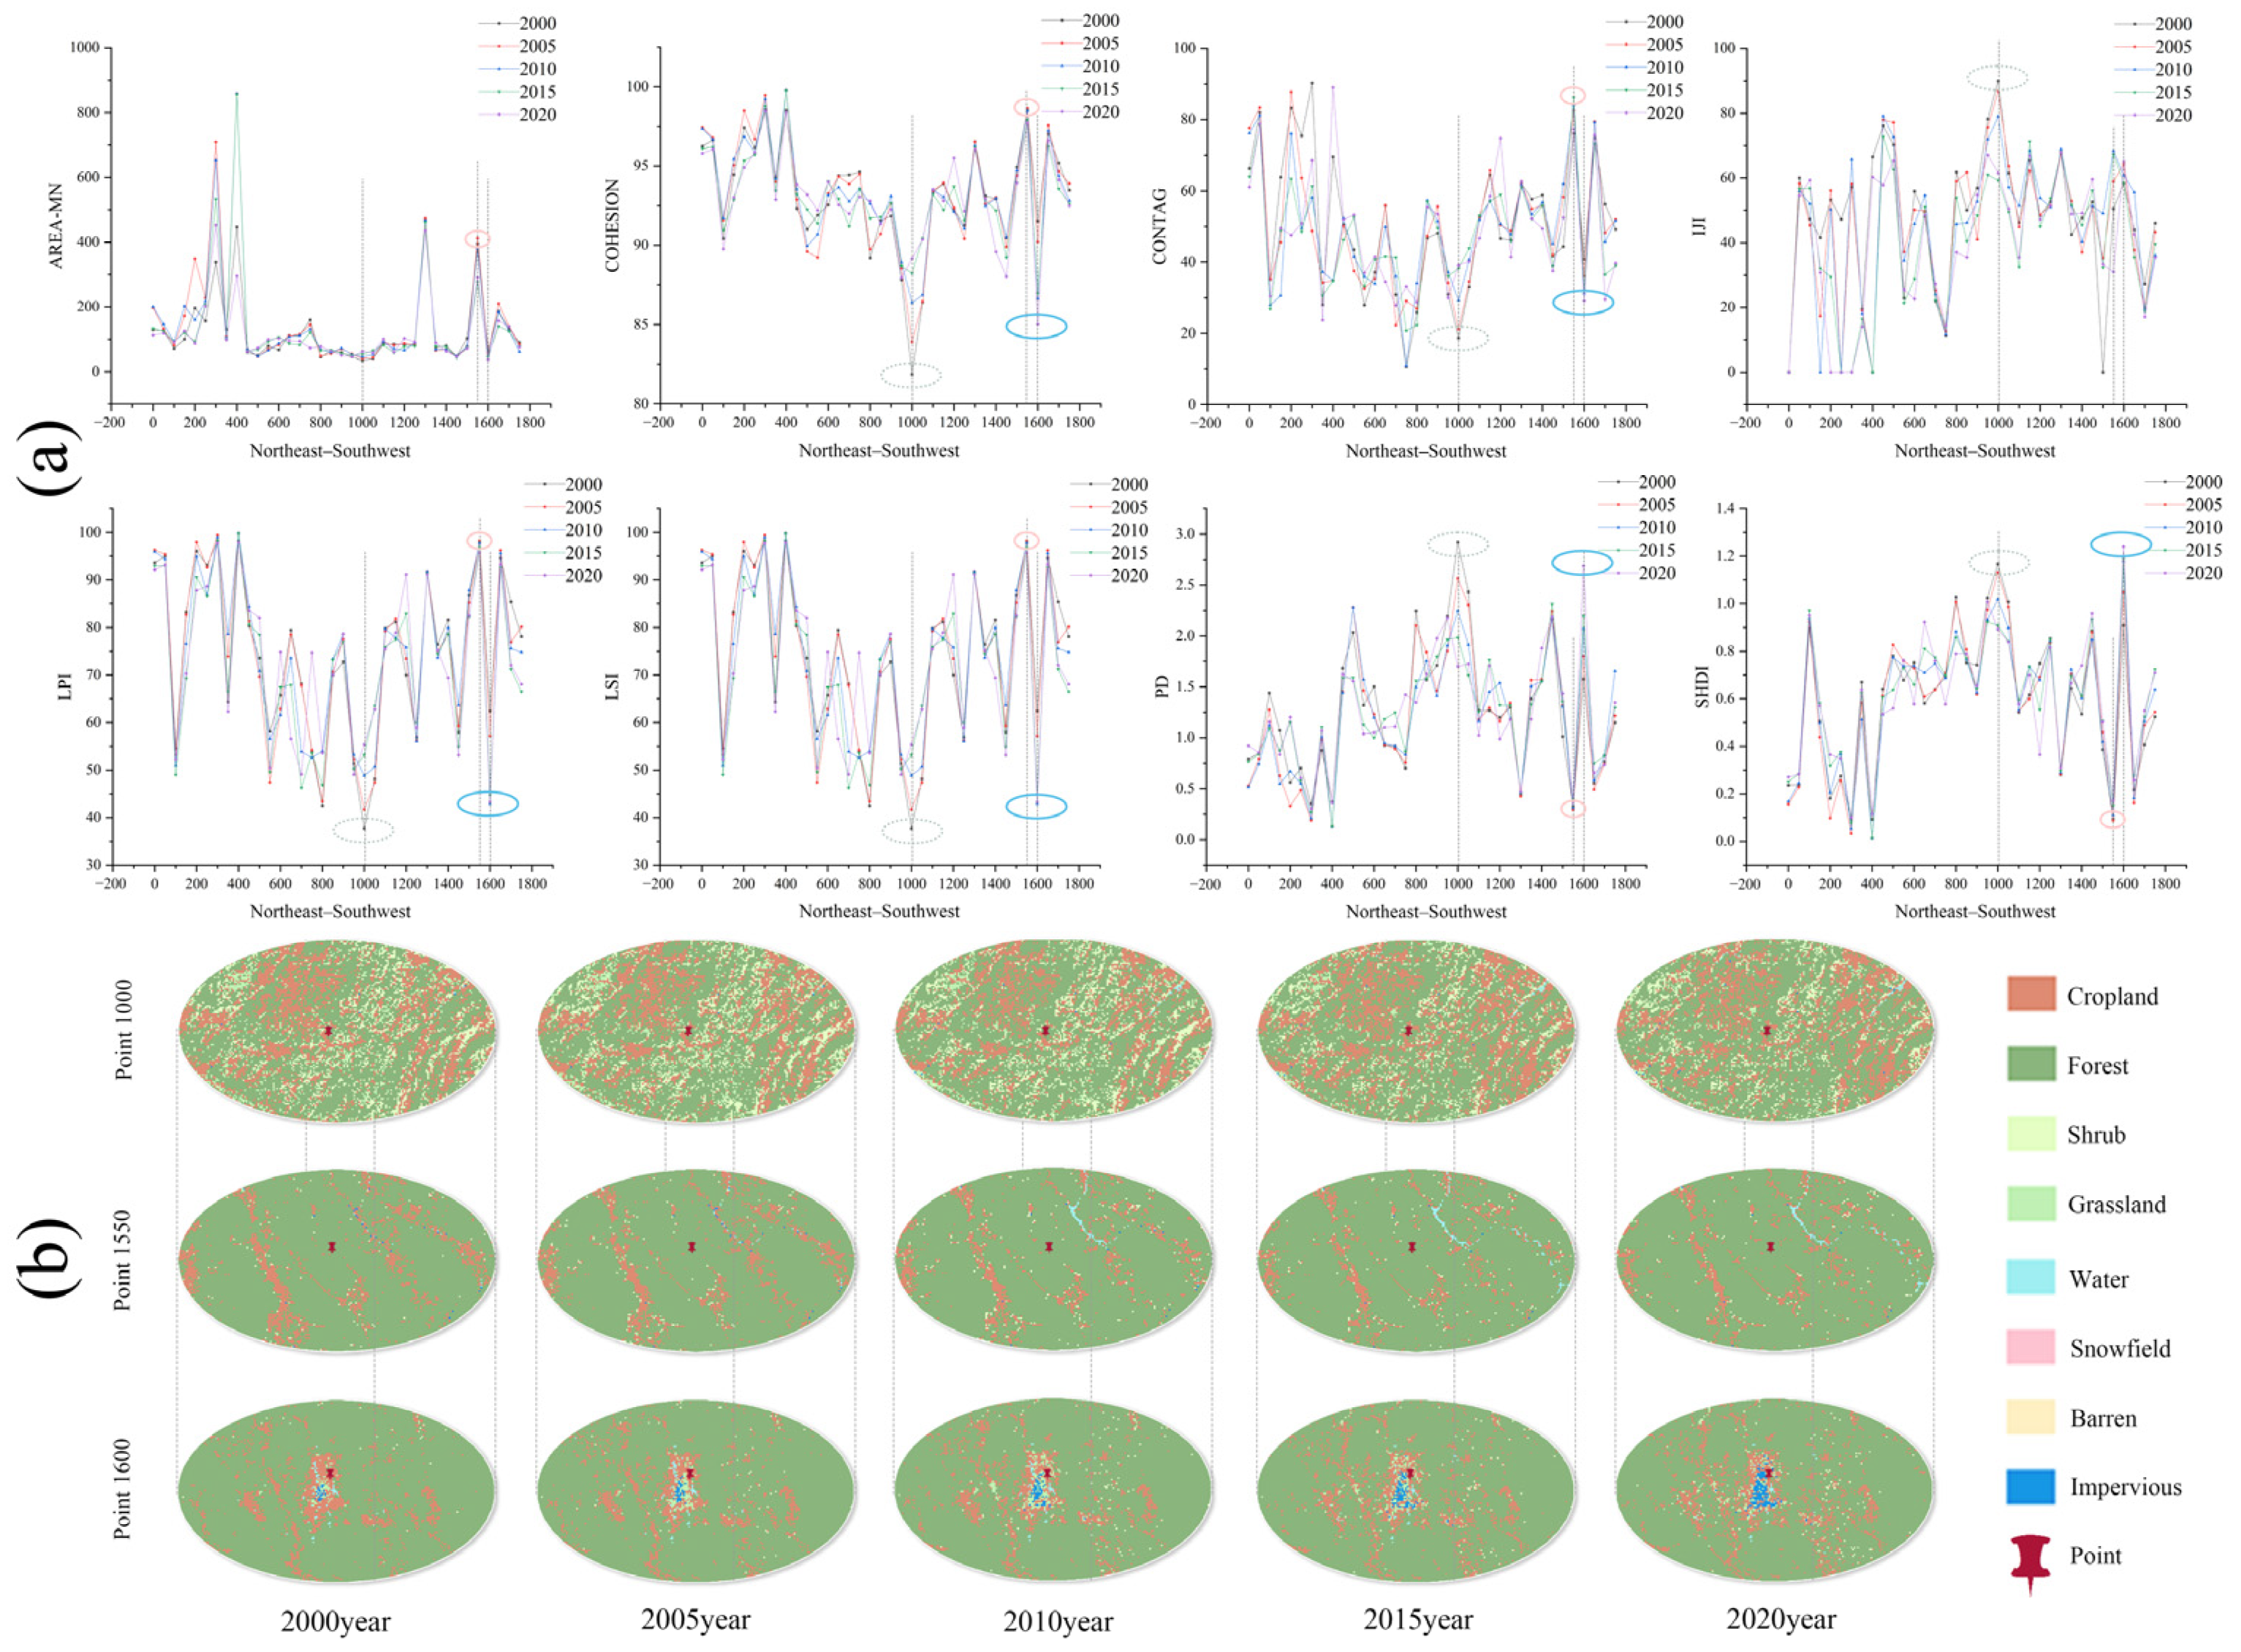
3.1.3. Temporal Evolution of Landscape Pattern

Landscape-Level Index Analysis

Fragstats4.2 software is used to calculate the five-year landscape pattern level index, and the change trends for the eight indexes are obtained (Table 6, Figure 9). In 2015, the PD is the largest, and the AREA-MN is the smallest. During this period, the degree of landscape fragmentation in the Yun–Gui Plateau is the strongest, which, to a certain extent, reflects the impact of human activities on the landscape pattern. Over the past 20 years, the LSI has tended to be irregular, the PD has decreased, the AREA-MN has increased, and the degree of landscape fragmentation has decreased. These results differ from those of Jiang, who has reported that the degree of fragmentation gradually increased [32]. This is because the scale used in that study is different. Therefore, an appropriate scale is extremely important for the study of landscape patterns. The CONTAG and COHESION increased, and the connectivity of similar patches of various landscape types in the Yun–Gui Plateau increased. The IJI changed significantly, and the overall trend is of a decrease, indicating that each landscape’s distribution is gradually dispersed. The LPI increased, and the dominant landscape patches at the site are still woodland. The SHDI decreased, and the landscape heterogeneity slowed down.

Plaque-Type Level Index Analysis

Table 7 and Figure 9 show that the proportions of grassland, shrubland, and barren area to the total area decreased, and the proportions of other land types to the total area increased. The landscape type with the largest proportion of the total area is forest, and that with the smallest is snowfield. The impervious, shrubland, and snowfield landscapes changed dramatically in 2010–2020. Observing the LPI for each landscape, it can be found that, from 2000 to 2010, the LPI for forest increased significantly, and its advantages in the various types of landscapes are clear. In 2020, with the construction of urban areas, impervious areas continued to expand into other landscape types, resulting in the LPI for impervious areas increasing to twice its size in 2000. The increase in LPI for snowfield between 2010 and 2020 is due to the policy protecting glaciers and permanent snow cover proposed in 2011. The LSI for cropland, forest land, water, and impervious land increased, and the shape of the landscape types tended toward complexity [33], with the shapes of shrubland and grassland tending to be regular. The DIVISION index shows that the landscape patches of shrub, grassland, water, snowfield, barren, and impervious are fragmented and that of the forest landscape is more aggregated than the other landscape patches.

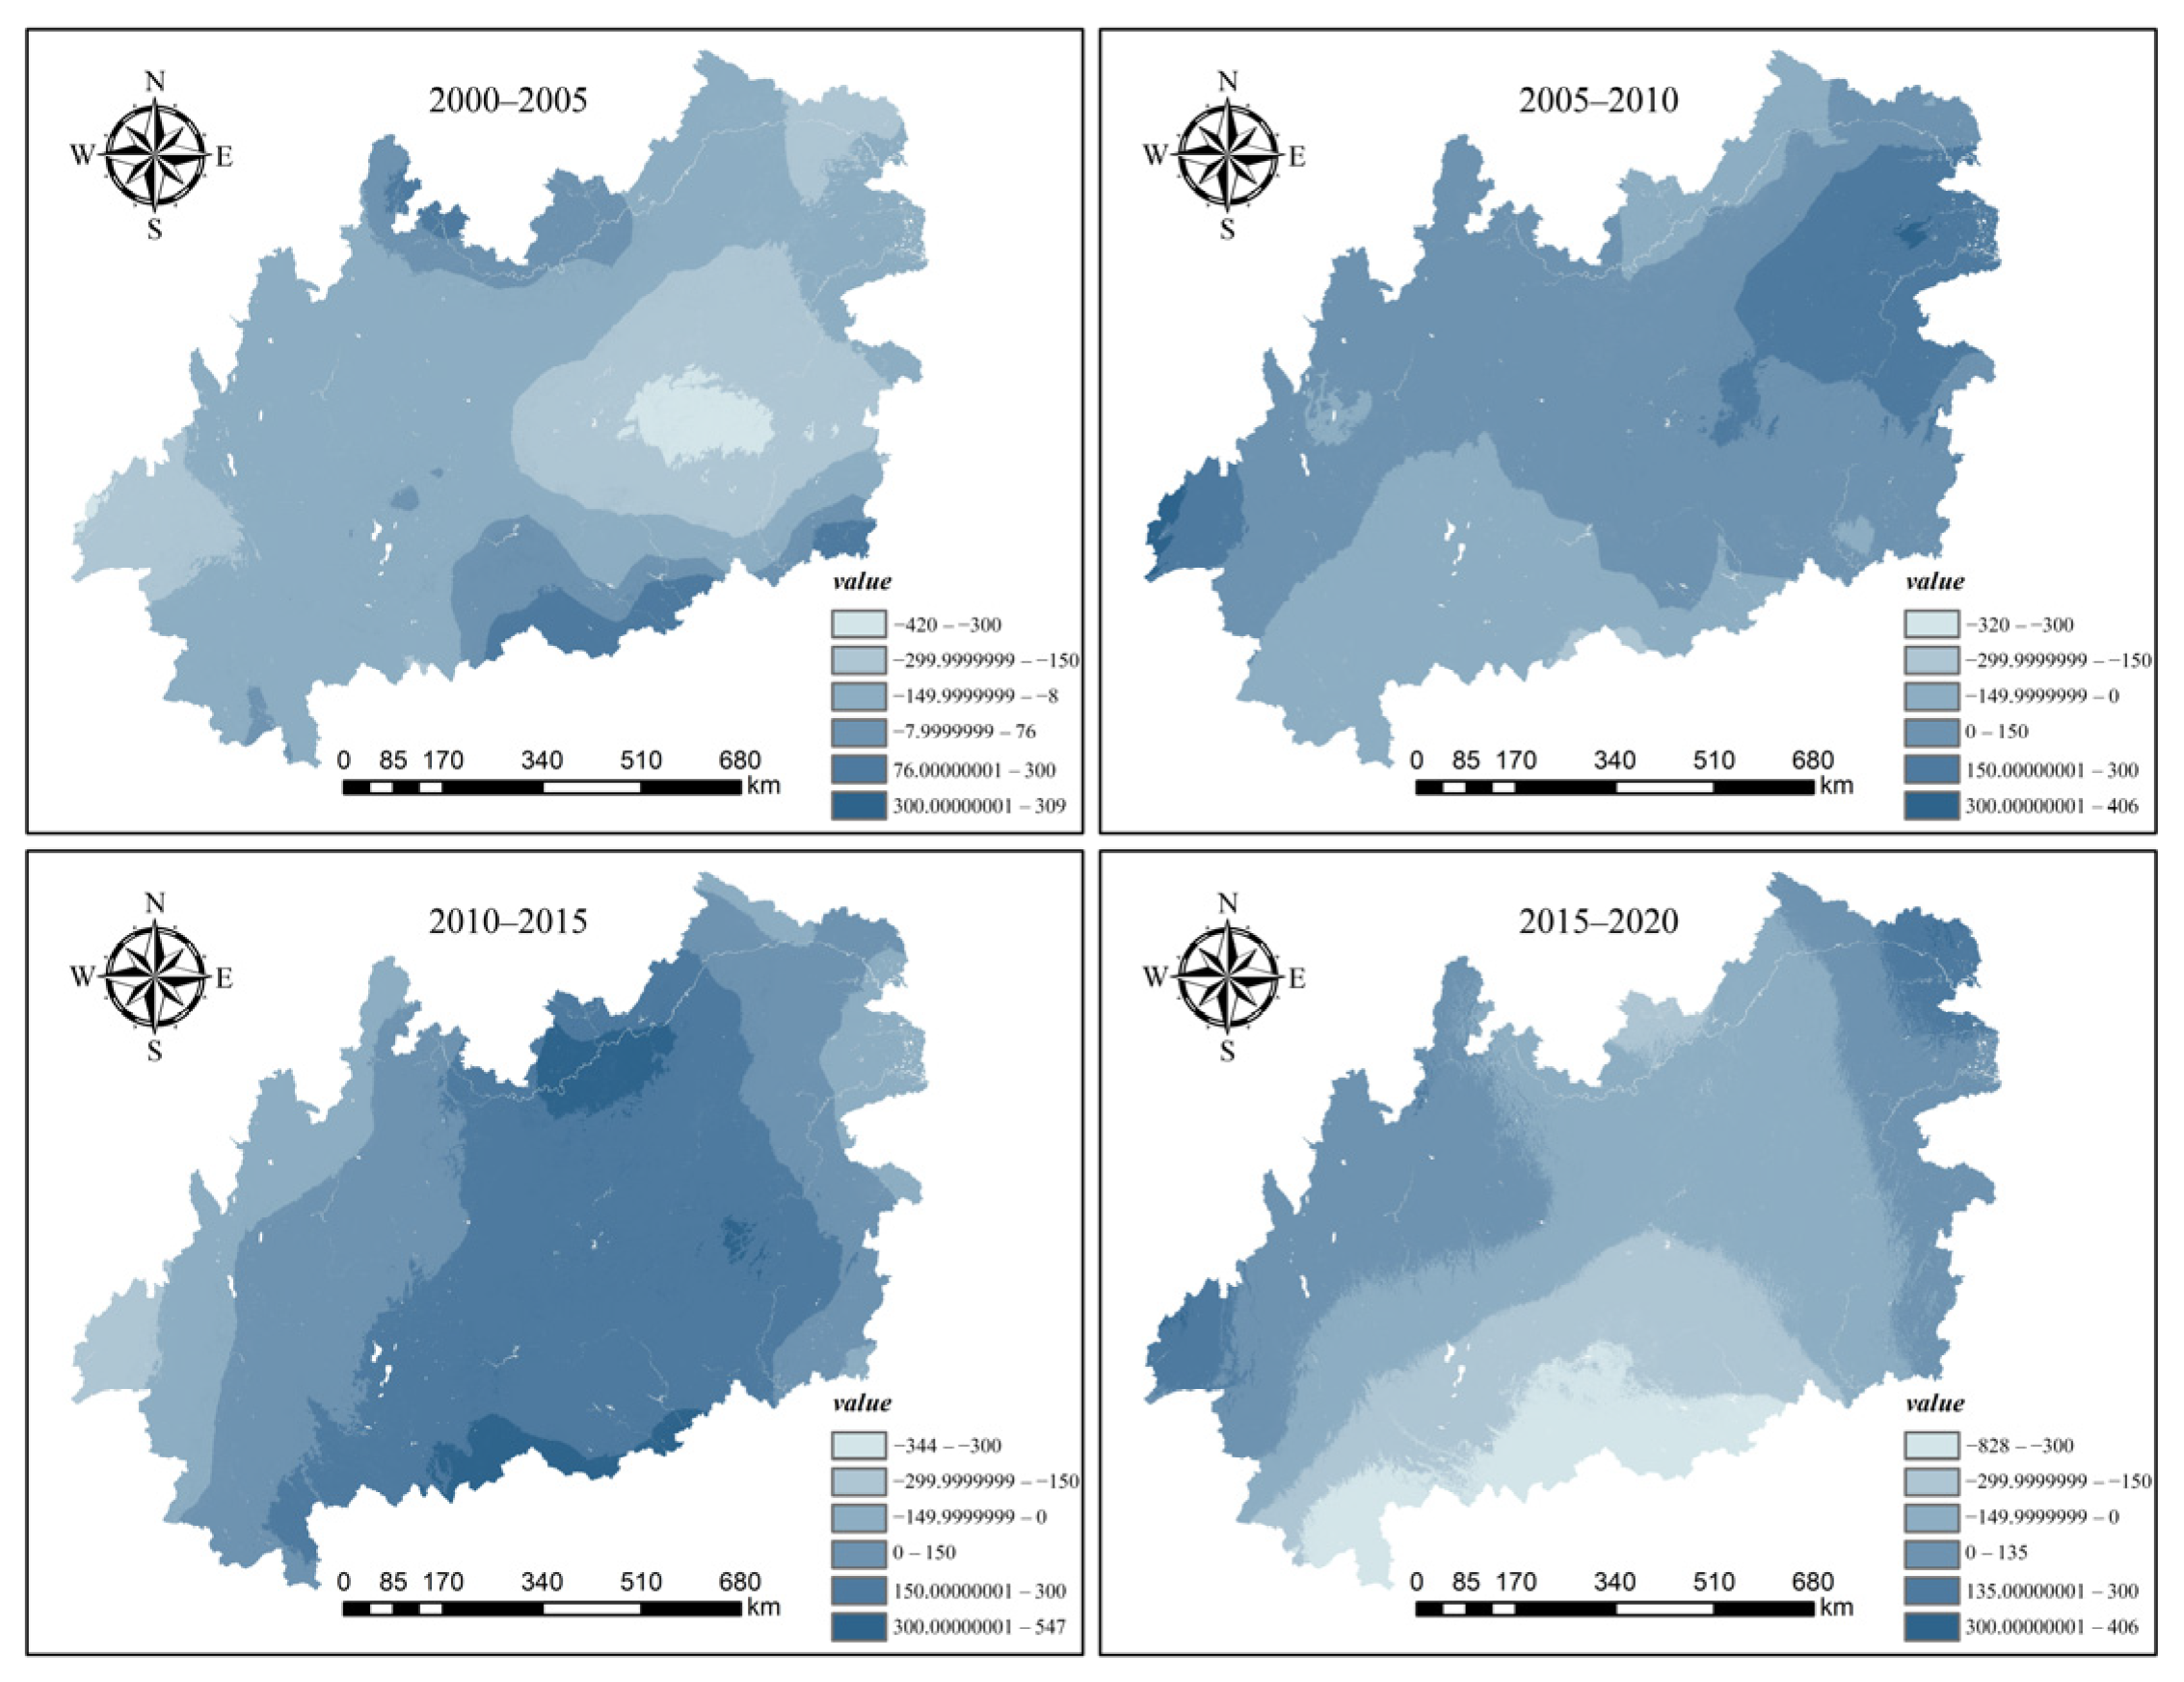
3.1.4. Spatial Evolution of Landscape Pattern

The landscape pattern analysis is carried out on a grid with a scale of 3000 m, and the landscape pattern index for each grid is calculated to obtain the following landscape pattern change map (Figure 10). The high values for AREA_MN and LPI are mainly distributed around the study area, and their central values are low. The AREA_MN and LPI for Yichang city, Zhangjiajie city, Shaoyang city, and Guilin city on the eastern side of the Yun–Gui Plateau gradually decreased. Urban expansion occupied the other land types, which caused the patch areas for each landscape type in the region to decrease and the degree of landscape fragmentation to increase, with the LPI in the northeast of Chongqing changing dramatically. The CONTAG in Leshan city, Yibin city, and Chongqing city in the north of Yun–Gui Plateau decreased year by year, the connectivity of the landscape patches decreased, and the degree of landscape fragmentation increased. In general, the IJI is significantly different on the east and west sides. The karst landform is mostly concentrated on the southwest side, which is covered by a large amount of cultivated land and forest. The IJI value is higher in the northeast and lower in the southwest. The IJI in Zunyi city, Tongren city, and other places gradually decreased, and the aggregation degree of the landscape patches is high. From 2000 to 2010, the PD in the region showed an upward trend, and from 2010 to 2020, the PD decreased significantly. The LSI value decreased in the middle of the west side of the study area and increased in other areas. The patches changed from an aggregated group to exhibiting a scattered distribution. With the intensification of human activities, the landscape patches of the Yun–Gui Plateau showed a fragmentation trend. Over the past 20 years, the effect of the climatic conditions on the riverbank’s edge have been good and suitable for human habitation. Therefore, the impervious parts of the strip of land along the Yangtze River have increased. With the area of cropland encroaching on that of forest, the SHDI value increased significantly, the landscape heterogeneity increased, and the uncertainty and diversity also increased. The remaining areas are unchanged. The overall distributions of the LSI, PD, and SHDI are similar. The areas with higher values are mainly distributed in Kunming and Qujing. With the center around which to spread, the spatial distributions gradually decreased.
On the northeast–southwest transect line, the AREA_MN, COHESION, CONTAG, LPI, and LSI indexes showed a trend of being high at both ends and low in the middle, whereas the IJI, PD, and SHDI indexes showed the opposite trend. The indexes showed obvious inflection points at 1000, 1550, and 1600. At point 1000, the COHESION, IJI, LPI, LSI, and PD peaked. The AREA_MN, COHESION, CONTAG, LPI, and LSI indexes increased yearly, whereas the PD and SHDI indexes decreased yearly. The landscape structure of this point is complex, the landscape heterogeneity is strong, and the patches tended to be fragmented. Point 1600 is similar to point 1000 but point 1600 showed more robust landscape heterogeneity. It can be seen from Figure 11 that the towns at point 1600 are expanding, the impervious area is increasing year by year, and the areas of grassland and cropland are continuously eroding, which has tended to cause the land types to fragment. Point 1000 is flat and serves as a gathering place for ethnic minority villages. There are many tourist attractions around its location, and human activities are intensive. Point 1550 is opposite of the other two points. The patches in this area are more concentrated, and the landscape types are smaller. Point 1500 is located in the east of Pu’er city. The forest coverage rate in this area is exceptionally high, surrounded by mountains, and the distribution of forest is concentrated.
The IJI generally showed a decreasing trend on the sample line. The AREA_MN index changed gently, except for two obvious changes. The COHESION, CONTAG, and LPI indexes showed a decrease–increase trend, and the other three indexes showed an increase–decrease trend (Figure 12). The peak value for the east–west line appeared at point 250. Because of the high altitude and reduced social and economic interference, the patches are relatively complete. The primary land use type is forest. The patch shape is regular, and the landscape connectivity is strong. The landscape patches at point 750 are more fragmented, and the surrounding villages are more densely populated. Therefore, cropland and forest at this point are interlaced. The maximum value of this point appeared in 2005, indicating that the complexity of the patch edge of this point is the greatest in 2005, and the degrees of landscape fragmentation and heterogeneity are the highest.
The maximum value of PD appeared at point 450 and decreased year by year. The peaks of the other indexes mostly appeared at both ends of the northwest–southeast sample line. The overall trend for each index is a “W” type (Figure 13). The landscape patches at point 50 tended to be fragmented and scattered. The impervious land area at this point expanded, human activities along the river area increased, agricultural planting behavior increased, and cropland gradually eroded the forest area. Implementing the policy of returning farmland to the forest from 2014 to 2015 has improved the above situation and increased the forest area. Point 750 is located in the national Maolan Nature Reserve, which is affected less by human activities. The connectivity among the patches is strong, the ductilities of the landscape patches are strong, and the shapes are more straightforward.

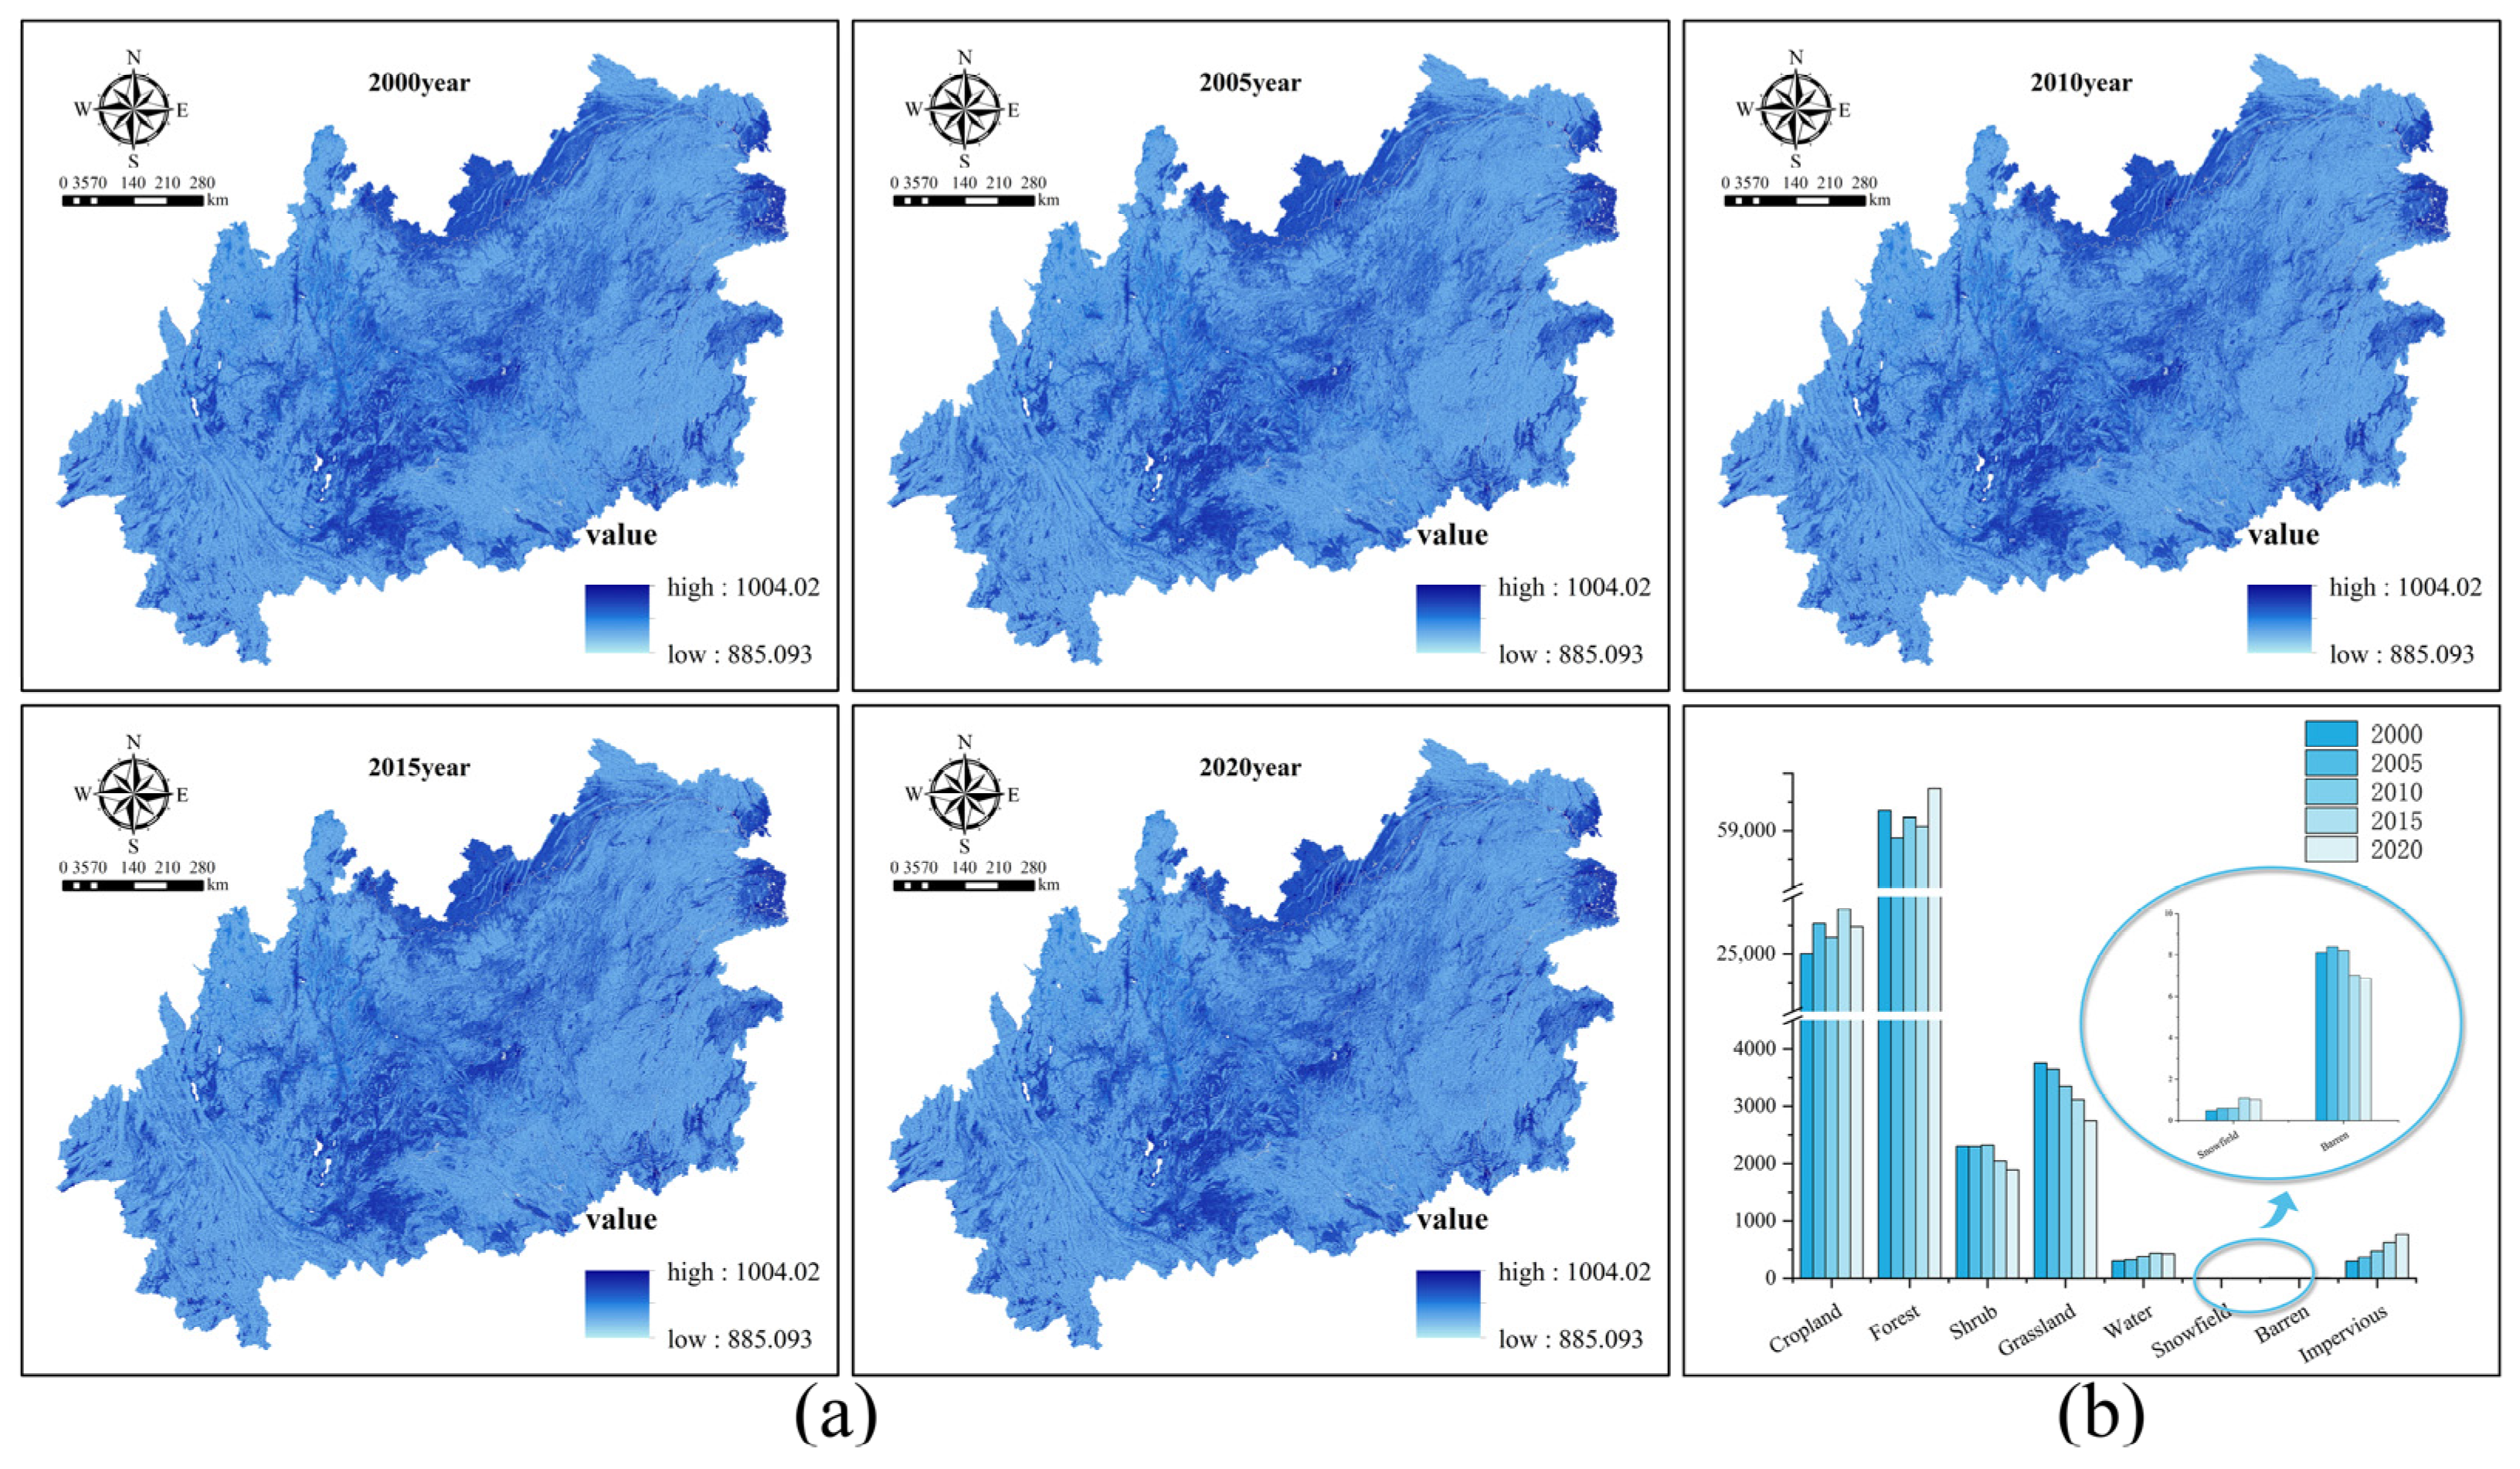
3.2. Spatio-Temporal Evolution of Surface Runoff in Yun–Gui Plateau

The monthly precipitation data set is superimposed, and the monthly precipitation data are processed using ArcGIS10.7 software to obtain the spatial distribution maps of the five-period averaged annual precipitation data from 2000 to 2020. The average annual precipitation values are 1018.28 mm, 917.04 mm, 973.77 mm, 1110.49 mm, and 1031.49 mm, respectively. The average annual precipitation for 20 years is 1010.21 mm. It can be seen from Figure 14 that the precipitation in the Yun–Gui Plateau is highly uneven in time and space. Because of the altitude and atmospheric circulation, the central and northern regions are spatially low in precipitation, and the precipitations in the eastern, southern, and western regions are high. There existed a trend of higher values in the south and lower ones in the north, and the precipitation decreased from southeast to northwest, fluctuating with the time.
The land use type data, hydrological soil type data, DEM data, and CN value index for the Yun–Gui Plateau under an AMCII state are used. Using ArcGIS10.7 and HEC-GeoHMS10.7, the distribution of the CN values in the Yun–Gui Plateau from 2000 to 2020 is calculated (Figure 15), with a range of 69–98. The CN values in the central, northern, and eastern sides of the Yun–Gui Plateau are higher. The land types in this area are impervious and cropland. The CN values for the water, barren, and snowfield land types are also higher, but they need to be more evident on the map due to the smaller distribution ranges. The larger the CN value, the stronger both the ability to form surface runoff in the region and the runoff capacity, the order is as follows: water > impervious > barren > snowfield > cropland > grassland > shrubland > forest [6].
Using the ArcGIS10.7 raster calculator, the CN values of the raster data and precipitation raster data from 2000 to 2020 are combined to calculate the surface runoff depth in the Yun–Gui Plateau over five years (Figure 16). The average annual runoff depths in the Yun–Gui Plateau from 2000 to 2020 are 942.15 mm, 841.40 mm, 897.78 mm, 1034.48 mm, and 955.28 mm. Compared with the spatial and temporal changes over the past five years, the average surface runoff depth first decreased, then increased, and then decreased again. The runoff depths on the east and southwest sides are higher, and the runoff depths in the central and western parts of the Yun–Gui Plateau are smaller.
From 2000 to 2005, only the small-scale runoff on the north and south sides increased, and the runoff in the remaining areas decreased, with the most severe decreases in the central and western regions. From 2005 to 2010, the high values of the runoff increments slowly migrated to the east and west sides, and the runoff on the north and south sides showed negative growth. From 2010 to 2015, a large area of the region showed a trend in rising surface runoff. An increase in the middle is apparent, and the increase on both sides are smaller. The main reason for this is that the overall precipitation in the region increased significantly during this period, resulting in a significant increase in runoff. From 2015 to 2020, the regional precipitation decreased significantly, which promoted the corresponding decrease in the runoff depth in central Yun–Gui Plateau during this period, and only the runoff depth on the northwest and east sides increased (Figure 17).

3.3. Response of Surface Runoff to Landscape Pattern Evolution in Yun–Gui Plateau

3.3.1. Response of Land Use Types and Surface Runoff

To further explore the response relationship between the landscape pattern and surface runoff, excluding the influence of precipitation factors on the runoff, an annual average precipitation of 1010.21 mm from 2000 to 2020 is input into the SCS-CN model (Figure 18). At this time, the change in the runoff is only related to the retention coefficient, S, that is, determined by the soil texture, DEM data, and land use type. Among these, the soil texture and DEM data are static data (i.e., fixed values), so the evolution of the landscape pattern is the only condition behind the change in the runoff generation in the time series.
Under the above conditions, runoff change maps for each land type (Figure 18) are generated. The primary sources of surface runoff in the Yun–Gui Plateau are forest and cropland, and the surface runoffs for the four land use types of water, snow, barren, and impervious accounted for a relatively small proportion. The average annual runoffs for forest and cropland in the Yun–Gui Plateau are 59,251.42 × 107 m3 and 25,416.52 × 107 m3, respectively, accounting for 93% of the total annual runoff. The forest type is characterized by strong soil and water conservation abilities, a strong ability to intercept precipitation, and a weak ability to generate runoff. However, the forest landscape area is large, so it is still the land type with the highest runoff generated in the Yun–Gui Plateau. The impervious area increased significantly year over year, and, although impervious landscape accounted for a small proportion of the total, its runoff yield capacity is strong, increasing by 464.51 × 10⁷ m3 over 20 years.

3.3.2. Response of Landscape Level Index to Surface Runoff

From the correlation analysis heat map of the landscape pattern evolution and surface runoff change (Figure 19), it can be seen that the correlation between landscape pattern evolution and surface runoff change is significant (p ≤ 0.01). The surface runoff is weakly correlated with the AREA_MN, COHESION, CONTAG, IJI, and LPI and moderately correlated with the LSI, PD, and SHDI. Over time, the AREA_MN, SHDI, COHESION, and LPI indexes have the same trends with the absolute values of the correlation indexes of the surface runoff, all of which first increased and then decreased. The SHDI, PD, LSI, and IJI indexes are positively correlated with the surface runoff (p ≤ 0.01). The AREA_MN, COHESION, CONTAG, and LPI indexes are negatively correlated with the surface runoff (p ≤ 0.01). The SHDI has the strongest correlation with the surface runoff. The correlation indexes are 0.41, 0.42, 0.43, 0.42, and 0.43 in 2000–2020, respectively. According to the change in the trend of the correlation index and the distribution of land types in the Yun–Gui Plateau, it can be found that the stronger the landscape heterogeneity, the higher the runoff yield in the Yun–Gui Plateau, the larger the proportion of forest area, and the more significant the impact on the evolution of the landscape pattern. Therefore, the forest landscape’s edges are complicated, with patch fragmentation also increasing the runoff. In follow-up ecological management and urban construction, we can start by improving the landscape fragmentation among the various types, enhancing the connectivity of the forest patches, and effectively reducing the generation of runoff.

3.3.3. Response of Patch Type Level Index to Surface Runoff

In previous studies, it can be seen that the snowfield and barren areas accounted for a small proportion of the total area of the Yun–Gui Plateau, and the proportion of runoff output is also small. Compared with the other land types, they fluctuated little year by year. Therefore, this study analyzed the landscape pattern evolution of snowfield and barren areas and the runoff response. According to the heat map of the correlation analysis between the evolution of the horizontal pattern of patch types and the change in surface runoff (Figure 20), it can be seen that the most obvious correlations between the evolution of the landscape pattern and the change in the surface runoff are for forest and cropland, followed by impervious.
In the cropland landscape, the correlation between the PLAND index and the surface runoff change in the region is the strongest. The runoff change is significantly positively correlated with the PLAND, LSI, and LPI indexes (p ≤ 0.01) and significantly negatively correlated with the DIVISION index (p ≤ 0.01). The correlations between the PLAND, LPI, and DIVISION indexes and the surface runoff change first increased and then decreased, and they are strongly correlated. Combined with the transfer of cropland, it can be found that there are more mutual conversions between cropland and forest. In contrast, the CN value of the cropland is larger, the runoff production capacity is stronger, and the water conservation capacity is weaker than that of forest. Therefore, the increase in the proportion of cropland area and the connectivity of cropland patches will increase the runoff produced.
The runoff change in the forest landscape is significantly negatively correlated with the PLAND and LPI indexes (p ≤ 0.01) and significantly positively correlated with the LSI and DIVISION indexes (p ≤ 0.01). The correlation with the LPI index is the strongest, showing a fluctuating change that first increased and then decreased. The change in the surface runoff is strongly correlated with the PLAND, LPI, and DIVISION indexes. It is also correlated with the LSI, indicating that the worse the connectivity of the forest patches and the greater the degree of landscape fragmentation, the worse the ability to intercept precipitation, and the water conservation ability of forest land will also weaken, increasing the surface runoff.
The change in the surface runoff for the impervious landscape is moderately correlated with the landscape pattern index. Among these, there is a significant positive correlation with the PLAND, LSI, and LPI indexes (p ≤ 0.01) and a significant negative correlation with the DIVISION index (p ≤ 0.01). It can be seen from Figure 20 that the more obvious the dominance of the impervious landscape patches, the higher the degree of patch aggregation and the higher the surface runoff yield. Because of the unique materials composing impervious urban surfaces, the rainwater infiltration capacity can be strengthened, and, for most land types, such as precipitation on impervious landscapes, are converted to surface runoff. In addition, the irregular shape of the edges of the impervious landscape will also lead to an increase in the runoff yield for this land type.
The correlations between the change in the landscape pattern indexes for shrubland, grassland, and water and the change in the surface runoff are weak and negatively correlated with the DIVISION index (p ≤ 0.01) and positively correlated with PLAND, LSI, and LPI indexes (p ≤ 0.01). With the influence of urban construction and human activities, the edge shapes of the shrubland and grassland tended to be complex, leading to a decrease in the water conservation capacity, with the increase in the patch area to the total landscape area leading to increased runoff.

3.4. Analysis of Policy Factors Affecting the Spatial and Temporal Evolution of Surface Runoff in the Yun–Gui Plateau

The evolution of the landscape pattern is closely related to the promulgation of policies and regulations, and changes in the landscape pattern will result in changes in the surface runoff to a certain extent. Over the past 20 years, the southern karst area has faced a growing contradiction between people and land, outstanding difficulties related to rocky desertification, and ecological vulnerabilities with soil and water losses. For this reason, the state has promulgated many policies in the southern karst area to repair the ecology (Table 8).
At the end of the 20th century, the “Poverty Alleviation and Development Plan” was launched. Social and economic construction activities have led to deforestation caused by humans and reclamation of land, and the forest area has declined sharply.
After recognizing the serious nature of the ecological destruction, and with the support of central and local governments and multisectoral cooperation, a number of ecological restoration projects were implemented in 2000 to 2005 to strengthen ecological protection and restoration. In view of the need to control the rocky desertification, projects to promote mountain ecological agriculture and characteristic agriculture were developed, and fast-growing plant cultivation was carried out to solve the water shortage and poorly suited vegetation problems in karst areas. However, the lag in the implementation of policy has led to a decrease in the forest area, which has weakened the region’s ability to intercept precipitation. The precipitation decreased in the same period, so the runoff decreased in this stage.
From 2005 to 2010, the “Karst Rocky Desertification Comprehensive Management Planning Outline (2006–2015)” was launched, and ecological restoration measures such as the pilot project for the comprehensive management of rocky desertification in the county, the project closing hillsides to facilitate afforestation, and the prevention and control of soil and water losses were started. Slope farmland management, vegetation restoration, and other treatment technologies were developed. This first increased the forest area and enhanced its ability to conserve soil and water. In 2006, China launched the rural tourism theme of “new countryside, new tourism, new experience, and new fashion”. This has brought new development opportunities to the underdeveloped parts of the karst area. The unique natural landscape of the karst area attracts a large number of tourists, and tourism development accelerates the pace of urbanization. The expansion of scenic spots and the construction of supporting facilities have increased the impervious area. At the same time, rainfall, as the main factor in runoff control, surged in this stage, resulting in an increase in the runoff.
From 2010 to 2015, China’s construction land expanded in the central and western regions, and the population of the urban agglomeration in central Yunnan increased sharply. The high population density in the central and western regions led to urban expansion and increased urban impervious areas, whereas the low permeability of the underlying surface in urban areas enhanced the regional runoff generation capacity. The precipitation increased during the same period, which promoted the increase in regional runoff. In 2013, the National Karst Rocky Desertification Control Engineering Technology Research Center was established. To organize and carry out scientific investigations and technical research, Shi Bing Karst was declared a world natural heritage site. Close attention should be paid to comprehensively improving the environment and ecology of the nominated area.
Local governments should strengthen publicity and education to form a social consensus that supports karst areas’ environmental protection. In 2014, the “National Ecological Protection Red Line” was released, emphasizing the protection of key areas that supply ecological services. The policy played an effective role from 2015 to 2020. Since then, ecological restoration and management projects have been continuously promoted. Policies and regulations have been issued, such as the “13th Five-Year Plan for Ecological Construction in Guizhou Province” and the “Development Plan for the Open Economic Belt Along the Border of Yunnan Province (2016–2020)”. To promote ecological management, afforestation, soil erosion control, and comprehensive management of rocky desertification should be vigorously carried out. In 2017, the project to revert farmland to forest and grassland continued to progress. The forest areas in the Yunnan and Guizhou plateaus, the landscape connectivity, and regional water storage and water retention capacities increased, and the precipitation decreased during the same period. The interaction between the two led to a decrease in regional runoff.

4. Discussion

4.1. Analysis of Spatial and Temporal Evolution of Landscape Pattern and Surface Runoff

From the perspective of landscape patterns, forest and cropland are the main land types in the southern karst area [34]. This study selected a landscape index, from multiple angles according to the evolutionary characteristics of the landscape pattern, and the key landscape pattern index through VIF. The degree of landscape heterogeneity in the southern karst area slowed down, whereas the forest landscape is more aggregated than other landscape patches [35]. The policy of reverting farmland to forest led to the conversion of a large amount of cropland into forest and impervious lands. The degree of cropland fragmentation has increased, and the connectivity among cropland patches has weakened. This finding is consistent with the results of Yue’s research [36]. The results for the runoff yield capacity of each landscape type in the southern karst area are in the following order: impervious > cropland > grassland > shrubland > forest. Consistent with research by Wang and Ma [6,37], the precipitation in the water area, except for evaporation, is converted into surface runoff, and, although the soil compactness values for the two land types of barren and snowfield are higher, infiltration by rainwater is lower, the interception capacity of the surface runoff is poor, and the runoff yield capacity is second only to impervious. The cropland and forest land with the largest areas form the main body of runoff in the Yun–Gui Plateau. Because of the poor permeability of impervious land, the surface runoff increased greatly with the increase in area. The study did not combine the current topography of the Yun–Gui Plateau and the measured rainfall data and runoff data to modify the SCS-CN model, and the simulation of the surface runoff was at the standard level. In addition, only one surface runoff calculation method was used to simulate the surface runoff. The calculation results are singular and lack comparative verification. In future research, multiple surface runoff simulation methods (such as SWAT) can be used for comparative verification to improve the reliability of the results. The measured precipitation data can be used to improve the accuracy of the surface runoff simulation results, and the model can be modified according to local conditions to improve applicability.

4.2. Response of Spatio-Temporal Evolution of Surface Runoff to Landscape Pattern and Policy

The widely distributed forest and cropland in the karst area of southern China have a strong ability to intercept precipitation, which reduces the generation of runoff, whereas the impervious land showed a continuous growth trend, which affects infiltration of the underlying surface and enhances surface runoff. However, the layout of the drainage pipe network in the underlying surface of the city has not been specifically analyzed. Surface runoff is negatively correlated with the aggregation degree of patches (COHESION), and positively correlated with patch density (PD) and shape (LSI). The stronger the connectivity of the patches, such as with the forest and cropland, the lower the runoff, and the more broken the patches, the more favorable the runoff [38]. Runoff is positively correlated with the overall dispersion (IJI) of each landscape patch type [39]. Different from Zhu’s study, the runoff is negatively correlated with the landscape spread index (CONTAG), probably because the best scale to conduct research on the Yun–Gui Plateau is 3000 m. Using this scale, the accuracy of the site is better, and the increase in the connectivity of the forest can enhance the water conservation capacity and reduce the surface runoff. As the largest land type in the Yun–Gui Plateau, the negative correlation has a large range of influence, which causes the CONTAG index for the whole landscape to be negatively correlated with the surface runoff. To improve the regional ecological situation and solve the contradiction between humans and land while overcoming the difficulty of rocky desertification, response policies issued by central and local governments in China should continue to result in changes in the landscape pattern which, in turn, will affect the spatial and temporal evolution of runoff. In a follow-up study, the quantitative analysis of policy factors can be more stable, more accurate and more intuitive to obtain the impact of policy factors on surface runoff. In terms of correlation fitting, more appropriate and novel methods can be found for verification, or a variety of methods can be used to compare and discuss their response modes to further analyze the coupling relationship between the spatial and temporal evolution of the surface runoff and landscape pattern and policy.

4.3. Suggestions for Future Mitigation of Surface Runoff

Yun–Gui Plateau is the leading area distributing karst in the south. Multiple factors lead to soil erosion and rocky desertification, and there exists a contradiction between people and land. To alleviate the above problems, the following suggestions are put forward for the Yun–Gui Plateau:
  • Forest and cultivated lands have a good capacity to intercept runoff, so we should pay attention to the protection of forest land. The development of the local economy should pay attention to industrial selection, reasonably control industrial pollution, adjust industrial modes, develop organic agriculture, improve the regional environment, increase the forest area and connectivity, strengthen the forest water storage and water retention capacities, reduce soil erosion, improve soil quality, promote green low-consumption ecotourism industry, establish a green financial model, promote the coordinated development of ecological resource protection and utilization strategies, and promote the concept of ecological civilization.
  • Impervious landscapes have strong runoff capacities. To reduce the surface runoff in the Yun–Gui Plateau, urban development should promote compact cities, develop land-saving models, erect high-rise buildings, and promote vertical urban development. Urban expansion should not destroy the connectivity of other landscape patches with impervious surfaces, resulting in patch fragmentation and affecting the water conservation capacity of the landscape.
  • For forest areas, which have a strong runoff interception capacity, relevant environmental protection policies should be introduced and implemented in karst areas. According to the current regional development situation and central policy, the Yun–Gui Plateau should be managed as a whole. It is necessary to establish the concepts of ecological protection and ecological governance, increase publicity related to forest protection, formulate prevention and control programs for ecological problems, and comprehensively consider various factors, such as the social economy and nature, to continuously promote ecological restoration in rocky desertification areas.
  • As the source of the Yangtze River Basin and the Pearl River Basin, the ecological protection of the Yun–Gui Plateau has made an important contribution to the development of the middle and lower reaches of the basin. According to the principle of “beneficiaries pay, protectors get compensation,” central or local governments should provide diversified comprehensive ecological compensation through financial subsidies, industrial support, technical support, and other means to mobilize the enthusiasm of residents of the Yun–Gui Plateau to participate in forest protection.

5. Conclusions

Natural succession, social development, human activities, and policy influences have changed the landscape pattern and indirectly affected regional runoff. In this study, the surface runoff response relationship of the landscape pattern evolution in the karst area of southern China is analyzed by simulating the surface runoff in the Yun–Gui Plateau. The following conclusions are drawn:
  • The area of each land type in the Yun–Gui Plateau, from large to small, is forest > cropland > grassland > shrubland > water > impervious > barren > snowfield. The impervious area increased year over year, and the area of grassland decreased yearly. The landscape heterogeneity of the Yun–Gui Plateau is reduced. Forest is the dominant landscape type patch, and its distribution is more aggregated. The complexity of the forest patch shape increased. Except for shrubland and grassland, the shapes of the other landscape patches are irregular.
  • The spatial and temporal distributions of the surface runoff are significantly different. The surface runoff interception capacity of the forest is the strongest. However, because of the large cultivated and forest areas, the proportion of surface runoff is relatively large. Urban expansion causes the impervious area to increase, which significantly enhances the runoff yield in the Yun–Gui Plateau.
  • The study found that the higher the degree of aggregation of the impervious patches, the higher the regional runoff yield. Enhancing the connectivity of forest patches and promoting the complete and centralized development of forest patches can effectively reduce runoff in the Yun–Gui Plateau.
  • Central and local policies promoted the evolution of the regional landscape pattern and affected temporal and spatial changes in the runoff.

Author Contributions

Conceptualization, C.C. and L.L.; methodology, H.X.; software, H.X.; validation, H.X. and C.C.; formal analysis, L.L.; investigation, Q.L. and X.H.; resources, C.C. and X.H.; data curation, H.X.; writing—original draft preparation, H.X.; writing—review and editing, H.X., C.C. and X.H.; visualization, H.X.; supervision, B.W. and Q.L.; project administration, C.C., B.W. and Q.L.; funding acquisition, C.C. and L.L. All authors have read and agreed to the published version of the manuscript.

Funding

Hunan Social Science Achievements Evaluation Committee Project (XSP24YBC302), the National Natural Science Foundation of China (31901363), the key disciplines of the State Forestry Administration (Lin Renfa [2016] No. 21), and the Hunan Province “Double First-Class” Cultivation Discipline (Xiang Jiao Tong [2018] No. 469).

Institutional Review Board Statement

Not applicable.

Informed Consent Statement

Not applicable.

Data Availability Statement

Data are contained within the article.

Conflicts of Interest

The authors declare that they have no known competing financial interest or personal relationships that could have appeared to influence the work reported in this paper.

References

  1. Li, Y.; Xiong, K.; Liu, Z.; Li, K.; Luo, D. Distribution and influencing factors of soil organic carbon in a typical karst catchment undergoing natural restoration. Catena 2022, 212, 106078. [Google Scholar] [CrossRef]
  2. Xiong, K.; Chen, Q. Discussion on the evolution law and trend of rocky desertification based on comprehensive ecological management. Karst China 2010, 29, 267–273. [Google Scholar]
  3. Jin, A.; Xiong, K.; Hu, J.; Lan, A.; Zhang, S. Remote Sensing Ecological Quality and Its Response to the Rocky Desertification in the World Heritage Karst Sites. Land 2024, 13, 410. [Google Scholar] [CrossRef]
  4. Chen, Q.; Lu, S.; Xiong, K.; Zhao, R. Coupling analysis on ecological environment fragility and poverty in South China Karst. Environ. Res. 2021, 201, 111650. [Google Scholar] [CrossRef] [PubMed]
  5. Ao, L.; Jiang, C.; Xu, Q. Effects of rock surface morphology on runoff and sediment yield in the southwest karst slope. Study Soil Water Conserv. 2023, 30, 52–60. [Google Scholar]
  6. Wang, D.; Wu, L.; Feng, Z.; Mu, T.; Wu, P. Study on the influence of land use change on surface runoff in Guizhou Province since 1995. J. Guizhou Norm. Univ. (Nat. Sci. Ed.) 2023, 41, 44–55. [Google Scholar]
  7. Yuan, J. Optimization of SWAT Model and Spatial-Temporal Differentiation Mechanism of Runoff and Sediment Yield in Karst Watershed. Master’s Thesis, Guizhou Normal University, Guiyang, China, 2023. [Google Scholar]
  8. Deng, X.; Zhou, Y.; Sun, N. Study on the Evaluation of Urban Park Landscape Pattern Index and Its Driving Mechanisms in Nanchang City. Sustainability 2024, 16, 4132. [Google Scholar] [CrossRef]
  9. Guo, Y.; Ding, W.; Xu, W.; Shao, Y.; Meng, X. Effects of Landscape Patterns on Runoff and Sediment in Danjiang River Basin. IOP Conf. Ser. Earth Environ. Sci. 2021, 826, 012019. [Google Scholar] [CrossRef]
  10. Chen, T.; Zou, L.; Xia, J.; Liu, H.; Wang, F. Decomposing the impacts of climate change and human activities on runoff changes in the Yangtze River Basin: Insights from regional differences and spatial correlations of multiple factors. J. Hydrol. 2022, 615, 128649. [Google Scholar] [CrossRef]
  11. Chen, Q. The impact of surface runoff on sediment yield in Guizhou karst landform area: A case study of Longchang small watershed in Xiuwen County. Green Sci. Technol. 2023, 25, 51–57. [Google Scholar]
  12. Bin, L.; Xu, K.; Xu, X.; Lian, J.; Ma, C. Development of a landscape indicator to evaluate the effect of landscape pattern on surface runoff in the Haihe River Basin. J. Hydrol. 2018, 566, 546–557. [Google Scholar] [CrossRef]
  13. Yang, X. Effects of a Multi-Scale Landscape Pattern on Runoff and Sediment Transport in the Loess Plateau. Ph.D. Thesis, Northwest University of Agriculture and Forestry, Xianyang, China, 2019. [Google Scholar]
  14. Gebru, B.M.; Adane, G.B.; Park, E.; Khamzina, A.; Lee, W.K. Landscape pattern and climate dynamics effects on ecohydrology and implications for runoff management: The case of a dry Afromontane forest in northern Ethiopia. Geocarto Int. 2022, 37, 12466–12487. [Google Scholar] [CrossRef]
  15. Jiang, Y.; Ji, H. Isotopic indicators of source and fate of particulate organic carbon in a karstic watershed on the Yun-Gui Plateau. Appl. Geochem. 2013, 36, 153–167. [Google Scholar] [CrossRef]
  16. Yu, L.; Zhuge, X.; Yuan, W.; Gao, N.; Li, J.; Fu, Y.; Chen, F.; Yao, B.; Tang, F.; Kan, W. Cloud characteristics over the Yunnan–Guizhou plateau as observed by MODIS and Himawari-8. Int. J. Climatol. 2023, 43, 8072–8085. [Google Scholar] [CrossRef]
  17. Ahmadi-Sani, N.; Razaghnia, L.; Pukkala, T. Effect of Land-Use Change on Runoff in Hyrcania. Land 2022, 11, 220. [Google Scholar] [CrossRef]
  18. Qu, L.; Guo, C.; Zhang, Q.; Huang, Y. Analysis of spatial-temporal characteristics and driving forces of land use transformation: A case study of Fengxian County, Jiangsu Province. Sci. Technol. Manag. Land Resour. 2023, 40, 74–90. [Google Scholar]
  19. Zhang, T.; Xu, J. Analysis of land use change and driving forces in Dongguan City from 1987 to 2021. Geospat. Inf. 2023, 21, 72–76. [Google Scholar]
  20. Sun, P.; Yi, J.; Zhou, L.; Yin, W.; Zhang, C.; Kang, Q.; Yuan, Z.; Yuan, Z. Analysis of spatial and temporal dynamic changes in land use in Danjiangkou City from 2010 to 2020. China Agric. Abstr.-Agric. Eng. 2024, 36, 56–61. [Google Scholar]
  21. Zhu, L.; Chen, C.; Peng, Y. Study on the temporal and spatial evolution model of Cropland based on LUCC intensity map. China’s Land Resour. Econ. 2024, 1–15. [Google Scholar] [CrossRef]
  22. Li, S.; Gong, J.; Yang, J.; Chen, G.; Zhang, C.; Zhang, M. Characteristics of Land Use/Cover Change Patterns in Lanxi Urban Agglomeration—Based on Intensity Analysis Framework. Resour. Sci. 2023, 45, 480–493. [Google Scholar]
  23. Wang, Q.; Zhang, P.; Chang, Y.; Li, G.; Chen, Z.; Zhang, X.; Xing, G.; Lu, R.; Li, M.; Zhou, Z. Landscape pattern evolution and ecological risk assessment of the Yellow River Basin based on optimal scale. Ecol. Indic. 2024, 158, 111381. [Google Scholar] [CrossRef]
  24. Li, D.; Ding, S.; Liang, G.; Zhao, Q.; Tang, Q.; Kong, L. Analysis of landscape heterogeneity in mountainous and hilly areas of western Henan based on the moving window method. Ecology 2014, 34, 3414–3424. [Google Scholar]
  25. Cai, Y.; Cui, T.; Liu, Z.; Wei, Y. Impact of landscape pattern on collapsing gully erosion in typical red soil region of southern China. Acta Ecol. Sin. 2024, 44, 2817–2825. [Google Scholar] [CrossRef]
  26. Shi, Y.; Fan, X.; Ding, X.; Sun, M. Ecological Restoration of Habitats Based on Avian Diversity and Landscape Patterns—A Case Study of Haining Mining Pit Park in Zhejiang, China. Sustainability 2024, 16, 1445. [Google Scholar] [CrossRef]
  27. Hu, J.; Zhang, J.; Li, Y. Exploring the spatial and temporal driving mechanisms of landscape patterns on habitat quality in a city undergoing rapid urbanization based on GTWR and MGWR: The case of Nanjing, China. Ecol. Indic. 2022, 143, 109333. [Google Scholar] [CrossRef]
  28. Cai, X.; Xu, D. Simulation and Optimization Strategy of Storm Flood Safety Pattern Based on SCS-CN Model. Int. J. Environ. Res. Public Health 2022, 19, 698. [Google Scholar] [CrossRef] [PubMed]
  29. Wang, J.; Ding, J.; Zhang, C. Research progress of universal rainfall-runoff model SCS-CN. Rural. Water Conserv. Hydropower China 2015, 11, 43–47. [Google Scholar]
  30. Li, T.; Chen, C.; Li, Q.; Liu, L.; Wang, Z.; Hu, X.; Thapa, S. Evolution Characteristics of Landscape Patterns and the Response of Surface Runoff in a Rapid Urbanization Area: Focus on the Chang–Zhu–Tan Metropolitan Area of China. Water 2023, 15, 3467. [Google Scholar] [CrossRef]
  31. He, J.; Li, W.; Zhang, D.; Gao, R. Correlation analysis between grounding resistance and soil volumetric water content based on Spearman correlation coefficient. Mt. Meteorol. 2024, 48, 86–90. [Google Scholar]
  32. Ying, B.; Liu, T.; Ke, L.; Xiong, K.; Li, S.; Sun, R.; Zhu, F. Identifying the Landscape Security Pattern in Karst Rocky Desertification Area Based on Ecosystem Services and Ecological Sensitivity: A Case Study of Guanling County, Guizhou Province. Forests 2023, 14, 613. [Google Scholar] [CrossRef]
  33. Jiang, M. Spatio-Temporal Changes and Driving Factors of Ecosystem Service Function in Southwest Karst Area. Ph.D. Thesis, Huazhong Agricultural University, Wuhan, China, 2022. [Google Scholar] [CrossRef]
  34. Ma, G.; Li, Q.; Yang, S.; Zhang, R.; Zhang, L.; Xiao, J.; Sun, G. Analysis of Landscape Pattern Evolution and Driving Forces Based on Land-Use Changes: A Case Study of Yilong Lake Watershed on Yunnan-Guizhou Plateau. Land 2022, 11, 1276. [Google Scholar] [CrossRef]
  35. Hou, W.; Gao, J. Spatially Variable Relationships between Karst Landscape Pattern and Vegetation Activities. Remote Sens. 2020, 12, 1134. [Google Scholar] [CrossRef]
  36. Li, Y.; Geng, H. Evolution of Land Use Landscape Patterns in Karst Watersheds of Guizhou Plateau and Its Ecological Security Evaluation. Land 2022, 11, 2225. [Google Scholar] [CrossRef]
  37. Ma, L.; Wang, C.; Wang, W.; Zhang, L.; Huang, H.; Zhang, S. Study on regional runoff characteristics of Zhengzhou City based on SCS-CN model. Soil Water Conserv. Bull. 2022, 42, 203–209 + 381. [Google Scholar]
  38. Xu, Y.; Zhu, Y.; Tian, G.; Li, H.; Dong, N. Effect of landscape pattern evolution on surface runoff in Zhengzhou. J. Henan Agric. Univ. 2023, 57, 96–108. [Google Scholar]
  39. Zhu, Y.; Zhang, Y.; Xu, Y.; Tian, G. Impact of landscape pattern on surface runoff in Dengfeng City based on SCS model. J. Water Ecol. 2022, 45, 63–72. [Google Scholar] [CrossRef]
Figure 1. Range of Yun–Gui Plateau.
Sustainability 16 07338 g001
Figure 2. Technical flow chart. Note, for the two-tailed test, the correlation is significant at the 0.01 level.
Sustainability 16 07338 g002
Figure 3. Map of land use intensity.
Sustainability 16 07338 g003
Figure 4. Sample selection diagram.
Sustainability 16 07338 g004
Figure 5. Trend chart of spatial heterogeneity characteristic value of landscape pattern index in Yun–Gui Plateau from 2000 to 2020.
Sustainability 16 07338 g005
Figure 6. Land use structure map of the Yun–Gui Plateau from 2000 to 2020.
Sustainability 16 07338 g006
Figure 7. Land use transfer chord diagram of Yun–Gui Plateau from 2000 to 2020 (upper). Area change diagram of each land use type in Yun–Gui Plateau (lower).
Sustainability 16 07338 g007
Figure 8. The intensity map of land use change in Yun–Gui Plateau from 2000 to 2020.
Sustainability 16 07338 g008
Figure 9. (a)The change trend of landscape-level pattern in Yun–Gui Plateau from 2000 to 2020. (b)The change trend of landscape pattern in Yun–Gui Plateau from 2000 to 2020.
Sustainability 16 07338 g009
Figure 10. Spatial distribution characteristics of landscape pattern change from 2000 to 2020.
Sustainability 16 07338 g010
Figure 11. (a) Spatial variation of landscape pattern index in northeast–southwest transect. (b) The spatial distribution map of land use in the northeast–southwest transect from 2000 to 2020. Note: Circles of different colors represent different extreme points.
Sustainability 16 07338 g011
Figure 12. (a) Spatial variation of landscape pattern index in east–west transect. (b) Spatial distribution of land use in the east–west transect from 2000 to 2020. Note: Circles of different colors represent different extreme points.
Sustainability 16 07338 g012
Figure 13. (a) Spatial variation of landscape pattern index in northwest–southeast transect. (b) The spatial distribution of land use in the northwest–southeast line from 2000 to 2020. Note: Circles of different colors represent different extreme points.
Sustainability 16 07338 g013
Figure 14. Spatial distribution of precipitation in Yun–Gui Plateau from 2000 to 2020.
Sustainability 16 07338 g014
Figure 15. Spatial distribution of CN value in Yun–Gui Plateau from 2000 to 2020.
Sustainability 16 07338 g015
Figure 16. Spatial distribution map of surface runoff depth in Yun–Gui Plateau from 2000 to 2020, unit: mm.
Sustainability 16 07338 g016
Figure 17. Spatial variation of surface runoff depth in each period of Yun–Gui Plateau, unit: mm.
Sustainability 16 07338 g017
Figure 18. (a) Spatial distribution of surface runoff depth in Yun–Gui Plateau from 2000 to 2020 after controlling a single variable. (b) Runoff changes of different land use types in Yun–Gui Plateau from 2000 to 2020. Note that the unit of runoff is ×107 m3.
Sustainability 16 07338 g018
Figure 19. Heatmap of correlation analysis between landscape pattern evolution and surface runoff change in Yun–Gui Plateau from 2000 to 2020. Note, for the two-tailed test, the correlation is significant at the 0.01 level.
Sustainability 16 07338 g019
Figure 20. Heatmap of correlation analysis between the evolution of the horizontal pattern of patch types and the change of surface runoff in Yun–Gui Plateau from 2000 to 2020. Note, for the two-tailed test, the correlation is significant at the 0.01 level.
Sustainability 16 07338 g020
Table 1. Development policies over the years.
LevelTimePolicyContents
Central government policy1990s-Carry out a pilot project on the comprehensive control of rocky desertification.
2001A1: “Outline of the Tenth Five-Year Plan for National Economic and Social Development of the People’s Republic of China”Promote the comprehensive management of rocky desertification and reduce soil erosion in karst areas.
2006A2: “Karst Area Rocky Desertification Comprehensive Control Planning Outline (2006–2015)”Accelerate the pace of rocky desertification’s control and curb its expansion as soon as possible.
2008A3: “Outline of the Comprehensive Management Plan for Rocky Desertification in Karst Areas (2008–2015)”Implement afforestation and closure of hillsides to facilitate afforestation measures to restore and improve the quality of the ecological environment in karst areas.
2008-One hundred national pilot counties selected for the comprehensive control of rocky desertification.
2011A4: “National Major Function-Oriented Zone Planning”Protection of croplands and natural grasslands, glaciers, and permanent snow cover.
2014A5: “National Ecological Protection and Construction Plan (2013–2020)”Farmland in the Yun–Gui Plateau—continued promotion of projects to return farmland into forest land in karst areas with rocky desertification, such as Guizhou, Guangxi, and Yunnan.
2014A6: “National Ecological Protection Red Line”Strictly protect and control spatial boundaries.
2016A7: “Karst Rocky Desertification Comprehensive Treatment Project 13th Five-Year Plan Construction Planning”Adhere to the priorities of protection and natural restoration, using green development as the conceptual basis to carry out rocky desertification control.
2020A8: “Master Plan of Major Projects for the Protection and Restoration of Important Ecosystems in China (2021–2035)”The comprehensive management of rocky desertification is the key task of planning.
Local government policyGuizhou province2008B1: “Opinions on Accelerating the Comprehensive Prevention and Control of Rocky Desertification”National rocky desertification—comprehensive prevention and control pilot project.
2011B2: “Guizhou Province Water Conservancy, Ecological Construction, and Rocky Desertification”The water conservancy, ecology, and rocky desertification control project “trinity”.
2017B3: “13th Five-Year Ecological Construction Plan of Guizhou Province”Improve the ecosystem and adhere to green development.
Yunnan province2008B4: “Karst Rocky Desertification Comprehensive Management Planning”Promote the comprehensive management of the rocky desertification pilot project and the control of rocky desertification at the national level in key counties.
2016B5: “Development Plan for the Open Economic Belt along the Border of Yunnan Province (2016–2020)”Vigorously promote ecological governance.
2021B6: “Master Plan of Major Projects for the Protection and Restoration of Important Ecosystems in Yunnan Province (2021–2035)”Strengthen the comprehensive management of rocky desertification in karst areas.
Hunan Province1950s-Exploration of the management of rocky desertification by construction of tunnels and terraces, as well as addressing afforestation in rocky desertification areas.
1990s-Eliminating barren mountainsides suitable for forest, march toward “three difficult places” greening.
2009-Carry out the green Xiangxi project and comprehensively manage rocky desertification.
2008–2014-Thirty-two counties (cities, districts) are included in the scope of the national key comprehensive management of rocky desertification.
2018B7: “The Red Line of Ecological Protection in Hunan Province”Strengthen the prevention and control of soil erosion and rocky desertification in multiple areas.
2021-Fifteen national rocky desert parks are built.
Guangxi Province2008-The integration of “seal, make, management, biogas, use, and supplement” in economic development, ecological restoration, improvements in people’s livelihood, and rocky desertification prevention and control.
2021B8: “The 14th Five-Year Plan for Ecological Environment Protection in Guangxi”Promotion of the protection of natural forest resources, construction of shelter forest system, and comprehensive management of rocky desertification.
Sichuan Province2015B9: “Provincial Forestry Work Conference”Strengthen regional ecological protection and construction and promote desert ecological management.
2020B10: “Sichuan Province to Accelerate the Implementation of Ecological Civilization Construction Plan”Increase regional rocky desertification control and restoration intensity and promote comprehensive management projects.
Hubei Province2008-Comprehensively promote the management of rocky desertification in the karst area.
2016B11: “The 13th Five-Year Plan for the Comprehensive Control of Rocky Desertification in Karst Areas of Hubei Province”Carry out key forestry-related ecological projects to further control the expansion of rocky desertification.
2020B12: “Hubei Yangtze River Protection and Restoration Battle Program”The comprehensive control project of rocky desertification is carried out in 20 key counties of the province.
Chongqing/-Key forestry-related ecological projects are carried out in karst areas, and comprehensive ecological control projects, such as artificial afforestation, the closure of hillsides to facilitate afforestation, and conservation tillage, are implemented.
2022B13: “Chongqing Ecological Environment Protection 14th Five-Year Plan (2021–2025)”Restoration of ecologically degraded areas, according to local conditions, with suitable trees to carry out karst rocky desertification control.
Table 2. Data sources required for the study.
Serial NumberDateData SourceConcrete MethodsWays of Data Use
1Land use dataChina Land Cover Dataset (CLCD), resolution: 30 m, accessed on 9 May 2023.GIS—unified coordinate,
extraction by mask
Land use change analysis, landscape pattern analysis, and surface runoff simulation.
2Precipitation dataMonthly precipitation dataset with 1 km resolution in China from 1901 to 2022 (https://www.geodata.cn/data/), resolution: 1 km, accessed on 14 May 2023.GIS—nc to tif file superposition of monthly precipitationSurface runoff simulation and driving factor analysis
3Soil hydrological typeSoil hydrological grouping raster data set HYSOGs250m (HSG), resolution: 250 m, accessed on 2 June 2023.GIS—unified coordinate, reclassification–extraction by mask
4Digital elevation dataGeospatial Data Cloud (https://www.gscloud.cn/search), resolution: 30 m, accessed on 24 May 2023.GIS-Mosaic to new grid, extraction by mask
5CN valueAmerican Engineering Handbook (https://www.hydrocad.net/neh.htm), accessed on 3 June 2023.The CN value index of the Yun–Gui Plateau under AMCII state is obtainedSurface runoff simulation
Table 3. Collinearity test.
Index of Landscape
indexAREA_MNCOHESIONDIVISIONLSILPIPDIJICONTAGSHDI
VIF2.1524.78915.7068.3575.9642.8271.1045.3305.527
Plaque-Type Level Index
indexPLANDNPPDDIVISIONLPILSI
VIF1.48210.14710.14451.1051.1411.000
Table 4. HSG in the Yun–Gui Plateau.
Final Infiltration Rate (mm/h)Water–SoilSoil Texture ClassesRunoff Potential
7.6–11.4ASa, SaLo, LoSalow
3.8–7.6BSi, Lo, SiLoModerately low
1.3–3.8CSaClLoModerately high
0–1.3DClLo, SiClLo, SaCl, SiCl, Clhigh
Note: Sa—sand, SaLo—sandy loam, LoSa—loamy sand, Si—silt, Lo—loam, SiLo—silty loam, SaClLo—sandy clay loam, ClLo—clay loam, SiClLo—silty clay loam, SaCl—sandy clay, SiCl—silty clay, Cl—clay.
Table 5. CN value index of the Yun–Gui Plateau under AMCII state.
Land Use TypeHydrological Soil Group
ABCD
Cropland67788589
Forest45497585
Shrub55728186
Grassland52718189
Water98989898
Snowfield63808793
Barren77869193
Impervious89929495
Table 6. The changing trend of landscape-level pattern in the Yun–Gui Plateau from 2000 to 2020.
TimePDLPILSIAREA_MNCONTAGIJICOHESIONSHDI
20000.787360.215495.9675127.02361.401440.3399.93050.9019
20050.770559.4699493.9009129.786961.251940.372899.93020.9082
20100.775361.4659493.8361128.989961.338740.607299.93540.9056
20150.791361.4204512.6118126.37961.177838.91399.93880.9025
20200.773562.5658508.2318129.288261.766537.881599.94080.8881
Table 7. The changing trend of landscape patterns in the Yun–Gui Plateau from 2000 to 2020.
IndexTimeCroplandForestShrubGrasslandWaterSnowfieldBarrenImpervious
PLAND200026.594665.87572.4814.04990.65840.00280.01280.3249
200527.152165.34562.47783.93380.68620.00280.01360.388
201026.892165.73552.50133.61180.74240.00270.01330.5008
201527.406365.56282.2043.35970.79990.0040.01050.6528
202027.094566.29842.03682.9670.78910.00390.01020.8001
LPI20004.495560.2150.00550.07330.05250.00160.00140.0072
20054.509459.46990.00610.15110.06740.00140.00160.012
20103.126161.46590.00830.07740.07410.00070.00150.0152
20155.091861.42040.00840.04440.05950.00290.00040.024
20204.046262.56580.0070.04670.05850.00330.00040.0276
LSI2000724.2854518.1154498.859463.1863162.59419.166728.3556159.7765
2005721.2728516.0817494.5557449.2342165.038110.190526.7097167.1457
2010726.2921514.3072498.5778441.4309170.188910.642927.6087180.5348
2015769.5609539.6693477.7721431.7686173.19189.607827.4512198.9453
2020781.8661534.4632457.9399411.7311171.10518.4628.3875213.0522
DIVISION20000.99720.6373111111
20050.99650.6462111111
20100.99770.6222111111
20150.99610.6227111111
20200.99710.6085111111
Table 8. Impact of policy factors on runoff.
TimePolicyConstruction ContentsLandscape Pattern EvolutionSurface Runoff Response
2000–2005A1Comprehensive control of rocky desertification project, pilot to revert farmland to forest, and ecological restoration project.The increase in the cropland area and the lag in policy leads to a decrease in forest land.The interception capacity of rainwater is weakened, but the precipitation is reduced, resulting in a decrease in total runoff.
2005–2010A2, A3, B1, B4Comprehensive control of rocky desertification pilot project, afforestation, closure of hillsides to facilitate the afforestation project, and soil erosion prevention and control project.The areas of other land types converted to forest increases, and the shape of the forest landscape tends to be regular.The water conservation capacity of the region is enhanced, but the increase in precipitation leads to an increase in surface runoff.
2010–2015A4, A5, A6, B2, B9, Yunnan border open economic belt development plan (2016–2020)The ecological restoration project and China’s construction land development are extended to the central and western regions. The population growth of the urban agglomeration in central Yunnan is intense, and the city is expanding outward.Human activities have intensified, urban land has expanded, the proportion of impervious land and cropland has increased, and forest patches tend to be fragmented and more complex.The permeability of the underlying surface in urban areas is low, and the regional runoff capacity is enhanced. At the same time, the precipitation increases, and the precipitation and pattern of evolution results work together to increase the runoff.
2015–2020A7, A8, B5, B7, B9, B10, B11, B12Ecological management, afforestation, soil erosion control, comprehensive management of rocky desertification, and reversion of farmland to forest and grassland projects are vigorously carried out.The proportion of the forest landscape area increased, and forest landscape connectivity increased.The regional rainwater interception capacity is enhanced. At the same time, the precipitation is reduced. The precipitation is resonant with the influence of policy, and the runoff is reduced.
Note: A1–B12 details are shown in Table 1.
Disclaimer/Publisher’s Note: The statements, opinions and data contained in all publications are solely those of the individual author(s) and contributor(s) and not of MDPI and/or the editor(s). MDPI and/or the editor(s) disclaim responsibility for any injury to people or property resulting from any ideas, methods, instructions or products referred to in the content.

