
The Influence of Fibres on the Properties and Sustainability of Oil-Impacted Concrete


Abstract
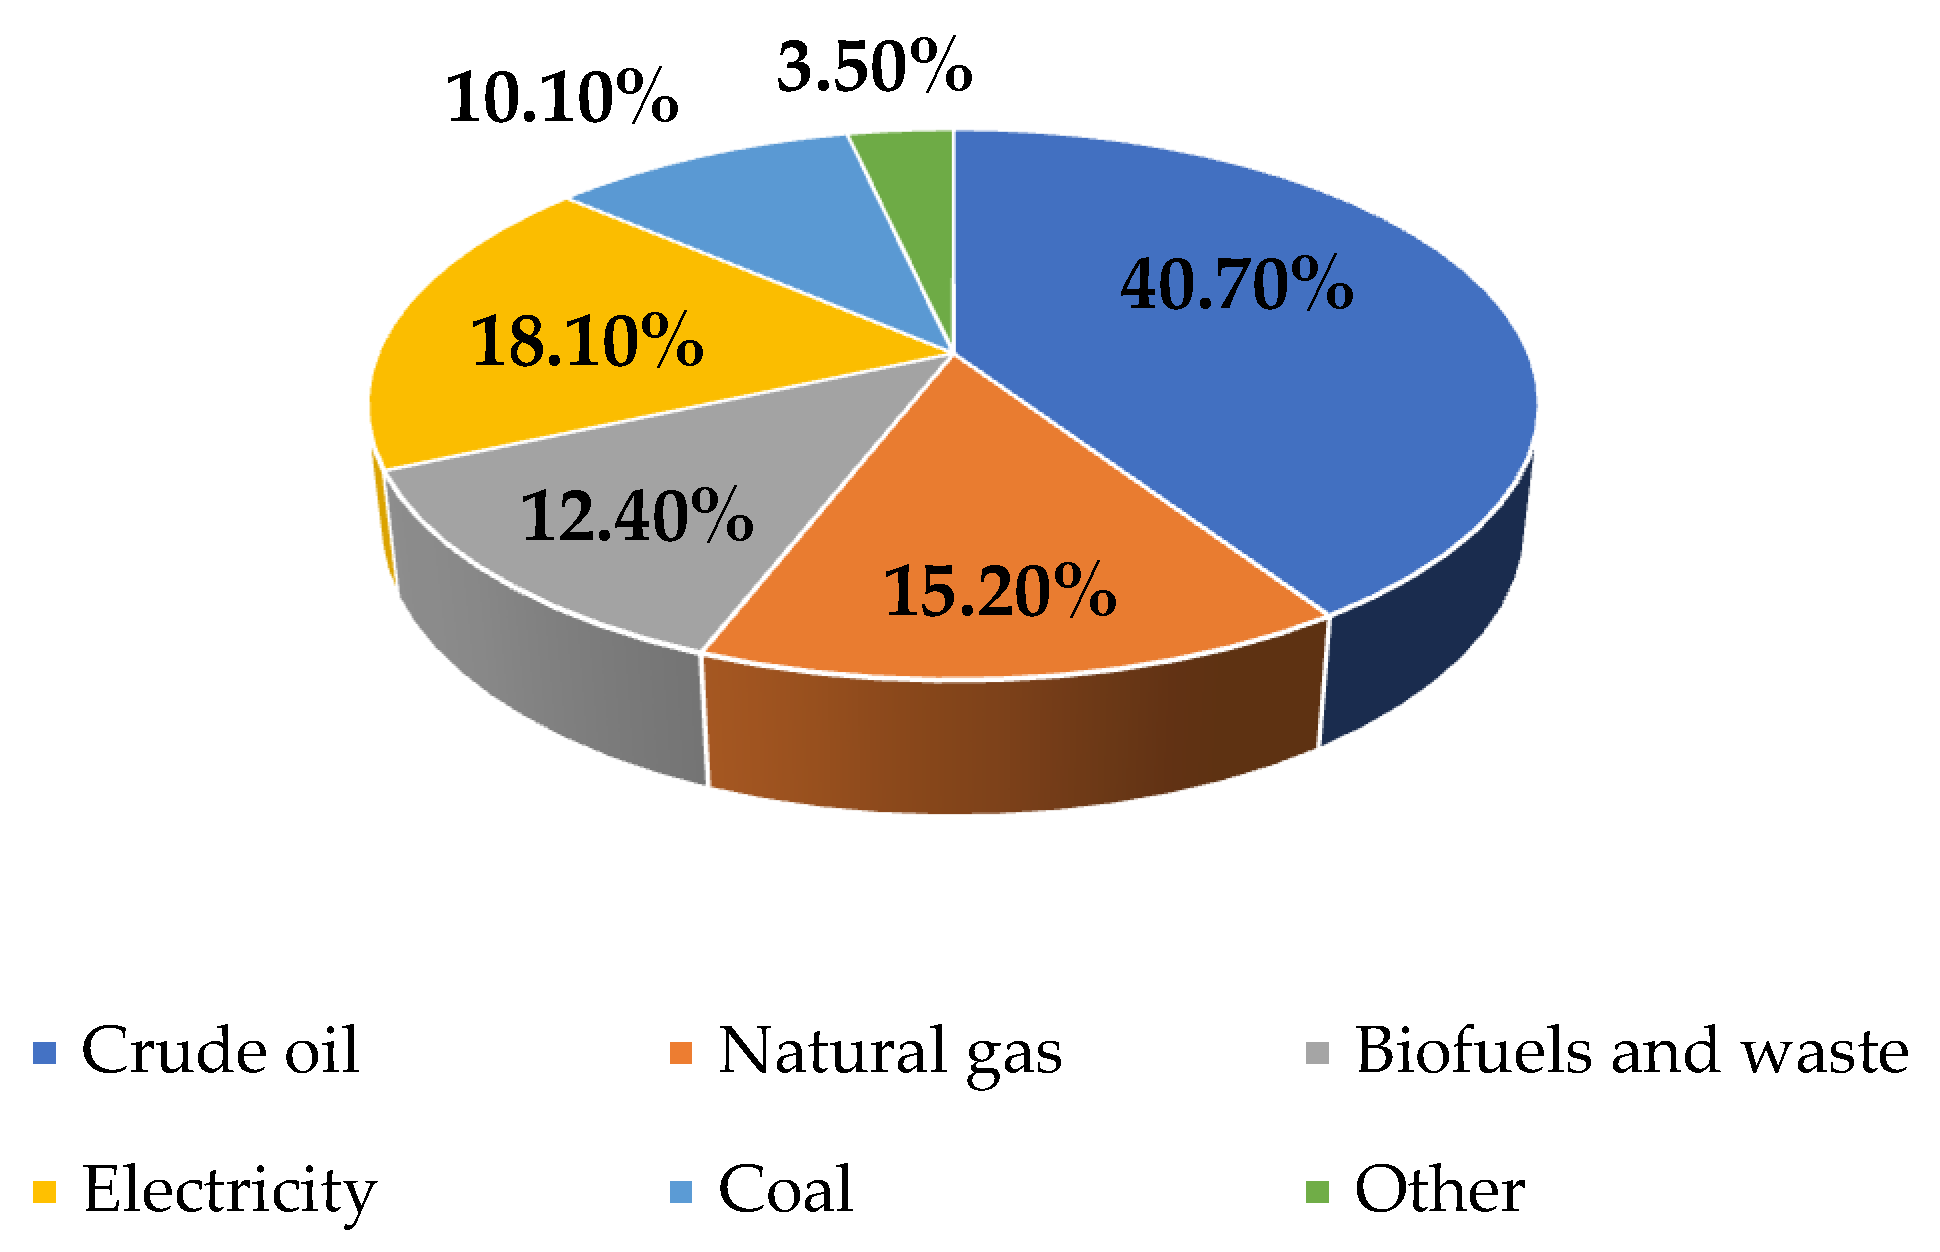
:1. Introduction
2. Materials
2.1. Aggregate
2.2. Light Crude Oil
2.3. Cement
2.4. Fibres
2.5. Mix Design
2.5.1. Concrete Mix Design
2.5.2. Characteristics of Oil-Contaminated Concrete
2.5.3. Properties of Oil-Impacted Concrete with Fibres
2.5.4. Fibre Dosage for Oil-Impacted Concrete
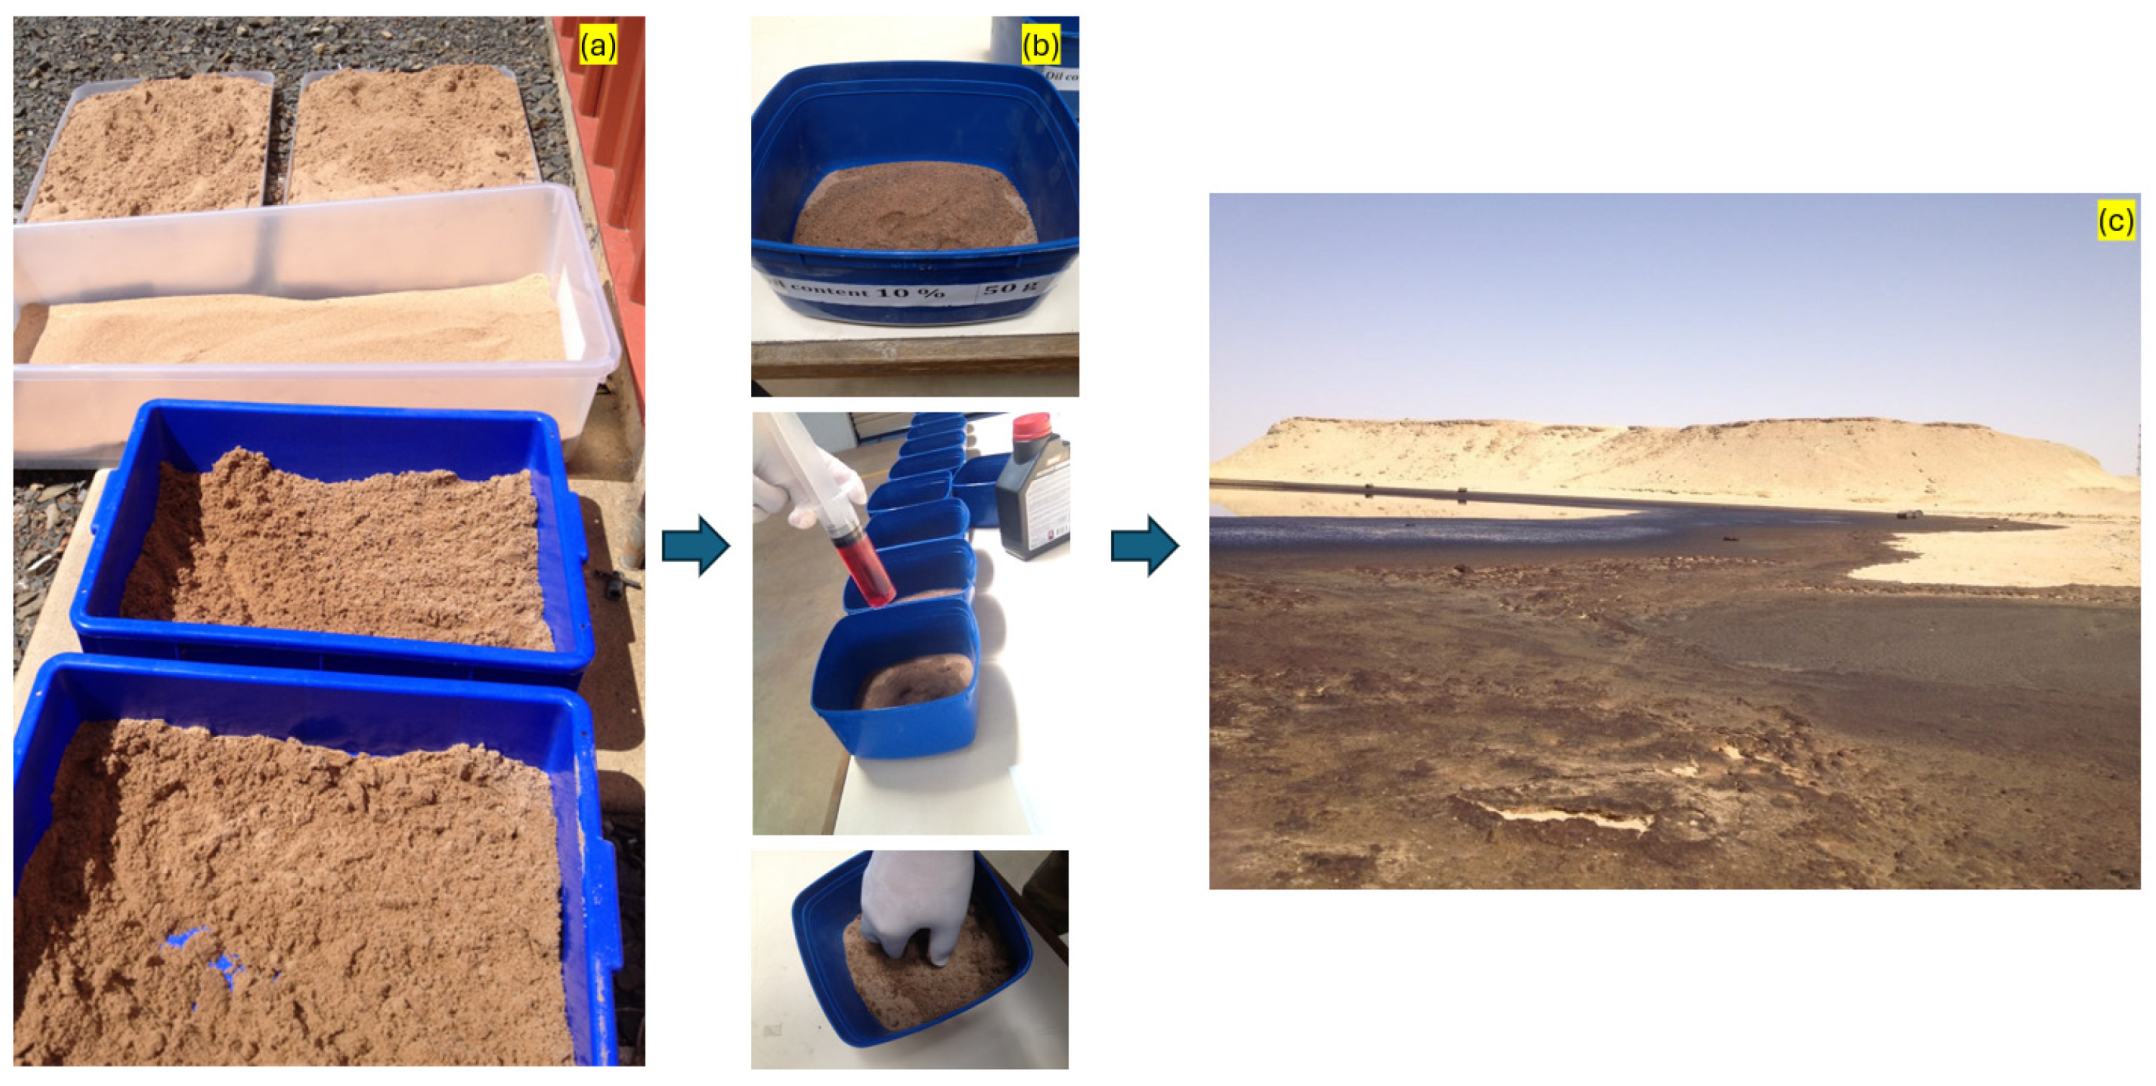
2.6. Preparation of Specimens
2.7. Compressive Strength
2.8. Flexural Strength Test
2.9. Isothermal Calorimetry Test (Hydration Test)
2.10. Workability Test
2.11. Microscope Observation
3. Results and Discussion
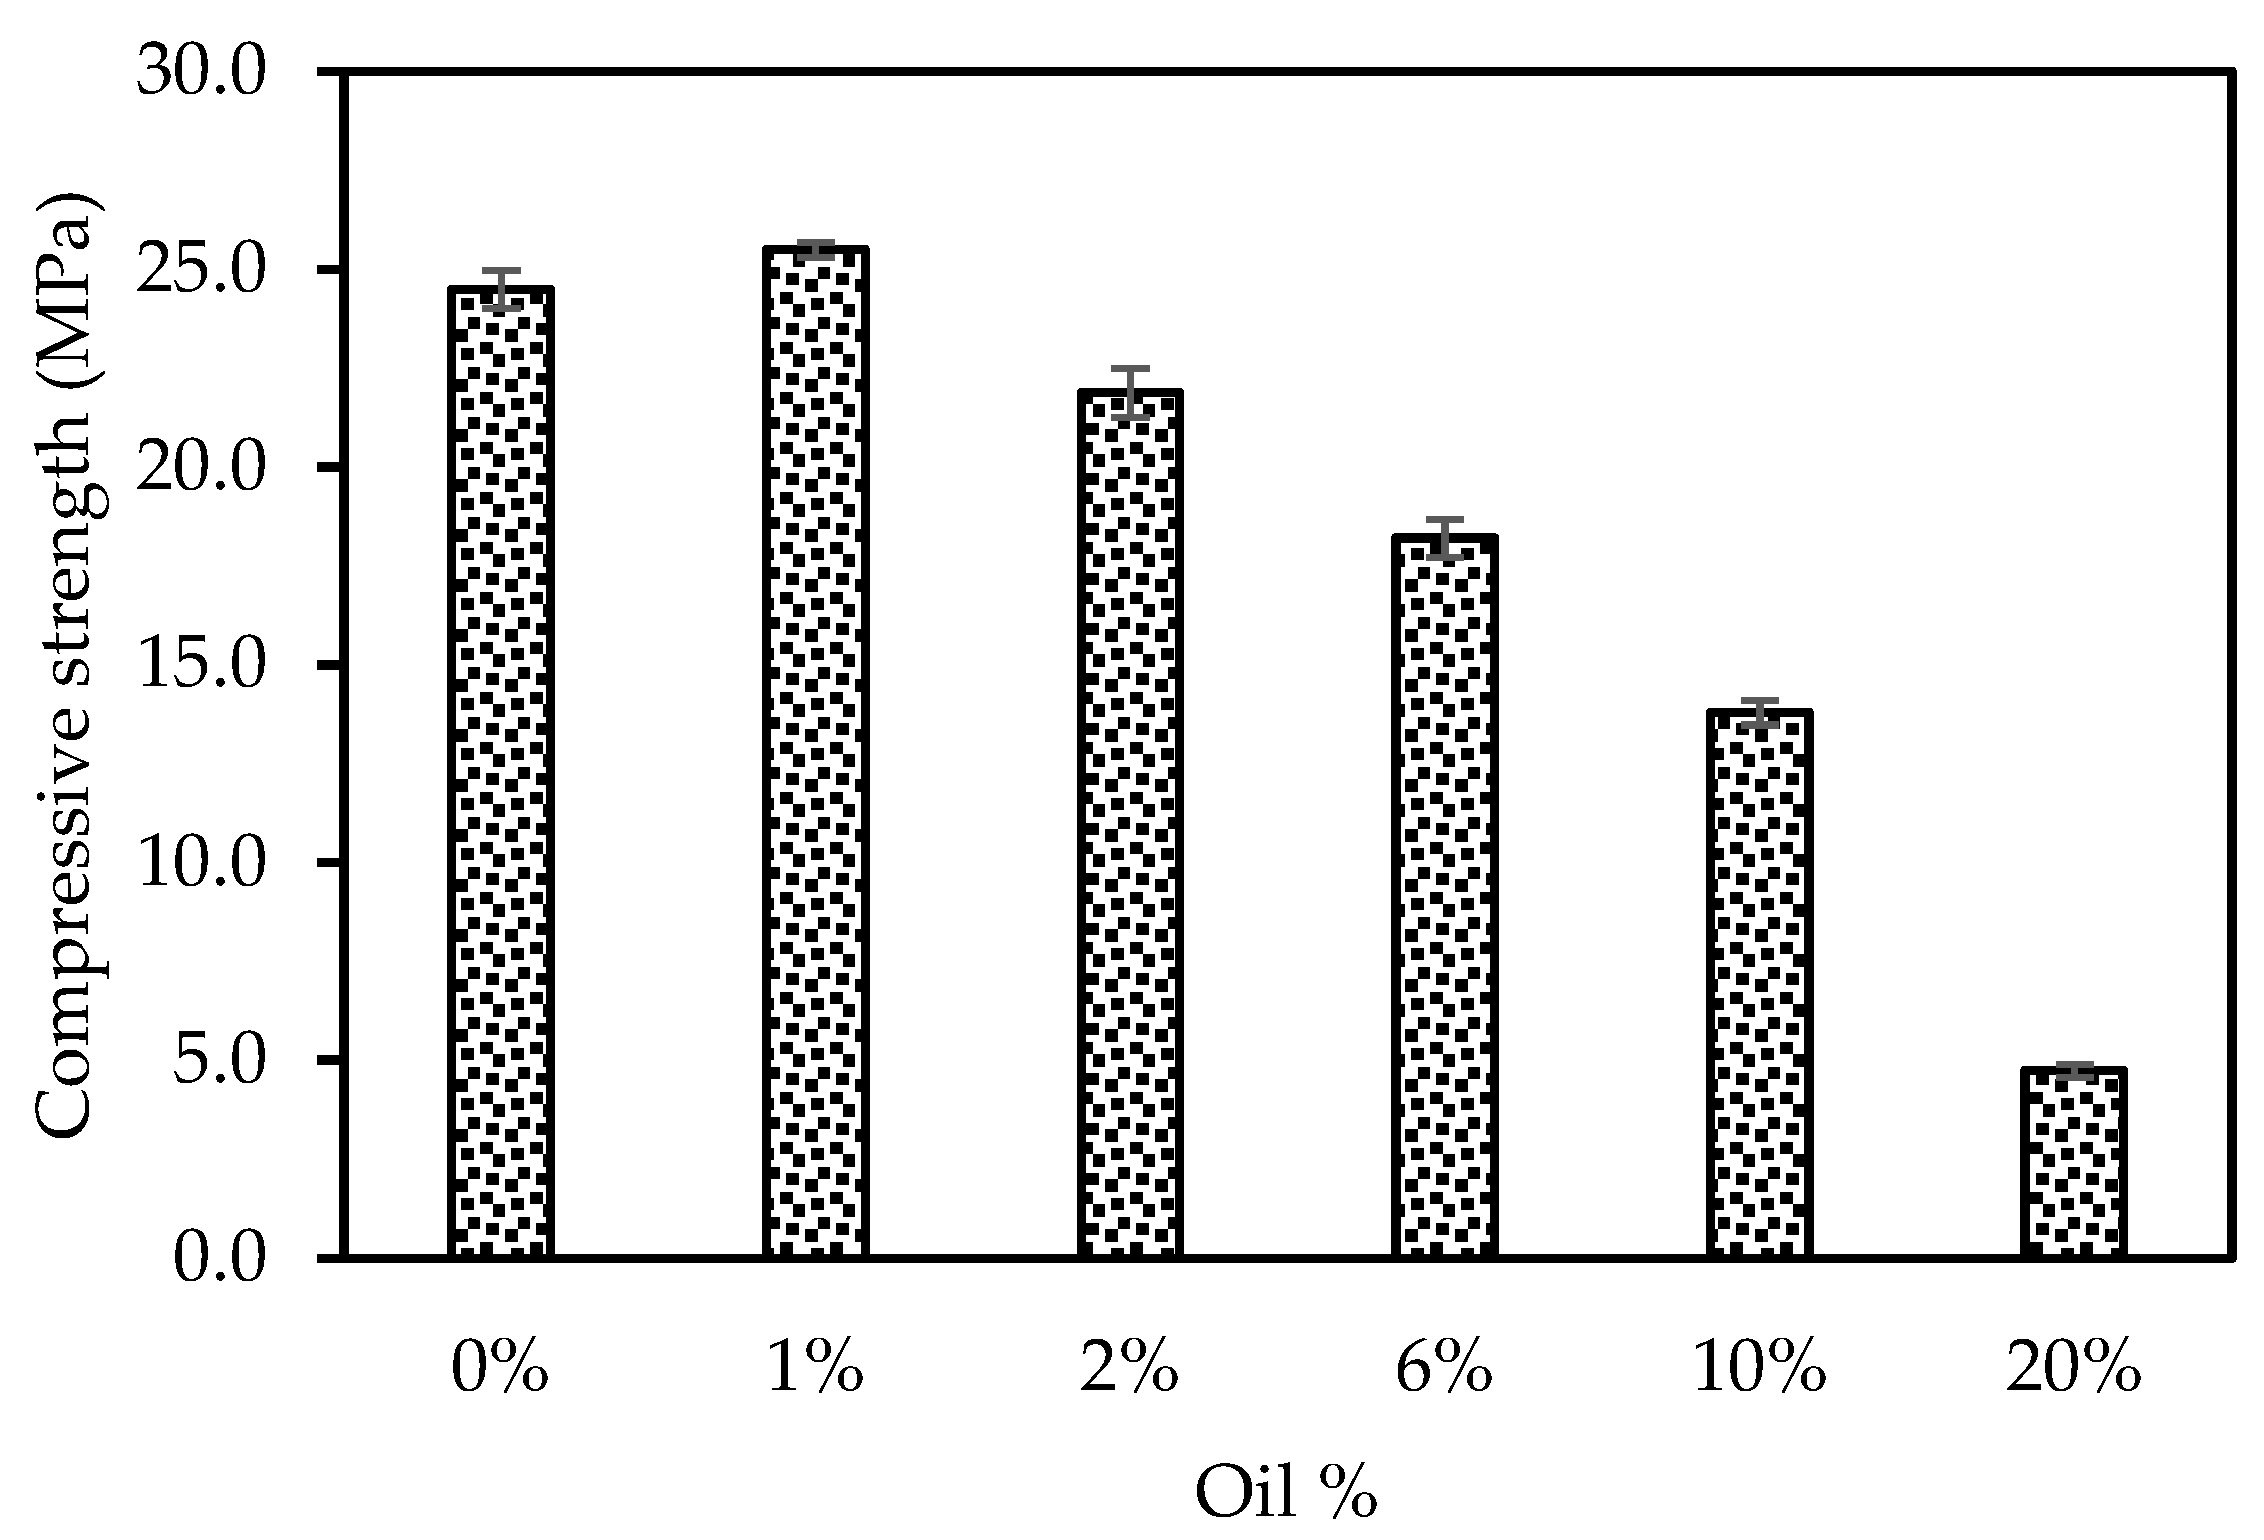
3.1. Impact of Crude Oil on Compressive Strength
3.2. Failure Behaviour of Oil-Impacted Concrete
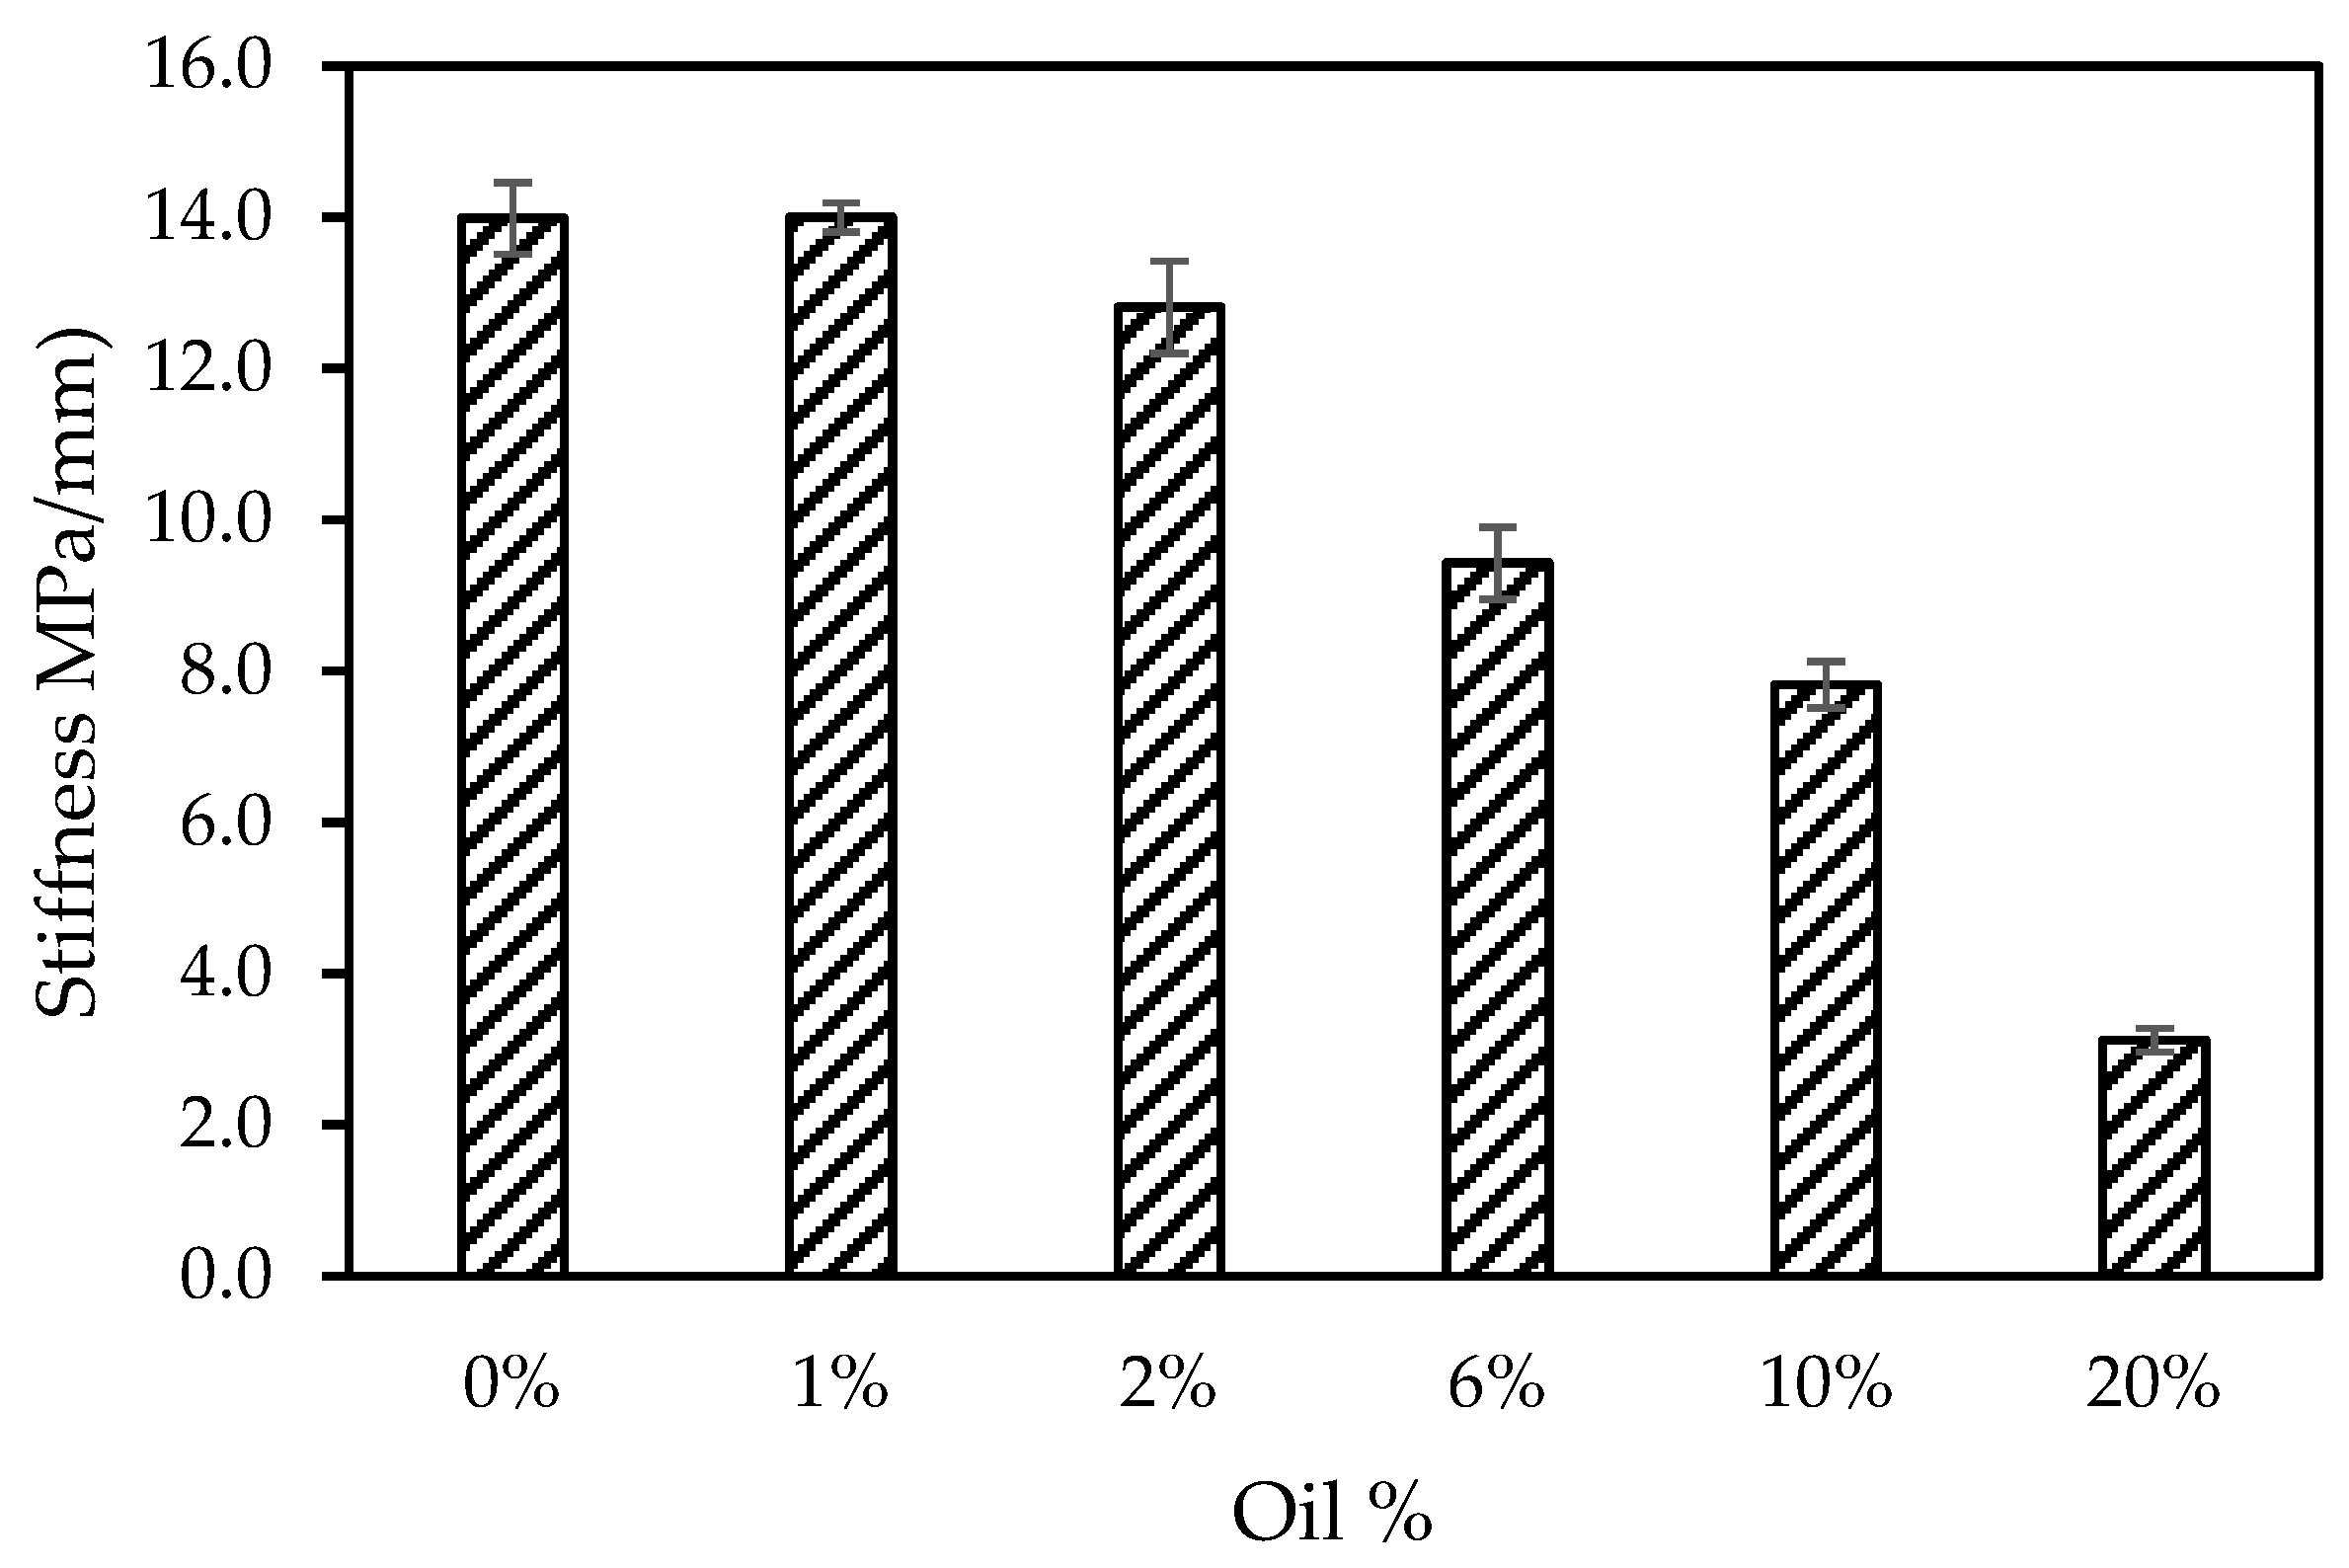
3.3. Effect of Crude Oil on Relative Stiffness
3.4. Influence of Crude Oil on Proportional Limit
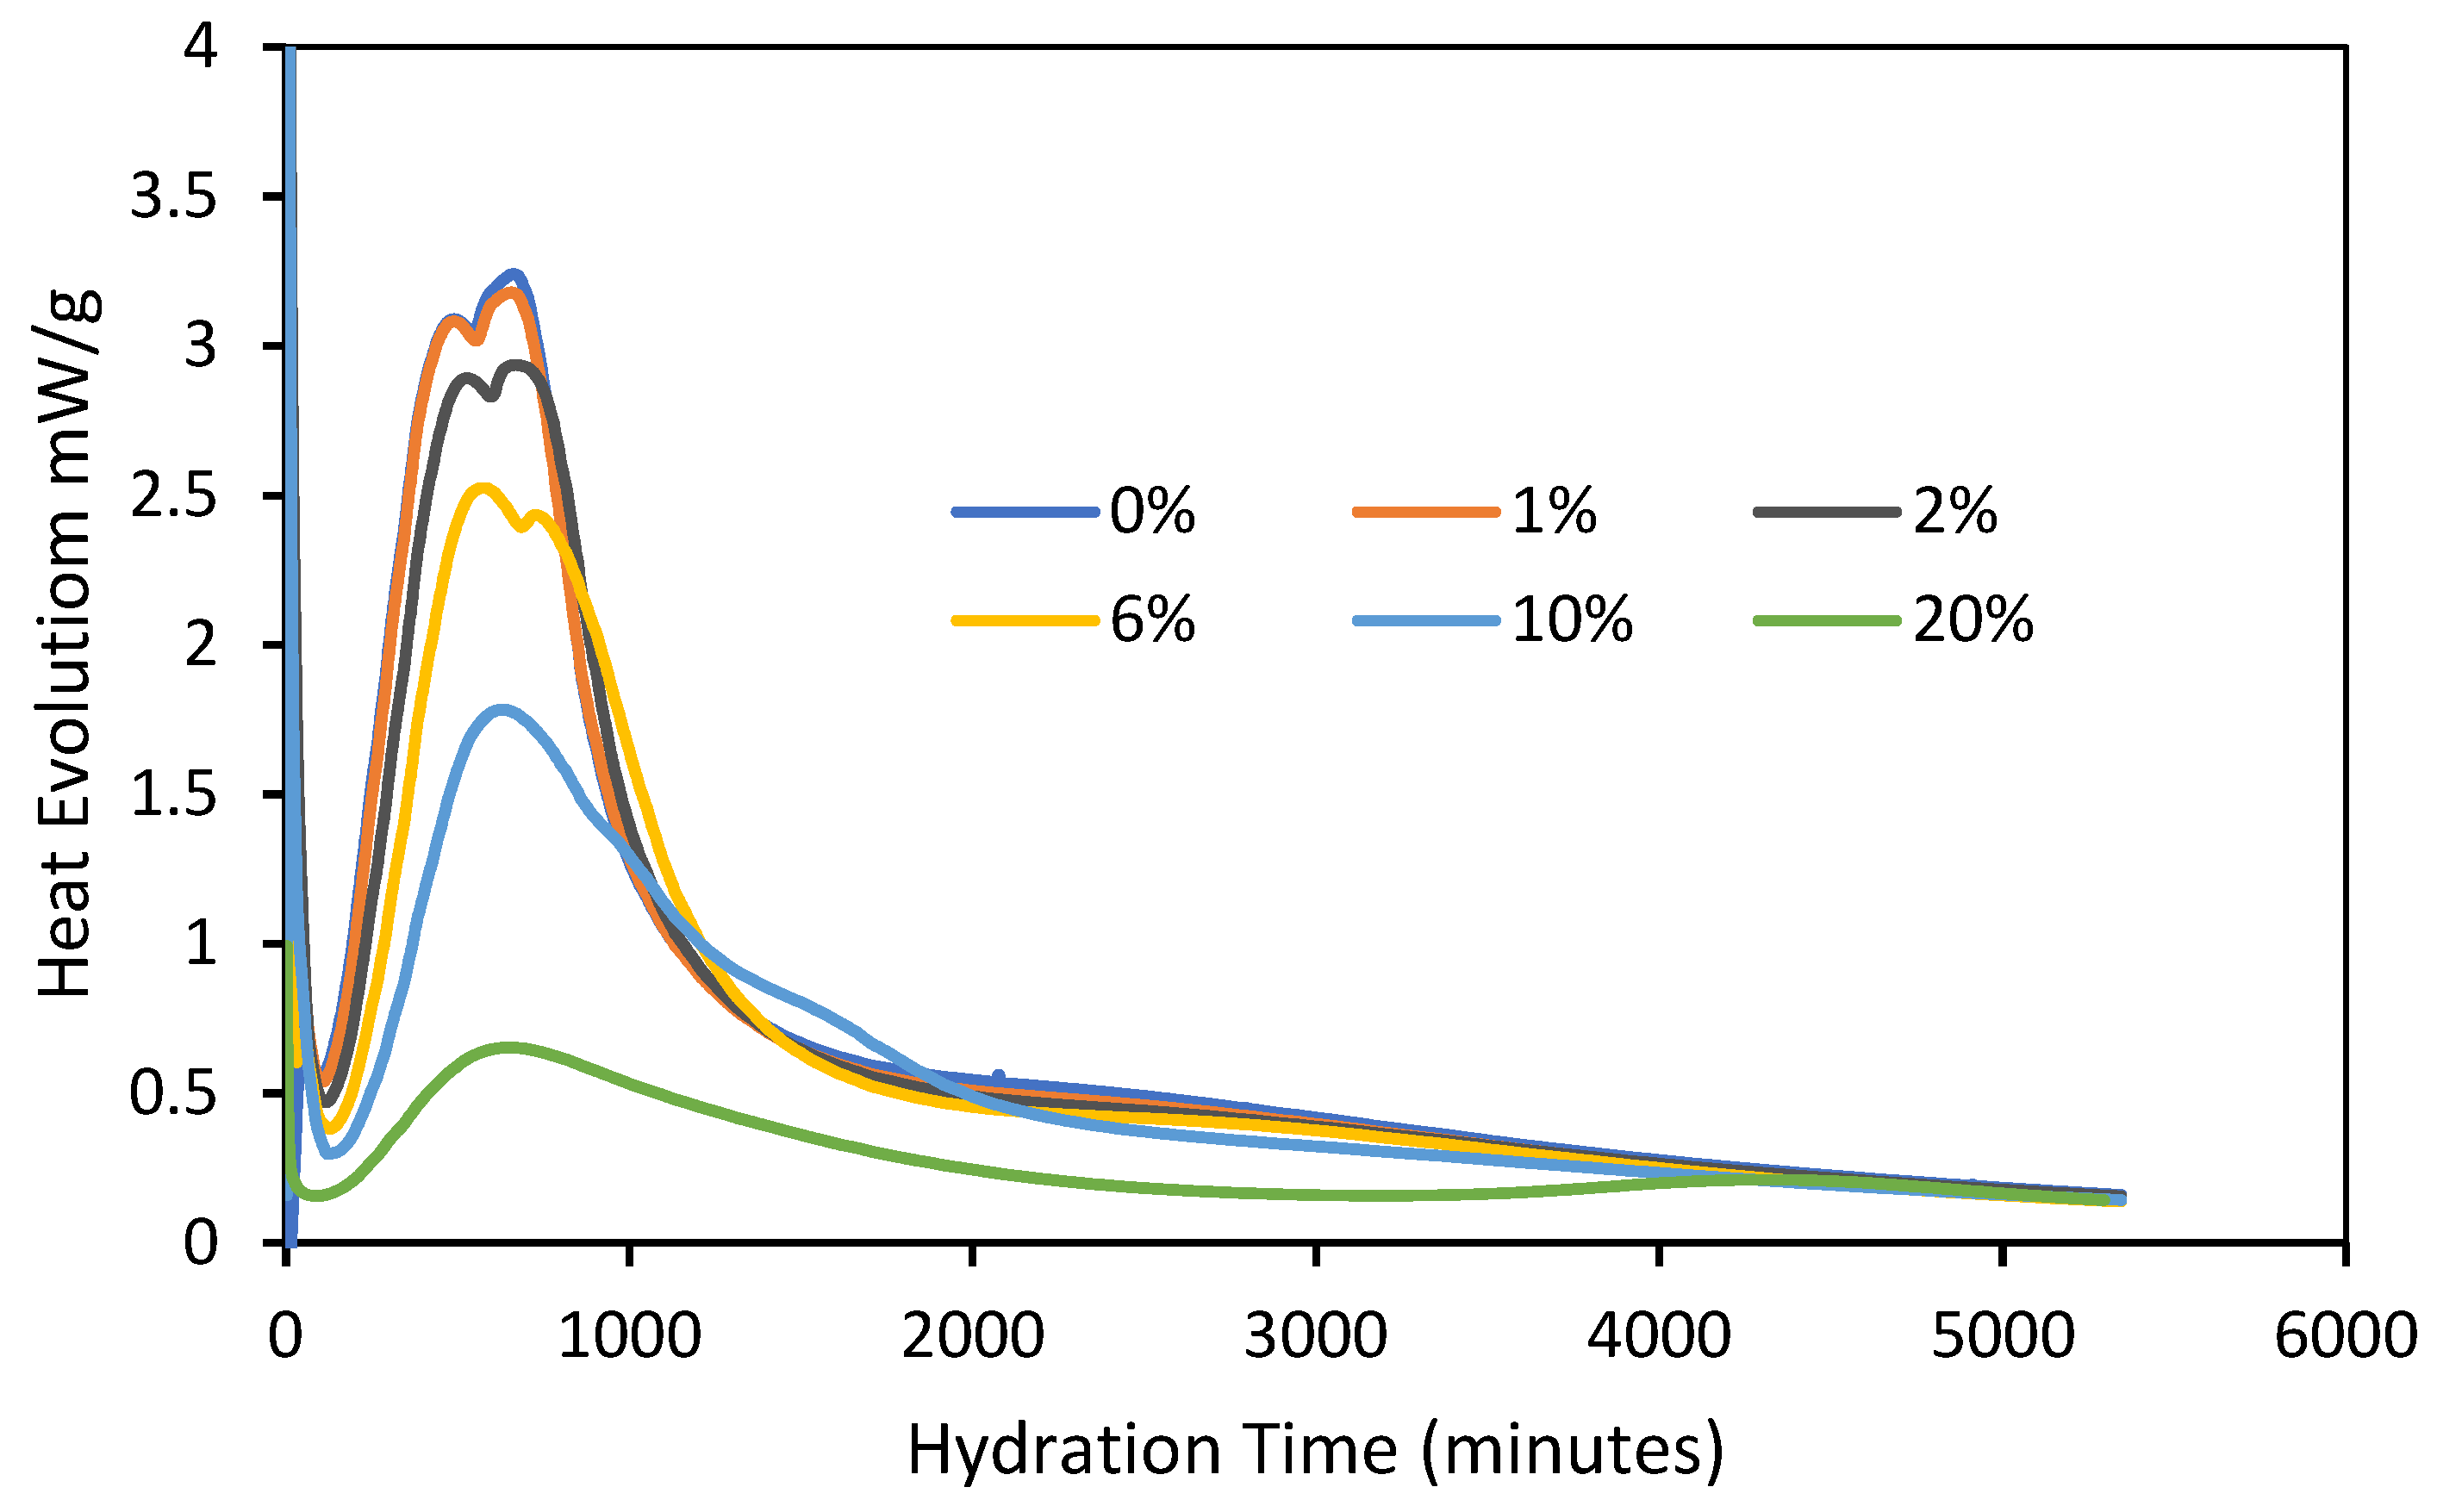
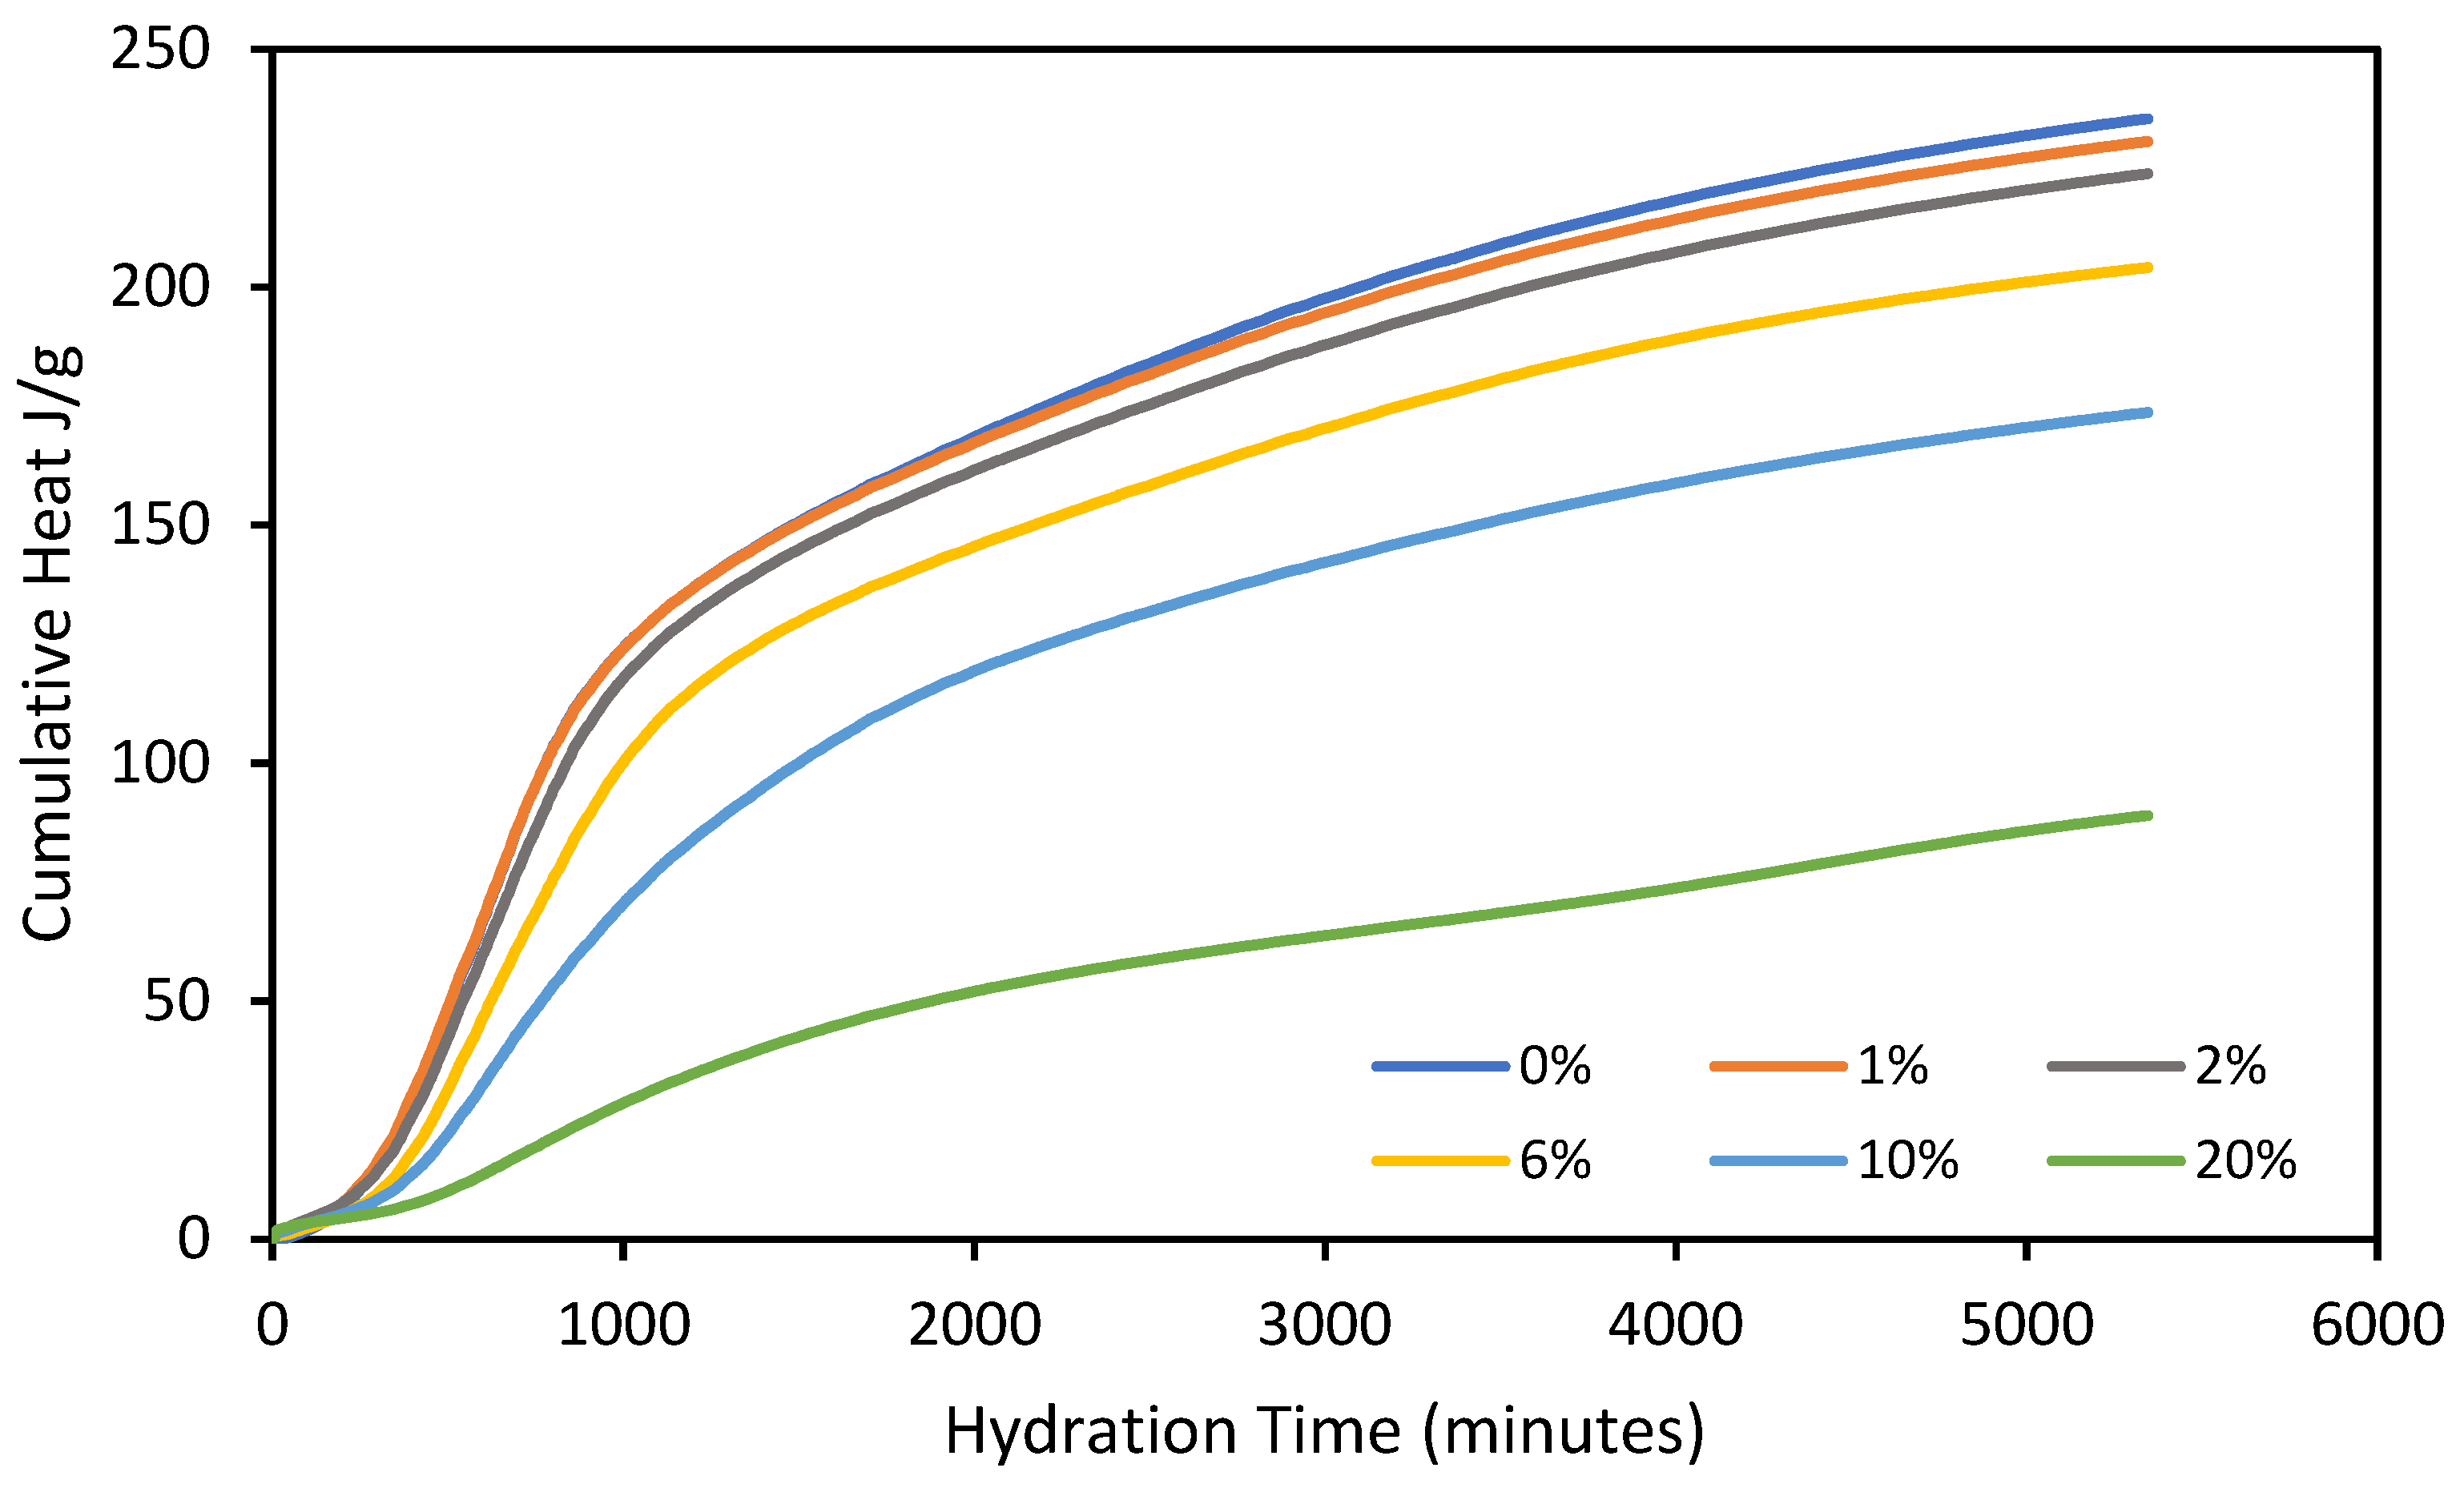
3.5. Impact of Oil on the Hydration Process (Isothermal Calorimetry)
3.6. Properties of Fibre-Reinforced Oil-Impacted Concrete
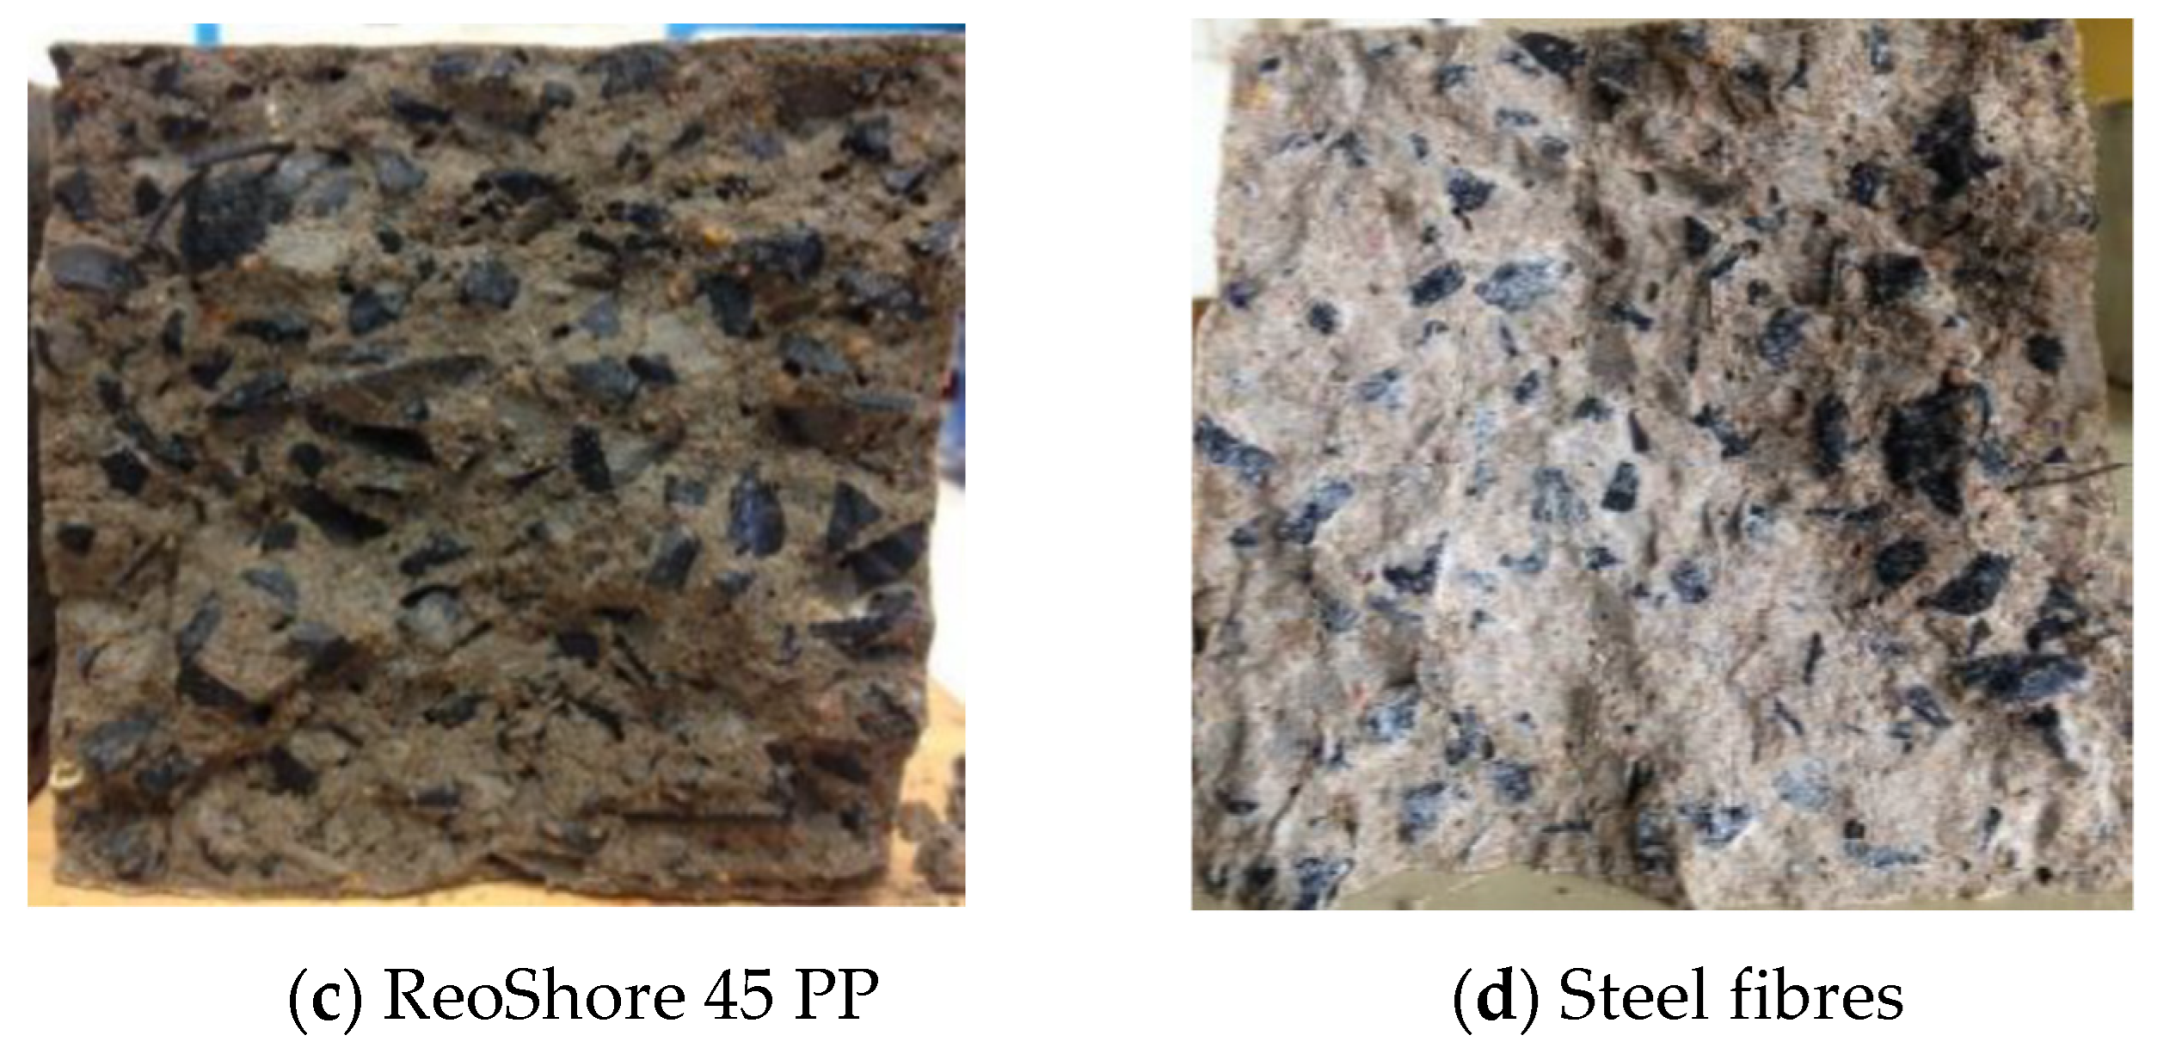
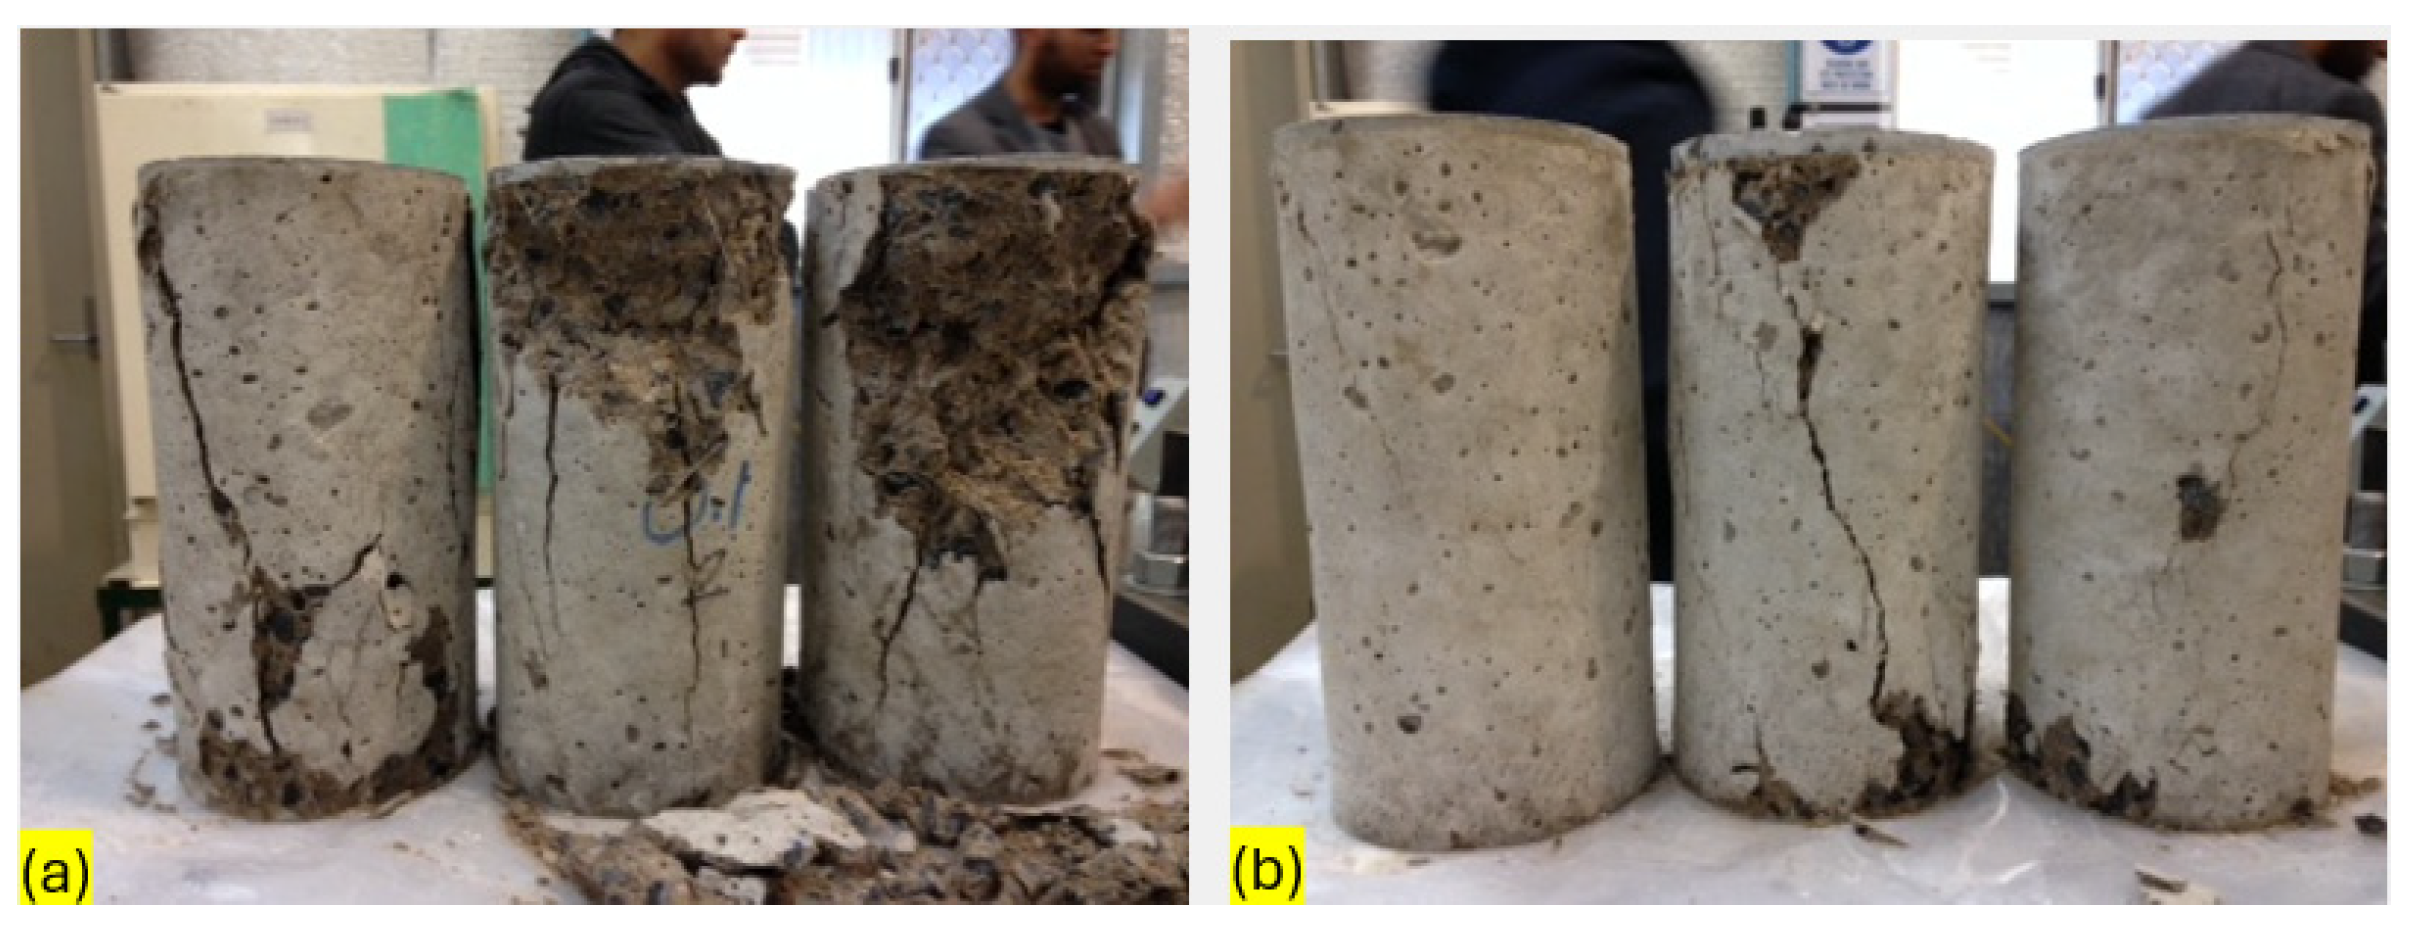
3.6.1. Compression Failure Mode of Fibre-Reinforced Oil-Impacted Concrete
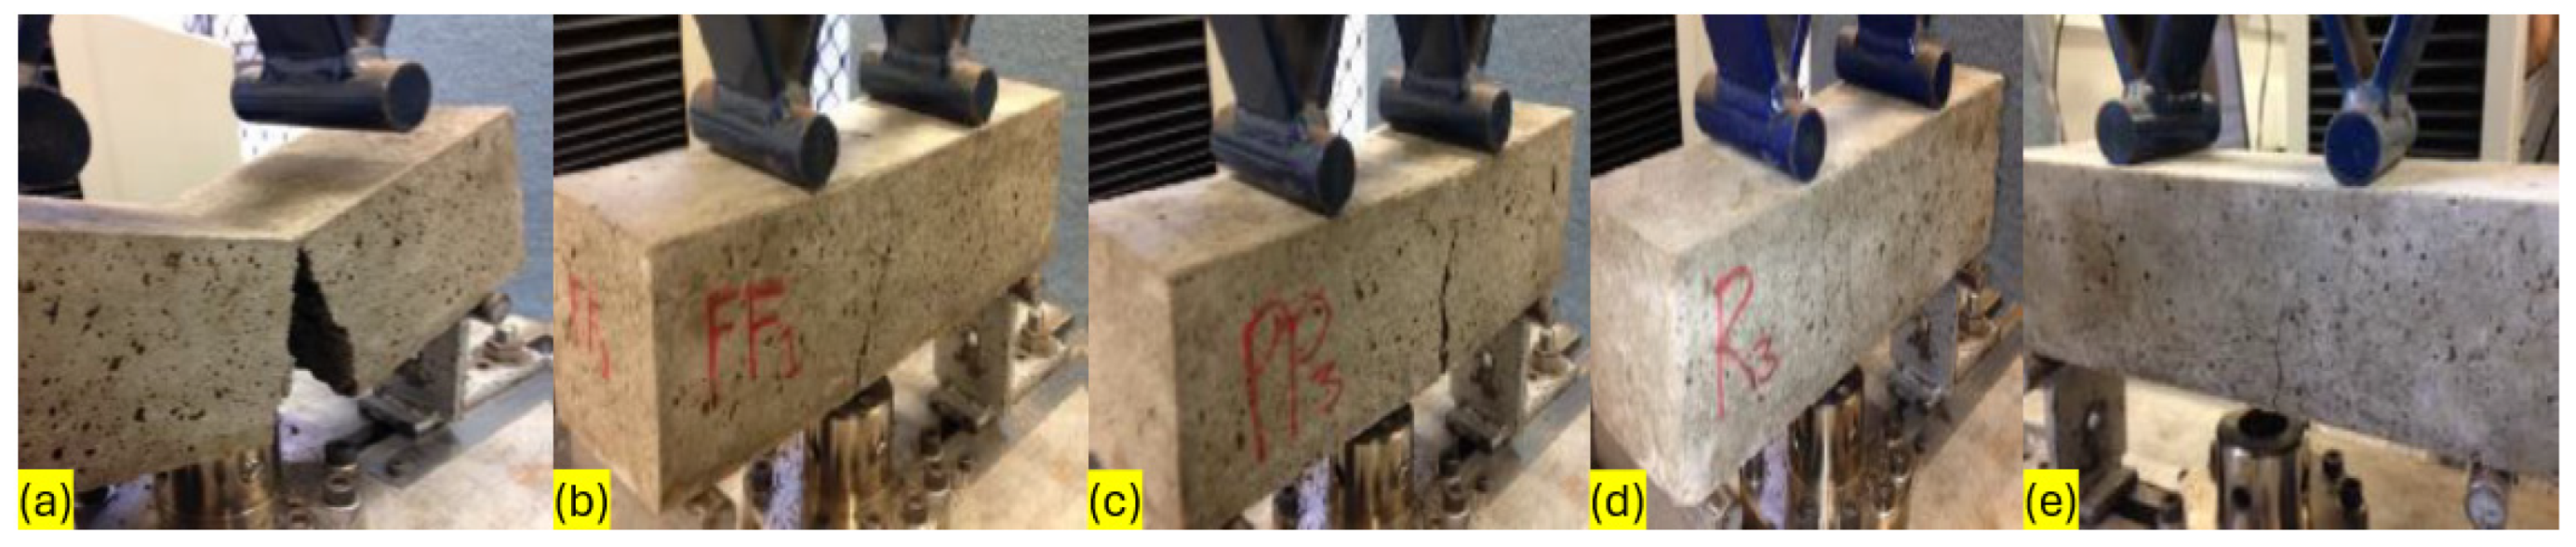
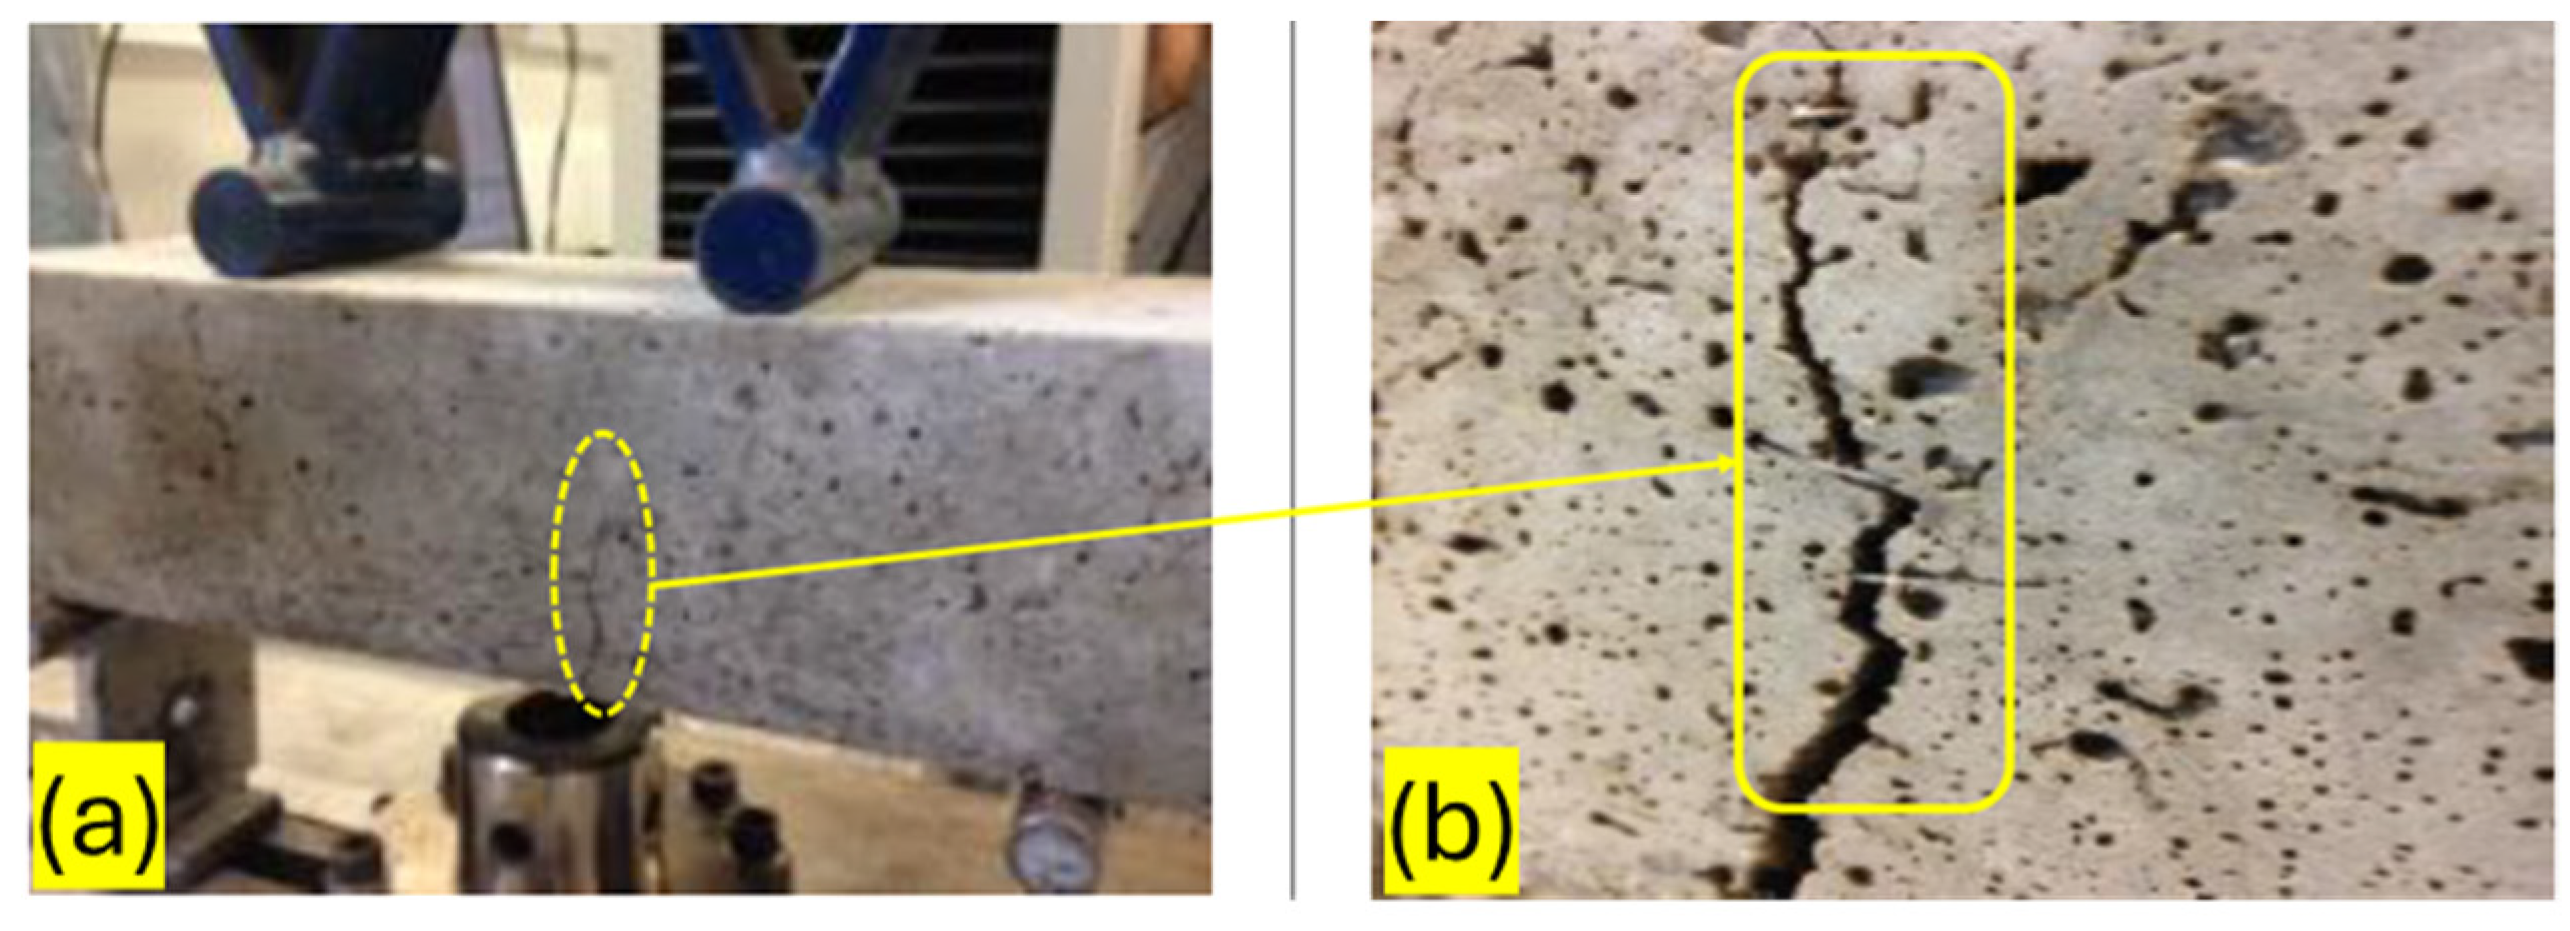
3.6.2. Flexural Failure Mode of Fibre-Reinforced Oil-Impacted Concrete
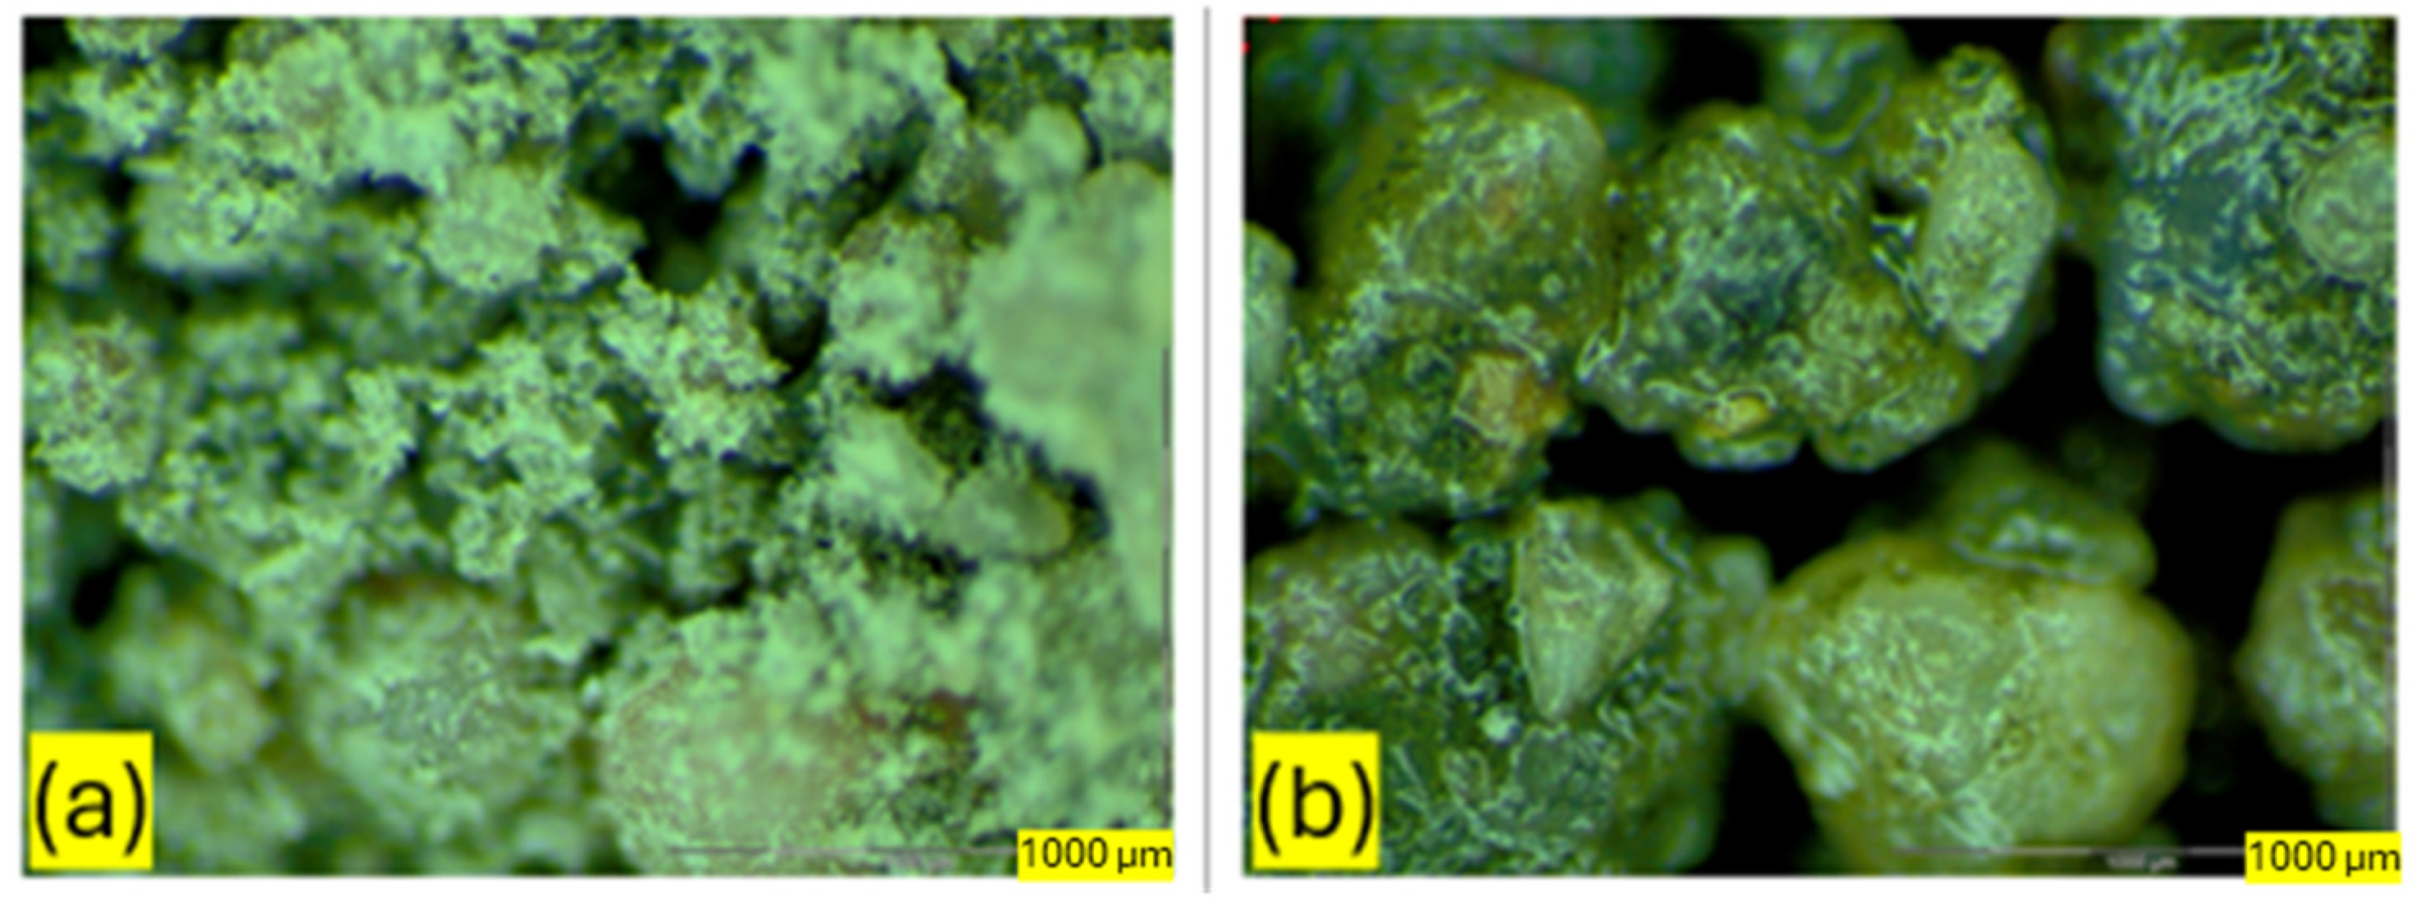
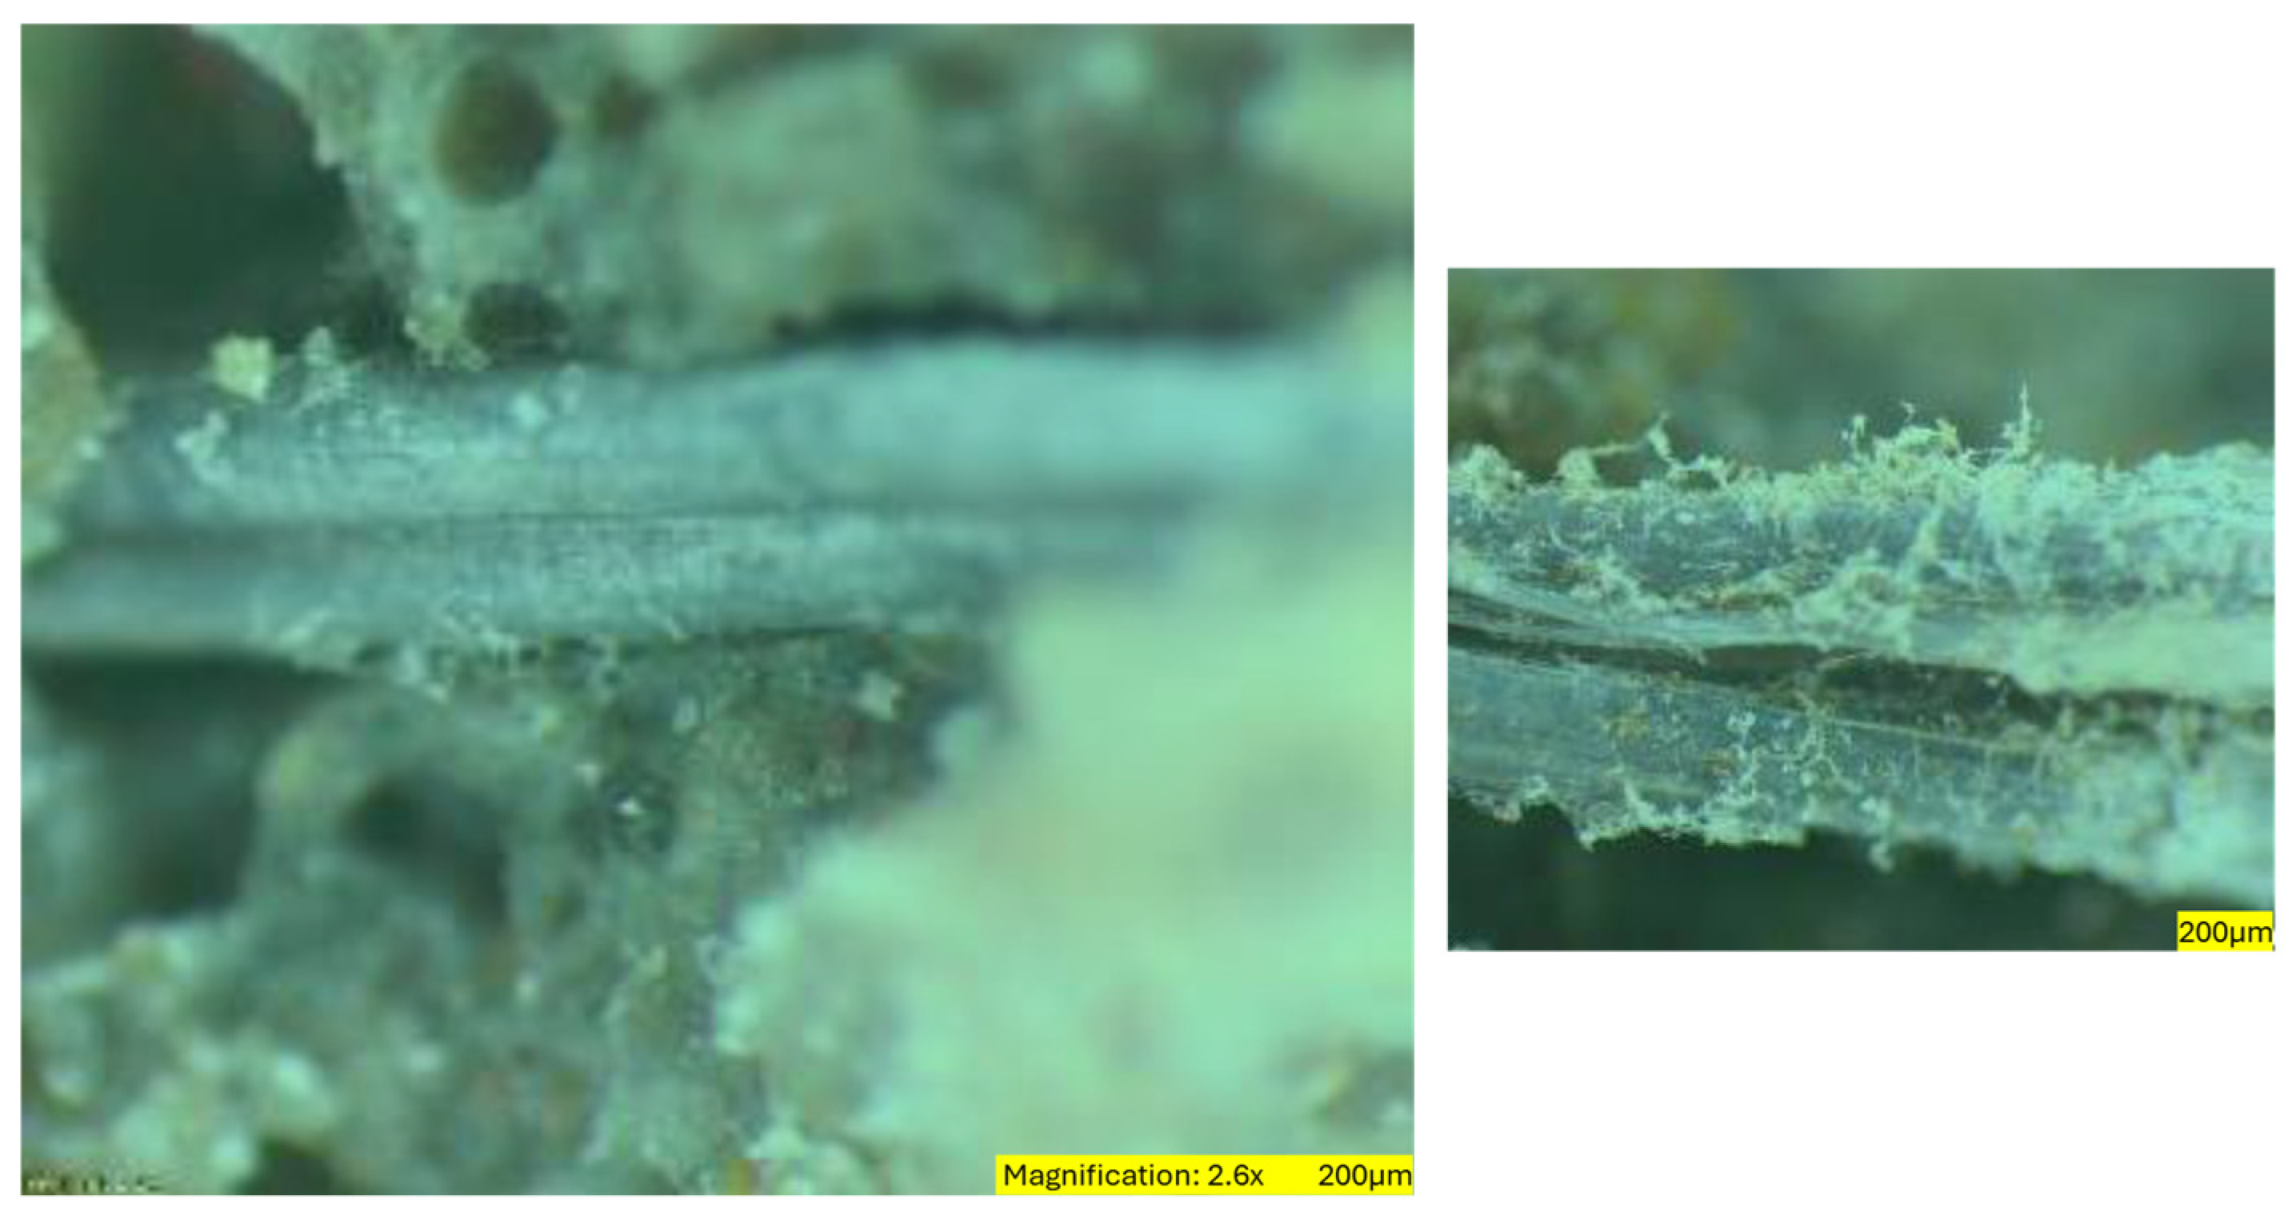
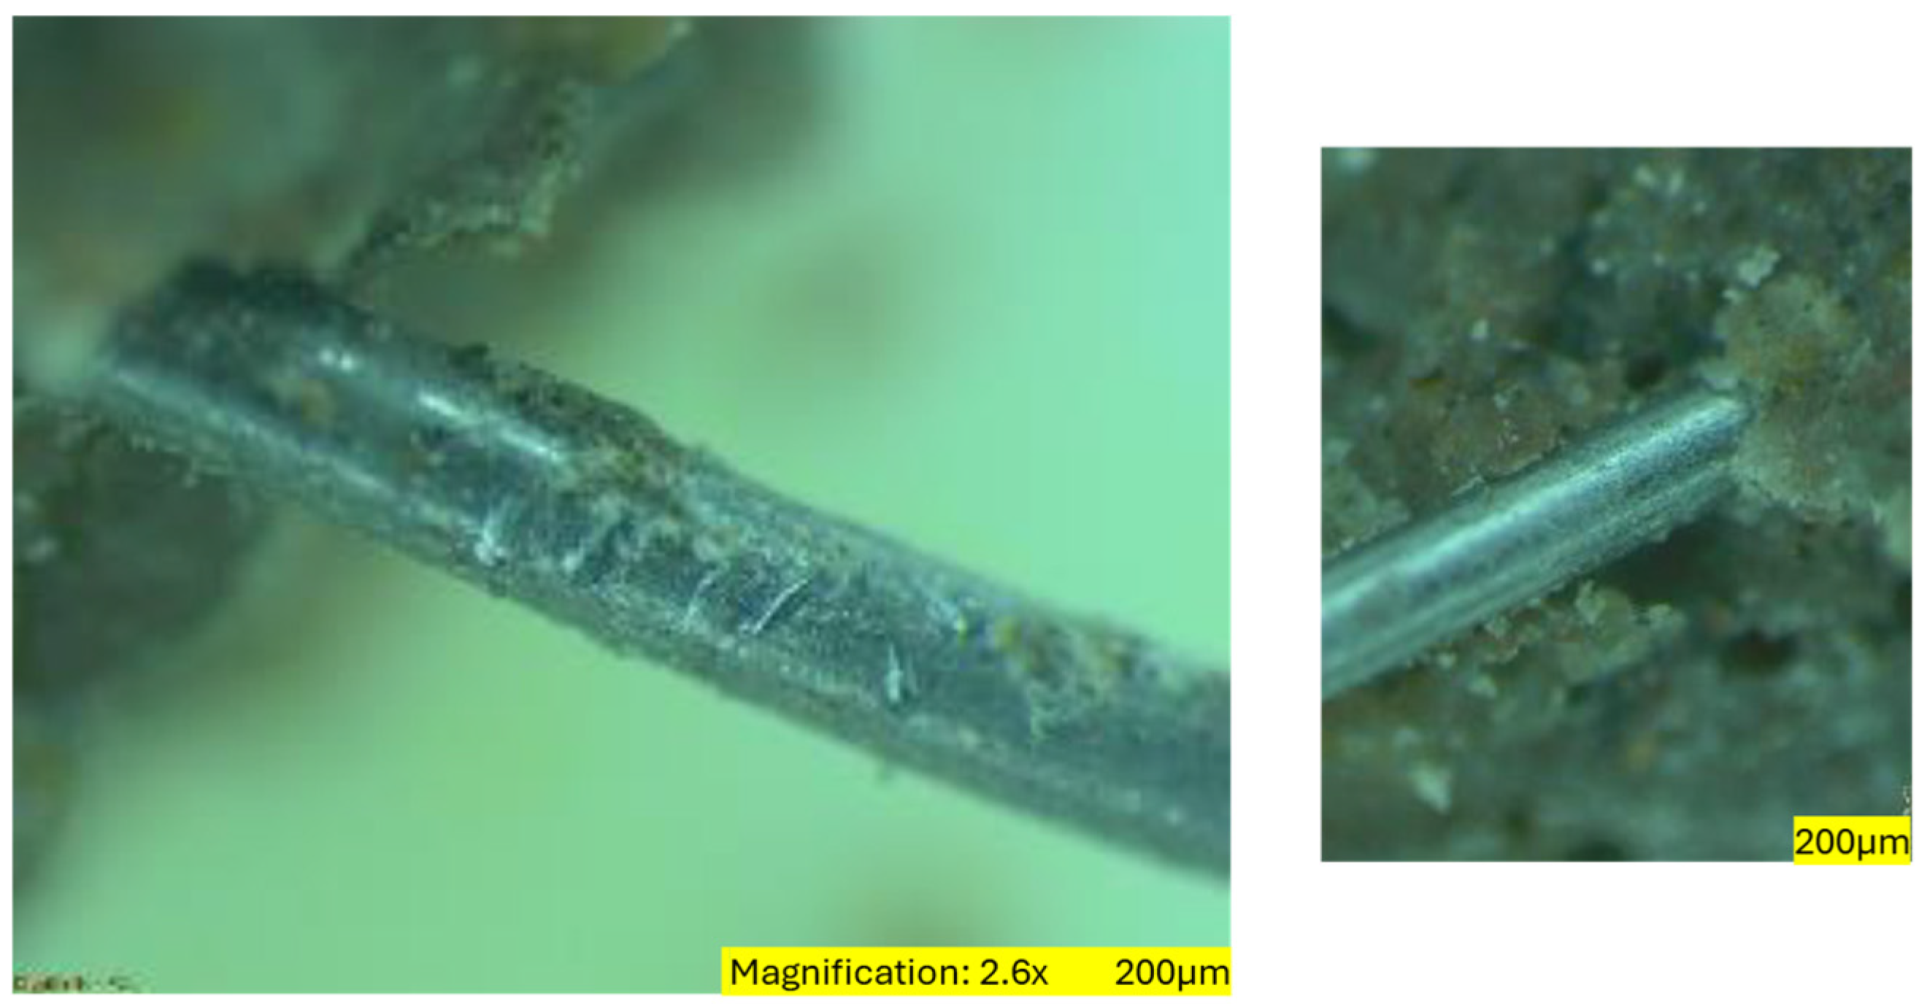
3.6.3. Microscopic Analysis of Fibre-Reinforced Oil-Impacted Concrete
3.7. Effect of Fibres on Compressive Strength
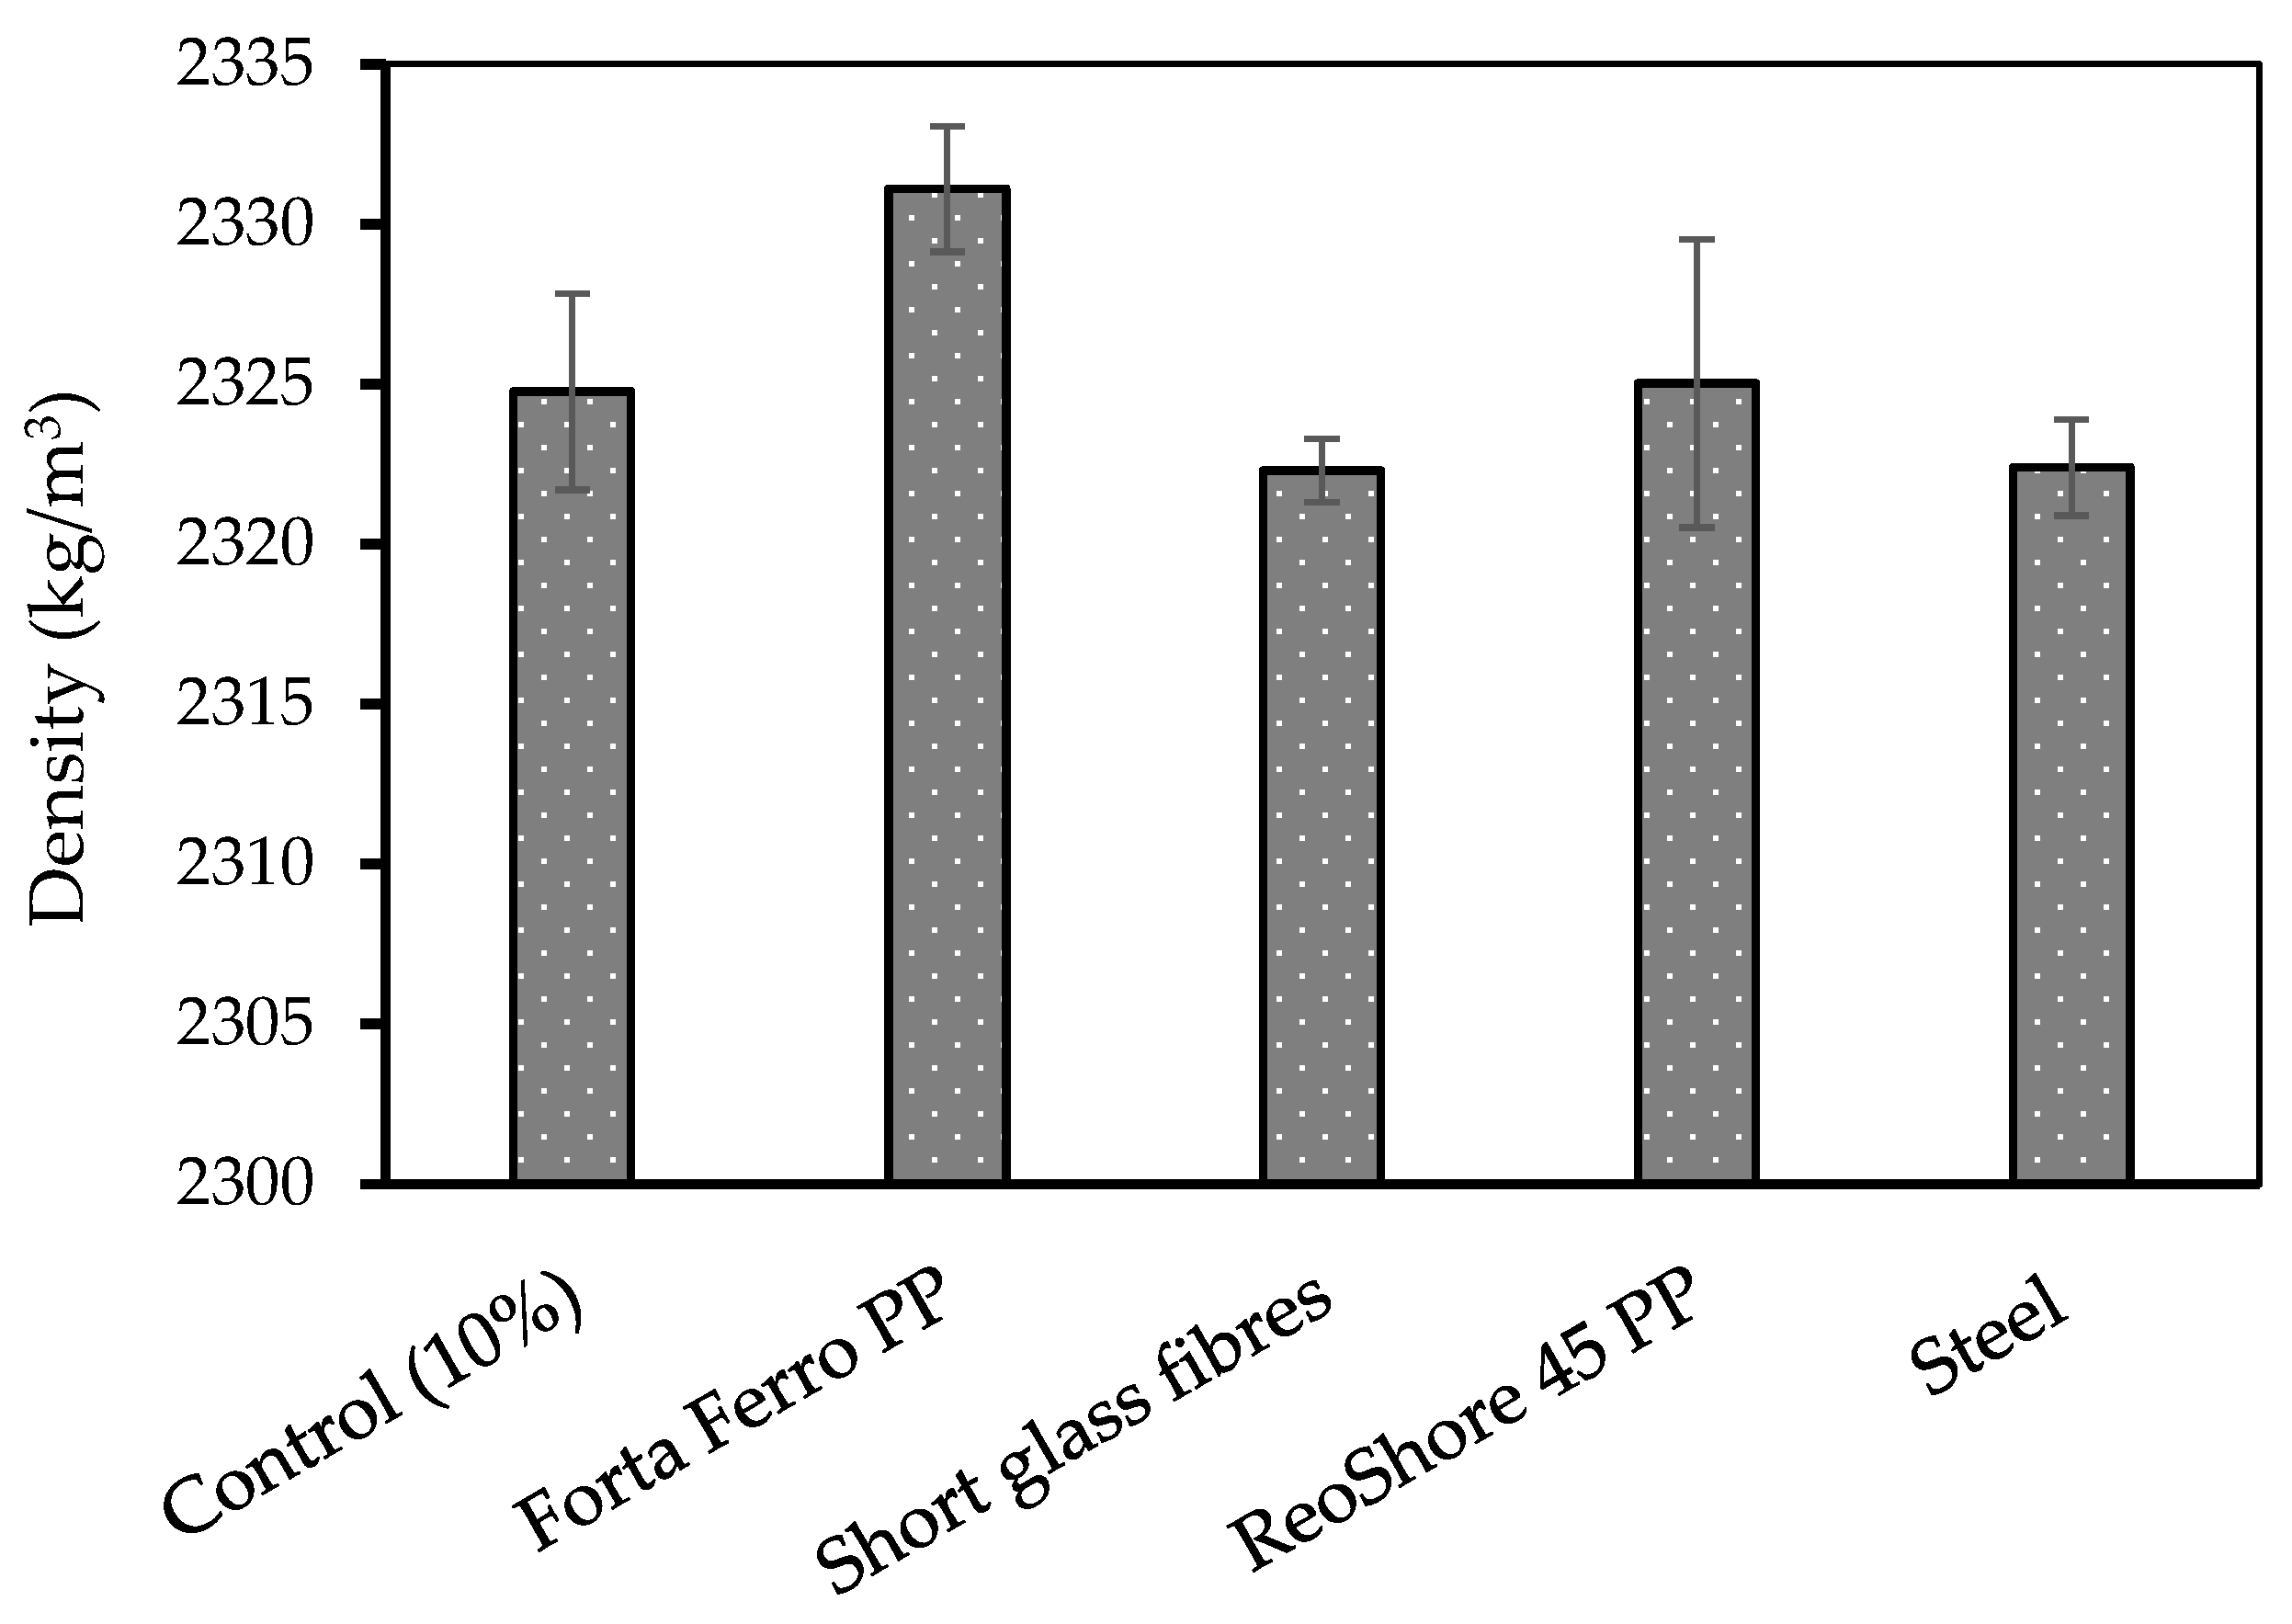
3.7.1. Effect of Fibres on Density
3.7.2. Effect of Fibres on Stress–Displacement
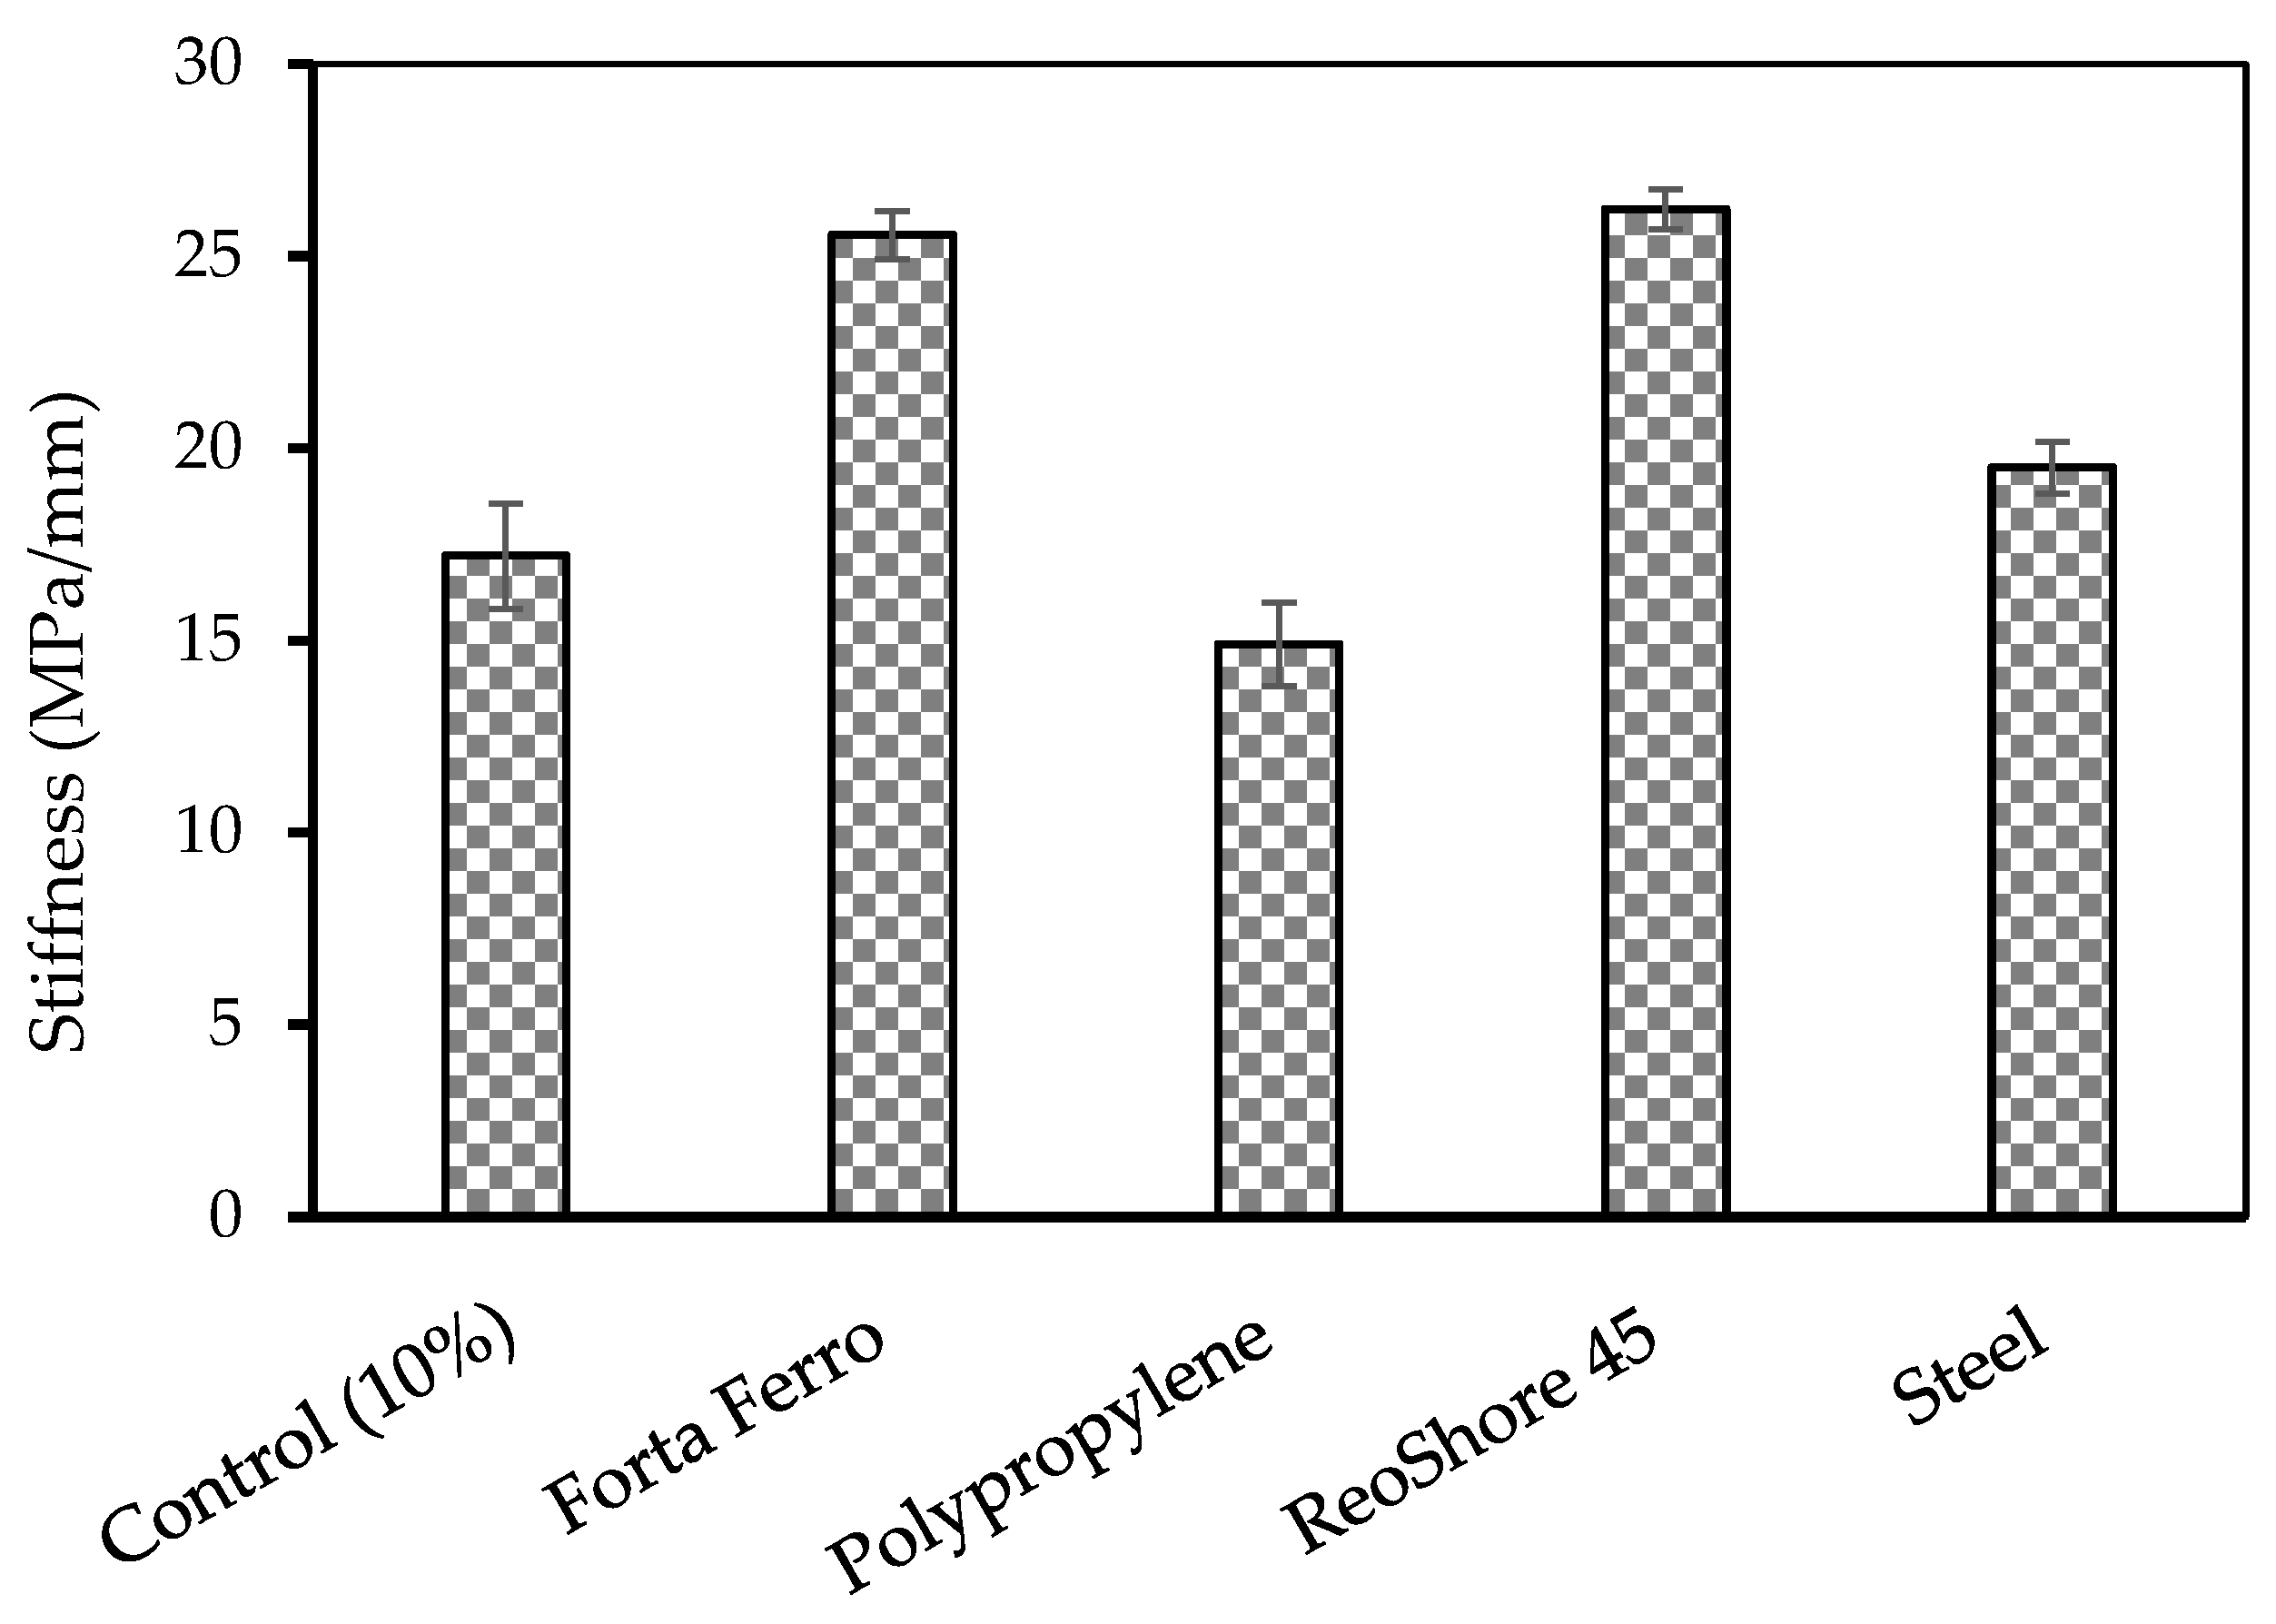
3.7.3. Effect of Fibres on Relative Stiffness
3.7.4. Effect of Fibres on Proportional Limit
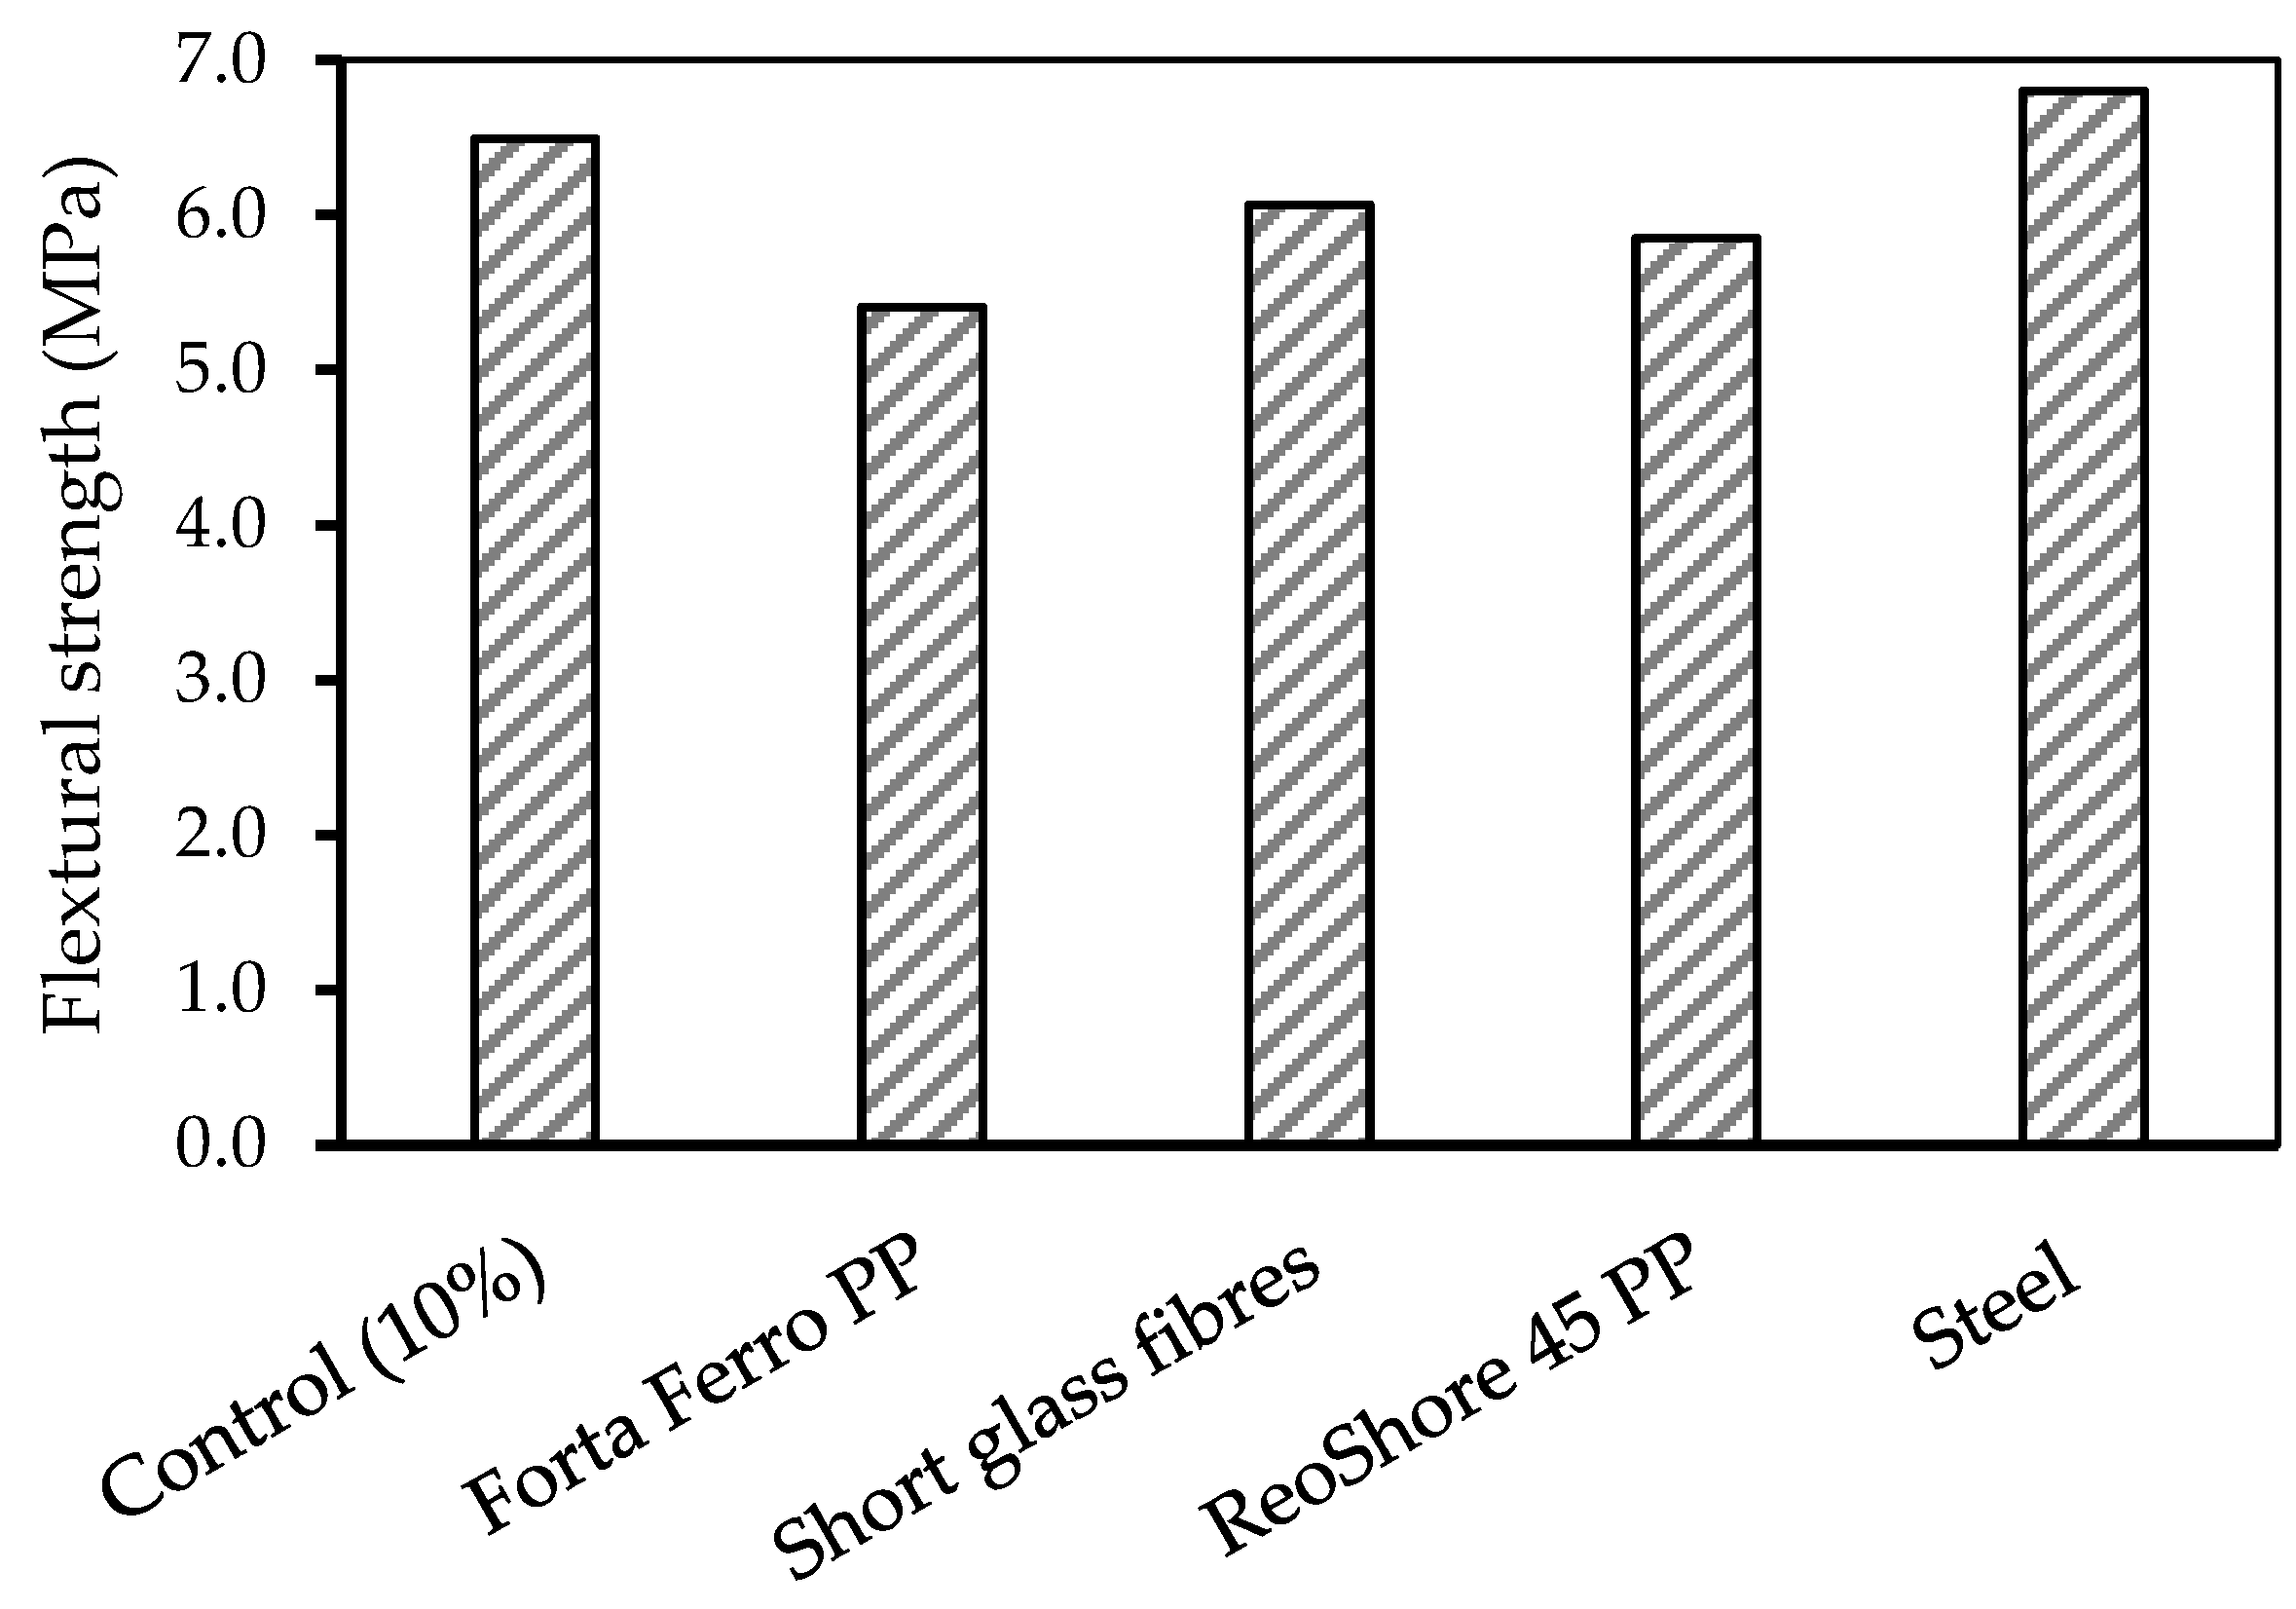
3.8. Effect of Fibres on Flexural Strength
Effect of Fibres on Load–Displacement
3.9. Effect of Fibre Dosage on Oil-Impacted Concrete
3.9.1. Influence of Fibre Dosage on Compression Failure Mode
3.9.2. Influence of Fibre Dosage on Flexural Failure Mode
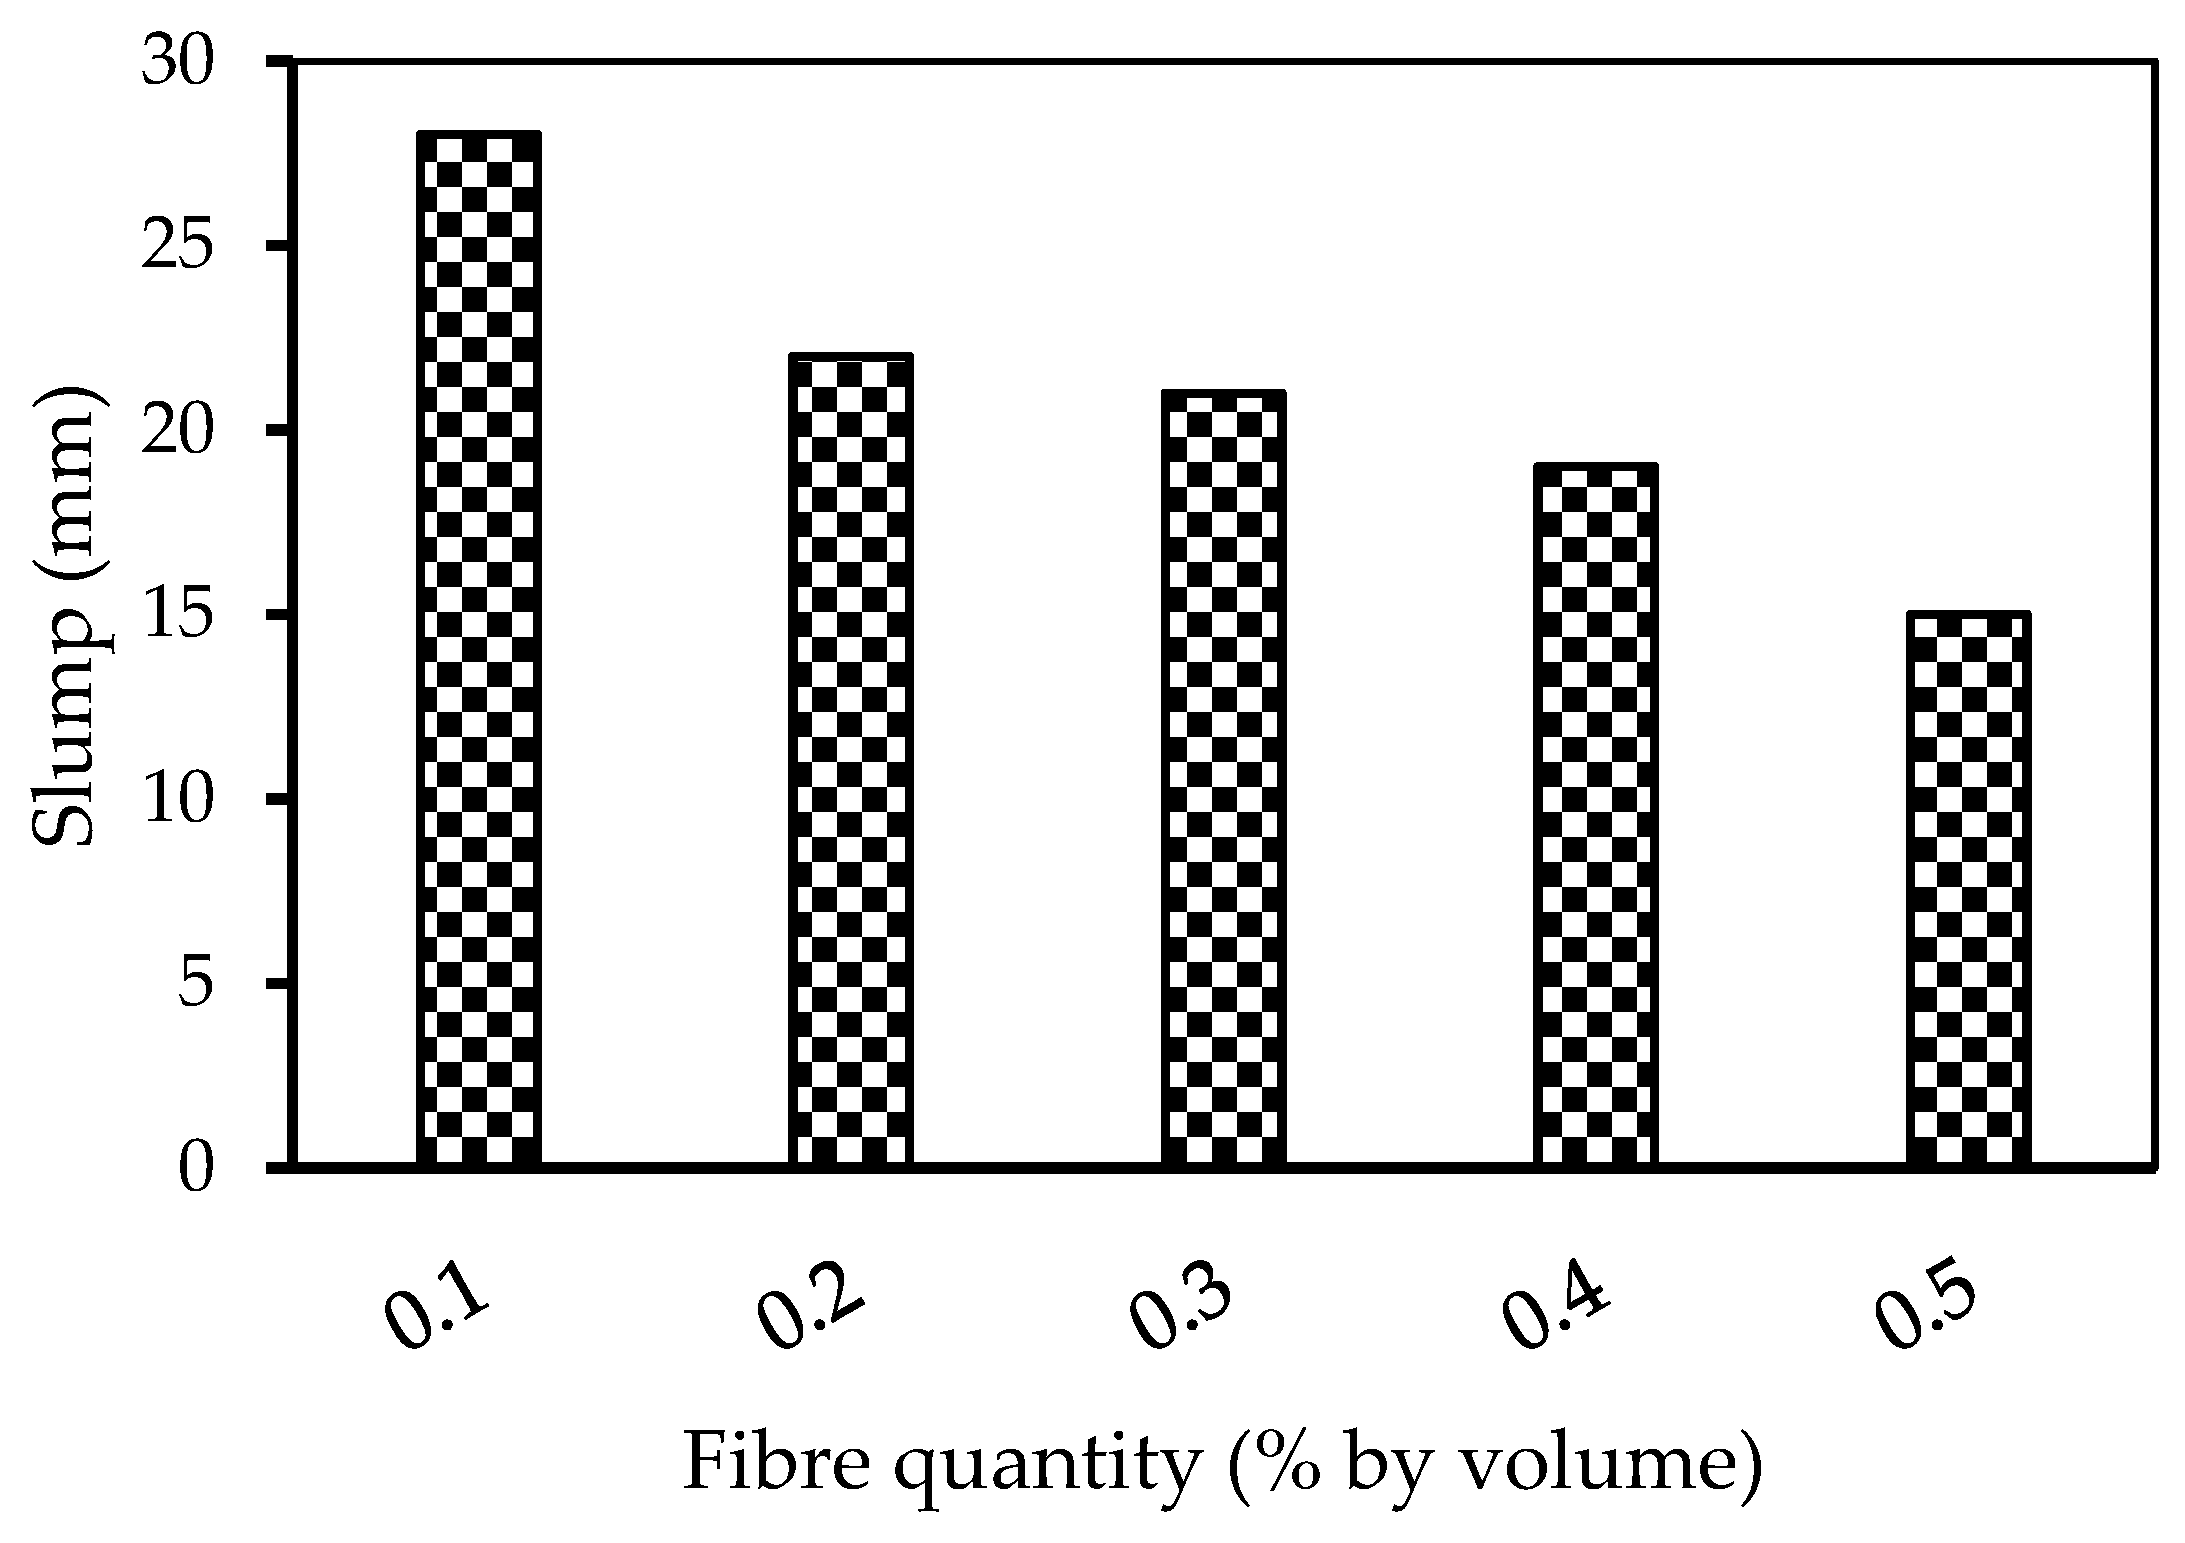
3.9.3. Influence of Fibre Quantity on Workability
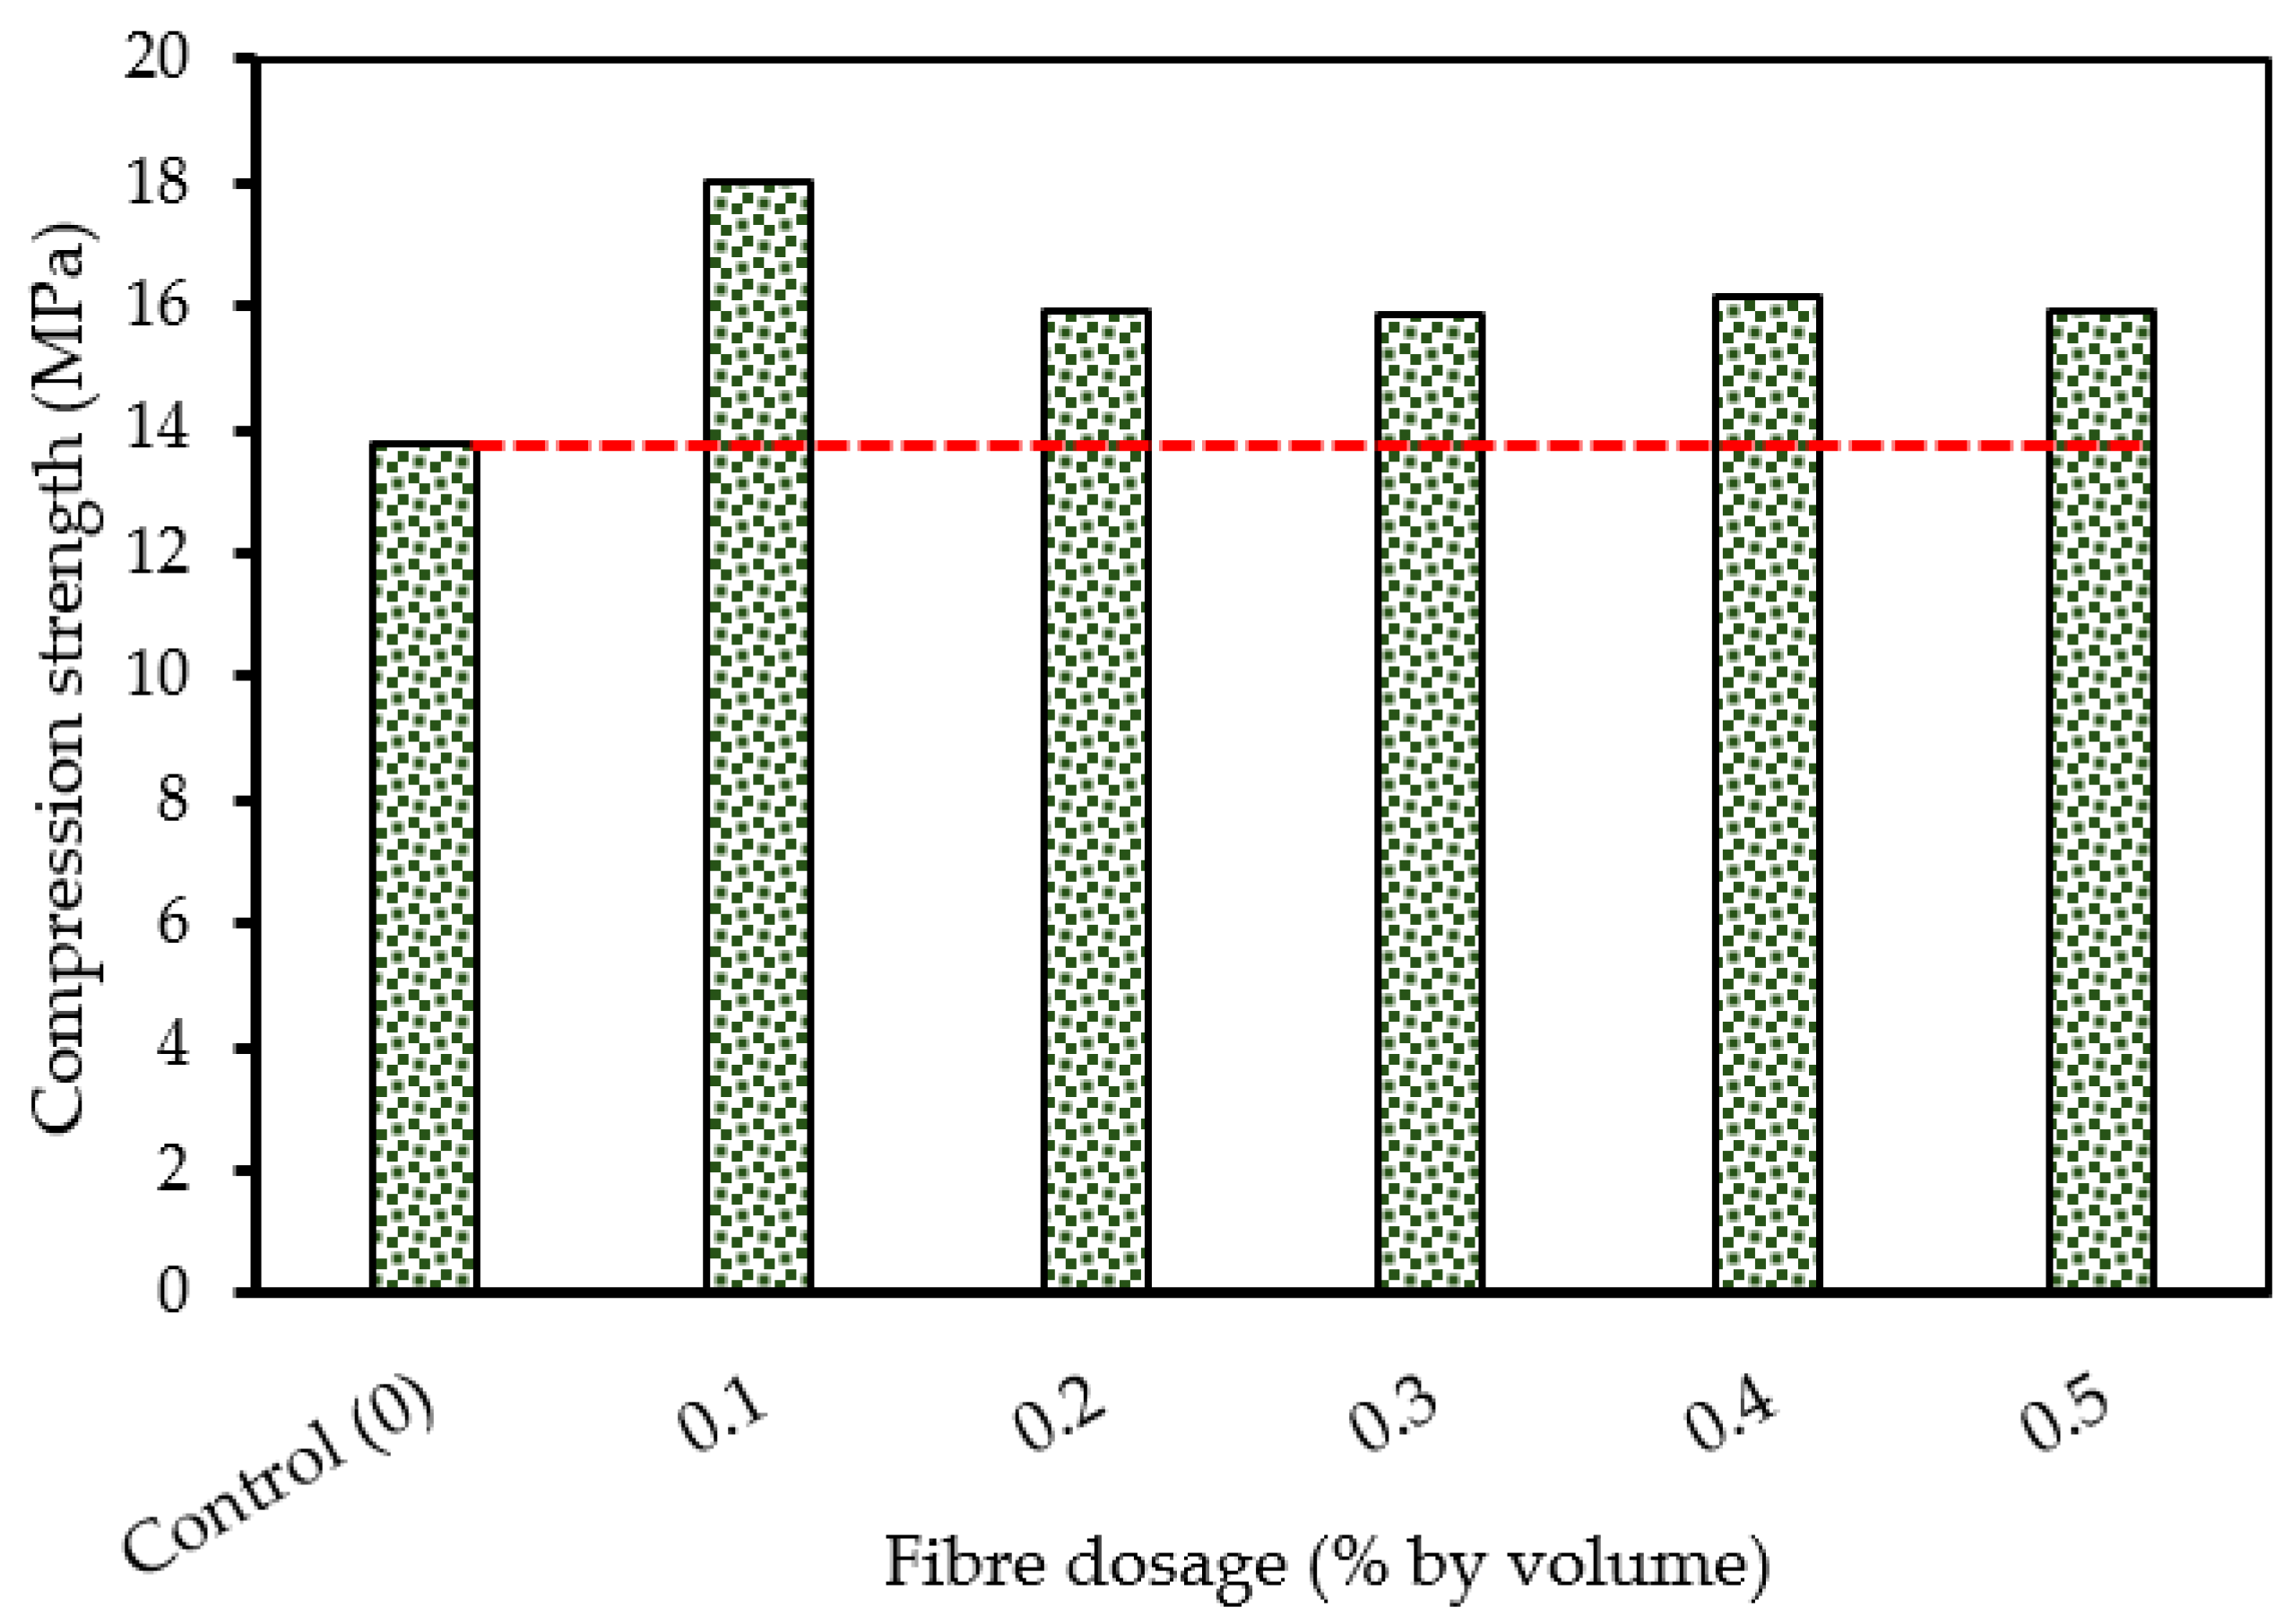
3.9.4. Effect of Fibre Quantity on Compressive Strength
3.9.5. Effect of Steel Fibre Quantity on Stress Behaviour
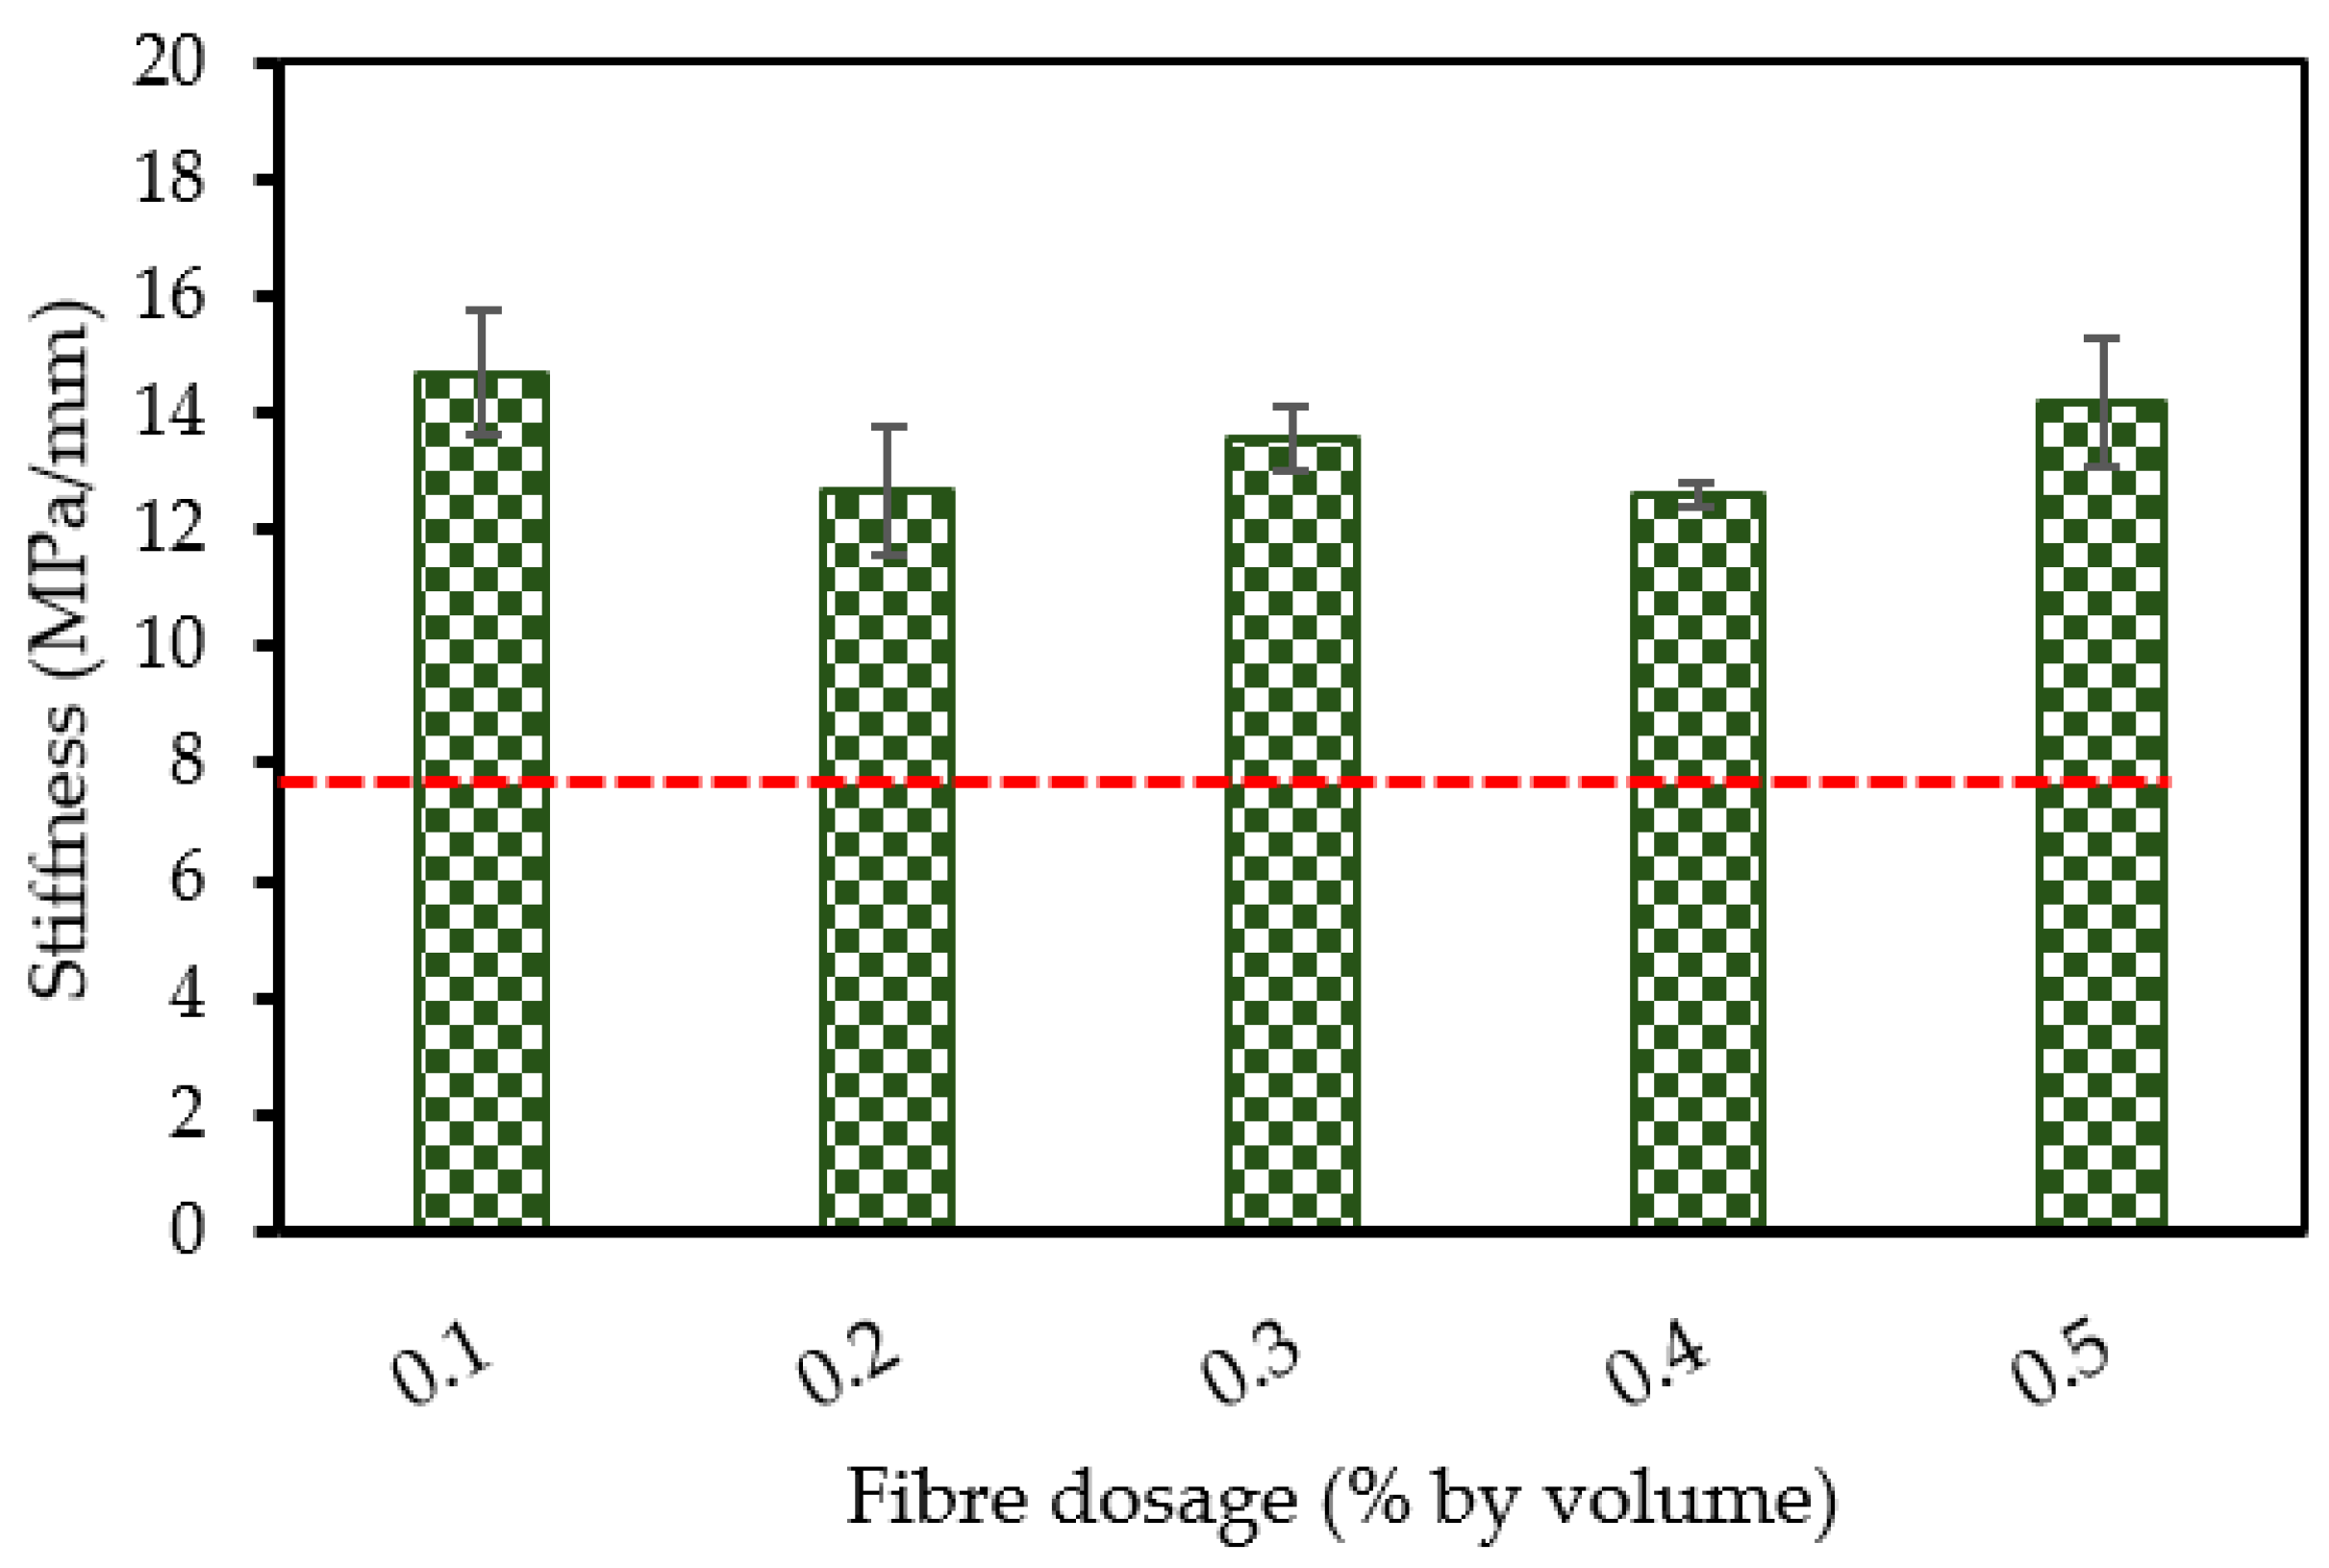
3.9.6. Effect of Steel Fibre Dosage on Stiffness
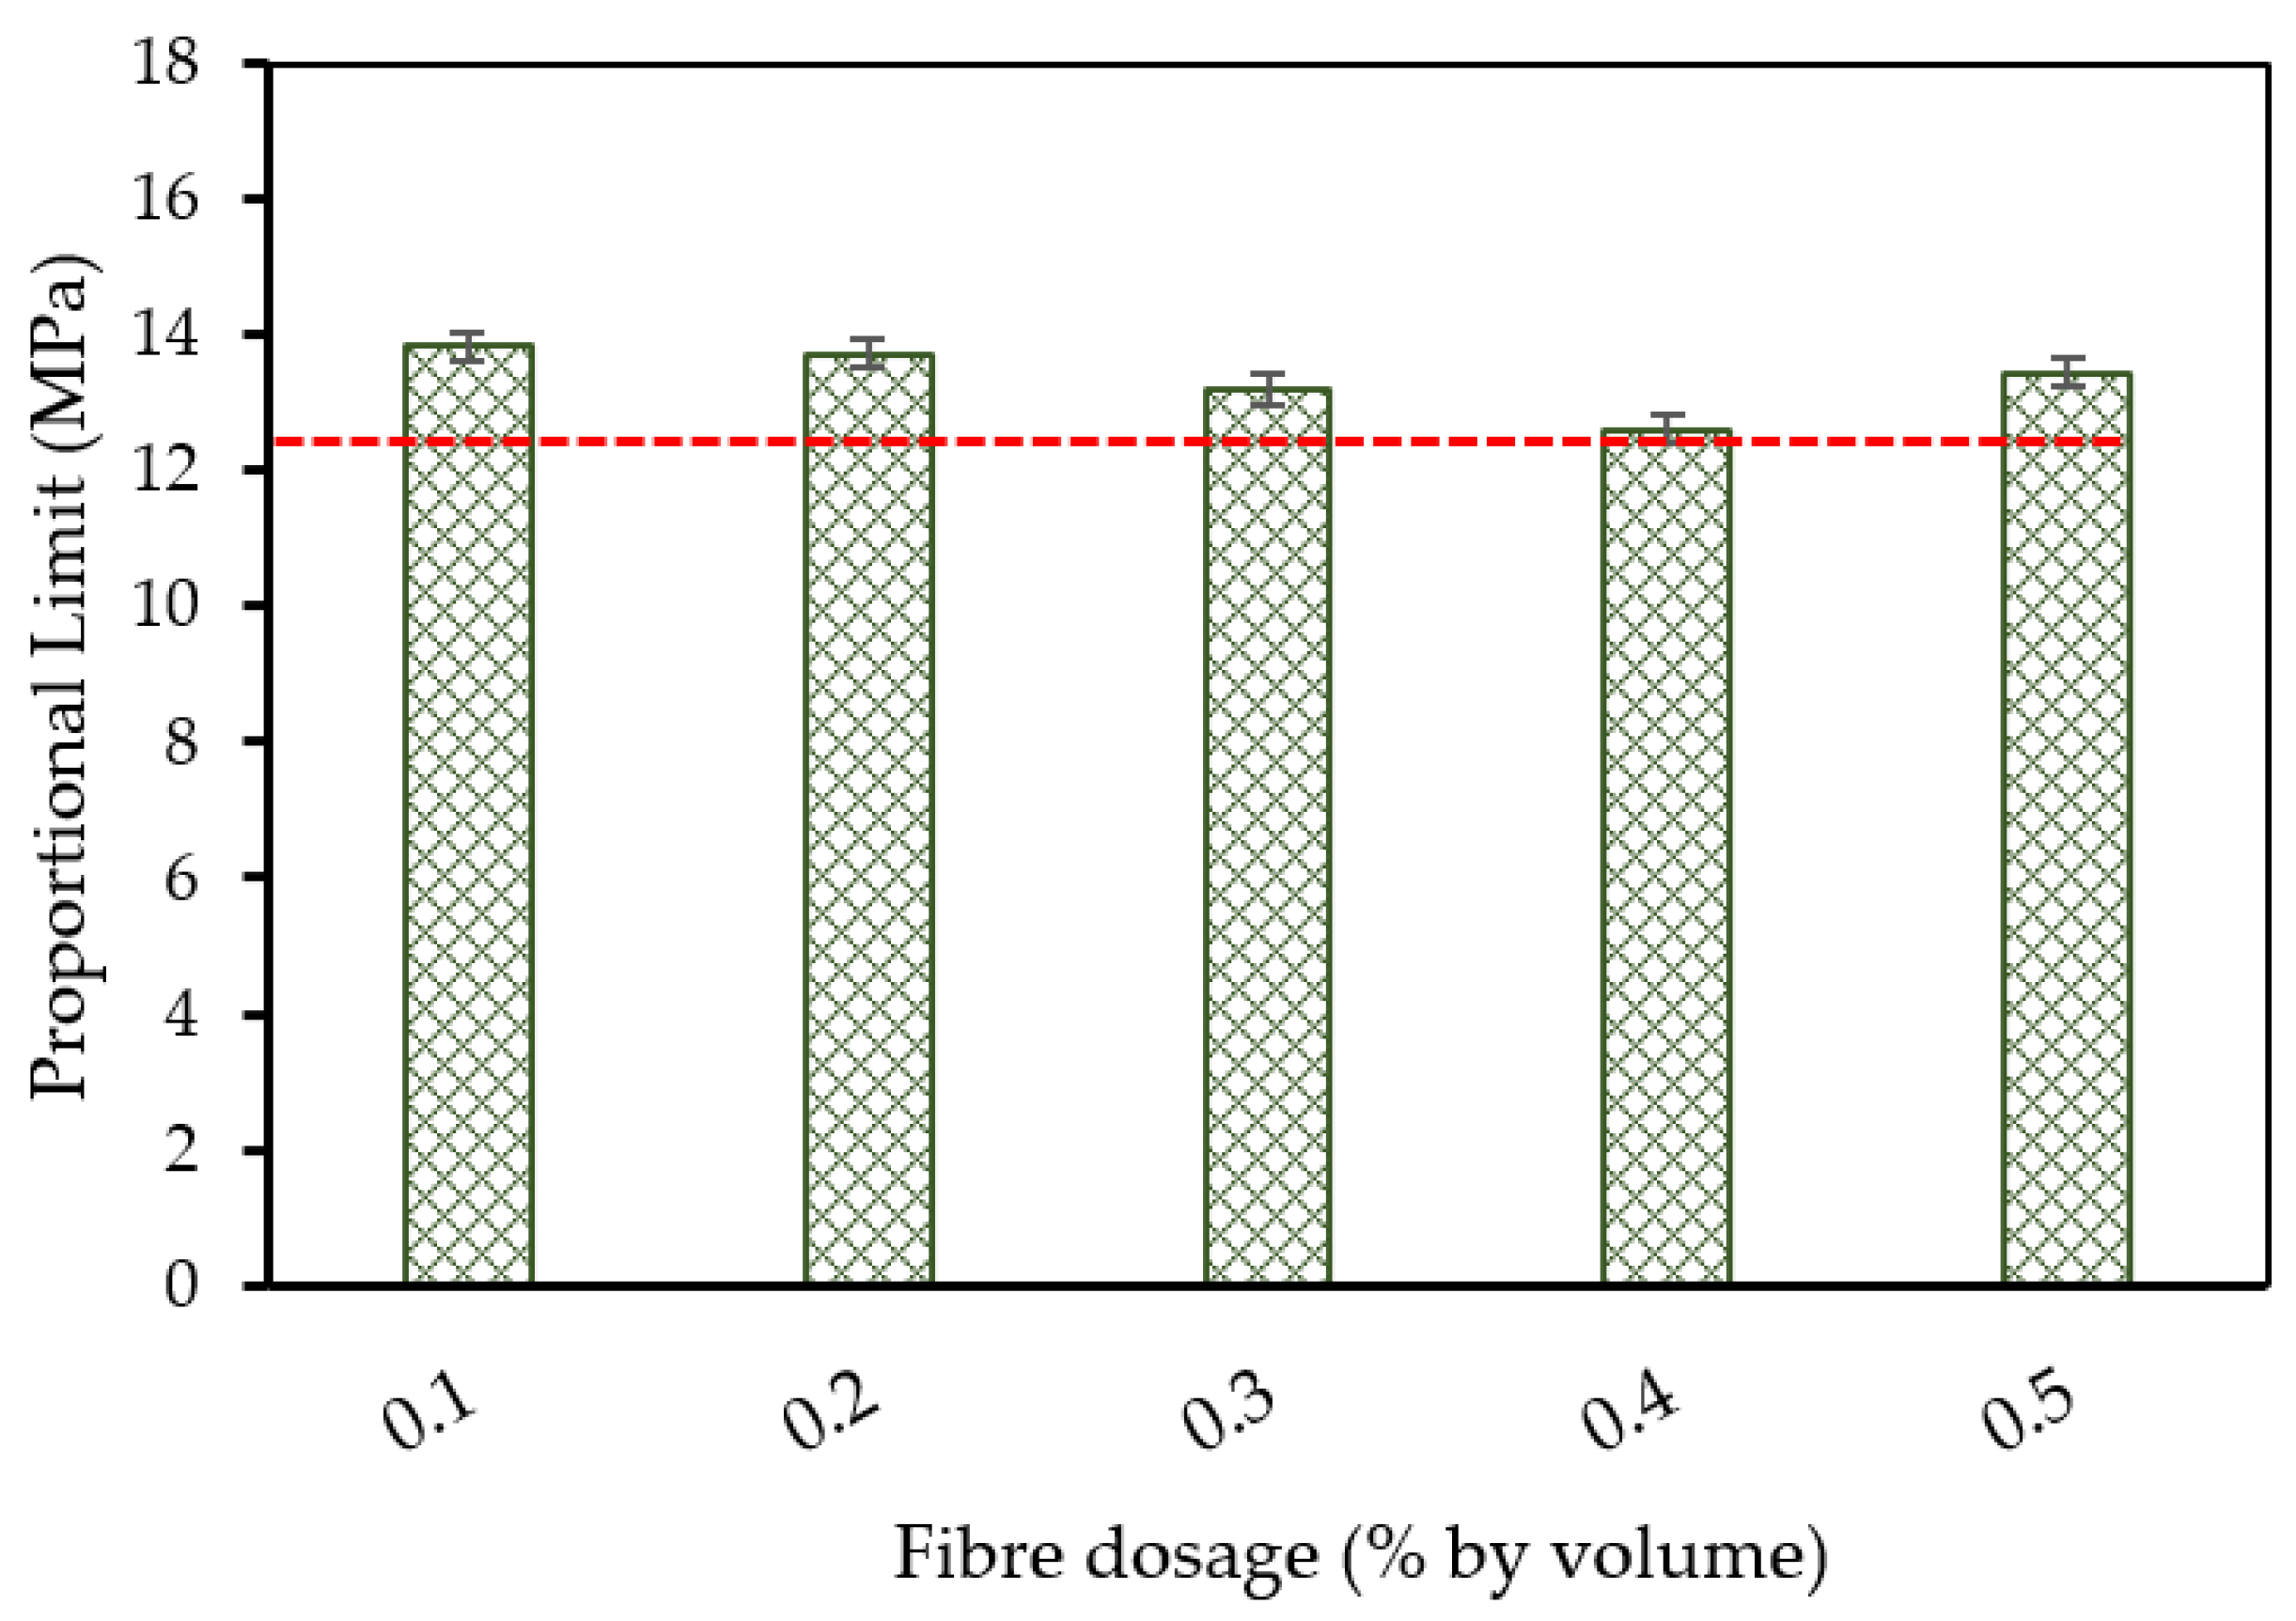
3.9.7. Effect of Steel Fibre Quantity on Proportional Limit
3.9.8. Effect of Steel Fibre Quantity on Flexural Strength
4. Conclusions
Author Contributions
Funding
Institutional Review Board Statement
Informed Consent Statement
Data Availability Statement
Acknowledgments
Conflicts of Interest
References
- Tomassi, A.; Caforio, A.; Romano, E.; Lamponi, E.; Pollini, A. The development of a Competence Framework for Environmental Education complying with the European Qualifications Framework and the European Green Deal. J. Environ. Educ. 2024, 55, 153–179. [Google Scholar] [CrossRef]
- Fazioli, R. Economic Analysis and Evaluations of Natural Gas Hydrates Exploitation by Injection of CO2: Hydrate-Based Carbon Capture Technologies; Tab Edizioni: Rome, Italy, 2024. [Google Scholar]
- Cames, M.; Graichen, J.; Kasten, P.; Kühnel, S.; Faber, J.; Nelissen, D.; Shanthi, H.; Scheelhaase, J.; Grimme, W.; Maertens, S. Climate protection in aviation and maritime transport: Roadmaps for achieving the climate goal. Proj. Rep. 2023, 26, 1–243. [Google Scholar]
- Chevron Corporation 2023. Purpose Powers Progress. Available online: https://www.chevron.com/-/media/chevron/annual-report/2023/documents/2023-Annual-Report.pdf (accessed on 15 July 2024).
- Casey, K. The Coming Chaos: Fossil Fuel Depletion and Global Warming; Dorrance Publishing: Pittsburgh, PA, USA, 2018. [Google Scholar]
- Shayuti, M.S.M.; Zainal, S.; Ya, T.M.Y.S.T.; Abdullah, M.Z.; Shahruddin, M.Z.; Othman, N.H.; Alias, N.H.; Mohd, T.A.T.; Sharudin, R.W. Assessment of contaminants in sand production from petroleum wells offshore Sabah. Environ. Sci. Pollut. Res. 2023, 30, 17122–17128. [Google Scholar] [CrossRef]
- Li, X.; Wang, X.; Ren, Z.J.; Zhang, Y.; Li, N.; Zhou, Q. Sand amendment enhances bioelectrochemical remediation of petroleum hydrocarbon contaminated soil. Chemosphere 2015, 141, 62–70. [Google Scholar] [CrossRef]
- Johnston, J.E.; Lim, E.; Roh, H. Impact of upstream oil extraction and environmental public health: A review of the evidence. Sci. Total Environ. 2019, 657, 187–199. [Google Scholar] [CrossRef]
- Saborimanesh, N. Toward sustainable remediation of oil sands fine Tailings—A review. J. Environ. Manag. 2021, 288, 112418. [Google Scholar] [CrossRef]
- Ordinioha, B.; Brisibe, S. The human health implications of crude oil spills in the Niger delta, Nigeria: An interpretation of published studies. Niger. Med. J. 2013, 54, 10–16. [Google Scholar] [CrossRef] [PubMed]
- Kadafa, A.A. Oil exploration and spillage in the Niger Delta of Nigeria. Civ. Environ. Res. 2012, 2, 38–51. [Google Scholar]
- Mees, E. Ras Lanuf Extinguished After Seven Days. In Middle East Economic Survey; Middle East Petroleum and Economic Publications (Cyprus) Ltd.: Nicosia, Cyprus, 2008; Volume 51, p. 35. [Google Scholar]
- Abousnina, R.; Manalo, A.; Lokuge, W.; Al-Jabri, K.S. Properties and structural behavior of concrete containing fine sand contaminated with light crude oil. Constr. Build. Mater. 2018, 189, 1214–1231. [Google Scholar] [CrossRef]
- Aryee, A. Risks of Offshore Oil Drilling: Causes and Consequences of British Petroleum Oil Rig Explosion. Aquat. Sci. Technol. 2013, 1, 17. [Google Scholar] [CrossRef]
- Jalaei, F.; Zoghi, M.; Khoshand, A. Life cycle environmental impact assessment to manage and optimize construction waste using Building Information Modeling (BIM). Int. J. Constr. Manag. 2021, 21, 784–801. [Google Scholar] [CrossRef]
- Guerin, T.F. Tactical problems with strategic consequences: A case study of how petroleum hydrocarbon suppliers support compliance and reduce risks in the minerals sector. Resour. Policy 2021, 74, 102310. [Google Scholar] [CrossRef]
- Maleki, M.; Kazemzadeh, Y.; Dehghan Monfared, A.; Hasan-Zadeh, A.; Abbasi, S. Bio-enhanced oil recovery (BEOR) methods: All-important review of the occasions and challenges. Can. J. Chem. Eng. 2024, 102, 2364–2390. [Google Scholar] [CrossRef]
- Srour, I.; Chong, W.K.; Zhang, F. Sustainable recycling approach: An understanding of designers’ and contractors’ recycling responsibilities throughout the life cycle of buildings in two US cities. Sustain. Dev. 2012, 20, 350–360. [Google Scholar] [CrossRef]
- Almabrok, M.; McLaughlan, R.; Vessalas, K. Characterisation of cement mortar containing oil-contaminated aggregates. In Proceedings of the Australasian Conference on the Mechanics of Structures and Materials; CRC Press/Balkema: Leiden, The Netherlands, 2013. [Google Scholar]
- Abousnina, R.; Manalo, A.; Ferdous, W.; Lokuge, W.; Benabed, B.; Saif Al-Jabri, K. Characteristics, strength development and microstructure of cement mortar containing oil-contaminated sand. Constr. Build. Mater. 2020, 252, 119155. [Google Scholar] [CrossRef]
- Almabrok, M.; McLaughlan, R.; Vessalas, K. Evaluating the effect of mixing method on the performance of mortar containing oil. Int. J. Eng. Sci. Invent. 2015, 4, 58–64. [Google Scholar]
- Ajagbe, W.O.; Omokehinde, O.S.; Alade, G.A.; Agbede, O.A. Effect of crude oil impacted sand on compressive strength of concrete. Constr. Build. Mater. 2012, 26, 9–12. [Google Scholar] [CrossRef]
- Abousnina, R.M.; Manalo, A.; Shiau, J.; Lokuge, W. Effects of Light Crude Oil Contamination on the Physical and Mechanical Properties of Fine Sand. Soil Sediment Contam. Int. J. 2015, 24, 833–845. [Google Scholar] [CrossRef]
- Oluremi, J.R.; Osuolale, O.M. Oil contaminated soil as potential applicable material in civil engineering construction. J. Environ. Earth Sci. 2014, 4, 87–99. [Google Scholar]
- Abousnina, R.; Alsalmi, H.I.; Manalo, A.; Allister, R.L.; Alajarmeh, O.; Ferdous, W.; Jlassi, K. Effect of Short Fibres in the Mechanical Properties of Geopolymer Mortar Containing Oil-Contaminated Sand. Polymers 2021, 13, 3008. [Google Scholar] [CrossRef]
- Maddah, M.; Bencheikh, V. Properties of concrete reinforced with different kinds of industrial waste fiber materials. Constr. Build. Mater. 2009, 23, 3196–3205. [Google Scholar] [CrossRef]
- Yuhazri, M.; Zulfikar, A.; Ginting, A. Fiber reinforced polymer composite as a strengthening of concrete structures: A review. IOP Conf. Ser. Mater. Sci. Eng. 2020, 1003, 12135. [Google Scholar] [CrossRef]
- Maccaferri. Fibers as Structural Element for the Reinforcement of Concrete. 2015. Available online: http://maccaferribalkans.com/al/docs/documents/broshura/fibers.pdf (accessed on 20 May 2024).
- Døssland, Å.L. Fibre Reinforcement in Load Carrying Concrete Structures: Laboratory and Field Investigations Compared with Theory and Finite Element Analysis. Ph.D. Thesis, Norwegian University of Science and Technology, Trondheim, Norway, 2008. [Google Scholar]
- Khan, M.; Abbas, Y.; Fares, G. Review of high and ultrahigh performance cementitious composites incorporating various combinations of fibers and ultrafines. J. King Saud Univ.-Eng. Sci. 2017, 29, 339–347. [Google Scholar] [CrossRef]
- Abousnina, R.; Manalo, A.; Lokuge, W.; Zhang, Z. Effects of light crude oil contamination on the physical and mechanical properties of geopolymer cement mortar. Cem. Concr. Compos. 2018, 90, 136–149. [Google Scholar] [CrossRef]
- AS 1141.11.1; Methods for Sampling and Testing Aggregates—Particle Size Distribution—Sieving Method. Standards Australia: Sydney, Australia, 2009. Available online: https://pdfcoffee.com/as-1141111-2009-methods-for-sampling-and-testing-aggregates-particle-size-distribution-sieving-method-pdf-free.html (accessed on 20 May 2024).
- AS 1726; Geotechnical Site Investigations. Standards Australia: Sydney, Australia, 1993. Available online: https://pdfcoffee.com/1726-australian-standard-pdf-free.html (accessed on 20 May 2024).
- SImetric. Specific Gravity of Liquids. Available online: http://www.simetric.co.uk/si_liquids.htm (accessed on 20 May 2024).
- Guideline, D. Design of Concrete Structures-Steel wire fibre reinforced concrete structures with or without ordinary reinforcement. Infrastuct. Het Leefmilieu Dep. Leefmilieu Infrastuct. 1995, 4, 227–239. [Google Scholar]
- Naaman, A.E. Engineered steel fibers with optimal properties for reinforcement of cement composites. J. Adv. Concr. Technol. 2003, 1, 241–252. [Google Scholar] [CrossRef]
- ASTM C1231; Standard Practice for Use of Unbonded Caps in Determination of Compressive Strength of Hardened Cylindrical Concrete Specimens. ASTM: West Conshohocken, PA, USA, 2014; Volume 4.
- ASTM C1609; Standard Test Method for Flexural Performance of Fiber-Reinforced Concrete (Using Beam with Third-Point Loading). ASTM: West Conshohocken, PA, USA, 2019.
- Osuji, L.C.; Ezebuiro, P.E. Hydrocarbon contamination of a typical mangrove floor in Niger Delta, Nigeria. Int. J. Environ. Sci. Technol. 2006, 3, 313–320. [Google Scholar] [CrossRef]
- Lee, S.-Y.; An, J.; Kim, J.; Kwon, J.-H. Enhanced settling of microplastics after biofilm development: A laboratory column study mimicking wastewater clarifiers. Environ. Pollut. 2022, 311, 119909. [Google Scholar] [CrossRef]
- Umar, A.; Ghosh, S.K. Effect of Oil Contamination on the Properties of Concrete. J. Mater. Civ. Eng. 2012, 24, 629–634. [Google Scholar] [CrossRef]
- Abousnina, R.M.; Manalo, A.; Lokuge, W.; Shiau, J. Oil Contaminated Sand: An Emerging and Sustainable Construction Material. Procedia Eng. 2015, 118, 1119–1126. [Google Scholar] [CrossRef]
- Spence, R.D.; Shi, C. Stabilization and Solidification of Hazardous, Radioactive, and Mixed Wastes; CRC Press: Boca Raton, FL, USA, 2004. [Google Scholar]
- Fragomeni, S.; Venkatesan, S. Incorporating Sustainable Practice in Mechanics and Structures of Materials; CRC Press: Boca Raton, FL, USA, 2010. [Google Scholar]
- Sriravindrarajah, R.; Do, H.; Nguyen, L.; Aoki, Y. Effect of clogging on the water permeability of pervious concrete. In Incorporating Sustainable Practice in Mechanics and Structures of Materials; Fragomeni, S., Venkatesan, S., Eds.; Taylor & Francis Group: London, UK, 2011. [Google Scholar]
- Trezza, M.; Scian, A. Waste fuels: Their effect on Portland cement clinker. Cem. Concr. Res. 2005, 35, 438–444. [Google Scholar] [CrossRef]
- Rai, A.; Joshi, Y. Applications and properties of fibre reinforced concrete. J. Eng. Res. Appl. 2014, 4, 123–131. [Google Scholar]
- Ezeldin, A.S.; Balaguru, P.N. Normal-and high-strength fiber-reinforced concrete under compression. J. Mater. Civ. Eng. 1992, 4, 415–429. [Google Scholar] [CrossRef]
- Markeset, G.; Hillerborg, A. Softening of concrete in compression—Localization and size effects. Cem. Concr. Res. 1995, 25, 702–708. [Google Scholar] [CrossRef]
- Lee, S.-C.; Oh, J.-H.; Cho, J.-Y. Compressive behavior of fiber-reinforced concrete with end-hooked steel fibers. Materials 2015, 8, 1442–1458. [Google Scholar] [CrossRef]
- Kooiman, A.G. Modelling Steel Fibre Reinforced Concrete for Structural Design; Springer: Singapore, 2000. [Google Scholar]
- Löfgren, I. Fibre-Reinforced Concrete for Industrial Construction. Ph.D. Thesis, Chalmbers University of Technology, Göteborg, Sweden, 2005. [Google Scholar]
- Beaudoin, J.J. Handbook of Fiber-Reinforced Concrete: Principles, Properties, Developments and Applications; William Andrew: Norwich, NY, USA, 1990. [Google Scholar]
- Alhozaimy, A.; Soroushian, P.; Mirza, F. Mechanical properties of polypropylene fiber reinforced concrete and the effects of pozzolanic materials. Cem. Concr. Compos. 1996, 18, 85–92. [Google Scholar] [CrossRef]
- Wang, H.; Wang, L. Experimental study on static and dynamic mechanical properties of steel fiber reinforced lightweight aggregate concrete. Constr. Build. Mater. 2013, 38, 1146–1151. [Google Scholar] [CrossRef]
- Yazıcı, Ş.; İnan, G.; Tabak, V. Effect of aspect ratio and volume fraction of steel fiber on the mechanical properties of SFRC. Constr. Build. Mater. 2007, 21, 1250–1253. [Google Scholar] [CrossRef]
- Sarbini, N.N.; Ibrahim, I.S.; Saim, A.A. Enhancement on strength properties of steel fibre reinforced concretE. In Proceedings of the 3rd International Conference European Asian Civil Engineering Forum (EACEF) Conference, Yogyakarta, Indonesia, 20–22 September 2011. [Google Scholar]
- Lamond, J.F.; Pielert, J.H. Significance of Tests and Properties of Concrete and Concrete-Making Materials; ASTM International: West Conshohocken, PA, USA, 2006; Volume 169. [Google Scholar]
- Mansour, F.R.; Parniani, S.; Ibrahim, I.S. Experimental study on effects of steel fiber volume on mechanical properties of SFRC. Adv. Mater. Res. 2011, 214, 144–148. [Google Scholar] [CrossRef]
- Hsu, L.S.; Hsu, C.T. Stress-strain behavior of steel-fiber high-strength concrete under compression. Struct. J. 1994, 91, 448–457. [Google Scholar]
- Neves, R.D.; Fernandes de Almeida, J. Compressive behaviour of steel fibre reinforced concrete. Struct. Concr. 2005, 6, 1–8. [Google Scholar] [CrossRef]


| Type of Fibre | Forta Ferro | ReoShore 45 | Glass Fibres | Steel Fibres |
|---|---|---|---|---|
| Material | 100% virgin copolymer/polypropylene | 100% virgin copolymer/polypropylene (high-performance polypropylene geotextile) | Virgin homopolymer polypropylene | Bright low-carbon steel wire |
| Form | A twisted bundle of non-fibrillated monofilaments | Monofilament fibre system | Collated fibrillated fibre | Round wire, hooked shape |
| Fibre Count | 161,900/kg | 31,000/kg | 15,318/kg | |
| Length | 38 mm | 45 mm | 19 mm | 35 mm |
| Estimated Diameter | 0.8 mm | 0.8 mm | 0.55 mm | |
| Specific Gravity | 0.91 | 0.8 mm | 0.91 | 2.4 mm |
| Tensile Strength | 570–660 MPa | 0.91 | 570–660 MPa | 2.5 mm |
| Melting Point | 160 °C | Excellent | 7.93 | |
| Colour | Grey | 750–850 MPa | White | 1250–1350 MPa |
 | 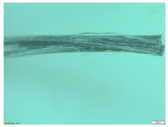 |  | 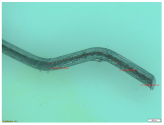 |
| Test | Type of Fibre | Fibre Quantity | |
|---|---|---|---|
| % by Volume | kg/m3 | ||
| Compression | Forta Ferro PP | 0.1 | 0.91 |
| ReoShore 45 | 0.91 | ||
| Polypropylene | 0.91 | ||
| Steel | 7.93 | ||
| Flexural | Forta Ferro-PP | 0.1 | 0.91 |
| ReoShore 45 | 0.91 | ||
| Polypropylene | 0.91 | ||
| Steel | 7.93 | ||
| Test | Type of Fibre | Fibre Quantity | |
|---|---|---|---|
| % by Volume | kg/m3 | ||
| Compression | Steel | 0.1 | 0.9 |
| 0.2 | 15.86 | ||
| 0.3 | 23.79 | ||
| 0.4 | 31.72 | ||
| Flexural | Steel | 0.1 | 0.9 |
| 0.2 | 15.86 | ||
| 0.3 | 23.79 | ||
| 0.4 | 31.72 | ||
Disclaimer/Publisher’s Note: The statements, opinions and data contained in all publications are solely those of the individual author(s) and contributor(s) and not of MDPI and/or the editor(s). MDPI and/or the editor(s) disclaim responsibility for any injury to people or property resulting from any ideas, methods, instructions or products referred to in the content. |
© 2024 by the authors. Licensee MDPI, Basel, Switzerland. This article is an open access article distributed under the terms and conditions of the Creative Commons Attribution (CC BY) license (https://creativecommons.org/licenses/by/4.0/).
Share and Cite
Aljuaydi, F.; Abousnina, R.; Alajarmeh, O.; Alajmi, A. The Influence of Fibres on the Properties and Sustainability of Oil-Impacted Concrete. Sustainability 2024, 16, 7344. https://doi.org/10.3390/su16177344
Aljuaydi F, Abousnina R, Alajarmeh O, Alajmi A. The Influence of Fibres on the Properties and Sustainability of Oil-Impacted Concrete. Sustainability. 2024; 16(17):7344. https://doi.org/10.3390/su16177344
Chicago/Turabian StyleAljuaydi, Fahad, Rajab Abousnina, Omar Alajarmeh, and Abdalrahman Alajmi. 2024. "The Influence of Fibres on the Properties and Sustainability of Oil-Impacted Concrete" Sustainability 16, no. 17: 7344. https://doi.org/10.3390/su16177344