

Mechanisms of Charged Particle Motion during Capture by Charged Droplets in Marine Diesel Exhaust


Abstract
1. Introduction
2. Mathematical Model Mechanism
- Ideal steady incompressible viscous flow field;
- Laminar flow field;
- The black carbon particle and droplet are both single solid spherical particles;
- The droplet is static in the flow field, and the movement of the particle in the flow field around the liquid droplet is the main target considered in this study;
- The direction of gas flow and particle movement is vertical upward.
2.1. Particle Motion Equation
2.2. Air Flow Field Distribution
3. Mathematical Results and Discussion
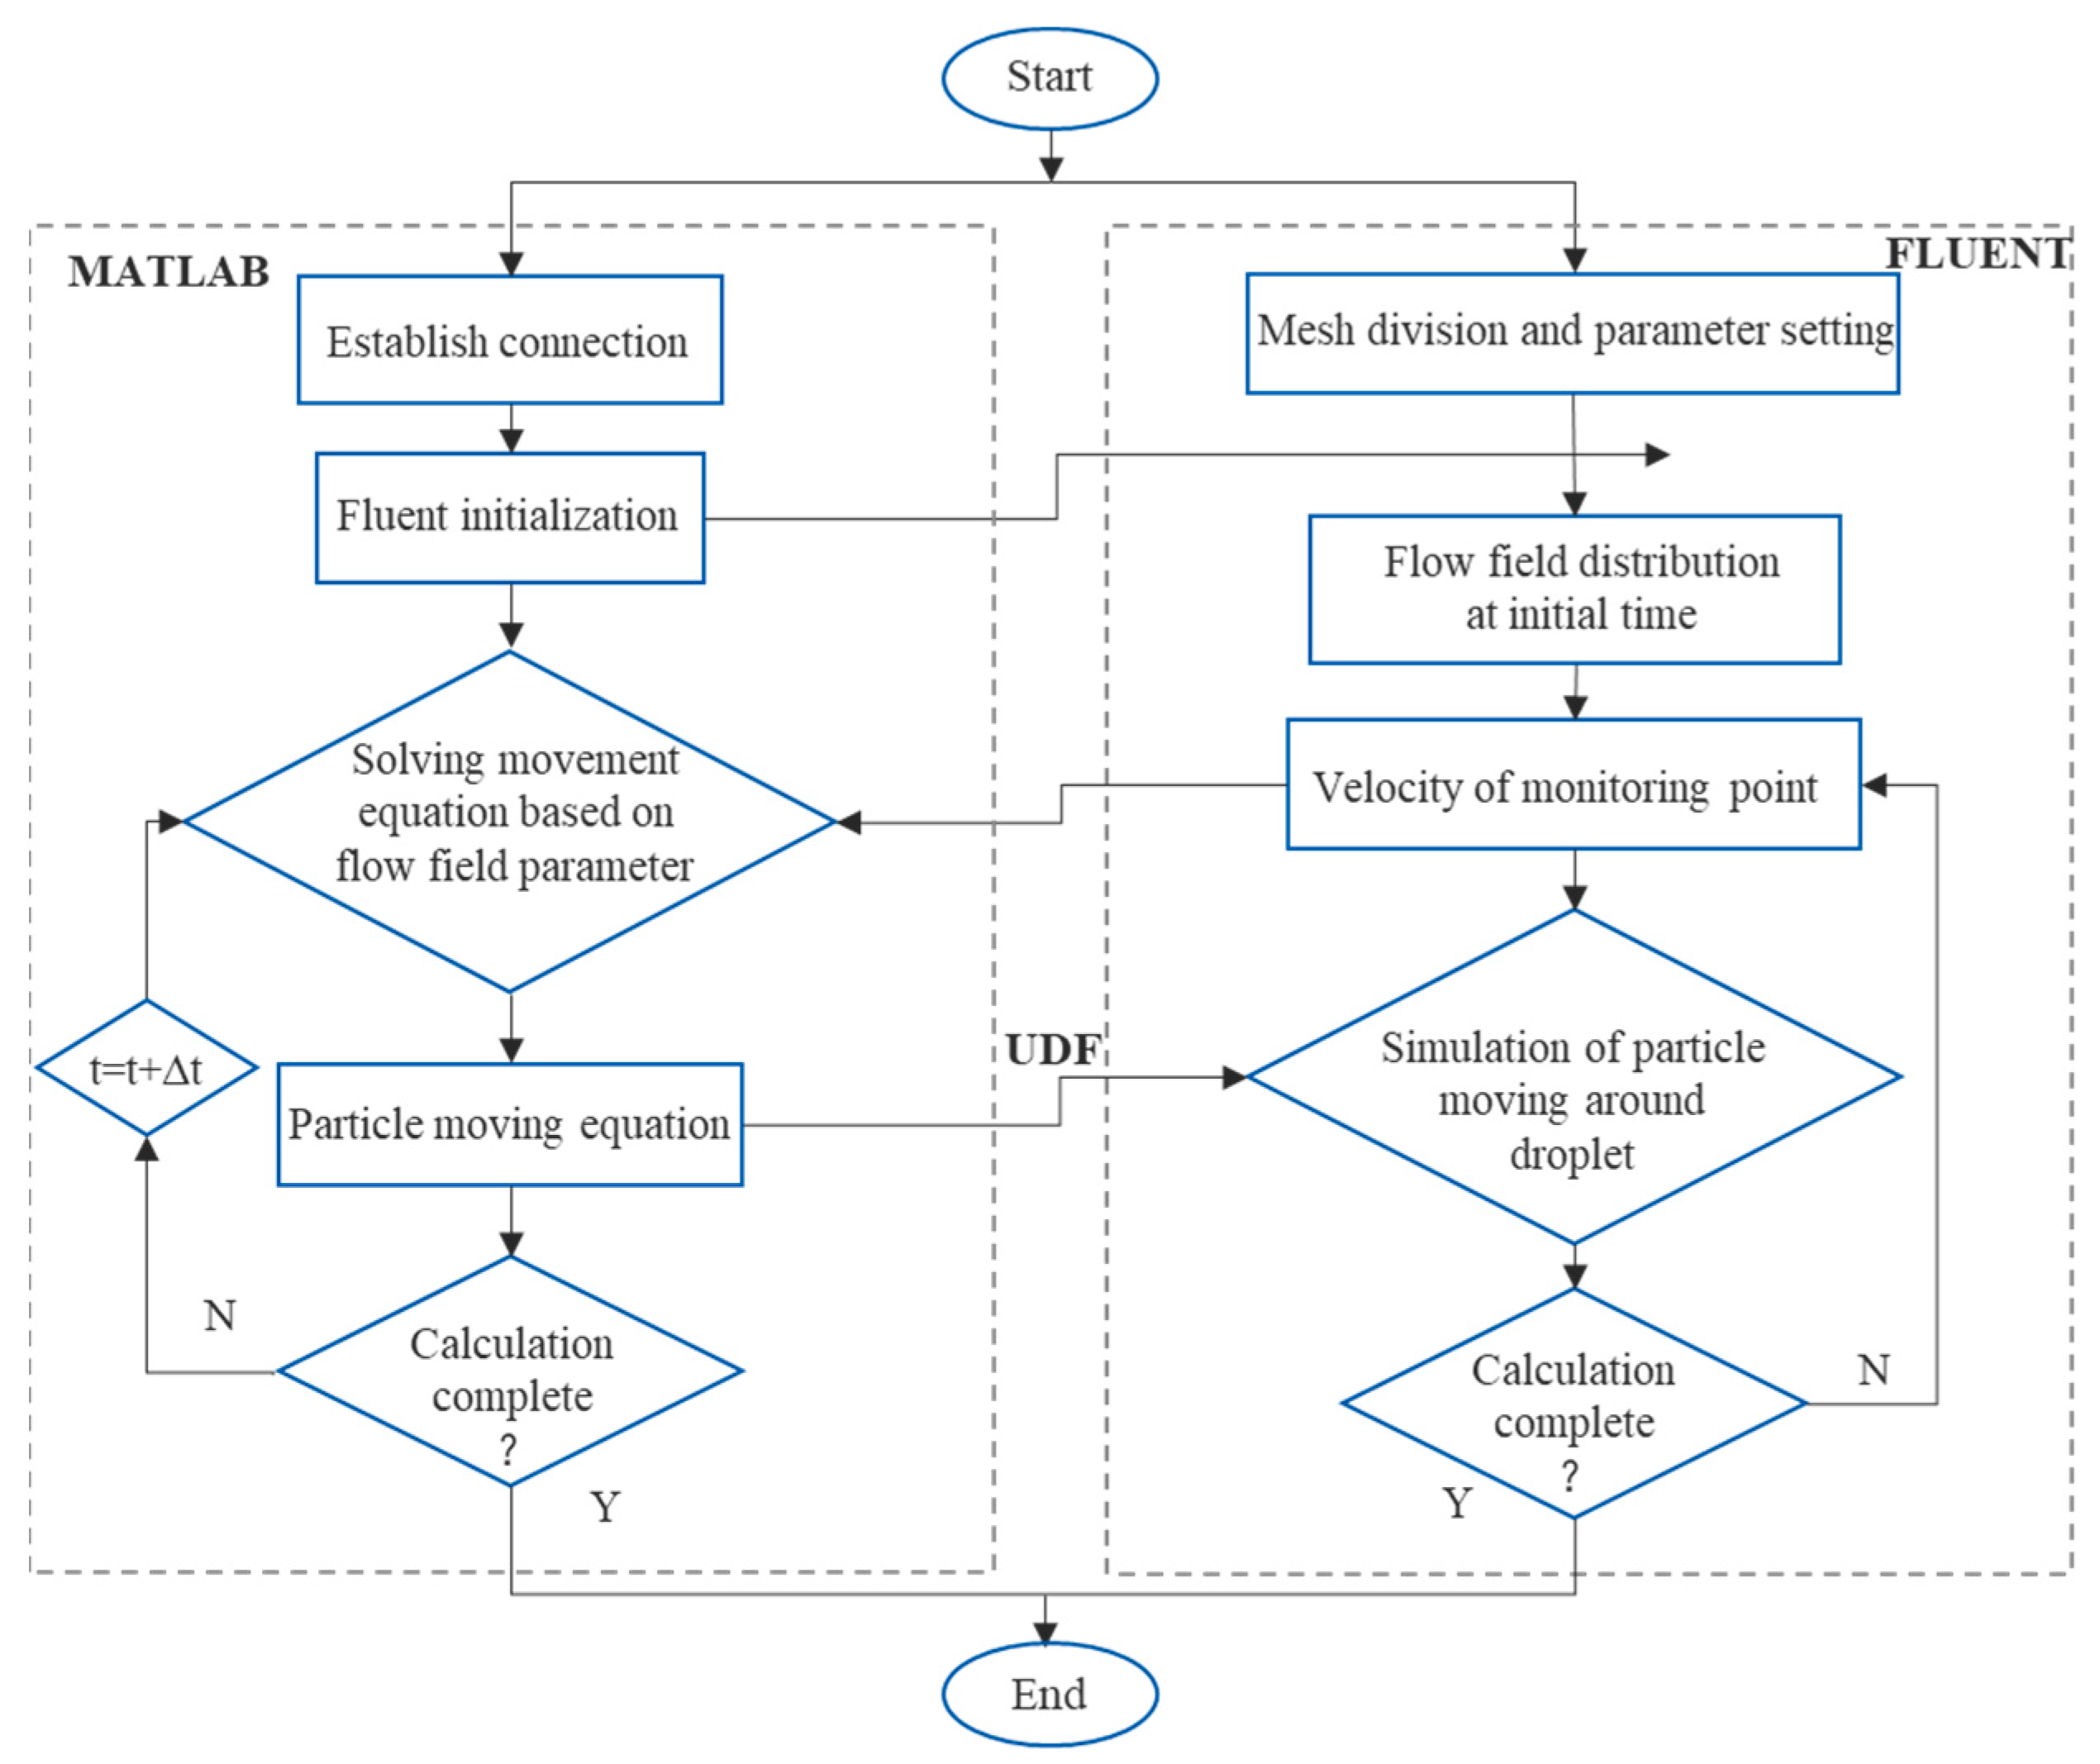
4. Co-Simulation with ANSYS Fluent and MATLAB
4.1. Co-Simulation Mechanisms
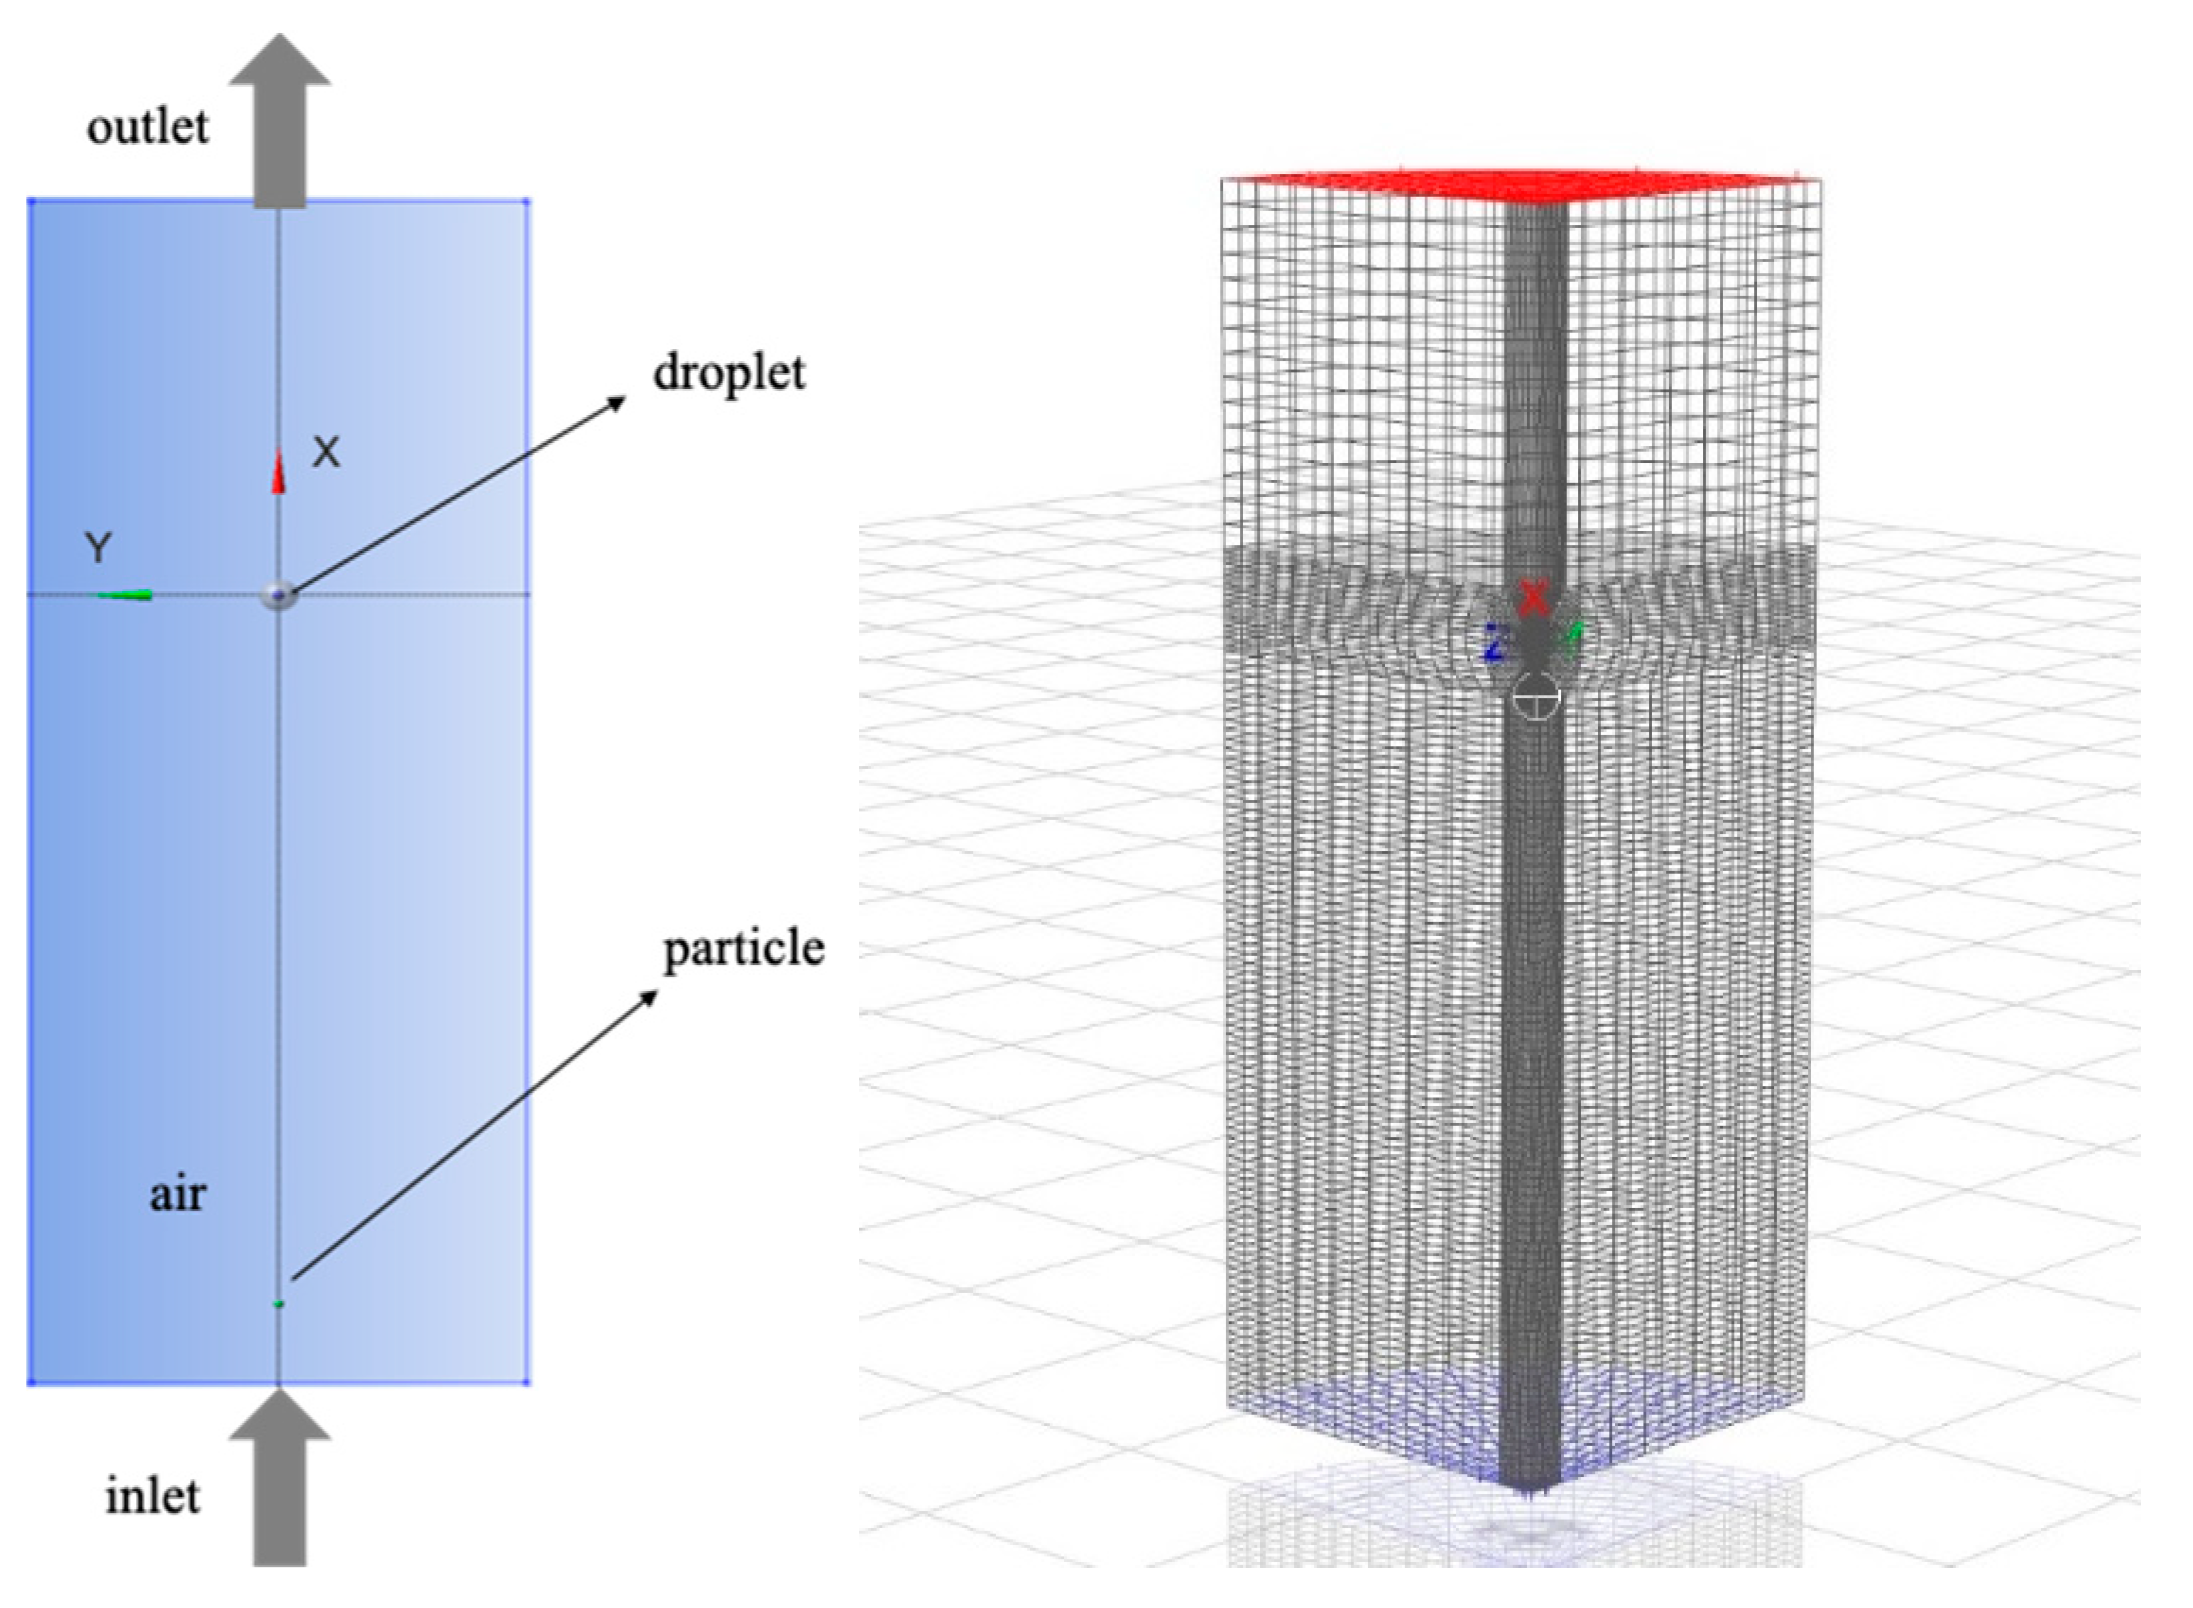
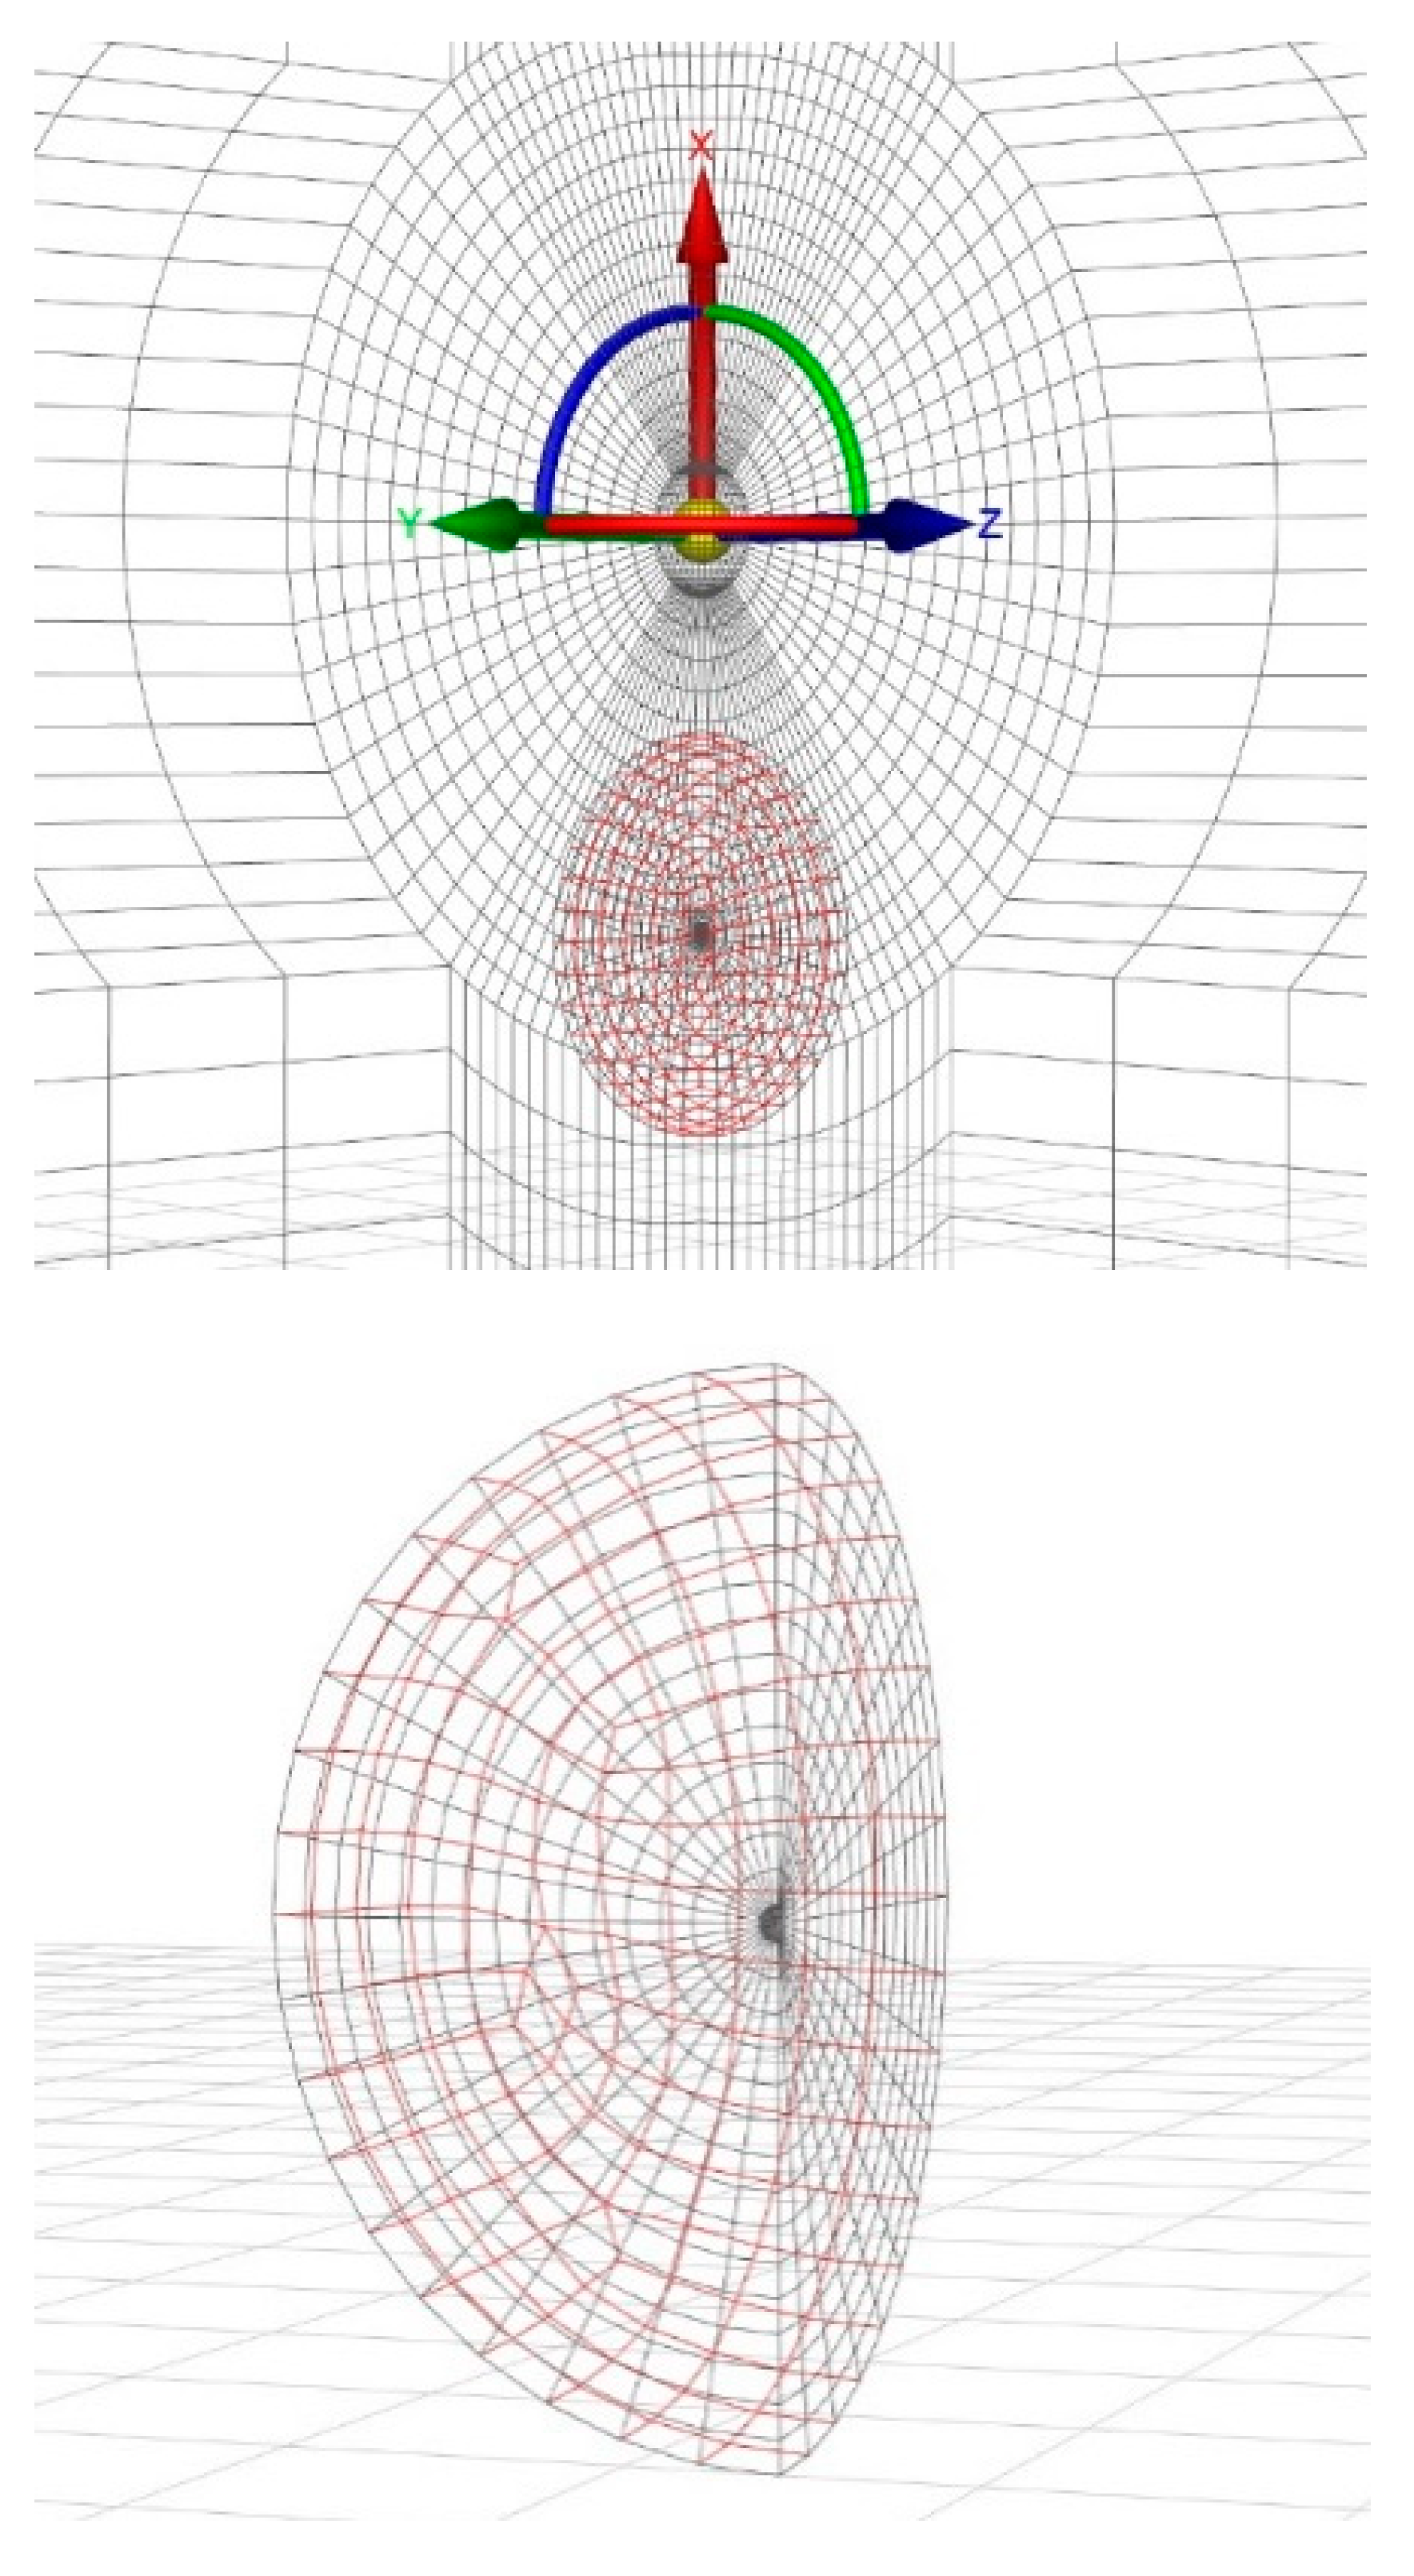
4.2. 3-D Numerical Model
4.3. Co-Simulation Results and Discussion
5. Conclusions
- (a)
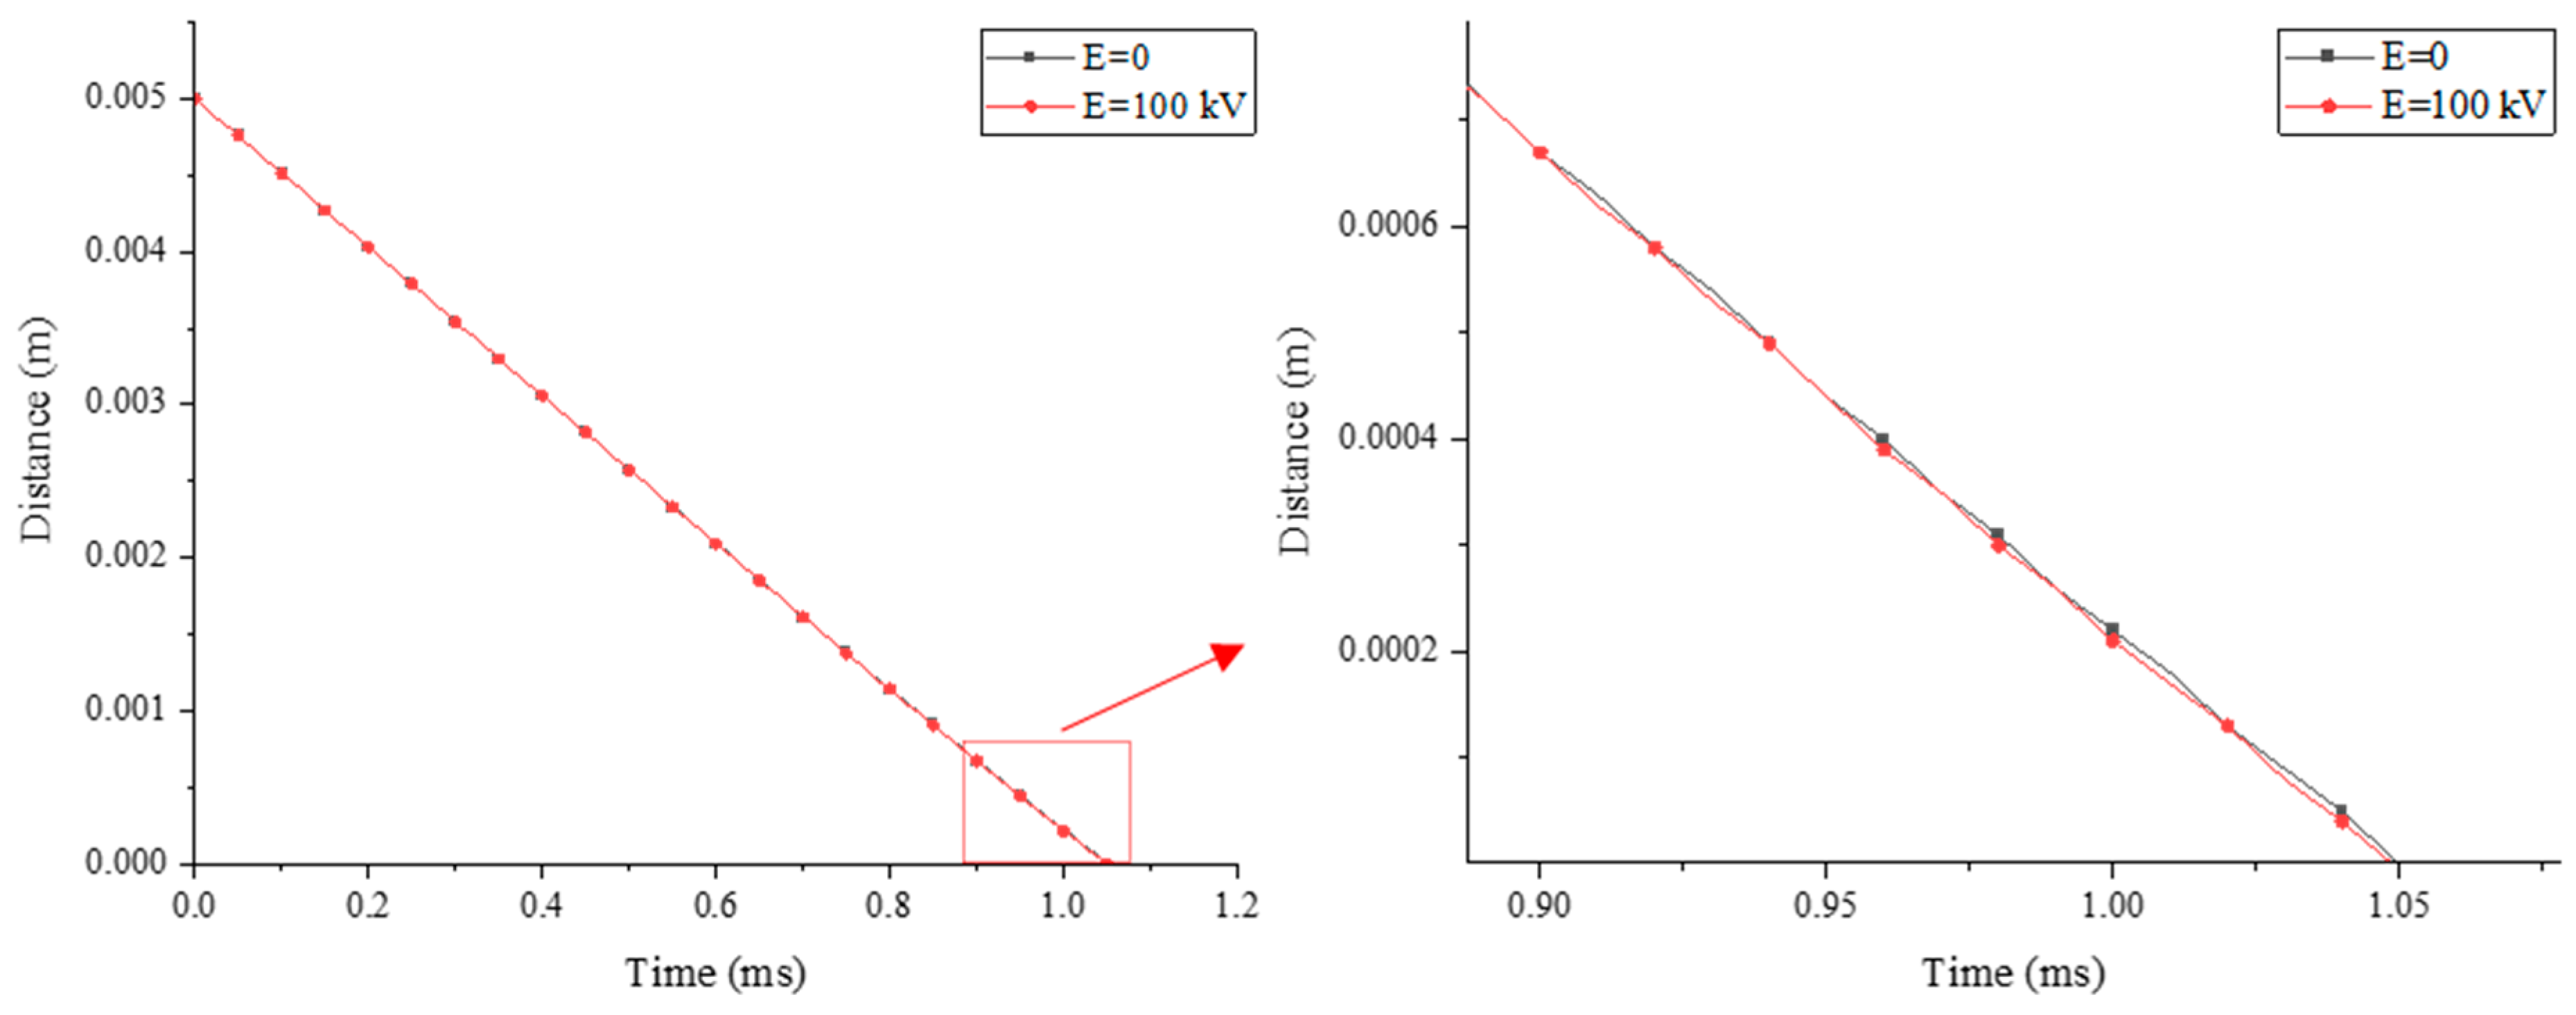
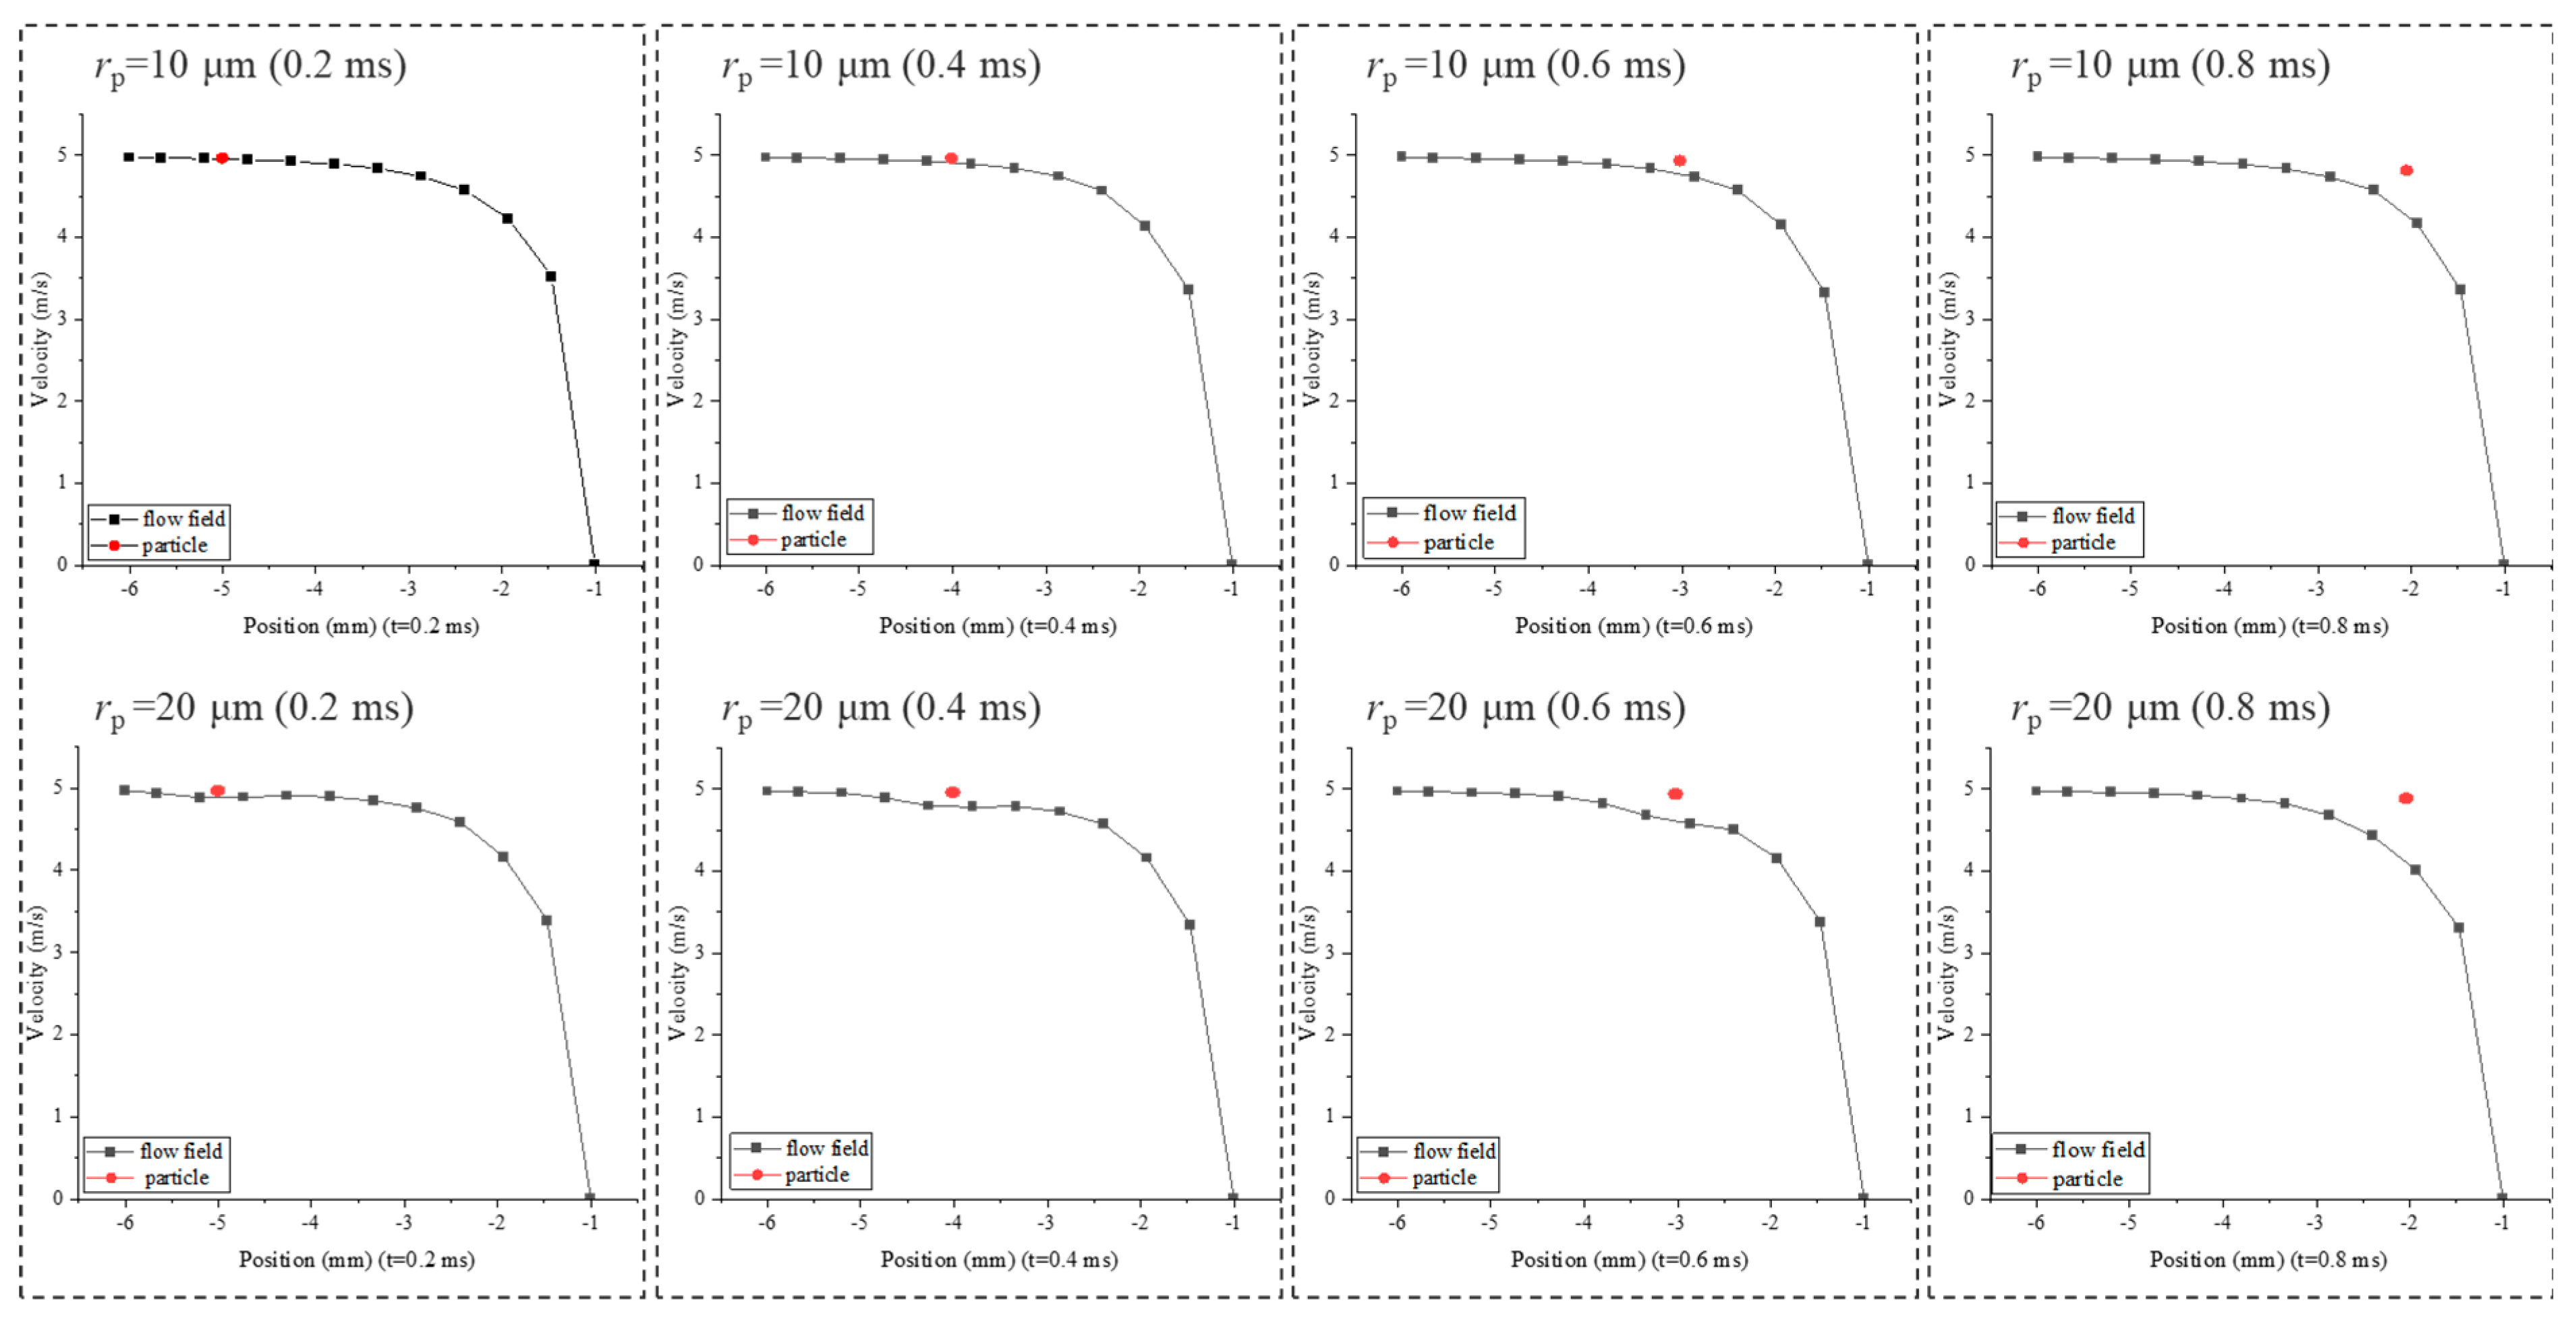
- The existence of an electrostatic field can improve the particle velocity when it approaches the droplet, making the velocity greater than that of the surrounding flow field. Meanwhile, this effect is much more obvious with the particle approaching the droplet.
- (b)
- Analysis of the effect of electrostatic field strength found that electrostatic force helps increase the particle capturing efficiency by attracting particles to the droplet but that it is not possible to increase the particle velocity significantly by increasing the electrostatic field strength, since the magnitude of the electrical force was far less than that of the drag force. Thus, a proper electrostatic field strength range is supposed to be defined in a follow-up research work.
- (c)
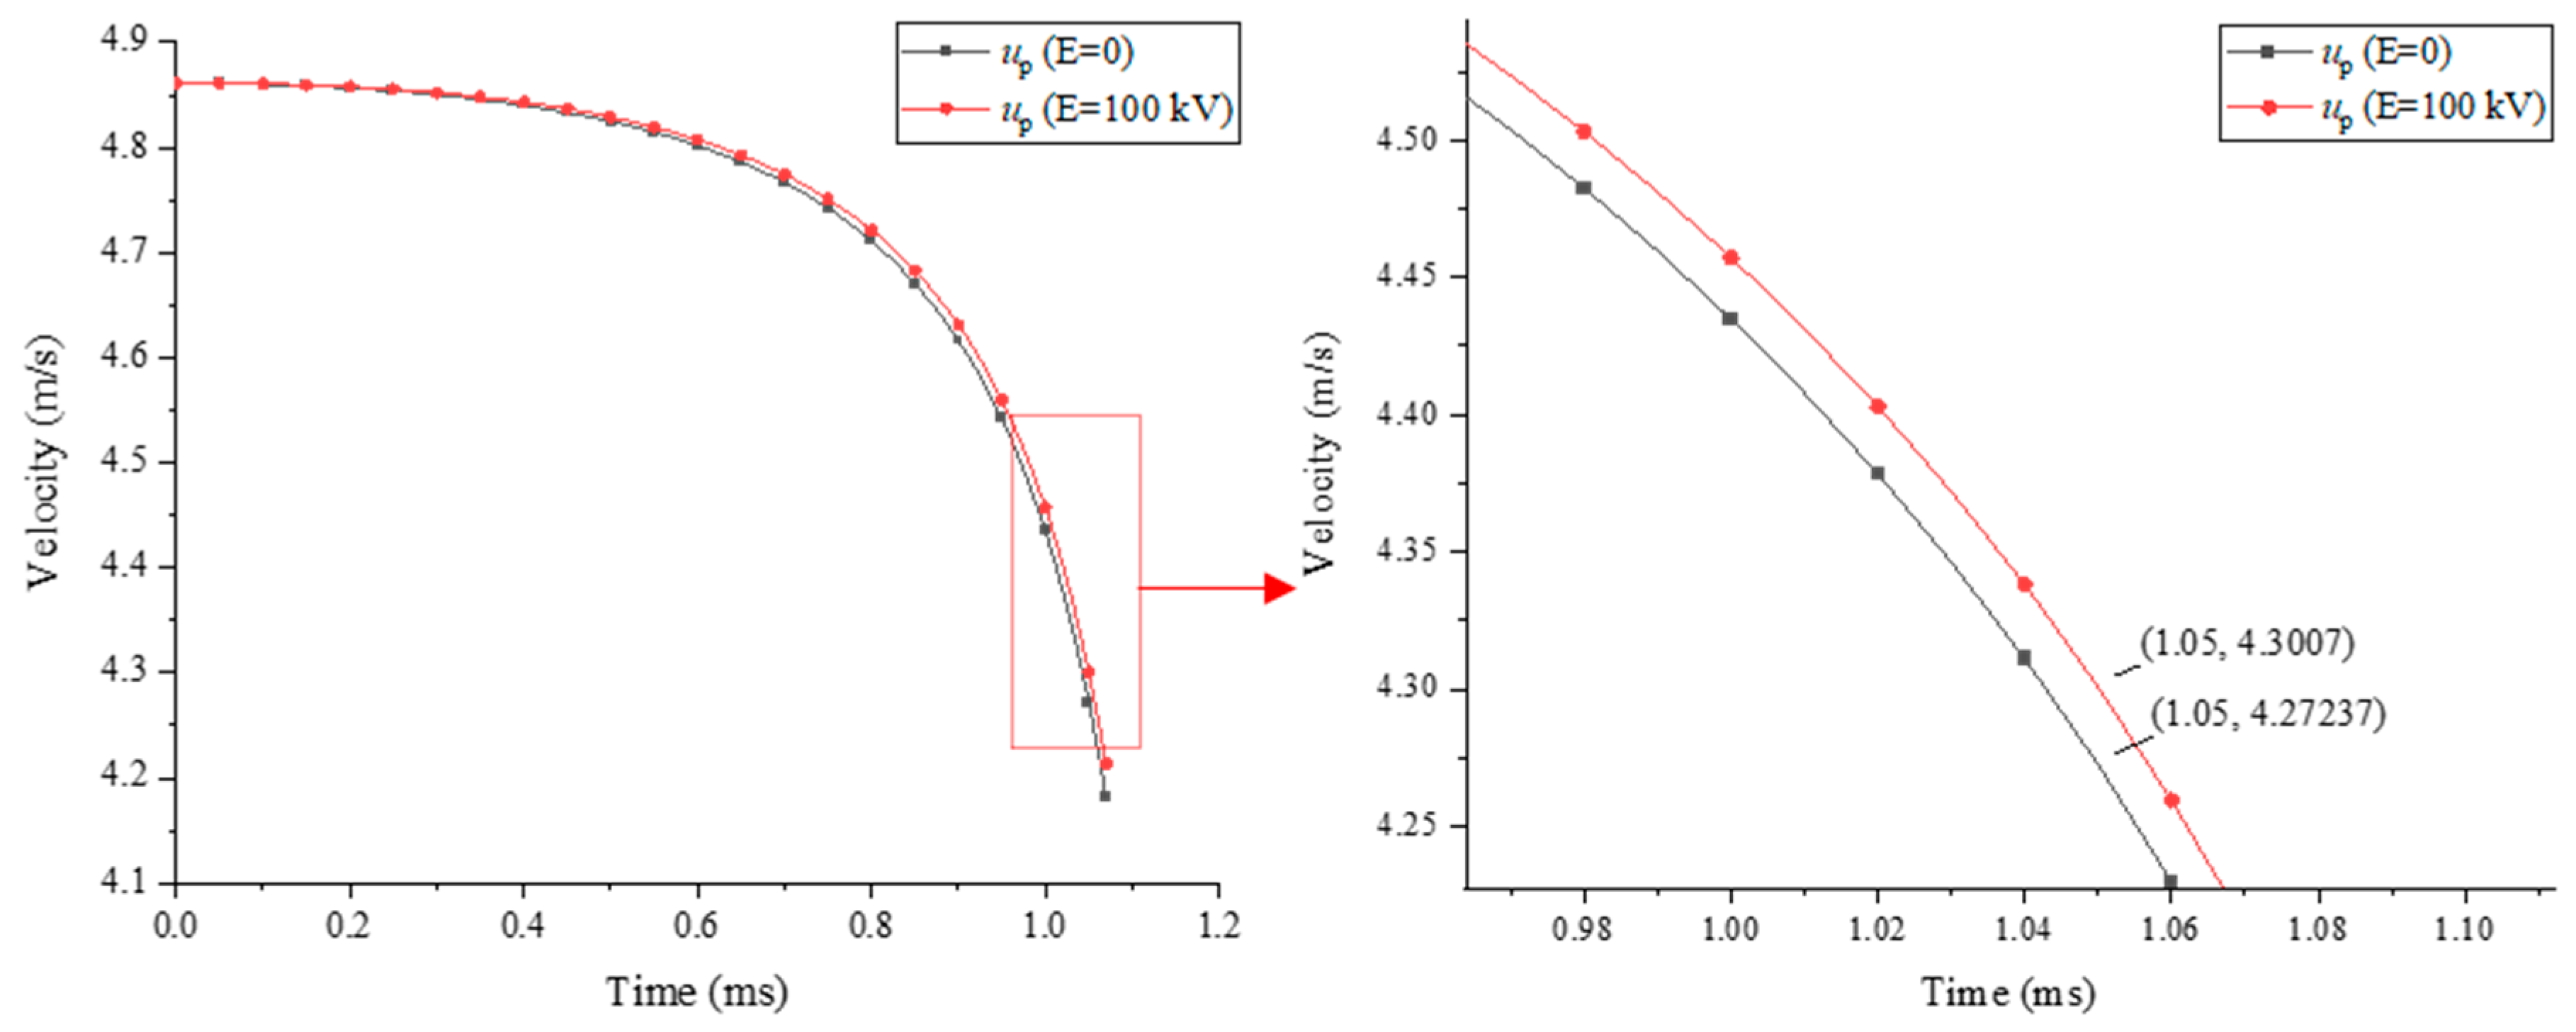
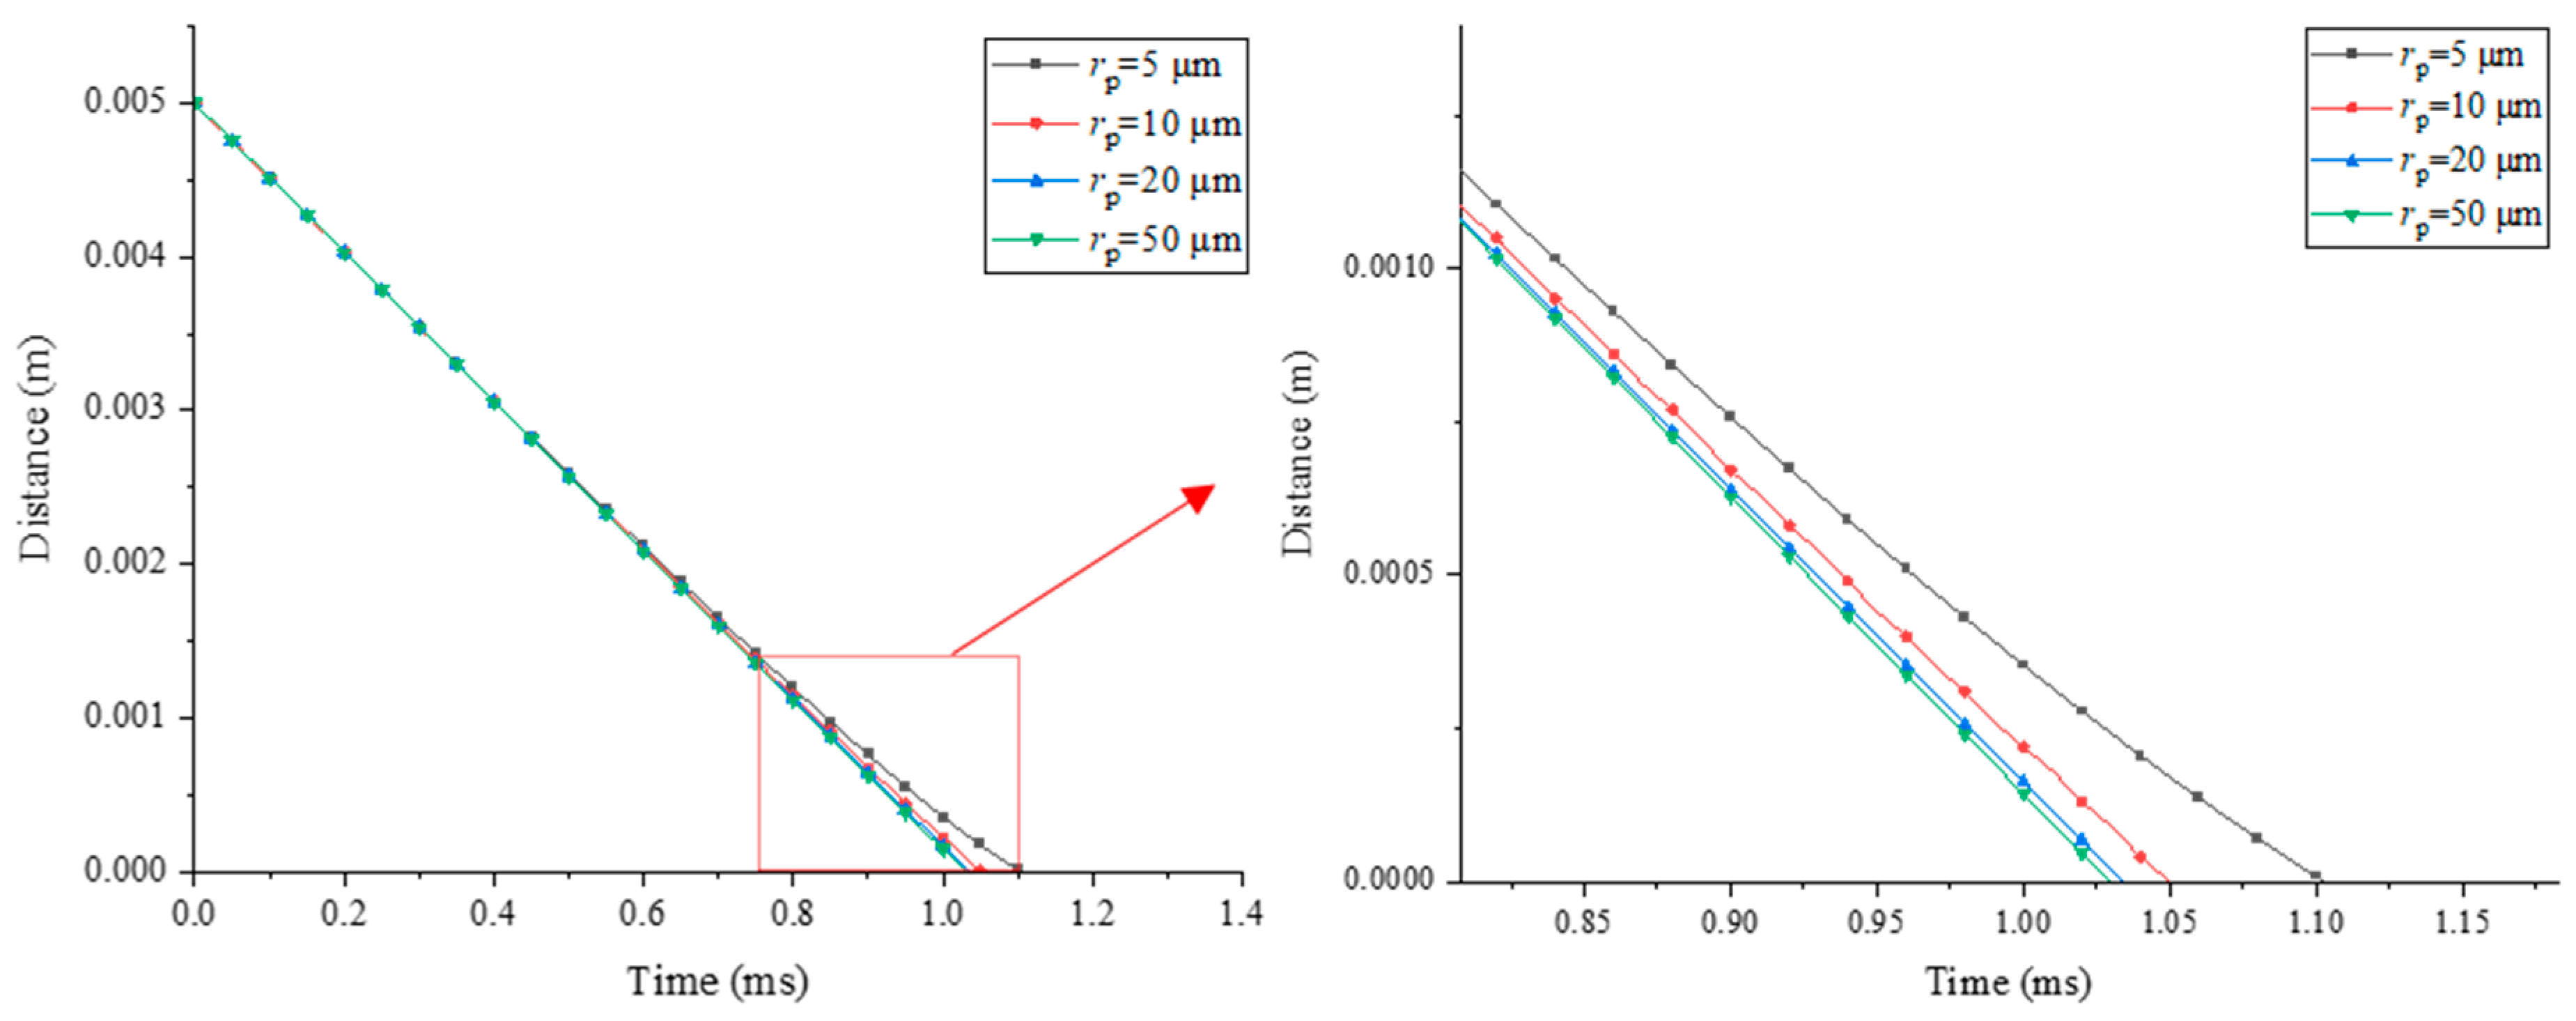
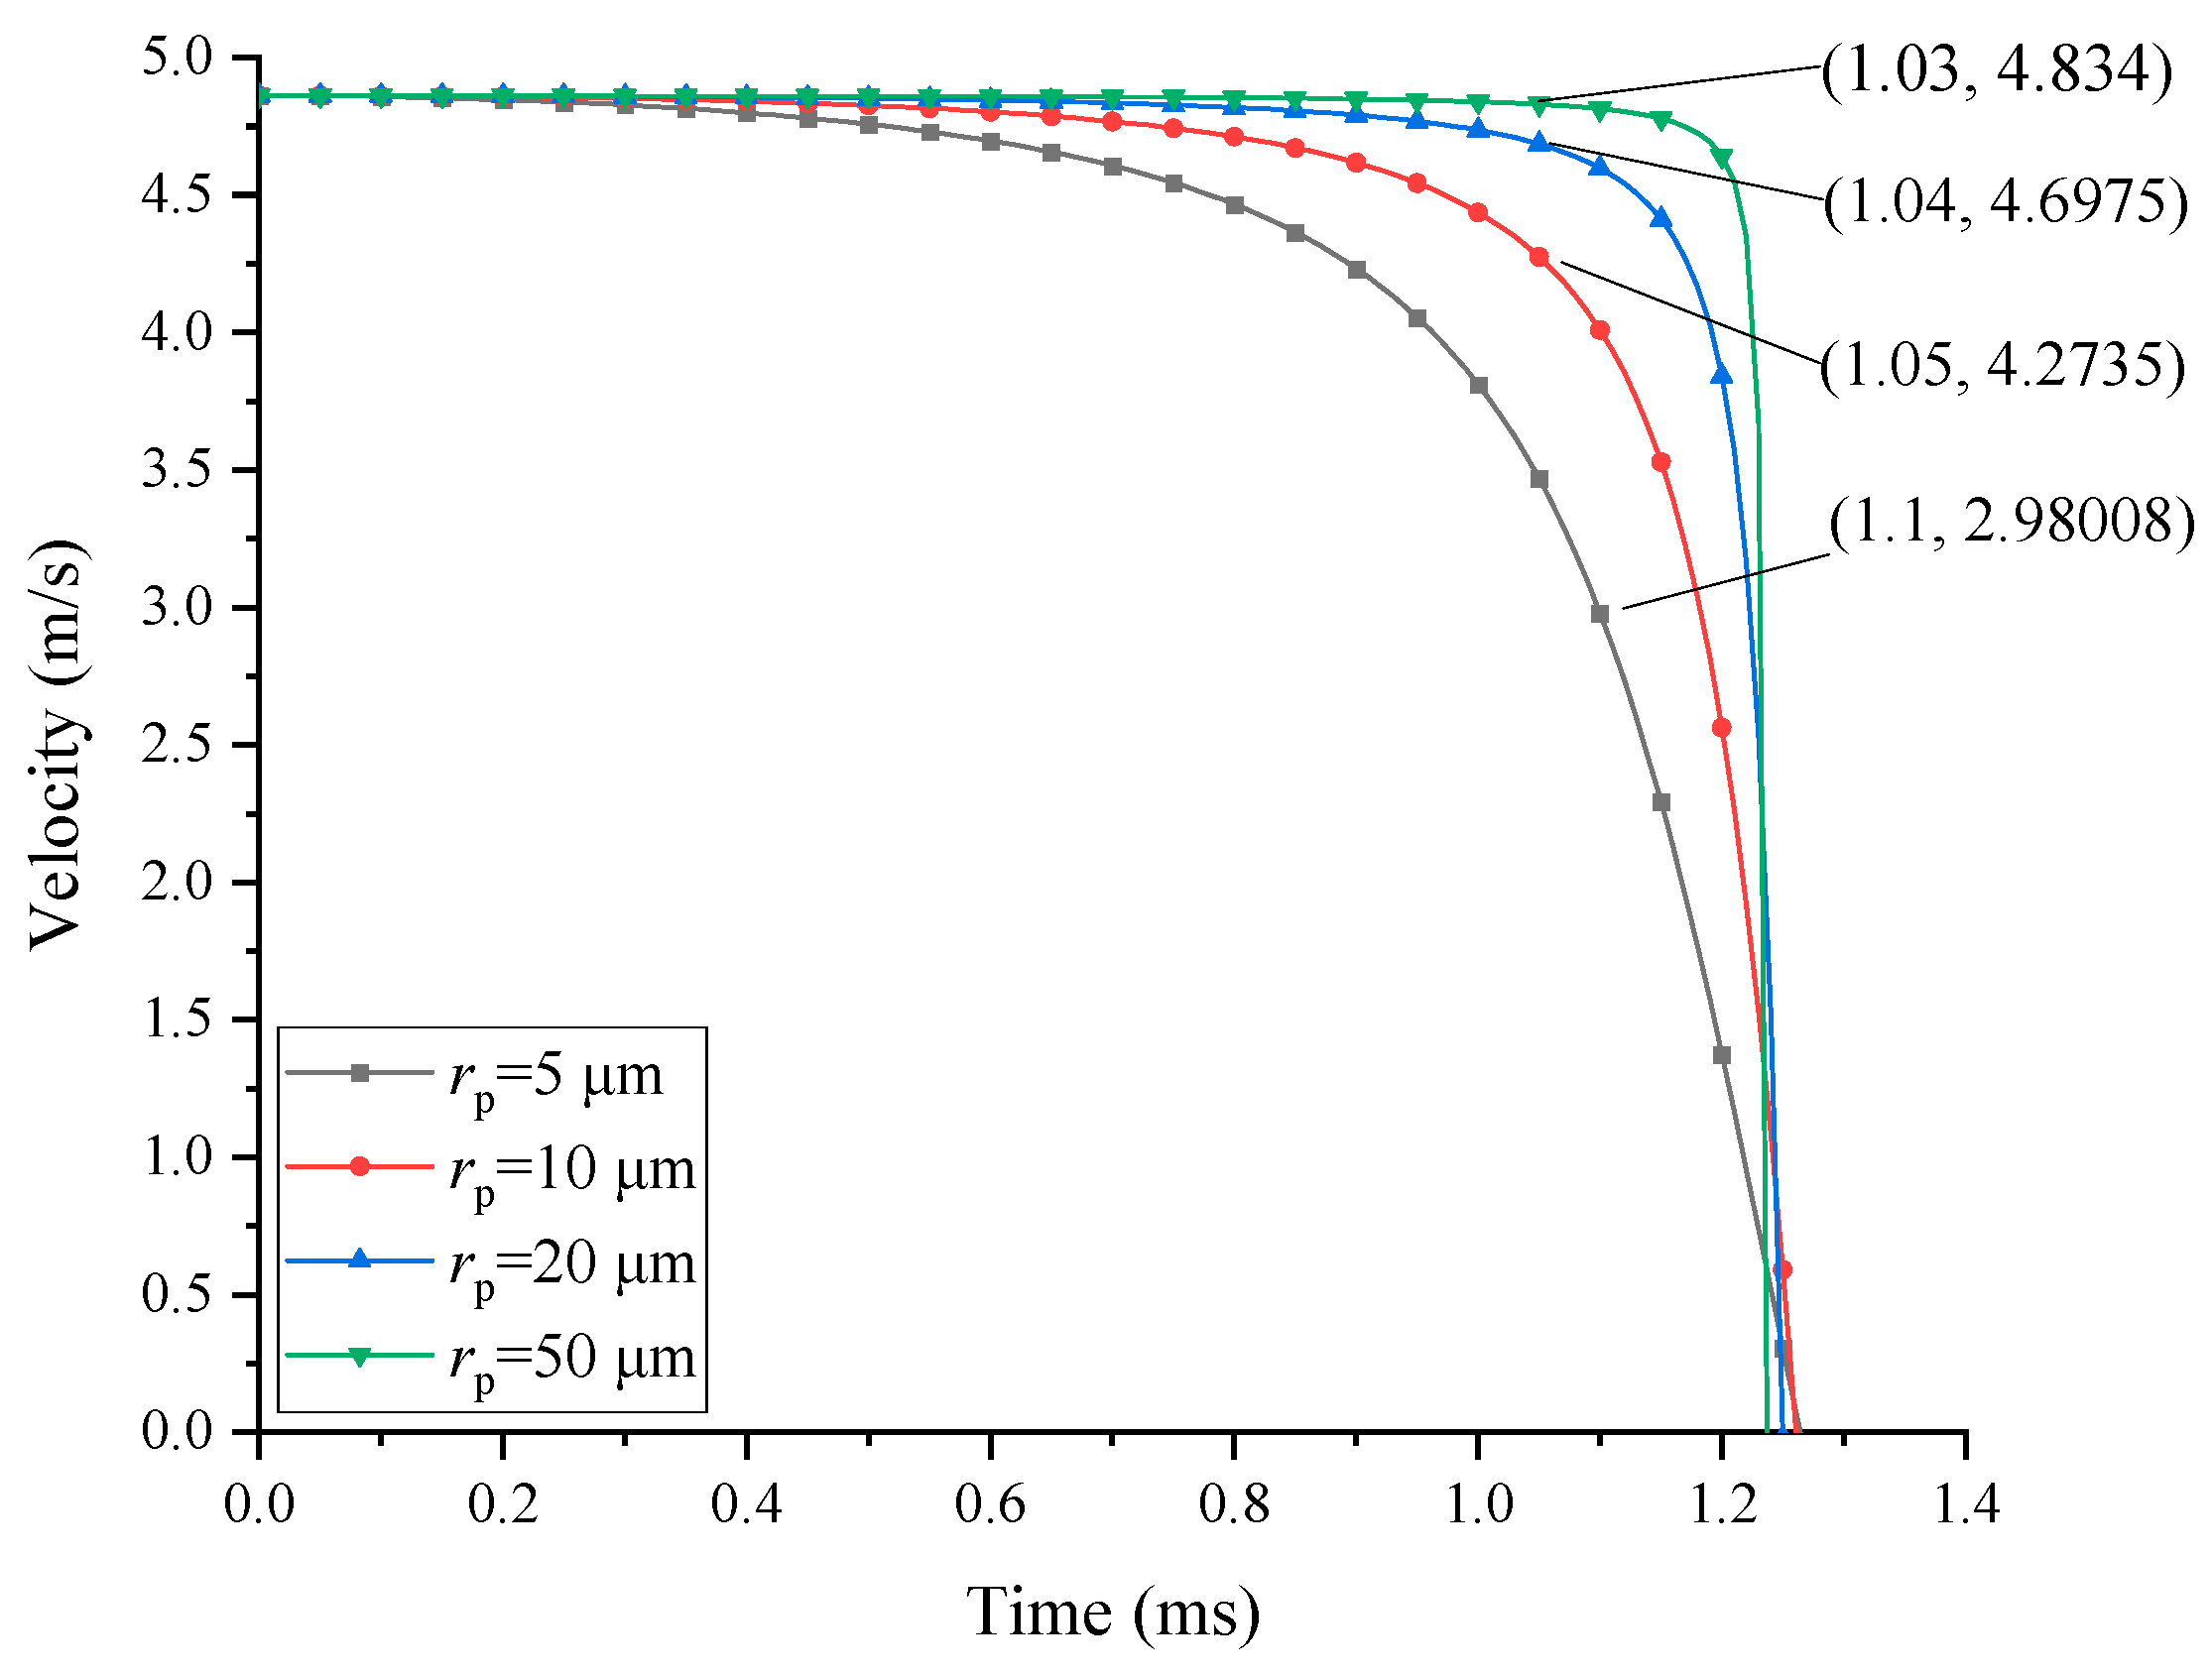
- The investigation of particle size shows that the electrostatic effect is much greater for larger particles. The effect of particle size is different for the range of particle radii. Under the electrostatic field condition (20 kV), for particle sizes beyond 10 μm, when the particle radius decreases by 50%, the particle velocity when reaching the droplet surface decreases by 9.01%. While the particle radius is below 10 μm, the particle velocity when reaching the droplet surface decreases by 30.28% when the particle size decreases by 50%.
- (d)
- Furthermore, the droplet size has a great influence on the particle motion characteristics. The results in this paper show that when the droplet size decreases by 50%, the particle velocity at the droplet surface increases by 7.26% to 13.85%. Thus, decreasing the droplet size can help improve the collection effect.
- (e)
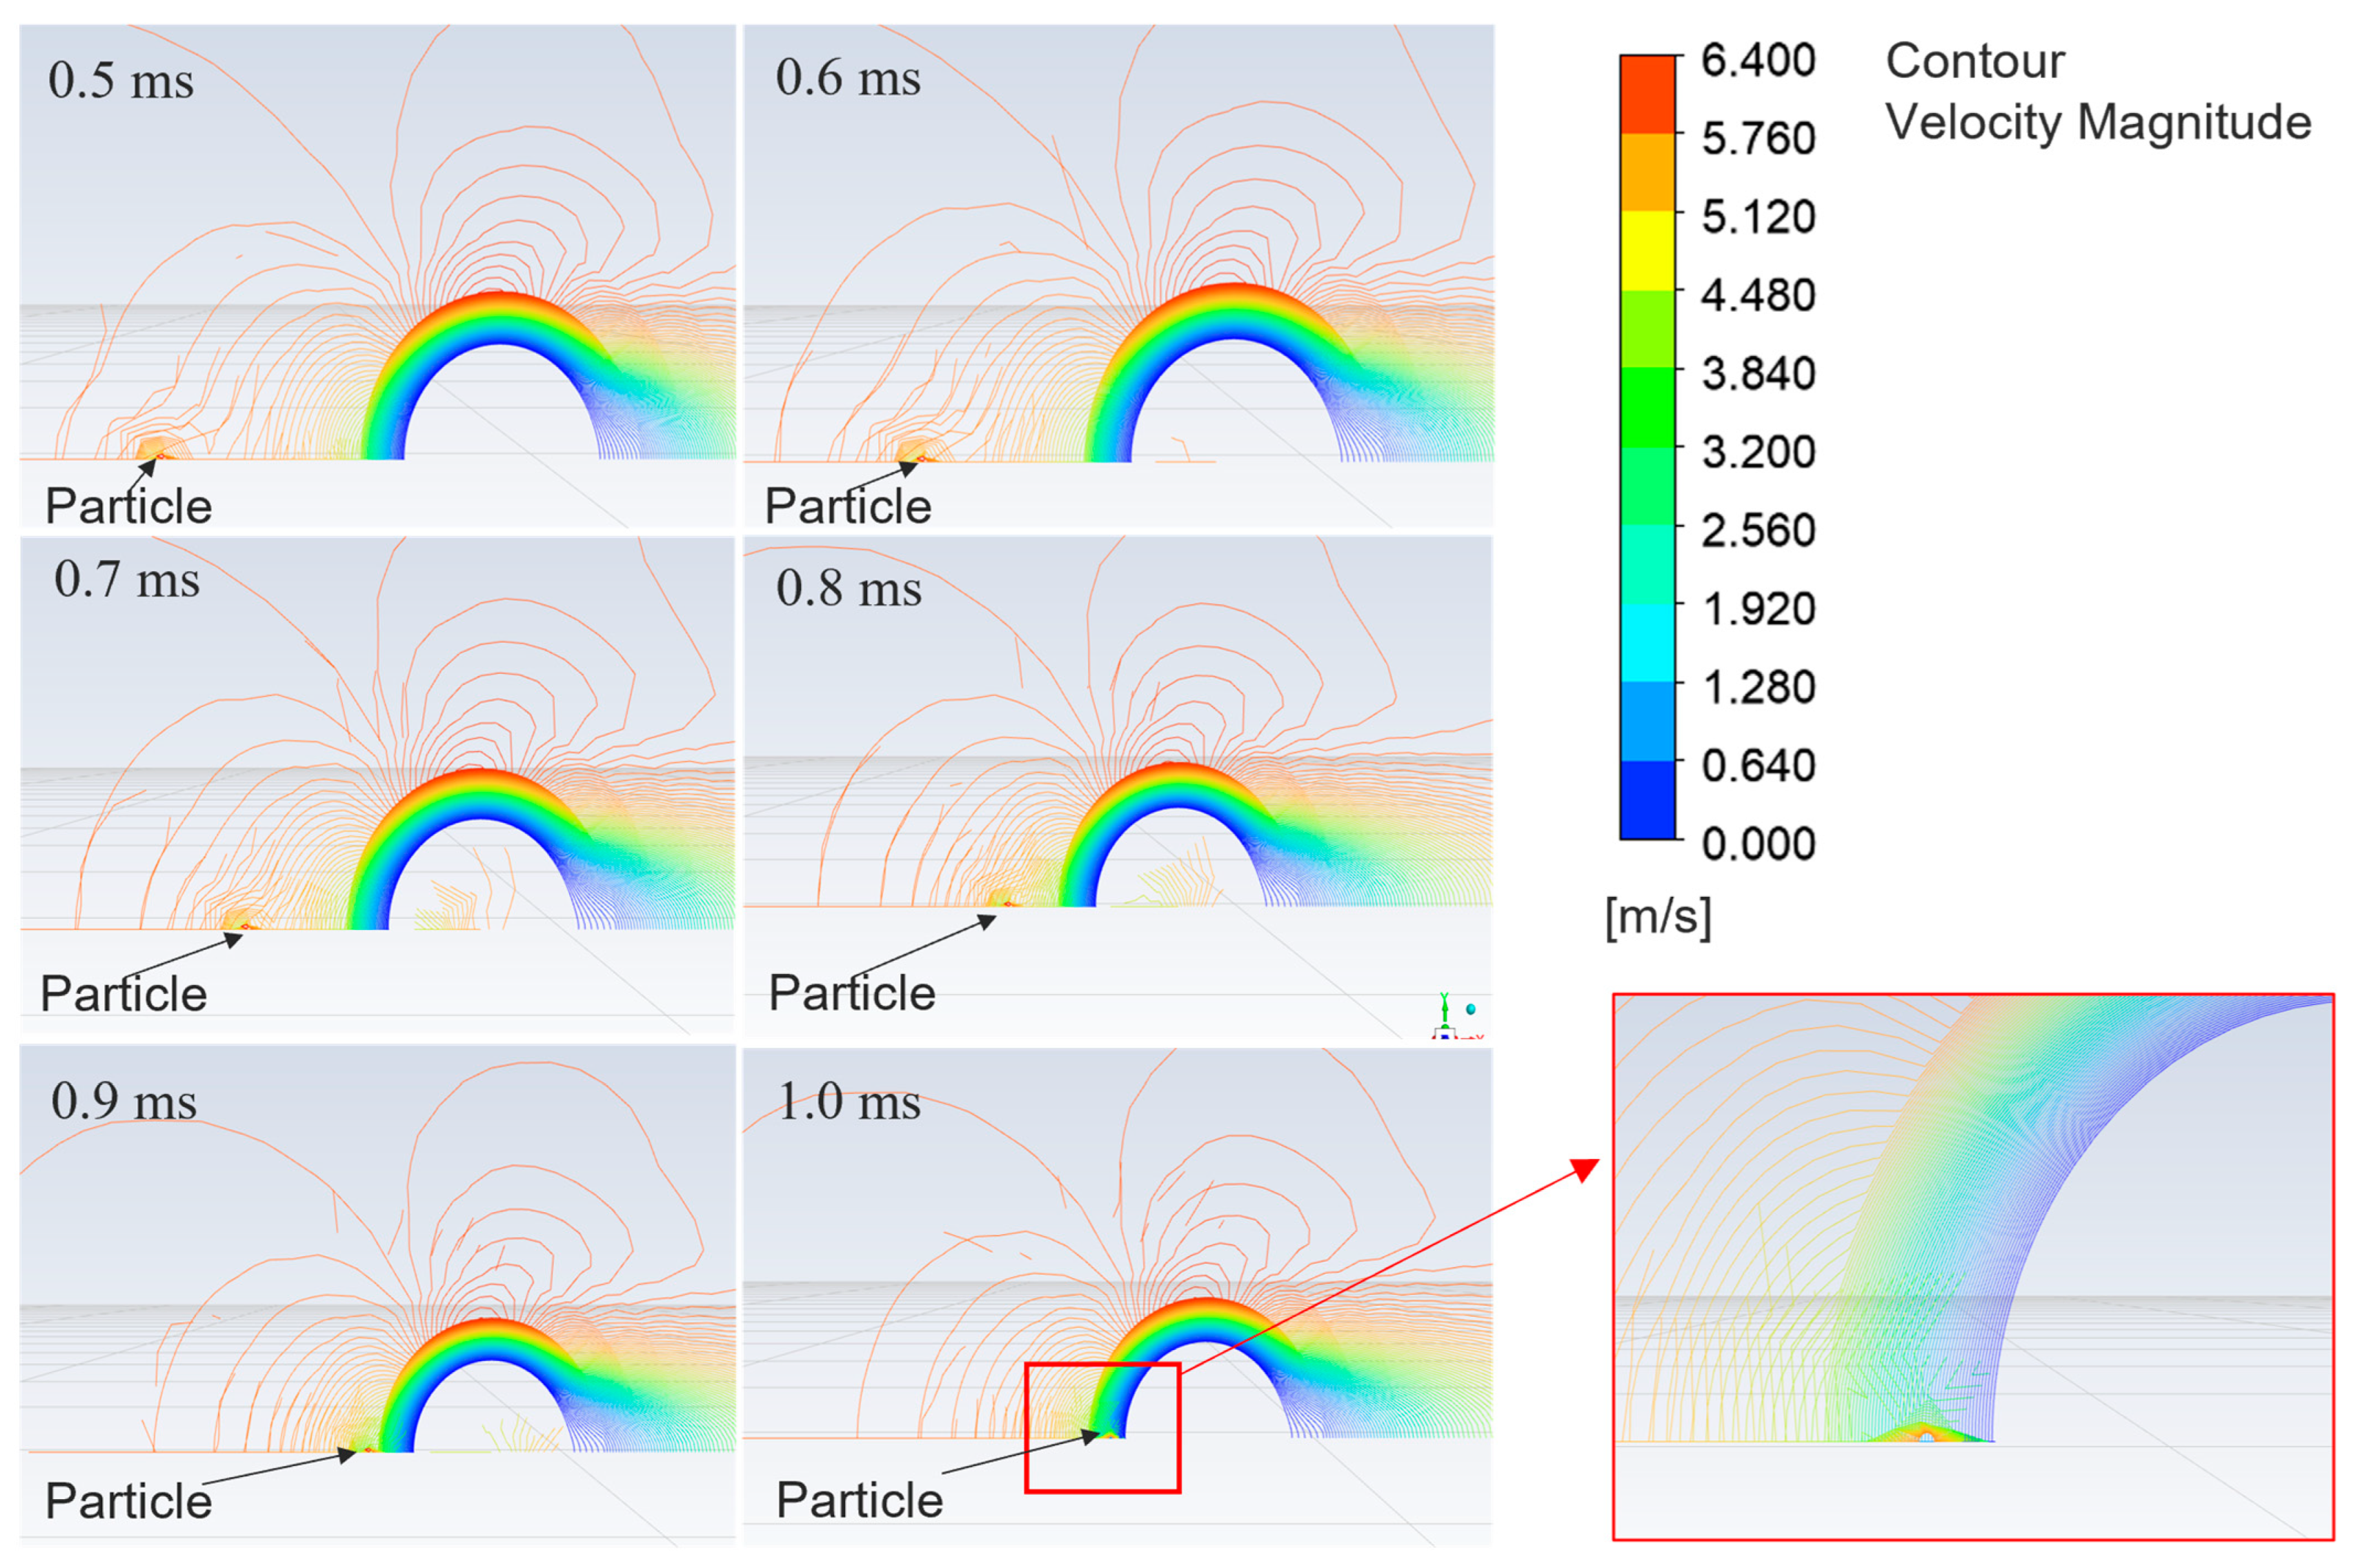
- Simulation results show that the moving particle can affect the surrounding velocity of the gas flow field, which is ignored in the theoretical calculation. This effect becomes more apparent as the particle size increases.
6. Recommendation for Future Research
Author Contributions
Funding
Institutional Review Board Statement
Informed Consent Statement
Data Availability Statement
Conflicts of Interest
References
- Corbett, J.J.; Fischbeck, P.S.; Pandis, S.N. Global Nitrogen and Sulfur Inventories for Oceangoing Ships. J. Geophys. Res. Atmos. 1999, 104, 3457–3470. [Google Scholar] [CrossRef]
- Endresen, Ø.; Sørgård, E.; Sundet, J.K.; Dalsøren, S.B.; Isaksen, I.S.A.; Berglen, T.F.; Gravir, G. Emission from International Sea Transportation and Environmental Impact. J. Geophys. Res. Atmos. 2003, 108, D17. [Google Scholar] [CrossRef]
- Eyring, V.; Köhler, H.W.; Van Aardenne, J.; Lauer, A. Emissions from International Shipping: 1. The Last 50 Years. J. Geophys. Res. D Atmos. 2005, 110, 171–182. [Google Scholar] [CrossRef]
- Eyring, V.; Isaksen, I.S.A.; Berntsen, T.; Collins, W.J.; Corbett, J.J.; Endresen, O.; Grainger, R.G.; Moldanova, J.; Schlager, H.; Stevenson, D.S. Transport Impacts on Atmosphere and Climate: Shipping. Atmos Environ. 2010, 44, 4735–4771. [Google Scholar] [CrossRef]
- Bond, T.C.; Doherty, S.J.; Fahey, D.W.; Forster, P.M.; Berntsen, T.; Deangelo, B.J.; Flanner, M.G.; Ghan, S.; Kärcher, B.; Koch, D.; et al. Bounding the Role of Black Carbon in the Climate System: A Scientific Assessment. J. Geophys. Res. Atmos. 2013, 118, 5380–5552. [Google Scholar] [CrossRef]
- Eyring, V.; Stevenson, D.S.; Lauer, A.; Dentener, F.J.; Butler, T.; Collins, W.J.; Ellingsen, K.; Gauss, M.; Hauglustaine, D.A.; Isaksen, I.S.A.; et al. Multi-Model Simulations of the Impact of International Shipping on Atmospheric Chemistry and Climate in 2000 and 2030. Atmos. Chem. Phys. 2007, 7, 757–780. [Google Scholar] [CrossRef]
- Di Natale, F.; Carotenuto, C. Particulate Matter in Marine Diesel Engines Exhausts: Emissions and Control Strategies. Transp Res. D Transp. Environ. 2015, 40, 166–191. [Google Scholar] [CrossRef]
- Corbett, J.J.; Winebrake, J.J.; Green, E.H.; Kasibhatla, P.; Eyring, V.; Lauer, A. Mortality from Ship Emissions: A Global Assessment. Environ. Sci. Technol. 2007, 41, 8512–8518. [Google Scholar] [CrossRef] [PubMed]
- Winebrake, J.J.; Corbett, J.J.; Green, E.H.; Lauer, A.; Eyring, V. Mitigating the Health Impacts of Pollution from Oceangoing Shipping: An Assessment of Low-Sulfur Fuel Mandates. Environ. Sci Technol 2009, 43, 4776–4782. [Google Scholar] [CrossRef]
- Abida, H.; Moreno-Gutiérrez, J. Using Emissions of Precursor Pollutants by Ships in Different Regions to Calculate Yearly Mortality Attributable to Maritime Transport: Case for the Imo to Designate the Strait of Gibraltar an Eca Zone. J. Appl. Sci. Environ. Stud. 2021, 4, 470–481. [Google Scholar]
- Ntziachristos, L.; Saukko, E.; Lehtoranta, K.; Rönkkö, T.; Timonen, H.; Simonen, P.; Karjalainen, P.; Keskinen, J. Particle Emissions Characterization from a Medium-Speed Marine Diesel Engine with Two Fuels at Different Sampling Conditions. Fuel 2016, 186, 456–465. [Google Scholar] [CrossRef]
- Agrawal, H.; Welch, W.A.; Miller, J.W.; Cocker, D.R. Emission Measurements from a Crude Oil Tanker at Sea. Environ. Sci. Technol. 2008, 42, 7098–7103. [Google Scholar] [CrossRef]
- Healy, R.M.; O’Connor, I.P.; Hellebust, S.; Allanic, A.; Sodeau, J.R.; Wenger, J.C. Characterisation of Single Particles from In-Port Ship Emissions. Atmos. Environ. 2009, 43, 6408–6414. [Google Scholar] [CrossRef]
- Viana, M.; Amato, F.; Alastuey, A.; Querol, X.; Moreno, T.; Dos Santos, S.G.; Herce, M.D.; Fernández-Patier, R. Chemical Tracers of Particulate Emissions from Commercial Shipping. Environ. Sci. Technol. 2009, 43, 7472–7477. [Google Scholar] [CrossRef] [PubMed]
- Agrawal, H.; Malloy, Q.G.J.; Welch, W.A.; Wayne Miller, J.; Cocker, D.R. In-Use Gaseous and Particulate Matter Emissions from a Modern Ocean Going Container Vessel. Atmos. Environ. 2008, 42, 5504–5510. [Google Scholar] [CrossRef]
- Murphy, S.; Agrawal, H.; Sorooshian, A.; Padró, L.T.; Gates, H.; Hersey, S.; Welch, W.A.; Jung, H.; Miller, J.W.; Cocker, D.R.; et al. Comprehensive Simultaneous Shipboard and Airborne Characterization of Exhaust from a Modern Container Ship at Sea. Environ. Sci. Technol. 2009, 43, 4626–4640. [Google Scholar] [CrossRef]
- Johansson, L.; Jalkanen, J.P.; Kalli, J.; Kukkonen, J. The Evolution of Shipping Emissions and the Costs of Recent and Forthcoming Emission Regulations in the Northern European Emission Control Area. Atmos. Chem. Phys. 2013, 13, 16113–16150. [Google Scholar] [CrossRef]
- Lehtoranta, K.; Aakko-Saksa, P.; Murtonen, T.; Vesala, H.; Ntziachristos, L.; Rönkkö, T.; Karjalainen, P.; Kuittinen, N.; Timonen, H. Particulate Mass and Nonvolatile Particle Number Emissions from Marine Engines Using Low-Sulfur Fuels, Natural Gas, or Scrubbers. Environ. Sci. Technol. 2019, 53, 3315–3322. [Google Scholar] [CrossRef]
- Sobczyk, A.T.; Jaworek, A.; Marchewicz, A.; Krupa, A.; Czech, T.; Śliwiński, Ł.; Charchalis, A. Particulate Matter Emission Reduction from Marine Diesel Engines by Electrohydrodynamic Methods. J. KONES 2019, 26, 203–210. [Google Scholar] [CrossRef]
- Di Natale, F.; Carotenuto, C.; Parisi, A.; Flagiello, D.; Lancia, A. Wet Electrostatic Scrubbing for Flue Gas Treatment. Fuel 2022, 325, 124888. [Google Scholar] [CrossRef]
- Sakuma, Y.; Yamagami, R.; Zukeran, A.; Ehara, Y.; Inui, T. Reduction of SO2 and DPM Using Heat Exchanger and Electrostatic Precipitation in Diesel Engine. Mar. Eng. 2014, 49, 533–538. [Google Scholar] [CrossRef]
- Carotenuto, C.; Di Natale, F.; Lancia, A. Wet Electrostatic Scrubbers for the Abatement of Submicronic Particulate. Chem. Eng. J. 2010, 165, 35–45. [Google Scholar] [CrossRef]
- Ha, T.H.; Nishida, O.; Fujita, H.; Wataru, H. Enhancement of Diesel Particulate Matter Collection in an Electrostatic Water-Spraying Scrubber. J. Mar. Sci. Technol. 2010, 15, 271–279. [Google Scholar] [CrossRef]
- Kojevnikova, S.; Zimmels, Y. Mechanism of collection of aerosols by an array of oppositely charged drops. J. Aerosol Sci. 2000, 31, 437–461. [Google Scholar] [CrossRef]
- Kojevnikova, S.; Zimmels, Y. Mechanism of aerosol collection by two-and three-dimensional inhomogeneous arrays of charged drops. Chem. Eng. Sci. 2000, 55, 4839–4855. [Google Scholar] [CrossRef]
- Zhao, H.; Zheng, C. Modeling of Gravitational Wet Scrubbers with Electrostatic Enhancement. Chem. Eng. Technol. 2008, 31, 1824–1837. [Google Scholar] [CrossRef]
- Jaworek, A.; Adamiak, K.; Balachandran, W.; Krupa, A.; Castle, P.; Machowski, W. Numerical Simulation of Scavenging of Small Particles by Charged Droplets. Aerosol Sci. Technol. 2002, 36, 913–924. [Google Scholar] [CrossRef]
- Jaworek, A.; Balachandran, W.; Krupa, A.; Kulon, J.; Lackowski, M. Wet Electroscrubbers for State of the Art Gas Cleaning. Environ. Sci. Technol. 2006, 40, 6197–6207. [Google Scholar] [CrossRef] [PubMed]
- Krupa, A.; Jaworek, A.; Szudyga, M.; Czech, T.; Sobczyk, A.T.; Marchewicz, A.; Antes, T.; Balachandran, W.; Beleca, R.; Di Natale, F.; et al. Diesel Nanoparticles Removal by Charged Spray. Int. J. Plasma Environ. Sci. Technol. 2016, 10, 2. [Google Scholar]
- D’addio, L.; Di Natale, F.; Carotenuto, C.; Scoppa, G.; Dessy, V.; Lancia, A. Removal of fine and ultrafine combustion derived particles in a wet electrostatic scrubber. In Proceedings of the XXXVI Meeting of the Italian Section of the Combust, Naples, Italy, 13–15 June 2013. [Google Scholar]
- Di Natale, F.; Carotenuto, C.; D’Addio, L.; Jaworek, A.; Krupa, A.; Szudyga, M.; Lancia, A. Capture of Fine and Ultrafine Particles in a Wet Electrostatic Scrubber. J. Environ. Chem. Eng. 2015, 3, 349–356. [Google Scholar] [CrossRef]
- Prasad, R.; Bella, V.R. A Review on Diesel Soot Emission, Its Effect and Control. Bull. Chem. React. Eng. Catal. 2010, 5, 69–86. [Google Scholar] [CrossRef]
- Matti Maricq, M. Chemical Characterization of Particulate Emissions from Diesel Engines: A Review. J. Aerosol Sci. 2007, 38, 1079–1118. [Google Scholar] [CrossRef]
- Burtscher, H. Physical Characterization of Particulate Emissions from Diesel Engines: A Review. J. Aerosol Sci. 2005, 36, 896–932. [Google Scholar] [CrossRef]
- Zhou, S.; Zhou, J.; Feng, Y.; Zhu, Y. Marine Emission Pollution Abatement Using Ozone Oxidation by a Wet Scrubbing Method. Ind. Eng. Chem. Res. 2016, 55, 5825–5831. [Google Scholar] [CrossRef]
- Zhou, S.; Zhou, J.; Zhu, Y. Chemical Composition and Size Distribution of Particulate Matters from Marine Diesel Engines with Different Fuel Oils. Fuel 2019, 235, 972–983. [Google Scholar] [CrossRef]
- Cha, C.Y.; McCoy, B.J. Thermal Force on Aerosol Particles. Phys. Fluids 1974, 17, 1376–1380. [Google Scholar] [CrossRef]
- Jaworek, A.; Krupa, A.; Sobczyk, A.T.; Marchewicz, A.; Szudyga, M.; Antes, T.; Balachandran, W.; Di Natale, F.; Carotenuto, C. Submicron Particles Removal by Charged Sprays. Fundamentals. J. Electrostat. 2013, 71, 345–350. [Google Scholar] [CrossRef]
- D’Addio, L.; Di Natale, F.; Carotenuto, C.; Balachandran, W.; Lancia, A. A Lab-Scale System to Study Submicron Particles Removal in Wet Electrostatic Scrubbers. Chem. Eng. Sci. 2013, 97, 176–185. [Google Scholar] [CrossRef]
- Rayleigh, L. XX. On the Equilibrium of Liquid Conducting Masses Charged with Electricity. Lond. Edinb. Dublin Philos. Mag. J. Sci. 1882, 14, 184–186. [Google Scholar] [CrossRef]


| Method Applied in Marine Vessels | Reduction of PM Emission | Limitation |
|---|---|---|
| Fuel-borne additive | 35% | Lowest reduction efficiency among those methods |
| Venturi scrubber | Over 90% <70% for submicron particle | High pressure drops |
| Wet scrubber | 70–99% for >PM1.0 About 50% for <PM1.0 | Affected by many factors in scrubber |
| Electrostatic precipitator | 80–93% | Re-entrainment of particles after a certain time operation |
| Electrified water spray | Capture efficiency over 95% (<PM0.4) | Operational characteristics are not yet fully understood |
| Droplet radius/ | 0.1 mm, 0.5 mm, 1 mm, 2 mm |
| Particle radius/ | 5 μm, 10 μm, 20 μm, 50 μm |
| Density of particle/ | |
| Density of gas fluid/ | 1.019 kg/m3 |
| Dynamic viscosity of gas fluid/ | |
| Inlet velocity of flow field/ | 5 |
| Vacuum dielectric constant/ | 8.85 10−12 F/m |
| Relative dielectric constant (particle)/ | 30 |
| Relative dielectric constant (droplet)/ | 81.5 |
| rp (μm) | t (ms) | rc (mm) | t (ms) | |||
|---|---|---|---|---|---|---|
| In theory | 10 | 1.051 | 2.6% | 0.5 | 1.031 | 1.3% |
| In simulation | 1.079 | 1.018 | ||||
| In theory | 20 | 1.035 | 0.4% | 1 | 1.051 | 0.9% |
| In simulation | 1.031 | 1.052 | ||||
| In theory | 50 | 1.028 | 1.8% | 2 | 1.097 | 2.1% |
| In simulation | 1.010 | 1.121 |
Disclaimer/Publisher’s Note: The statements, opinions and data contained in all publications are solely those of the individual author(s) and contributor(s) and not of MDPI and/or the editor(s). MDPI and/or the editor(s) disclaim responsibility for any injury to people or property resulting from any ideas, methods, instructions or products referred to in the content. |
© 2024 by the authors. Licensee MDPI, Basel, Switzerland. This article is an open access article distributed under the terms and conditions of the Creative Commons Attribution (CC BY) license (https://creativecommons.org/licenses/by/4.0/).
Share and Cite
Yang, L.; Zhou, P.; Wang, H.; Mei, N.; Yuan, H. Mechanisms of Charged Particle Motion during Capture by Charged Droplets in Marine Diesel Exhaust. Sustainability 2024, 16, 7354. https://doi.org/10.3390/su16177354
Yang L, Zhou P, Wang H, Mei N, Yuan H. Mechanisms of Charged Particle Motion during Capture by Charged Droplets in Marine Diesel Exhaust. Sustainability. 2024; 16(17):7354. https://doi.org/10.3390/su16177354
Chicago/Turabian StyleYang, Lin, Peilin Zhou, Haibin Wang, Ning Mei, and Han Yuan. 2024. "Mechanisms of Charged Particle Motion during Capture by Charged Droplets in Marine Diesel Exhaust" Sustainability 16, no. 17: 7354. https://doi.org/10.3390/su16177354
APA StyleYang, L., Zhou, P., Wang, H., Mei, N., & Yuan, H. (2024). Mechanisms of Charged Particle Motion during Capture by Charged Droplets in Marine Diesel Exhaust. Sustainability, 16(17), 7354. https://doi.org/10.3390/su16177354