Article

Energy Management Strategy of Fuel Cell Commercial Vehicles Based on Adaptive Rules

1
School of Mechanical and Electrical Engineering, Guilin University of Electronic Technology, Guilin 541004, China
2
School of Automotive Engineering, Guangxi Technological College of Machinery and Electricity, Nanning 530007, China
3
School of Mechanical and Automotive Engineering, Guangxi University of Science and Technology, Liuzhou 545616, China
*
Author to whom correspondence should be addressed.
Sustainability 2024, 16(17), 7356; https://doi.org/10.3390/su16177356
Submission received: 20 July 2024 / Revised: 13 August 2024 / Accepted: 23 August 2024 / Published: 27 August 2024

Abstract

:
Fuel cell vehicles have been widely used in the commercial vehicle field due to their advantages of high efficiency, non-pollution and long range. In order to further improve the fuel economy of fuel cell commercial vehicles under complex working conditions, this paper proposes an adaptive rule-based energy management strategy for fuel cell commercial vehicles. First, the nine typical working conditions of commercial vehicles are classified into three categories of low speed, medium speed and high speed by principal component analysis and the K-means algorithm. Then, the crawfish optimization algorithm is used to optimize the back propagation neural network recognizer to improve the recognition accuracy and optimize the rule-based energy management strategy under the three working conditions to obtain the optimal threshold. Finally, under WTVC and combined conditions, the optimized recognizer is used to identify the conditions in real time and call the optimal rule threshold, and the sliding average filter is used to filter the fuel cell output power in real time, which finally realizes the adaptive control. The simulation results show that compared with the conventional rule-based energy management strategy, the number of fuel cell start–stops is reduced. The equivalent hydrogen consumption is reduced by 7.04% and 4.76%, respectively.

1. Introduction

With the increasing energy crisis and the continuous deterioration of the global environment, energy conservation and emission reduction are imminent. The new energy vehicles with the advantages of clean, environmental protection and high efficiency have become a new development direction. Among them, hydrogen energy is seen as an ideal renewable energy source, which can solve the intermittency of power generation, and in the production process of hydrogen, emissions are also extremely low. Even when methanol is used as a feedstock to produce hydrogen, its carbon dioxide emissions are much lower than those of a heat engine. And nitrogen oxides, sulfur oxides and dust emissions are almost zero [1,2]. Fuel cell vehicles are considered a promising alternative to conventional vehicles because they are more efficient, do not produce any harmful emissions and have good market prospects [3]. Among them, the use of fuel cell vehicles and the promotion and application of fuel cell vehicles are conducive to improving China’s energy structure and have been regarded as the ultimate environmentally friendly vehicle, so it has become the technical direction of key research and development in various countries and the research hotspot of research institutions [4,5,6,7]. In the power system of fuel cell vehicles, fuel cells cannot provide a proper response when the vehicle suddenly changes, so most fuel cell vehicles adopt a hybrid power system with the fuel cell as the main power source and the energy storage power as the auxiliary power source [8,9]. The power distribution of the compound energy source depends on the vehicle’s energy management strategy (EMS), and it is also the core part of the fuel cell vehicle. To improve fuel cell vehicles’ power performance and economy, a reasonable EMS plays a vital role, so it is necessary to establish a reasonable EMS [10].
Currently, EMSs are divided into optimization-based and rule-based control strategies [11]. The optimization-based control strategy achieves energy distribution management by solving complex optimization problems, and the commonly applied optimization strategies are the dynamic programming strategy (DP), Pontryagin’s minimum principle (PMP) and equivalent fuel consumption minimization strategies (ECMSs) [12,13,14,15]. DP is a typical offline optimization method that can obtain theoretically globally optimal control results [16]. However, DP is computationally intensive and requires predictive information about operating conditions, which makes it difficult to meet the needs of online applications for vehicles [17]. PMP is a numerical solution method that uses an iterative technique known as the shooting method to determine the global optimal solution [13]. PMP is similar to DP and requires advance information on working conditions [18].In addition, ECMS is a method of converting the energy consumed by a motor into equivalent fuel consumption using an equivalence factor, thereby reducing the equivalent fuel consumption and ultimately the total fuel consumption [19]. Then, ECMS is strongly influenced by the equivalence factor on its performance. The rule-based control strategy has a short computing time and strong real-time control capability, which is more widely used in engineering and is considered as one of the most practical strategies for fuel cell vehicles [20]. There exists a large number of studies on rule-based energy management strategies, and the work in [21] proposed a heuristic rule-based control strategy and verified the effectiveness of the proposed strategy. The work in [22] proposed a rule-based strategy that that improves the economy of vehicle systems. The work in [23] proposed a power-following fuzzy control strategy that can improve vehicle dynamics as well as reducing hydrogen consumption. However, in traditional rule-based energy management, logical threshold values are often set based on the experience of research scholars, which has certain limitations. On this basis, it is pointed out in the literature [24,25] that fuel cell start–stop is a key factor affecting fuel cell performance, and thus reducing fuel cell start–stop can improve fuel cell performance to a certain extent.
Meanwhile, the driving conditions of fuel cell vehicles have an impact on vehicles’ economy. Therefore, the integration of operating condition recognition into EMS has become a popular research field in recent years [26,27]. Chen et al. recognized driving conditions in real time by fuzzy logic algorithms, thus decreasing energy losses [28], while the study of Wang Y et al. [29] predicts the power of power batteries and supercapacitors under known operating conditions and discusses the different combination of the three power sources’ working mode and rule combination, which ultimately reduces the hydrogen consumption more significantly. In addition, the work in [30] used a clustering algorithm to classify a typical working condition library into five categories and used the Euclidean proximity to identify the working conditions. The work in [31], on the other hand, used a clustering method to establish representative traffic conditions for six modes and build an adaptive fuzzy controller to reduce fuel consumption. Recently, machine-learning algorithms have been further applied in working condition identification. For example, back propagation (BP) neural networks select feature parameters that can characterize vehicle operating conditions as inputs to classify operating condition samples [32,33]. However, the accuracy of neural networks is largely affected by their own structure.
Based on the above problems, in order to improve vehicle economy, and considering the different thresholds corresponding to different working condition categories of the rule-based EMS, an adaptive rule-based energy management strategy (A-Rule) for fuel cell commercial vehicles is proposed, which is divided into an offline part and an online part. In the offline phase, the library of typical driving conditions of nine commercial vehicles is initially classified into three categories using principal component analysis (PCA) and K-means algorithm. Subsequently, the logical thresholds of the rule are optimized using the crayfish optimization algorithm (COA) to obtain the optimal thresholds for the three categories of conditions, and the COA-BP recognizer is established. In the online part, WTVC and Combined Driving Conditions (CDCs) are employed as the test conditions, and the COA-BP recognizer is used to identify the condition categories in real time and invoke optimal thresholds associated with each category. The sliding average filtering algorithm is used for the real-time filtering of fuel cell output power, which reduces the start–stop of the fuel cell, so as to obtain the optimal output power of the fuel cell. To verify the advantage of A-Rule, it is compared and analyzed with DP and the traditional rule-based energy management strategy (Rule).
The rest of the paper is organized as follows: Section 2 builds the fuel cell hybrid vehicle model; Section 3 describes the A-Rule design; Section 4 presents the simulation analysis and discussion; and Section 5 presents the conclusions based on the simulation results.

2. Fuel Cell Hybrid Commercial Vehicle Model

In the article, the main focus is on a fuel cell hybrid commercial vehicle with a vehicle powertrain consisting of a fuel cell and a power cell, as detailed in Figure 1. The fuel cell charges the power cell and generates a stabilized DC power through a unidirectional DC-DC converter. The power cell recovers braking energy and also stabilizes the voltage by connecting directly to the DC bus. These two power sources form an electrical–electrical coupling relationship. The DC-AC converter converts the passing DC power into AC power, while the drive motor transfers torque to the vehicle driveline to drive the wheels. The vehicle parameters are shown in Table 1.

2.1. Vehicle Dynamics

Since the vehicle longitudinal force plays a decisive role in the economy of the vehicle when the vehicle is traveling on a flat road, the longitudinal dynamics of the vehicle is mainly considered in the establishment of the model, and the influence of the transverse dynamics on the stability of the body is ignored. When the vehicle is traveling, the driving resistance is composed of rolling resistance F f , grade resistance F i , acceleration resistance F a and air resistance F w . The traction force F t can be expressed as follows:
F t = F f + F w + F i + F a = m g f cos α + 1 2 ρ C d A v 2 + m g sin α + δ m d v d t
where m is the total mass of the vehicle; f is the rolling resistance coefficient; g is the gravitational acceleration; α is road slope angle; δ is the rotating mass coefficient; C d is the air resistance coefficient; ρ is the air density; A is the windward area of the vehicle; and v is the vehicle speed.
According to Equation (1), the vehicle’s overall vehicle demand power P d , the wheel speed ω w and wheel torque as T w can be obtained; that is,
P d = v η m g f cos α + 1 2 ρ C d A v 2 + m g sin α + δ m d v d t
ω w = v r
T w = r F t
where r is the rolling radius of the wheel and η is the vehicle transmission efficiency.

2.2. Drive Motor Modeling

The drive motor is a key component in the vehicle power system, and the fuel cell hybrid commercial vehicle realizes the energy conversion through the drive motor. The drive motor model is mainly divided into a mechanism model and an efficiency model. The mechanism model analyzes the operating characteristics of the drive motor, which is a complicated modeling process and is mainly used to study the operating characteristics. The efficiency model is based on the motor diagram and has a simple structure, which is suitable for studying the EMS model. Based on the above analysis, this paper adopts the efficiency model to construct the drive motor model, and the specific process is as follows:
T m = T w η i 0 , F t 0 T w η i 0 , F t < 0
ω m = v i 0 R
η m = f ω m , T m
P m = T m ω m η m , F t 0 T m ω m η m , F t < 0
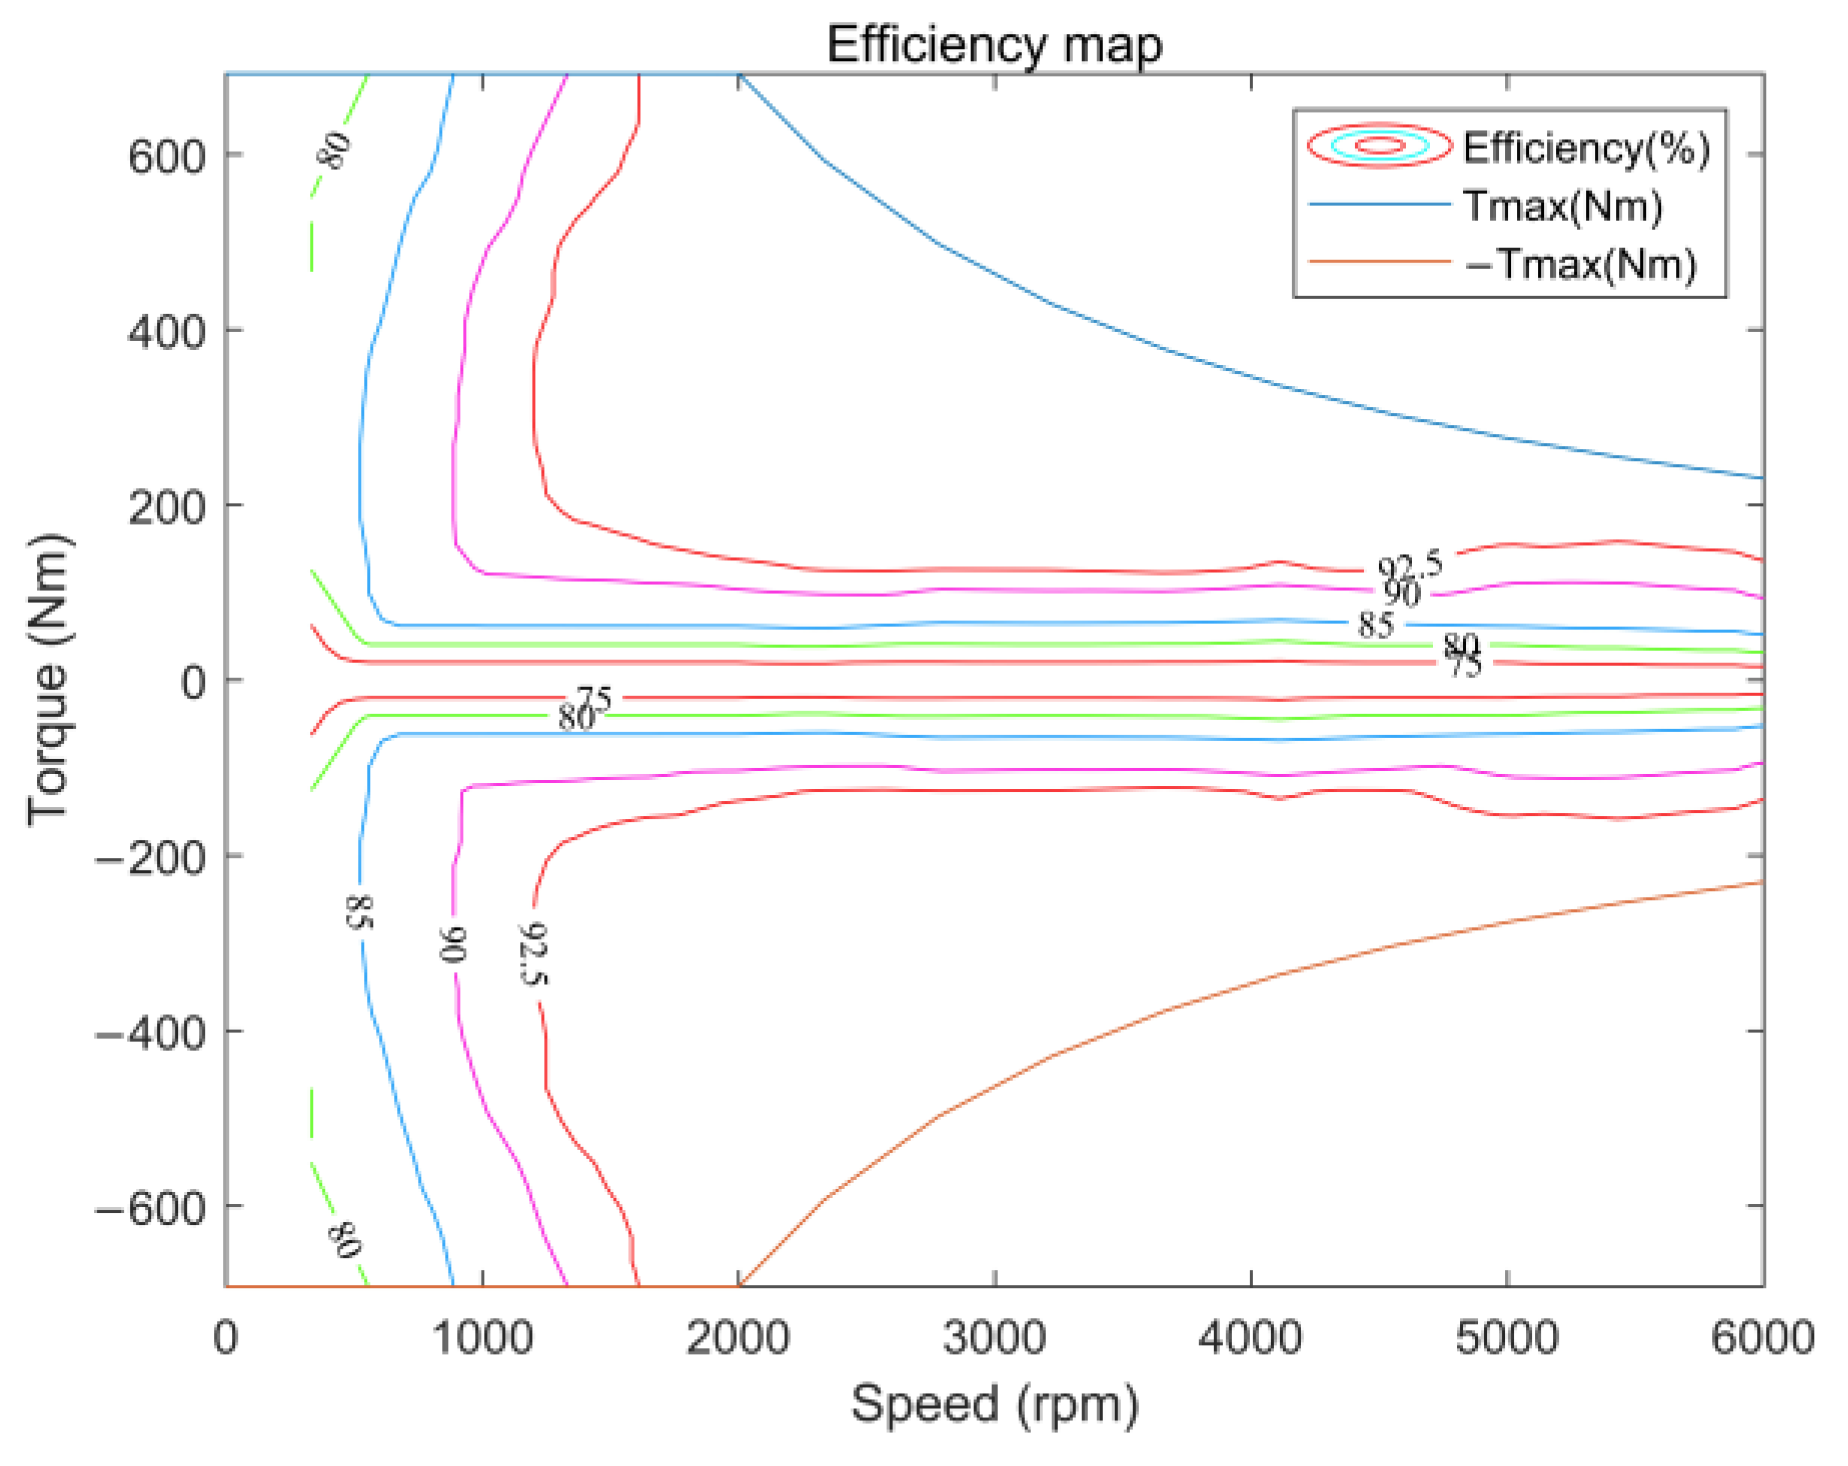
where P m is the drive motor power, T m is the drive motor torque, ω m is the drive motor speed and η m is the drive motor efficiency, where the drive motor efficiency can be obtained from the motor map diagram as shown in Figure 2.

2.3. Fuel Cell Modeling

The proton exchange membrane fuel cell (PEMFC) is widely used in fuel cell commercial vehicles due to its advantages of high efficiency, fast reaction speed and easier availability of the oxidizer. The maximum power of the fuel cell can be determined by the maximum vehicle speed, and the fuel cell with a maximum power of 110 kW can finally be selected, and empirical and mathematical models are used to construct the fuel cell model [34,35]. When the PEMFC operates, the actual output voltage deviates from the ideal voltage, and the deviation increases with the increase in current. The three main factors that cause this variation are activation loss, ohmic loss and concentration loss. Therefore, the single fuel cell output voltage V c e l l is as follows:
V c e l l = E N e r n s t V a c t V o h m V c o n
where E N e r n s t is the thermodynamic electric potential; V c o n is the concentration loss; V a c t is the activation loss; and V o l m is the ohmic loss, where E N e r n s t , V a c t , V o h m , V c o n can be obtained from Equations (10)–(13), respectively.
E n e r n s t = 1.229 8.5 × 10 4 × T T 0 + 4.3085 × 10 5 × T × 0.5 ln P o 2 + l n P H 2
V a c t = V 0 + V a 1 e c 0 i
V o h m = I R o h m
V c o n = R T F ln i i m a x
where T is the thermodynamic temperature; T 0 is the reference temperature; P o 2 is the partial pressure of oxygen; P H 2 is the partial pressure of hydrogen, i is the current density; V 0 is the voltage at which the current density is 0 and V a , c 0 are the coefficients of the correlation constants, where V 0 , V a , c 0 can be obtained by fitting the experimental data; I is the current; R o h m is the internal resistance of the fuel cell monomer; R is the gas constant; F is the Faraday constant; and i m a x is the maximum current density.
According to Equations (9)–(13), the fuel cell output power P f c , hydrogen consumption rate m ˙ H 2 and fuel cell efficiency η f c can be obtained; that is,
P f c = N V c e l l I
m ˙ H 2 = N M H 2 n F I
η f c = P f c L H V m ˙ H 2
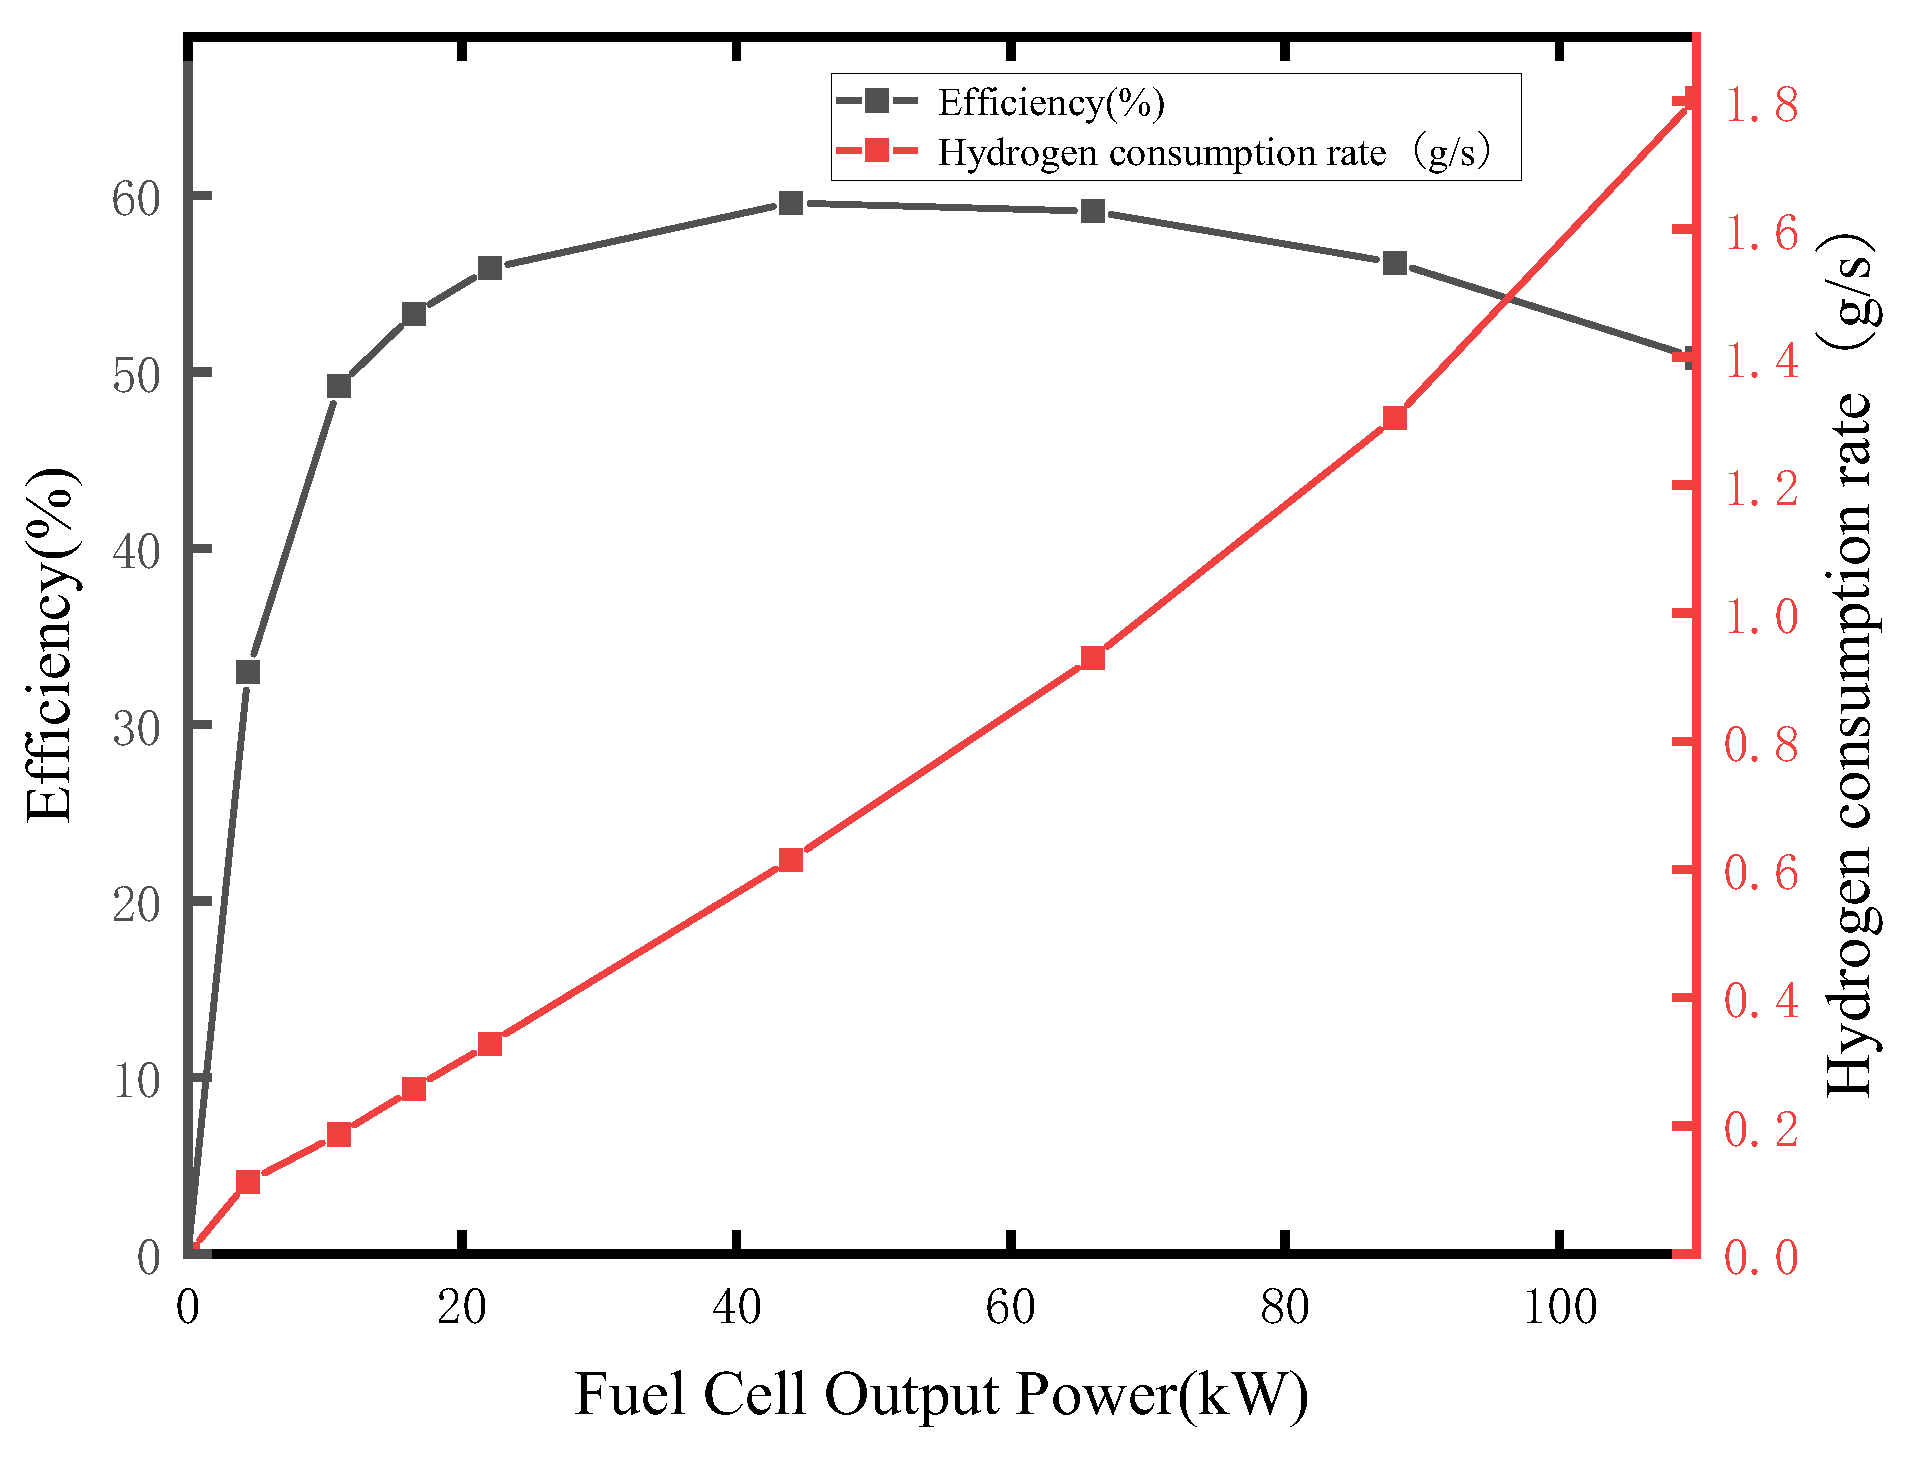
where m ˙ H 2 is the hydrogen consumption rate; N is the number of fuel cell monomers; M H 2 is the molar mass of hydrogen; L H V is the low heating value of hydrogen; and n is the number of electrons lost in the electrochemical reaction. The fuel cell output power is related to efficiency and hydrogen consumption as shown in Figure 3.

2.4. Power Battery Modeling

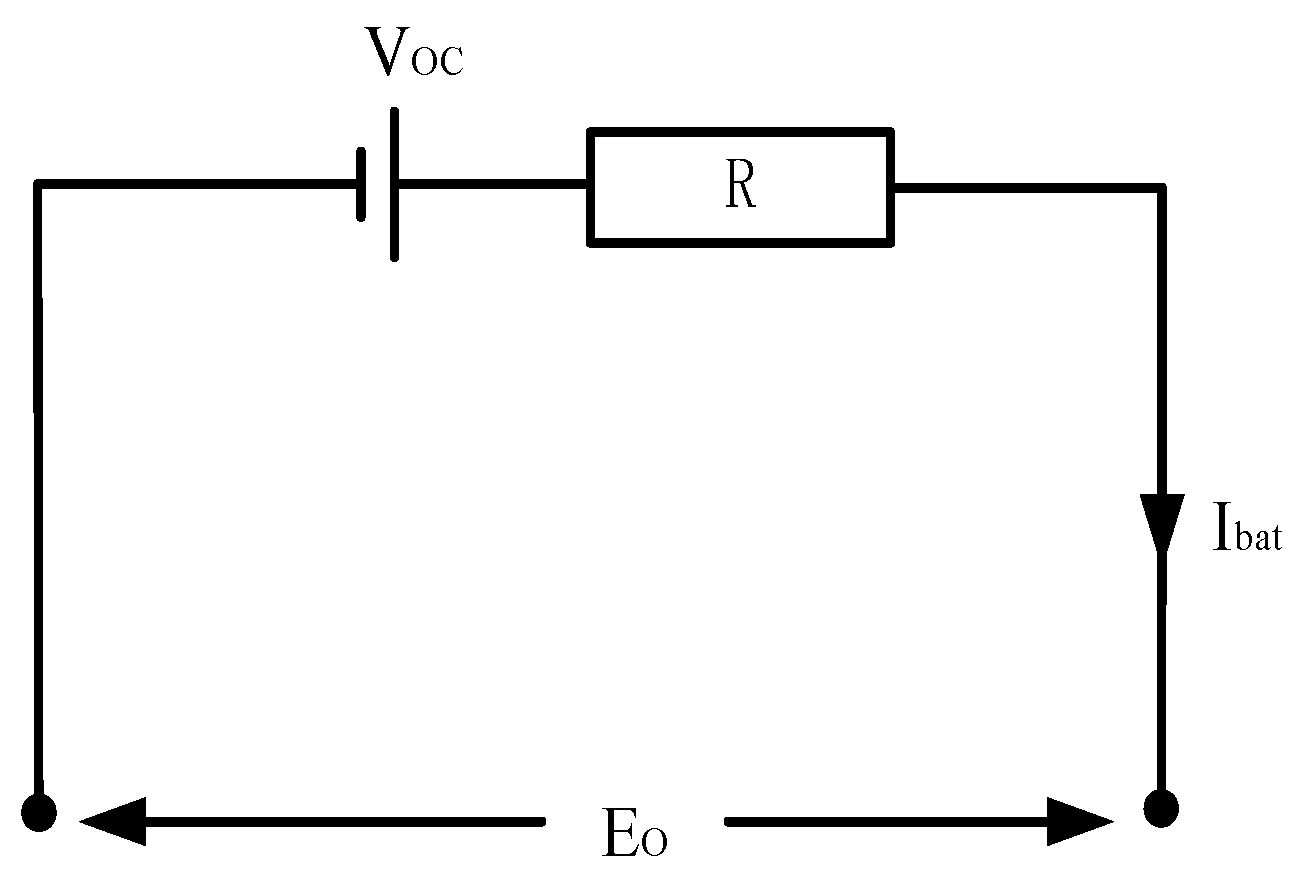
In the fuel cell hybrid power system, the power battery plays an important role in vehicle starting and energy recovery. In this article, the R-int model is adopted to model the power battery, which has a simple and clear structure and can fully reflect the electrical characteristics of the battery, as proven by previous studies [36,37], and the structure of the model is shown in Figure 4, where the power cell is equivalent to an ideal voltage source V o c and a resistance R . The output power P b a t of the power pack is a function of the current I b a t , see Equation (17), where the state of charge S O C of the power cell, which is a key variable in the EMS of a fuel cell commercial vehicle, can be derived from Equation (18).
I b a t = V o c ± V o c 2 4 R P b a t 2 R
S O C t = S O C i n t η b t i t I b a t t d t Q
where S O C i n t is the initial value of power battery charge state, η b is the power battery efficiency and Q is the power battery capacity.

3. A-Rule Design

The A-Rule established in this paper is shown in Figure 5, and the EMS includes an offline part and an online part. In the offline part, nine kinds of commercial vehicle working condition data are selected, three kinds of working condition categories are obtained through PCA and K-means clustering, and the COA-BP recognizer model is established by using the COA optimization BP recognizer model, and the optimal logic thresholds under the three kinds of working conditions are obtained by using the COA optimization rules at the same time. In the online part, WTVC and CDC are used as the test conditions, and the COA-BP recognizer is used to identify the condition categories in real time, and then the optimal logic thresholds under the category are called according to the condition categories, so that the fuel cell output is always in the high-efficiency zone, and the sliding average filtering algorithm is used for real-time filtering of the fuel cell output power, so as to obtain the optimal output power of the fuel cell.

3.1. K-Means Classification of Work Conditions

For fuel cell commercial vehicles, most of the current research focuses on a typical working condition, and driving conditions in various countries are constructed taking into account the representativeness of the constructed working conditions, that is, they can effectively reflect the driving characteristics of this type of vehicle in a certain operating environment. In order to meet the complex and changing driving environment, this paper adopts nine typical driving conditions of WVUCITY, WVUINTER, NEWYORKBUS, CHTC-HT, CHTC-LT, CHTC-B, CHTC-D, CHTC-TT and CHTC-C which are applied to commercial vehicles as the working condition database. The working condition database was categorized into three types of working conditions using PCA and K-means clustering.
Concurrently, in order to fulfill the specific needs of the designed vehicle, 10 characteristic parameters, including maximum speed, average speed, running average speed and so forth, are selected (see Table 2). Each kinematic segment characteristic parameter is calculated.
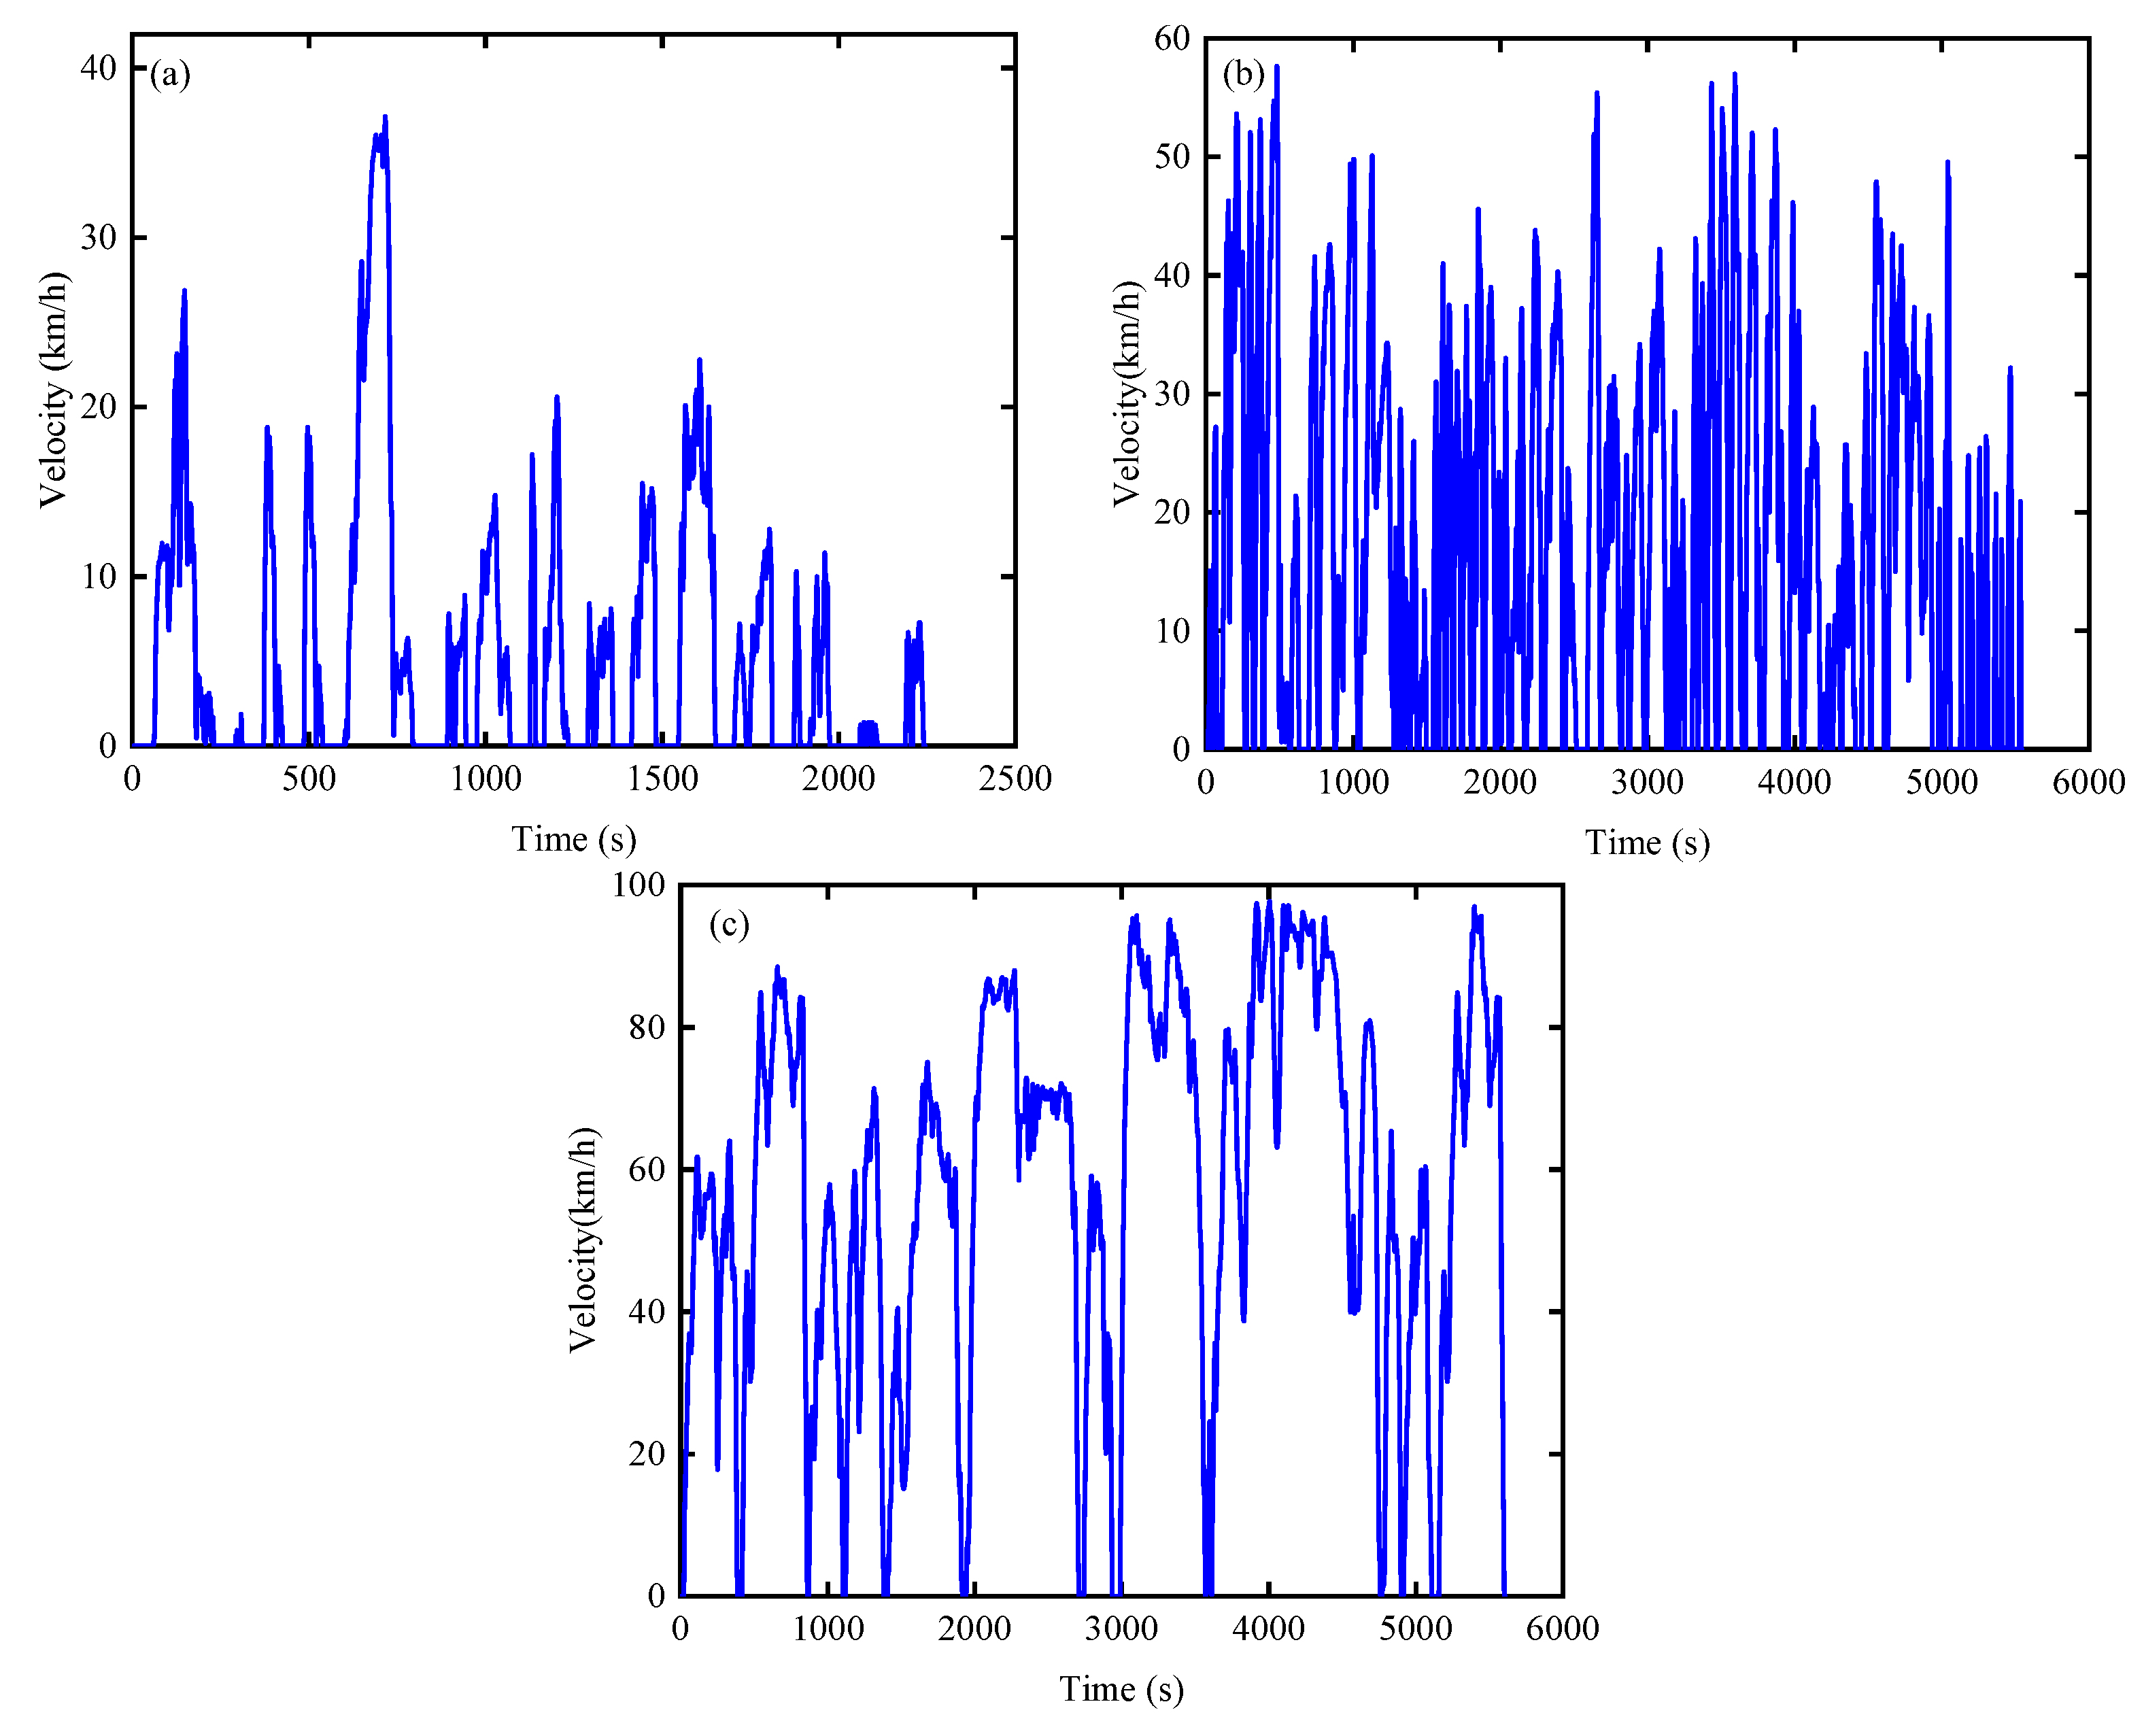
PCA is a data analysis method that can reduce the computational complexity and information redundancy. In this paper, the PCA method is used for dimensionality reduction, and the cumulative contribution rate and eigenvalues of 10 principal components are obtained, which are shown in Table 3. The cumulative contribution rate of the first three principal components in the table reaches 90.031%, and it is shown in the statistical theory that, in general, when PCA analysis is carried out, the principal components whose cumulative contribution rate reaches 80% and whose characteristic root is larger than 1 can basically represent the 10 characteristic parameters. Therefore, the first three principal components were selected for K-means clustering, and three working conditions were finally obtained, as shown in Figure 6.
As illustrated in Figure 6, it can be seen that the first type of working conditions are a vehicle speed below 38 km/h and the average speed is low, belonging to the low-speed working conditions; the second type of vehicle speed is below 60 km/h and the average speed is moderate, belonging to the medium-speed working conditions; for the third type, the vehicle speed is below 97 km/h and the average speed is high, belonging to the high-speed working conditions.

3.2. COA-BP Recognizer Model

3.2.1. BP Neural Network

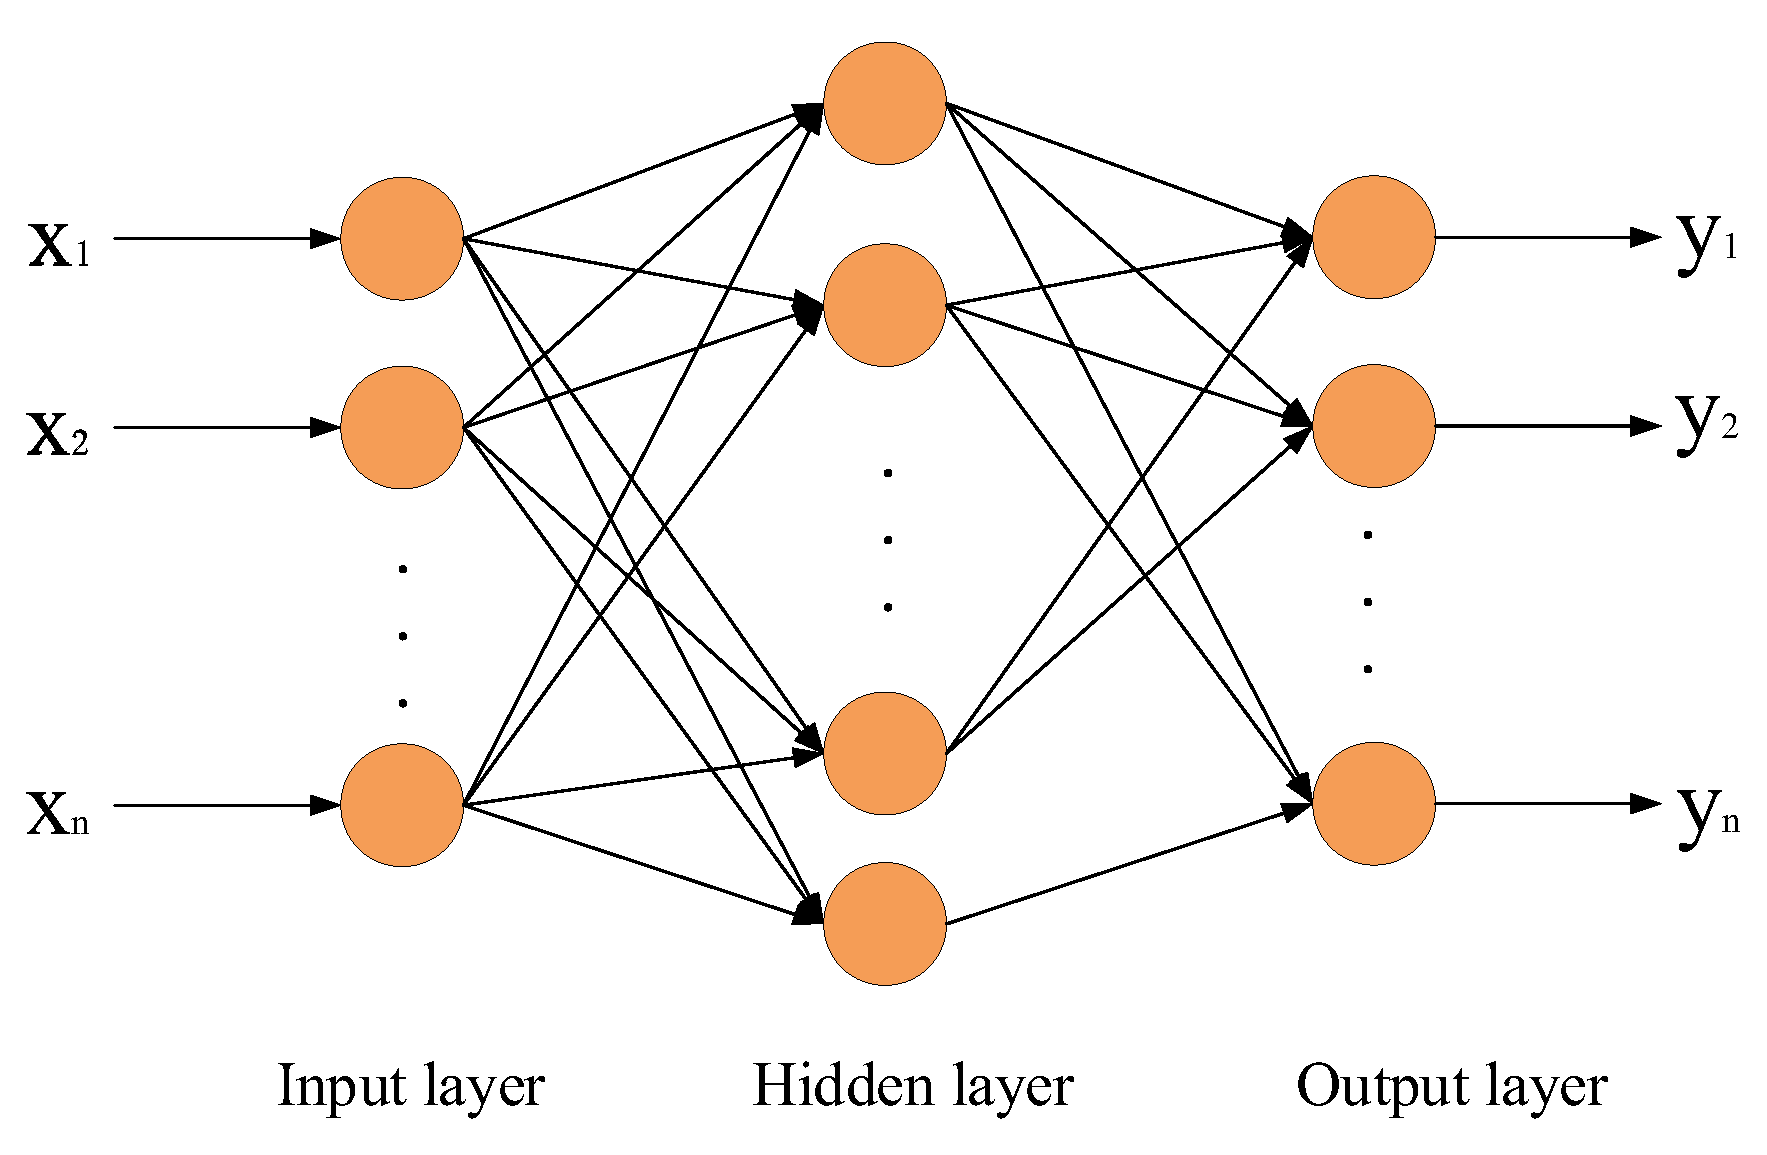
The BP neural network is composed of an input layer, hidden layer and output layer [38], with two processes of forward propagation and backward propagation through the forward propagation and backward propagation of the continuous cycle of training to make the neural network reach the end-value conditions, in which the number of neurons in the hidden layer, L, can be determined by Equation (19), and the structure of the BP neural network is shown in Figure 7 [39].
L = n + m + a
where n is the number of input units; m is the number of output units; and a is a constant of [1,10].
During the training process of the BP neural network, the error propagates backward through the neural network so that the trained neural network fits the sample well. By adjusting the weights and thresholds of the connections between two adjacent layers, the sum of the mean square errors of the output layers is minimized, but the initial weights and initial thresholds of the BP neural network are generated by randomization, and the training process may be prone to fall into a local optimum.

3.2.2. COA-BP Recognizer

The BP neural network has a high recognition accuracy in practical problem processing, but it also has certain limitations. Its prediction effect mainly depends on the setting of weights and thresholds, which are randomly generated, resulting in its prediction effect not being stable enough. In order to solve this problem, this paper adopts COA to optimize the weights and thresholds of the BP neural network. COA was proposed by Prof. Heming Jia et al. in 2023, which is inspired by the crayfish’s foraging, heat-avoidance and competition behaviors. In intelligent optimization algorithms, exploration is the process of identifying potential regions in a large search space. Development is the process of finding the best solution in a promising area. Exploration focuses on searching unexplored regions to increase diversity, and development focuses on searching the current optimal solution regions to accelerate convergence. Balancing these two search behaviors has an impact on solution quality. Over-exploration affects development and vice versa. Therefore, the balance between meta-heuristic development and exploration is a great challenge. At present, it has been proven that COA has a better ability in this respect and has a faster convergence speed than the genetic algorithm, particle swarm algorithm and so on [40,41].
Some studies have proven [42,43] that when the sample length is set to 180 s, it can better reflect the current driving state. In this paper, the sample length is set to 180 s, and the sampling interval is 1 s. For the COA-BP neural network working condition recognition model, the input variables are the 10 feature parameters in the sample interval of 180 s, the output variables are the information of each type of working condition, and the binary processing is performed for each type of working condition, which is (1,0,0) for the low-speed working condition, (0,1,0) for the medium-speed working condition and (0,0,1) for the high-speed working condition. That is, the constructed COA-BP neural network has a total of 10 neurons in the input layer, the hidden layer is set to 5 neurons and the output layer contains a total of 3 neurons. In this study, the training set, test set and validation set are taken as 60%, 20% and 20% of the data for each operating condition, respectively.
In this paper, the initial parameters of the COA optimization algorithm are set as follows: the initial population is set to 30, and the maximum number of iterations is set to 100. Using the recognition accuracy error value as the adaptation value, the COA optimization algorithm is used to obtain the optimal weights and thresholds, which are assigned to the BP neural network. Finally, the BP neural network decides to update the weights and thresholds based on the termination conditions, and the final weights and thresholds obtained represent the completion of neural network training. The whole detailed process is as follows:
  • Initialize the population
X i = l b + u b l b × r a n d
where X i represents the weights and thresholds of individual i , l b is the lower bound indicating the weights and thresholds, u b is the upper bound of the weights and thresholds and r a n d is a random value.
  • Define the temperature and intake of the crayfish
COA controls the algorithm to enter two phases of exploration or exploitation by temperature T e m p change: when T e m p > 3 0 C and r a n d < 0.5 , it enters the exploration phase of heat avoidance, and when T e m p < 3 0 C , or T e m p > 3 0 C and r a n d 0.5 it is the exploitation phase when the crayfish has a strong competitive nature and a better foraging behavior, and their foraging intake is indicated by p .
T e m p = r a n d × 15 + 20
p = C 1 × 1 2 π e x p ( t e m p μ ) 2 2 σ 2
where μ is the most suitable temperature for crayfish and σ , C 1 are constants to control the intake of crayfish at different temperatures.
  • Summer resort stage (exploration)
When r a n d < 0.5 , crayfish will enter the burrow to avoid the heat, which can be expressed by the following equation:
X s h a d e = X G + X L / 2
X i t + 1 = X i t + C 2 × r a n d × X s h a d e X i t
where X s h a d e is the cave position, X G denotes the global optimal position obtained with iteration and X L denotes the global optimal position obtained with iteration. When r a n d < 0.5 , there is no contention for caves, t denotes the number of current iterations and C 2 is the descent curve, where C 2 = 2 t / T , and T is the maximum number of iterations 100.
  • Competition stage (exploitation)
When T e m p > 3 0 C and r a n d 0.5 , this means that there will be competition for crayfish, which can be expressed by the following equation:
X i t + 1 = X i t X z t + X s h a d e
where z denotes a random individual crayfish, where z = r o u n d ( r a n d × ( N 1 ) ) + 1 .
  • Foraging stage (exploitation)
When T e m p < 3 0 C , the crayfish starts to forage for food. The crayfish will move to the food location and determine the food size. Its formula is as follows:
X f o o d = X G
Q = C 3 × r a n d × f i t n e s s i / f i t n e s s f o o d
where Q is the food size, C 3 is the food factor, denoting the maximum food, f i t n e s s i denotes the fitness value of the i th crayfish and f i t n e s s f o o d denotes the fitness value of the food.
  • Output result judgment
Finally, we update X G , X L and determine whether the maximum number of iterations 100 is reached; if the maximum number of iterations is not reached, we then carry out definition of the temperature and intake of the crayfish, otherwise we output the weights of the optimal individual with the threshold as the initial value, and finally calculate the error, determine whether the termination condition is reached and output the result if it is reached, otherwise the weights are updated and we continue to carry out the calculation of the error.
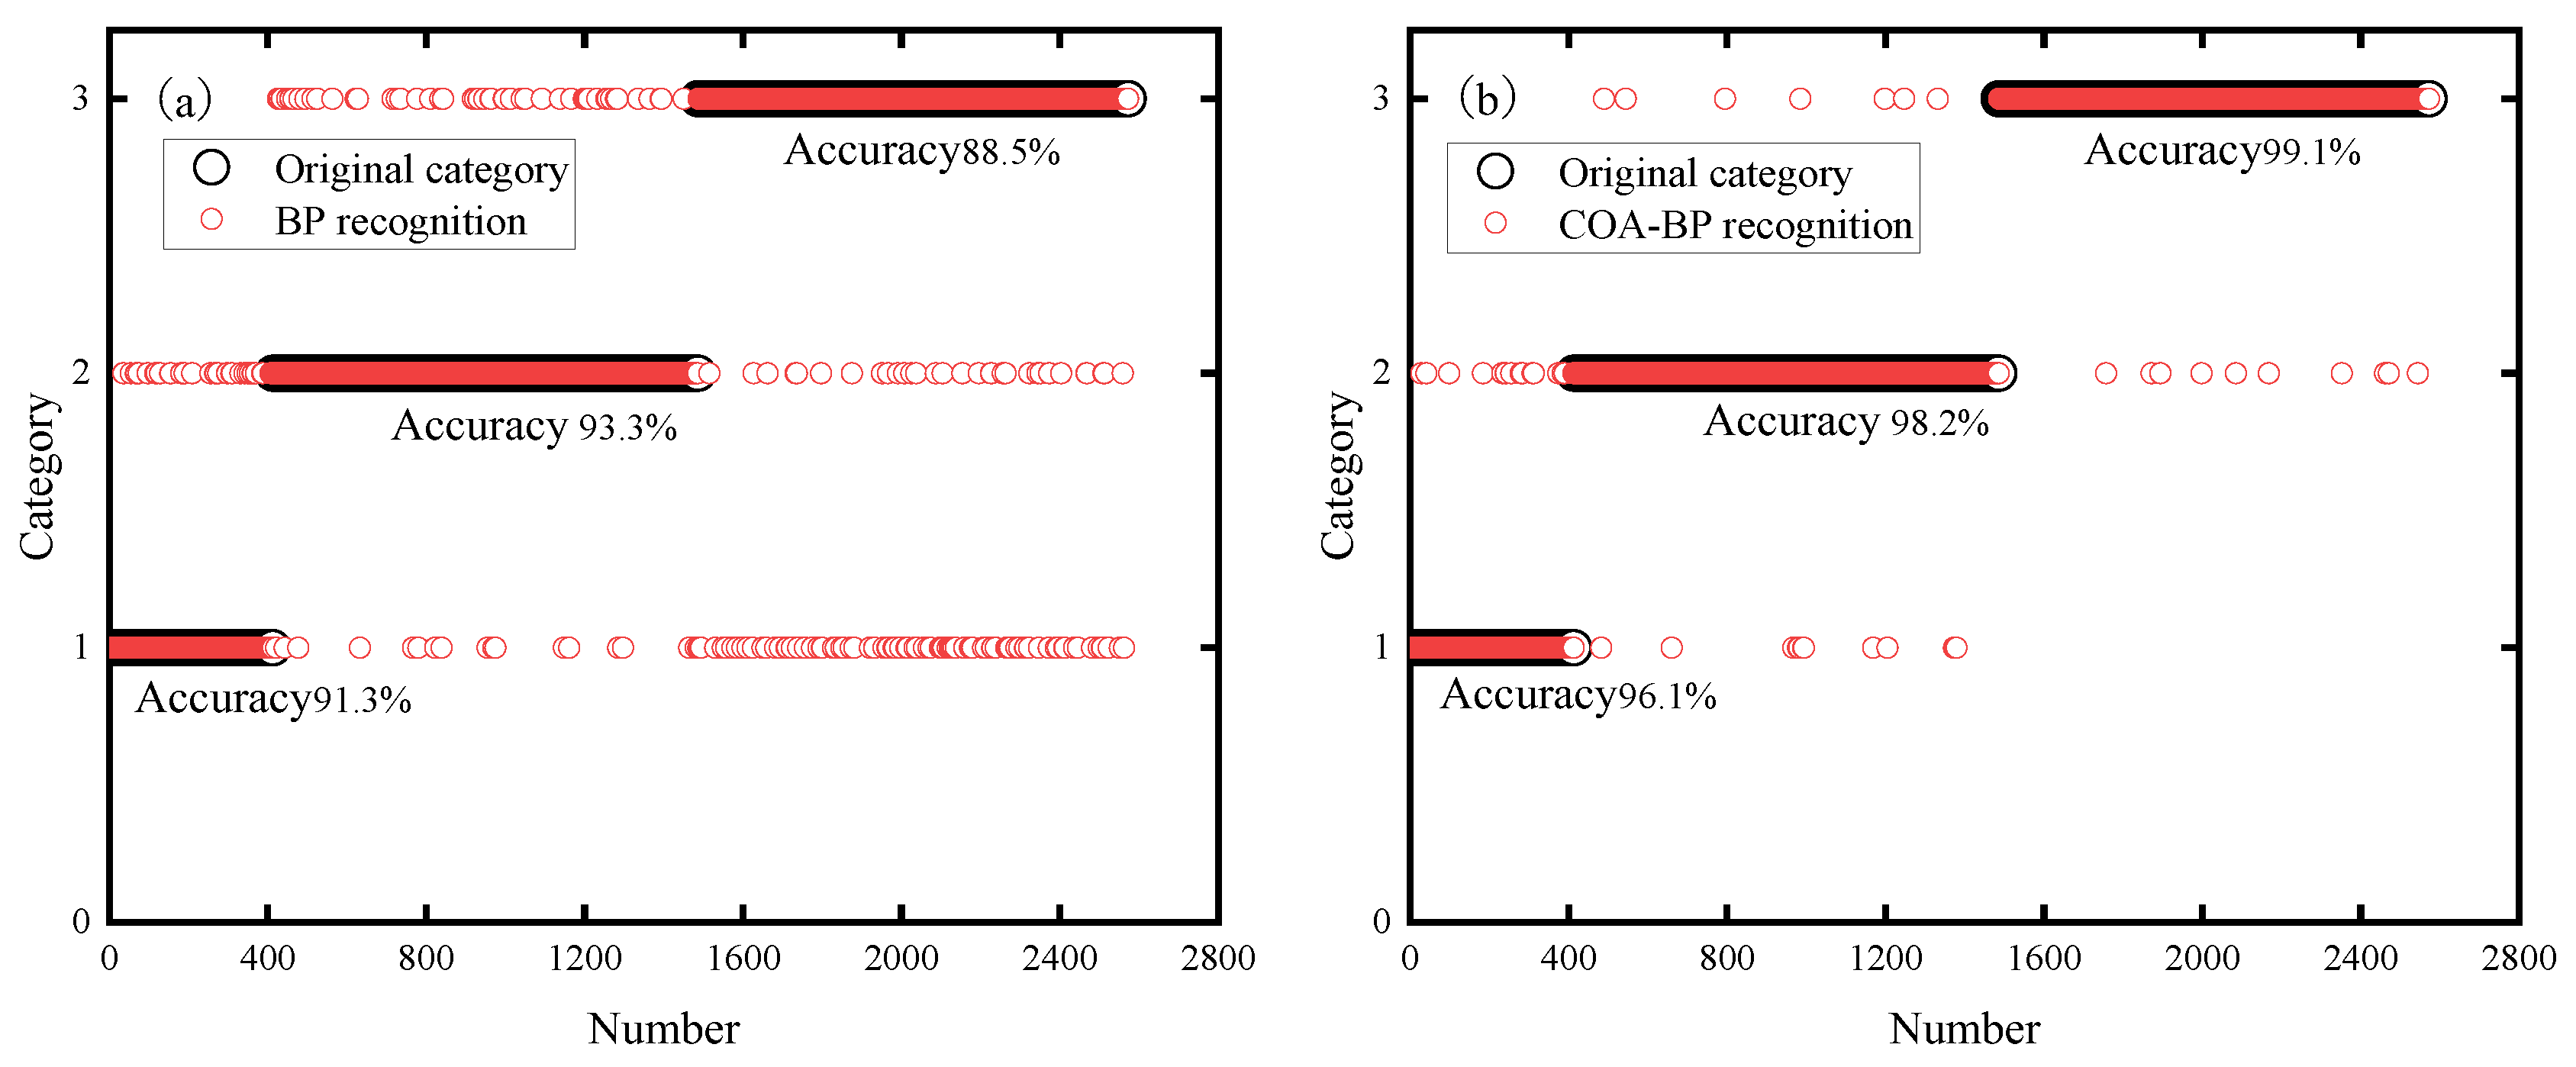
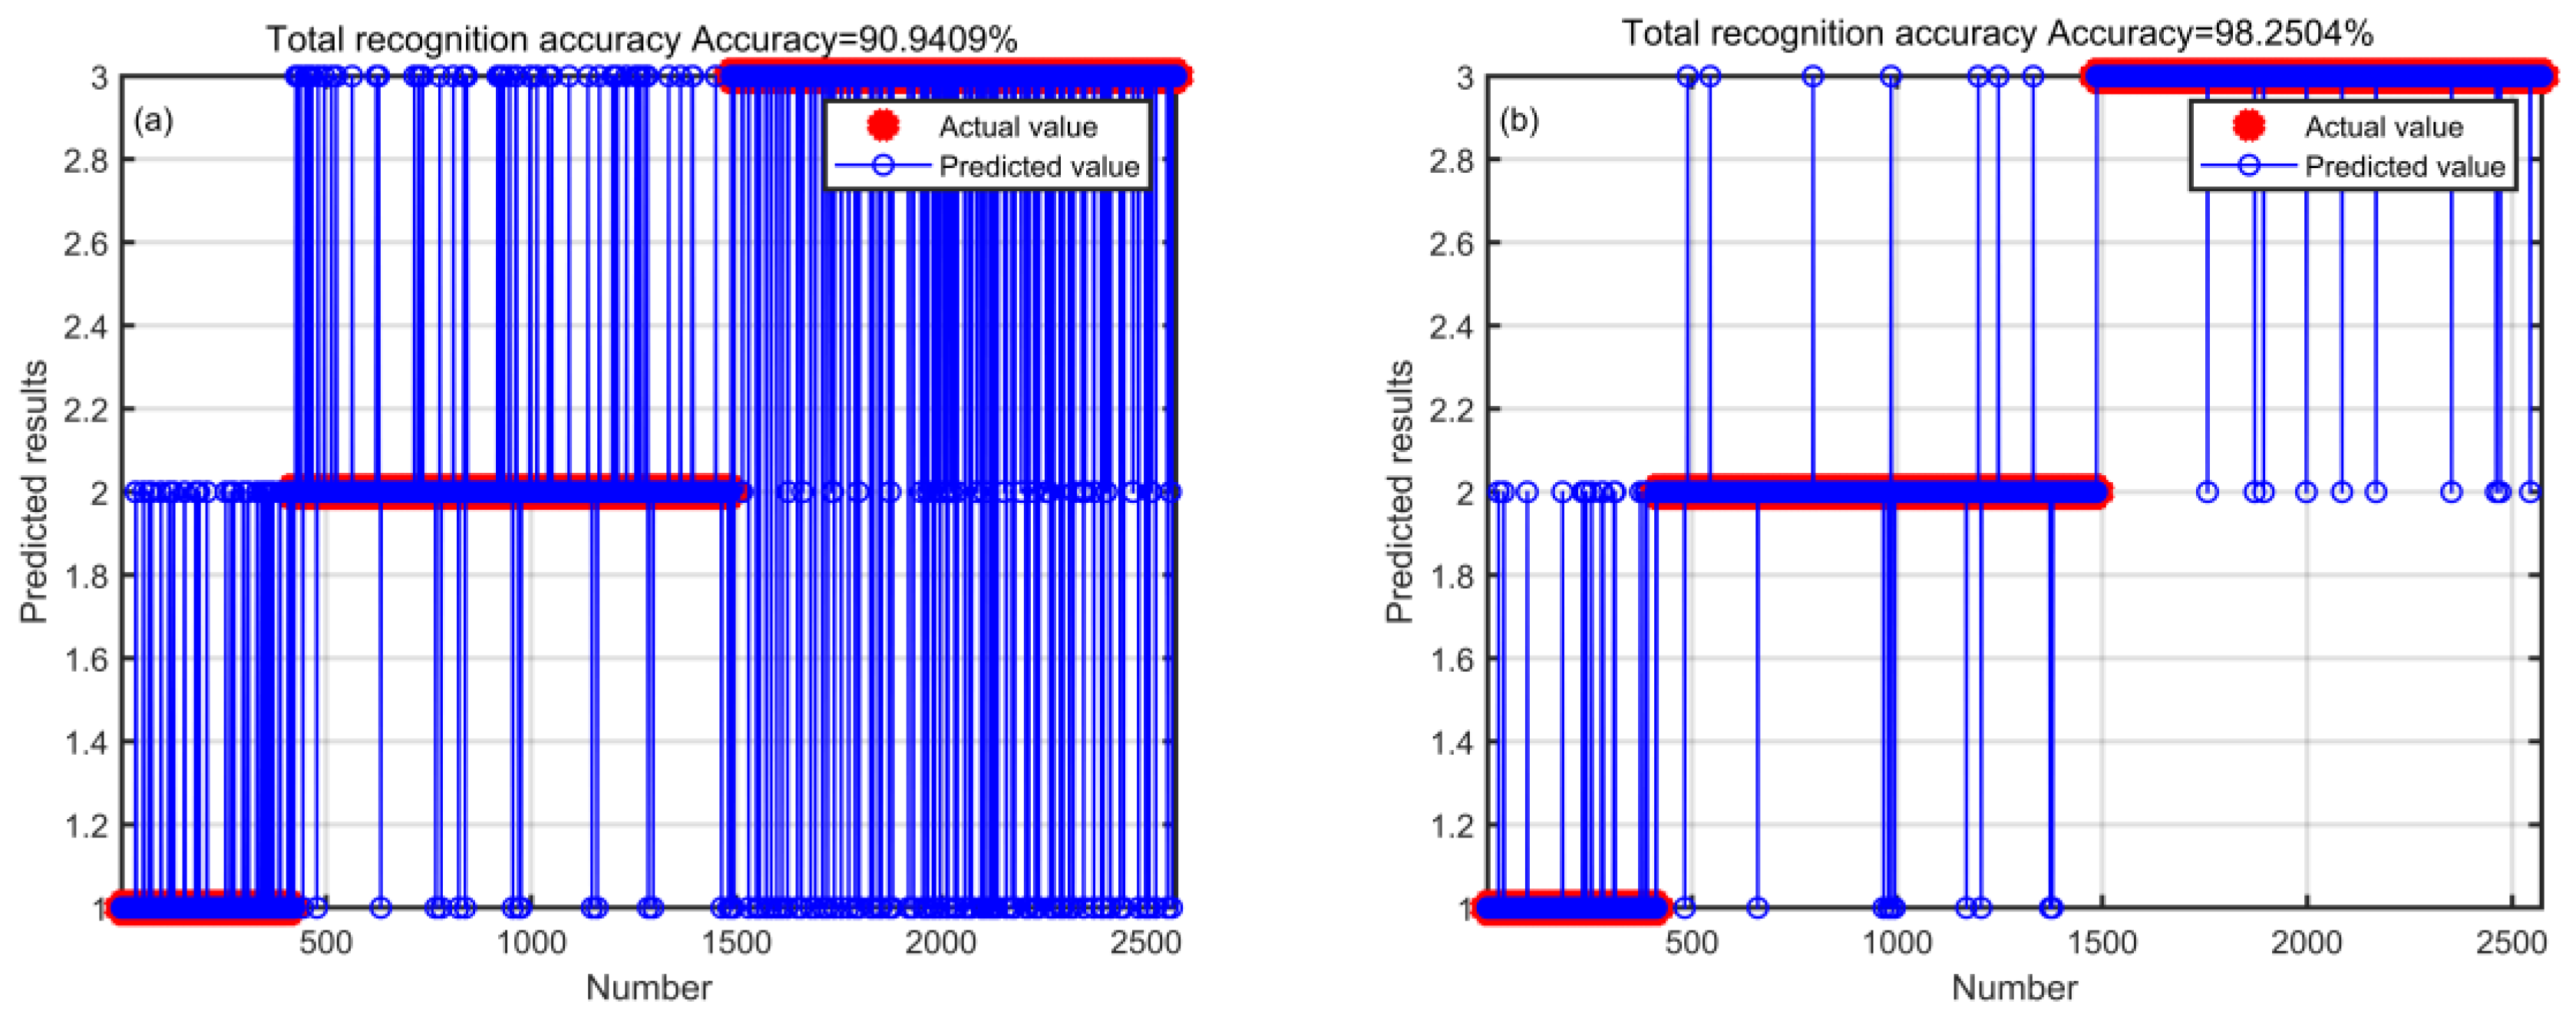
In Figure 8 and Figure 9, the effect of BP neural network working condition recognition with or without the application of COA is analyzed. In the figures, there is a significant improvement in the recognition accuracy of the COA-BP-based recognizer compared to the BP recognizer, the recognition accuracy of low-speed working conditions has been improved by 4.8%, the recognition accuracy of medium-speed working conditions has been improved by 4.9%, the recognition accuracy of high-speed working conditions has been increased by 10.6% and the total recognition accuracy has been improved by 7.31%, which indicates that the recognition effect of the COA-BP recognizer is more accurate.

3.3. Rule Threshold Optimization

Rule is characterized by its ease of implementation and high operational reliability, focusing on ensuring vehicle dynamics while using pure electric drive modes as much as possible to reduce fuel consumption, this section uses COA offline optimization rules to build the COA-Rule model.

3.3.1. Rule

In this paper, we will establish Rule, in which the fuel cell will be at a fixed high-efficiency interval, and the logic threshold value will be formulated according to the current vehicle speed V , battery S O C , demand power P _ d and fuel cell high-efficiency interval P f c _ η , which can be categorized into driving modes as follows: parking mode, mechanical braking mode, braking energy recovery mode, power consumption mode and power maintenance mode. The logic of each mode will be determined as follows:
  • Parking mode
If the demand power P _ d = 0 in parking mode, the fuel cell and power cell do not work at this time.
  • Mechanical braking mode
If P _ d < 0 , the system is currently in braking mode. To avoid power battery overcharge, we set the power battery S O C maximum threshold S O C m a x . When S O C S O C m a x is determined, the vehicle is currently in mechanical braking mode.
  • Braking energy recovery mode
If P _ d < 0   & & S O C < S O C m a x , the power is in the safe area and energy recovery can be carried out. However, if the charging power is greater than the maximum charging power of the power battery at this time, only the maximum power P b m a x is recovered at this time, and the rest of the braking power is provided by the mechanical braking P b m .
  • Power consumption mode
The demand power P _ d > 0 in this mode has the following five cases:
If S O C S O C m a x & & P _ d < P b m a x , the power is sufficient at this time, and the vehicle’s demand power is completely provided by the power battery.
If S O C S O C m a x & &   P _ d P b m a x , this time the power is sufficient, the power battery outputs the maximum power P b m a x and the fuel cell supplements the remaining power.
If S O C o b j S O C < S O C m a x & &   P f c _ η l < P _ d < P b m a x , the fuel cell outputs at the lower limit of the high-efficiency area P f c _ η l , and the power cell replenishes the remaining power at this time.
If S O C o b j S O C < S O C m a x & & P _ d < P b m a x & & P _ d P f c _ η l , at this time, the power battery is more abundant, and in order to minimize the consumption of hydrogen, the demand power is mainly supplied by the power battery.
If S O C o b j S O C < S O C m a x & & P _ d P b m a x , at this time, the power battery outputs the maximum power P b m a x , and the fuel cell supplements the remaining power.
  • Power Maintenance Mode
In this mode, the demand power P _ d > 0 , and there are 8 cases as follows:
If S O C m i n S O C < S O C _ o b j & & P _ d > P f c m a x , at this time, the fuel cell outputs the maximum power P f c m a x , and the power cell supplements the remaining power.
If S O C m i n S O C < S O C _ o b j & & P f c _ η h < P _ d P f c m a x , then the fuel cell outputs the maximum power P f c m a x , and the power cell is recharged.
If S O C m i n S O C < S O C _ o b j & &   P f c _ η m a x < P _ d P f c _ η h , at this time, the fuel cell output power is the upper limit of the high-efficiency area P f c _ η h , and the power cell is charged.
If S O C m i n S O C < S O C _ o b j & &   P f c _ η l < P _ d P f c _ η m a x , at this time, the fuel cell outputs the maximum efficiency value of the fuel cell, P f c _ η m a x , and the power cell carries out charging.
If S O C m i n S O C < S O C _ o b j & & P _ d P f c _ η l , at this time, the fuel cell outputs power at the lower limit value of the high-efficiency area P f c _ η l , and the power cell is charged.
If S O C < S O C m i n & & P _ d > P f c m a x , at this time, the fuel cell outputs the maximum power P f c m a x , and the power battery replenishes the remaining power.
If S O C < S O C m i n & &   P f c _ η h < P _ d P f c m a x , then the fuel cell outputs the maximum power P f c m a x , and the power cell is charged.
If S O C < S O C m i n & &   P _ d P f c _ η h , at this time, the fuel cell outputs the upper limit of the high-efficiency area P f c _ η h , and the power cell is charged.
Among them, Figure 10 shows the detailed structure diagram of Rule.

3.3.2. COA-Rule

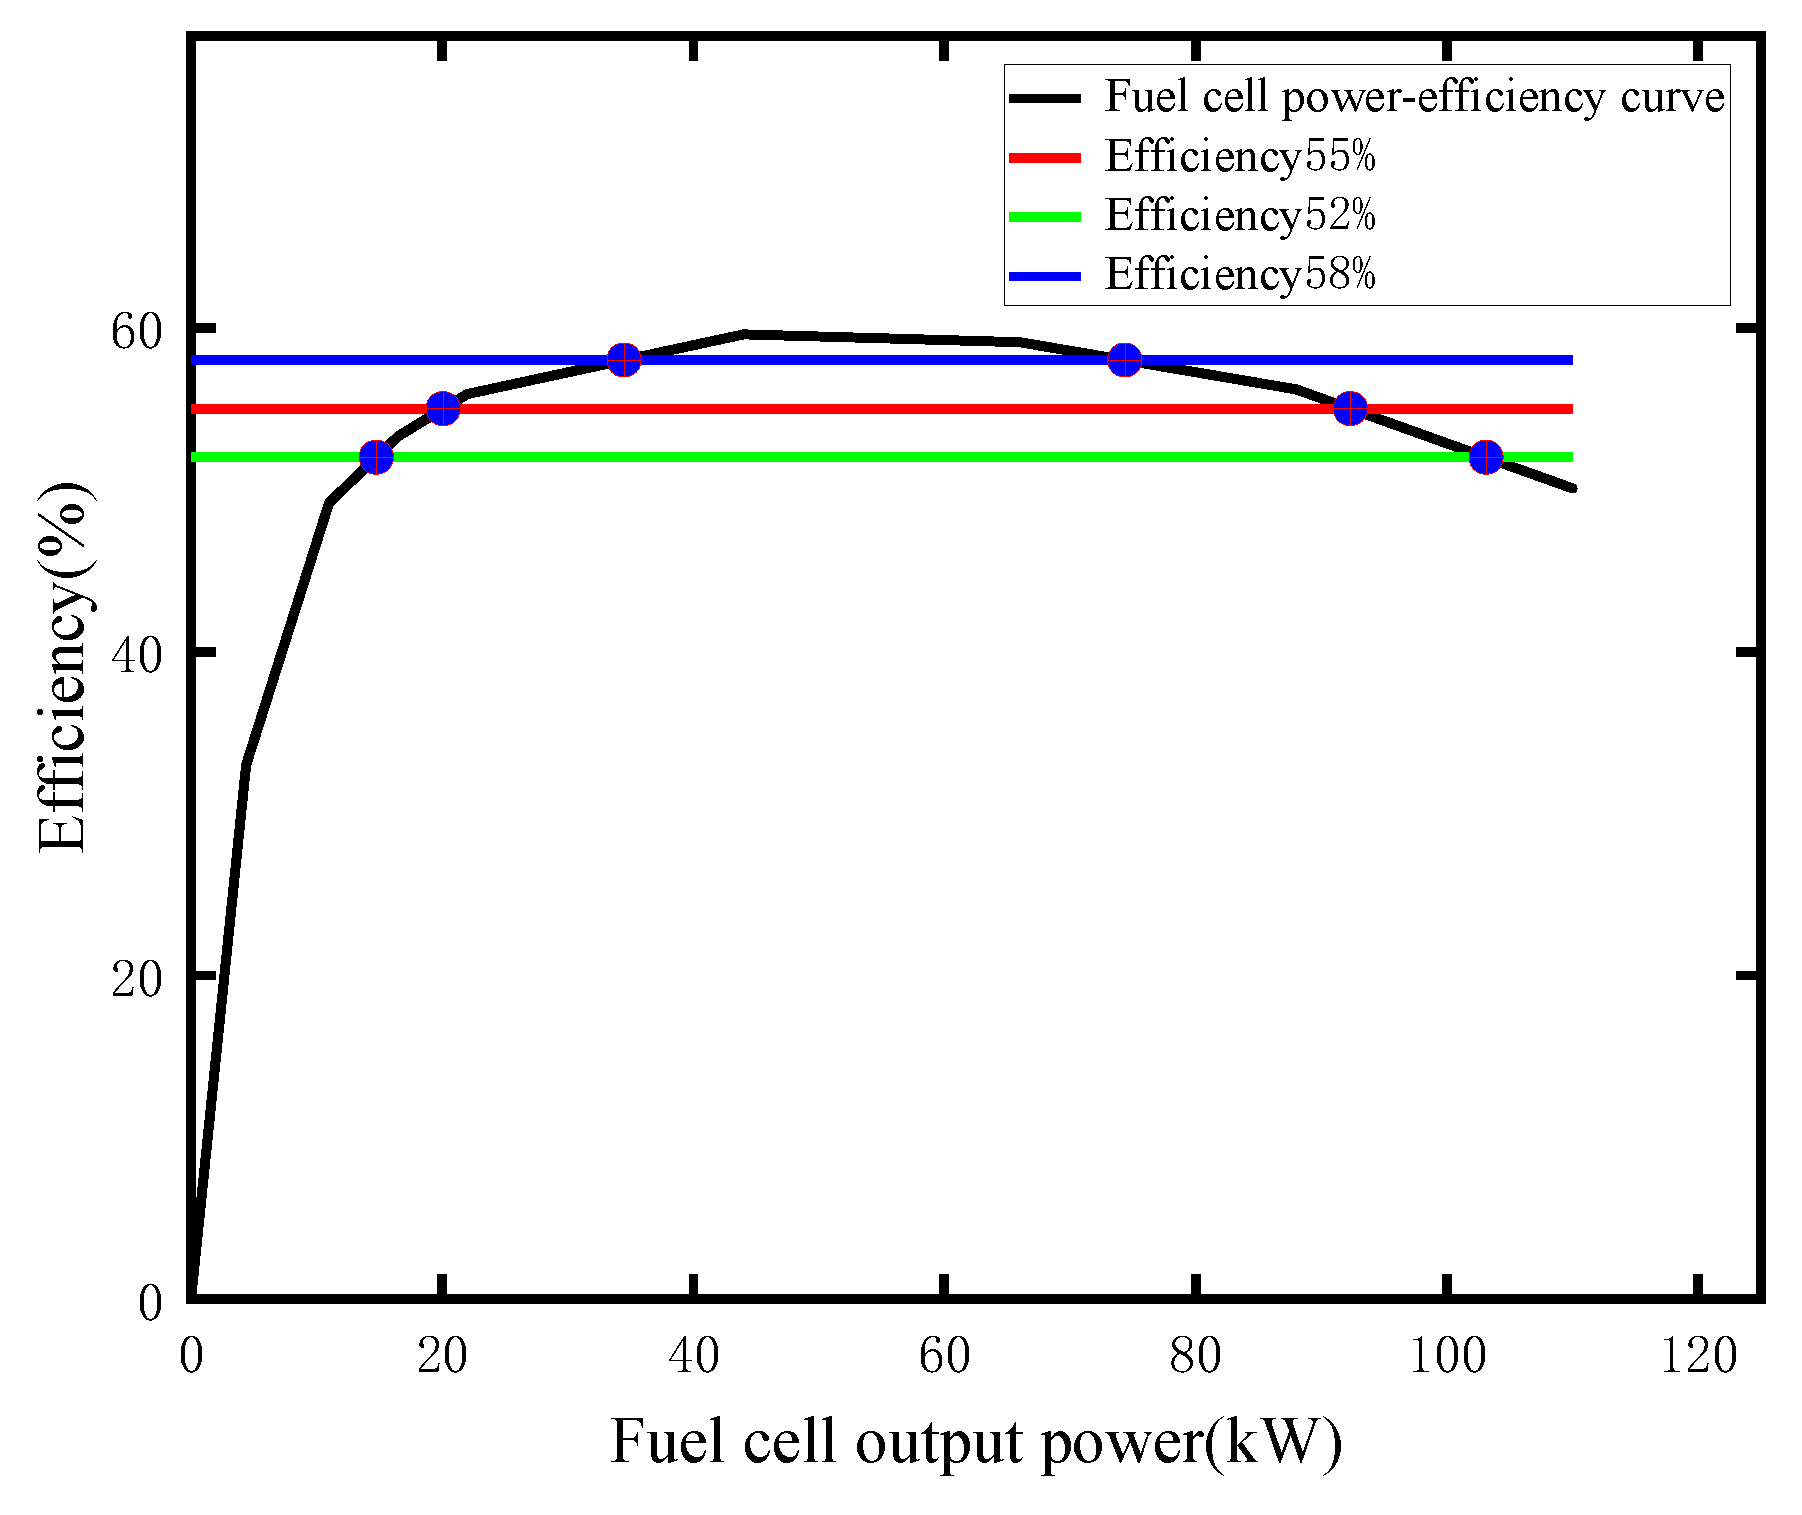
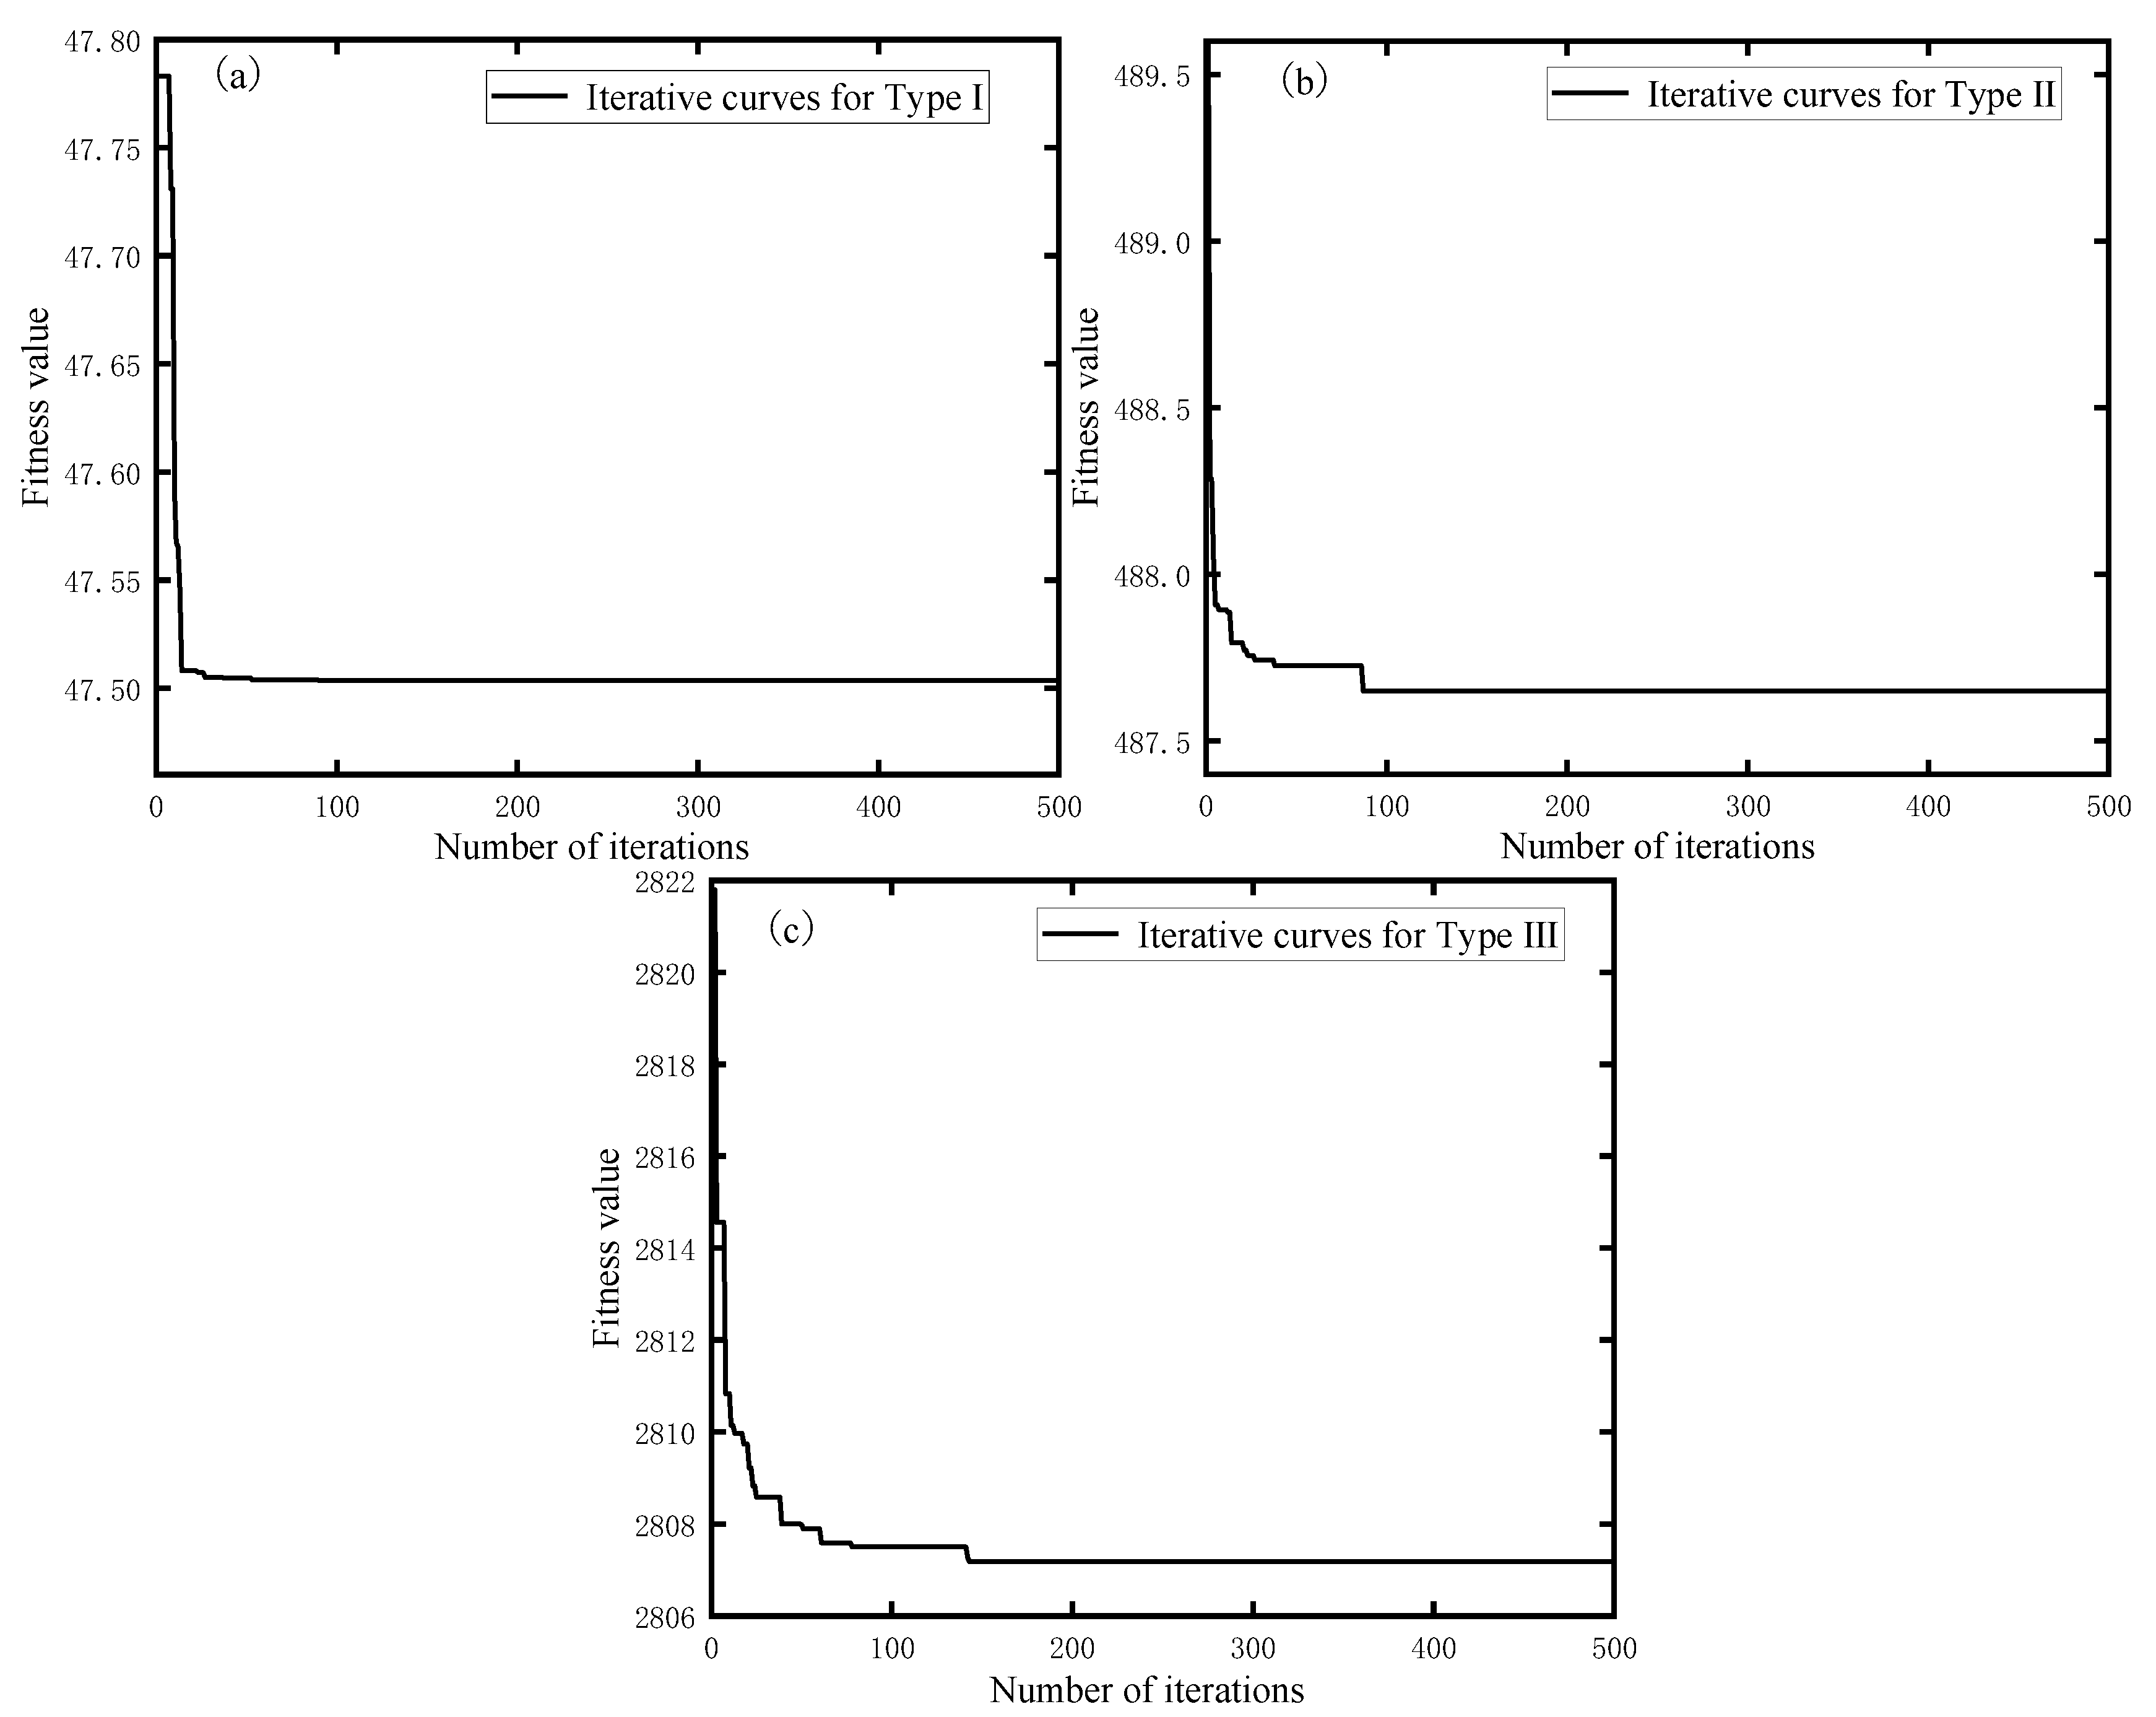
Since the logical thresholds of the rules are set based on the experience of the experts, it will increase the hydrogen consumption of the vehicle. Based on the above problems, this paper uses COA for iterative optimization of its logical threshold values. COA is an intelligent optimization algorithm that stands out from other optimization algorithms with the advantages of fast response. Under the three types of operating conditions, using the hydrogen consumption of Rule in each type of operating condition as the adaptation value, COA is used to find the optimization of the logical threshold values of Rule, respectively, which include the minimum value of the battery charging state S O C m i n , the maximum value of the battery charging state S O C m a x , the low limit value of the high efficiency interval of the fuel cell P f c _ η l and the fuel cell high efficiency interval upper limit value P f c _ η h . According to Figure 3, it can be seen that the maximum efficiency of the fuel cell is about 60%, in which the fuel cell power corresponding to the maximum efficiency is 44 kW. In this paper, the adopted fuel cell high efficiency interval threshold is about 55%, the fuel cell performance is optimal and the range of the high efficiency interval threshold is set at [52%, 58%]. The details are shown in Figure 11. To avoid excessive charging and discharging of the power battery, the S O C m i n interval of the power battery used is [0.2, 0.4] and the S O C m a x interval is [0.70, 0.85]. The detailed optimization steps are shown in Table 4, and the optimization results of COA are shown in Figure 12. From the figure, it can be seen that the first type of working condition converges to the optimal solution in 52 generations with the optimal fitness value of 47.503655 g, the second type of working condition converges to the optimal solution in 86 generations with the optimal fitness value of 487.649401 g and the third type of working condition converges to the optimal solution in 146 generations with the optimal fitness value of 2807.179853 g. The optimal logical threshold values for each type of working condition after COA optimization are shown in Table 5.

3.4. Sliding Average Filtering Algorithm

The sliding average filtering algorithm focuses on averaging n consecutive points in a window and then moving the window sequentially to perform the calculation, which belongs to a kind of sliding average method in spatial domain processing methods. In this paper, sliding average filtering is used for real-time smoothing of the fuel cell output power to improve vehicle performance with the following expression:
P f c t = i n d P f c i n

4. Validation and Discussion

In this paper, simulations are performed under dynamic driving conditions to validate the effectiveness of the strategy. WTVC and CDC are provided, where CDC consists of three types of driving conditions characterized in Section 3.1. CDC consists of the NYCCOMP condition and UDDSHDV condition, while the driving conditions are unknown before the test to fully simulate the uncertainty of vehicle driving conditions. The experiment first uses the COA-BP recognizer for real-time recognition, in which the real-time recognition results of the driving conditions are shown in Figure 13.
In Figure 13, 1 indicates low-speed working conditions, 2 indicates medium-speed working conditions and 3 indicates high-speed working conditions. In Figure 13a, when the vehicle is in the period of 0–70 s, the maximum speed is about 20 km/h and the average speed is lower, which is consistent with the characteristics of low-speed working conditions; in 400–600 s, the maximum speed is about 40 km/h and the average speed is moderate, which is in line with the type of medium-speed working conditions; and in 1200–1400 s, the maximum speed is about 70 km/h and the average speed is higher, which is in line with the high-speed working condition type. In general, the COA-BP recognizer working condition recognition accuracy is high. In Figure 13b, when the vehicle is in the period of 0–100 s, the average speed is low, which conforms to the type of low-speed working conditions; when it is in 500–600 s, the average speed is moderate, which conforms to the type of medium-speed working conditions; and in the 1600–1800 s range, the average speed is high, which conforms to the type of high-speed working conditions. Overall, the working condition recognition accuracy of the COA-BP recognizer is high.
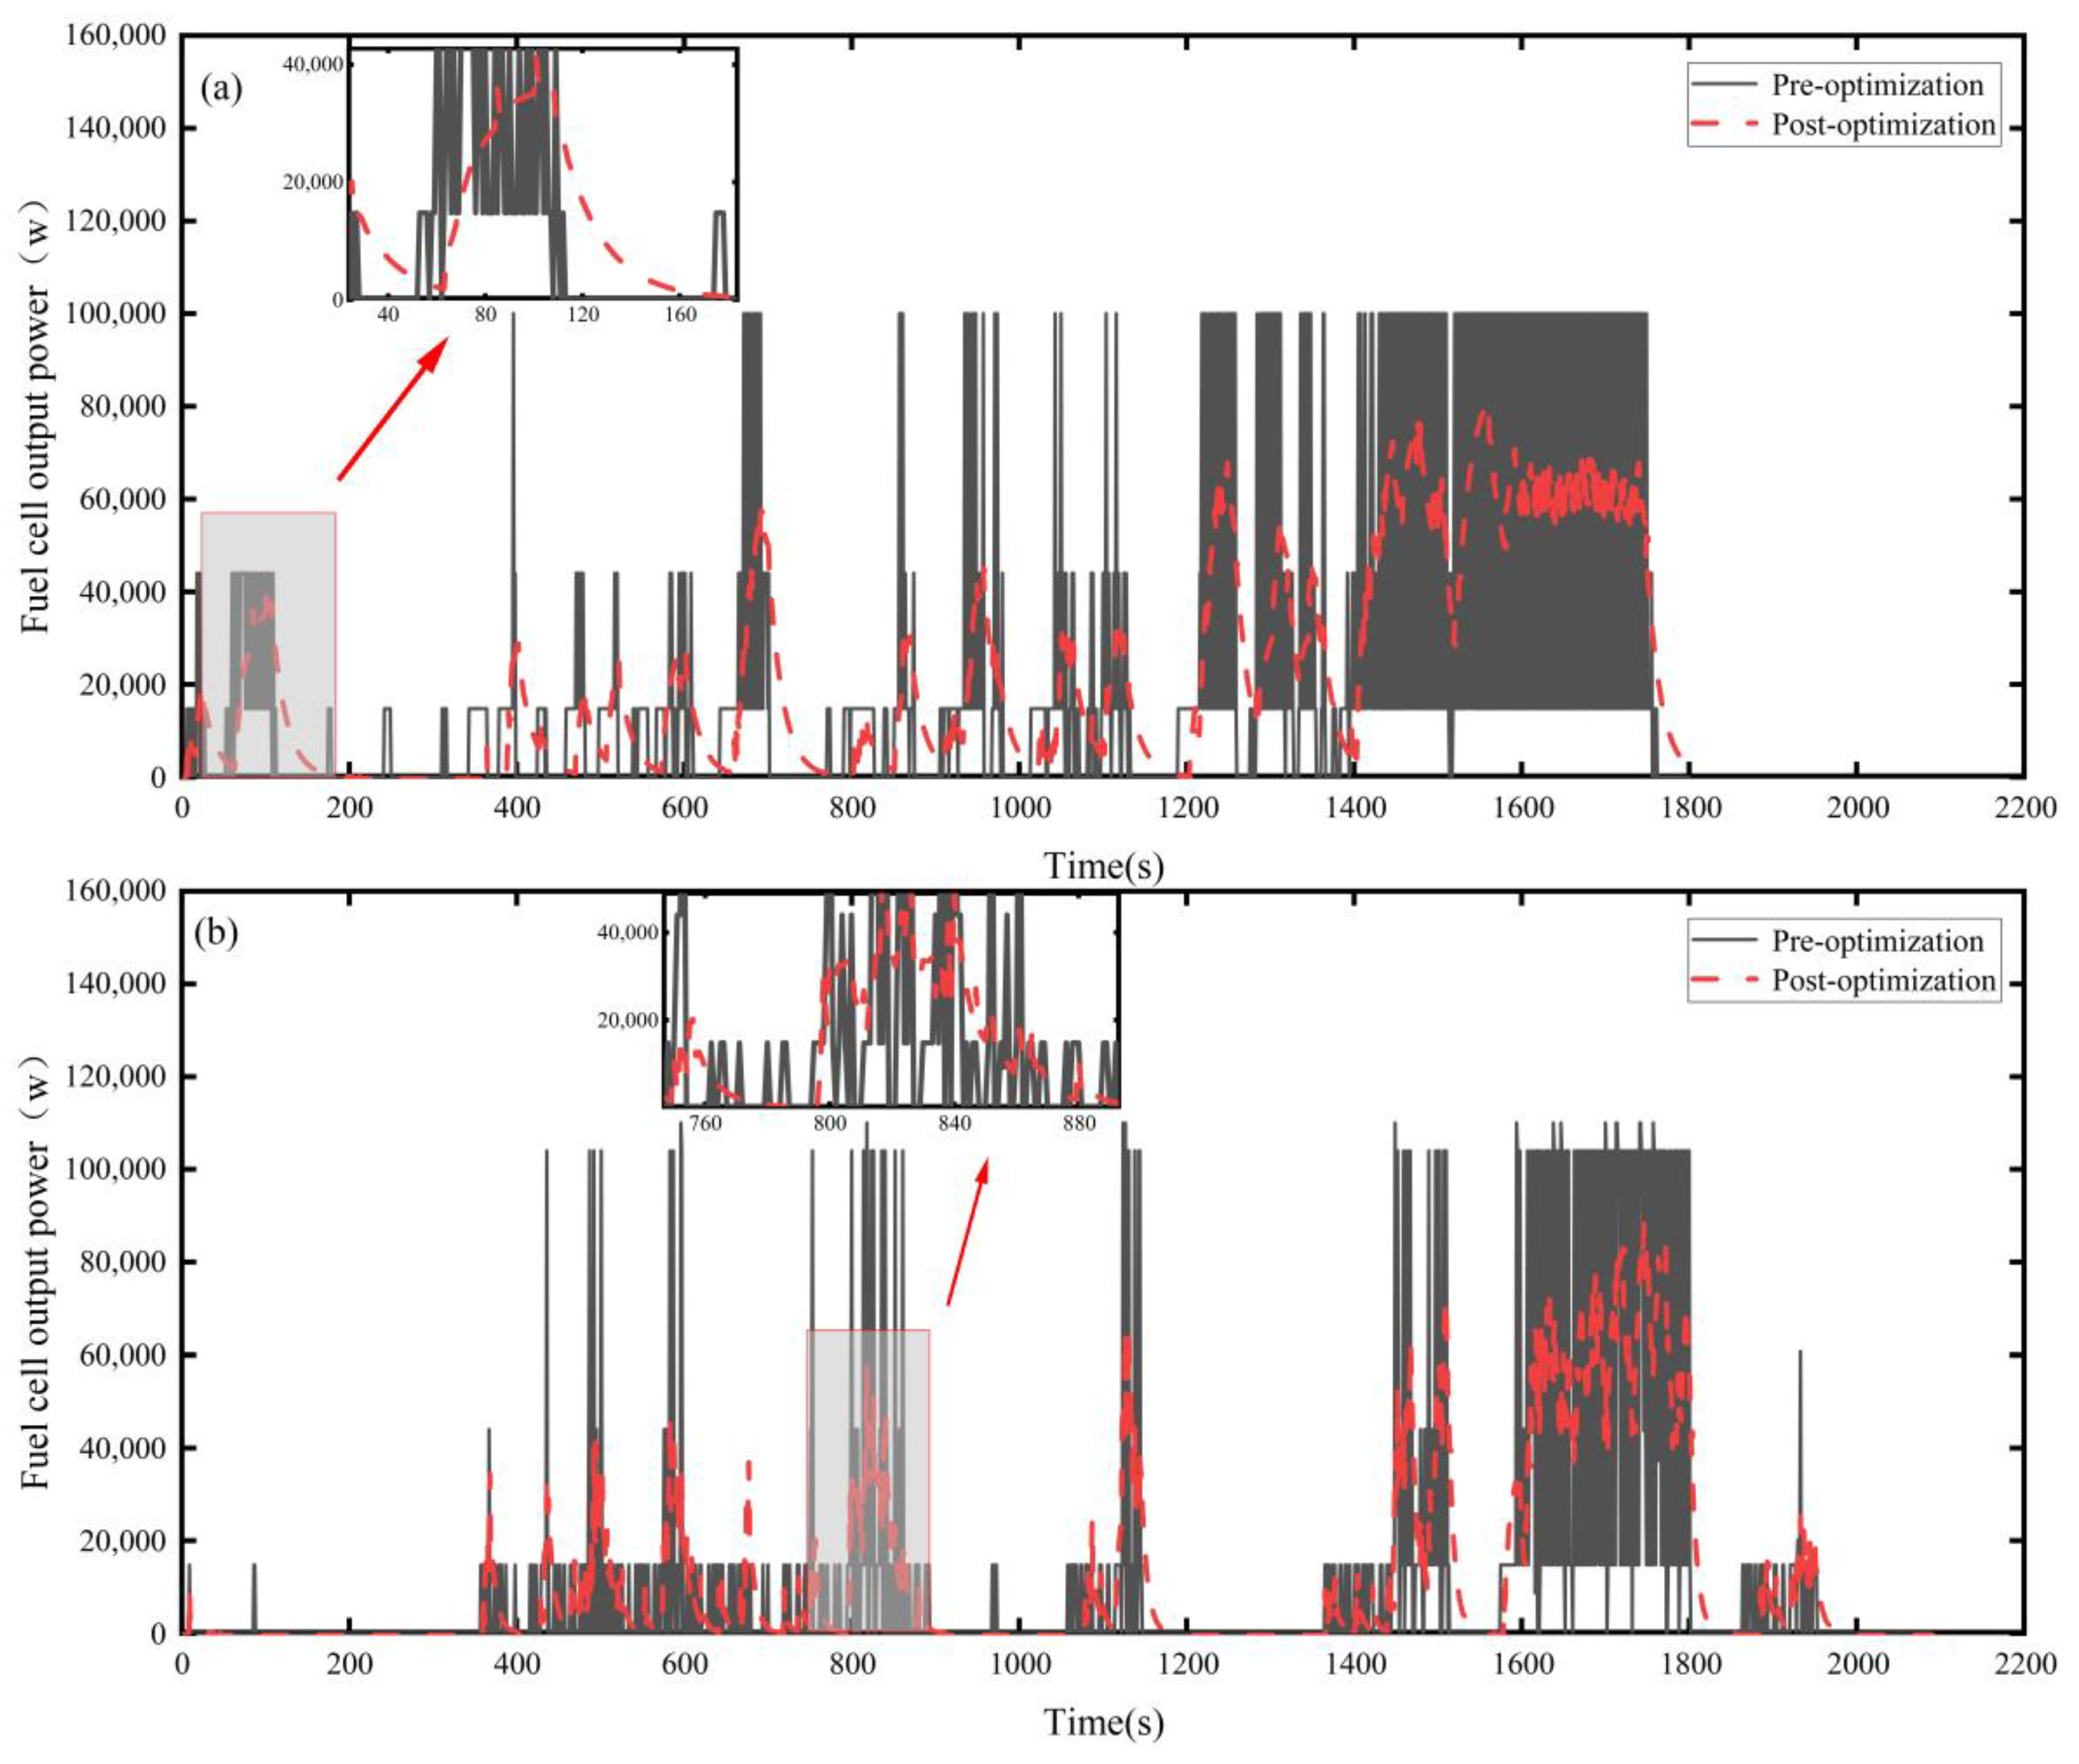
The vehicle calls the optimal threshold values for each category of working conditions in Section IV through the real-time recognized categories, and at the same time assigns the optimal threshold values to Rule, and after real-time smoothing with the sliding average filtering algorithm, the results are shown in Figure 14. In Figure 14a,b, it is obtained that under WTVC as well as CDC, this strategy significantly reduces the fuel cell start/stop compared to Rule, which indicates that this strategy is able to improve the fuel cell performance to a certain extent.
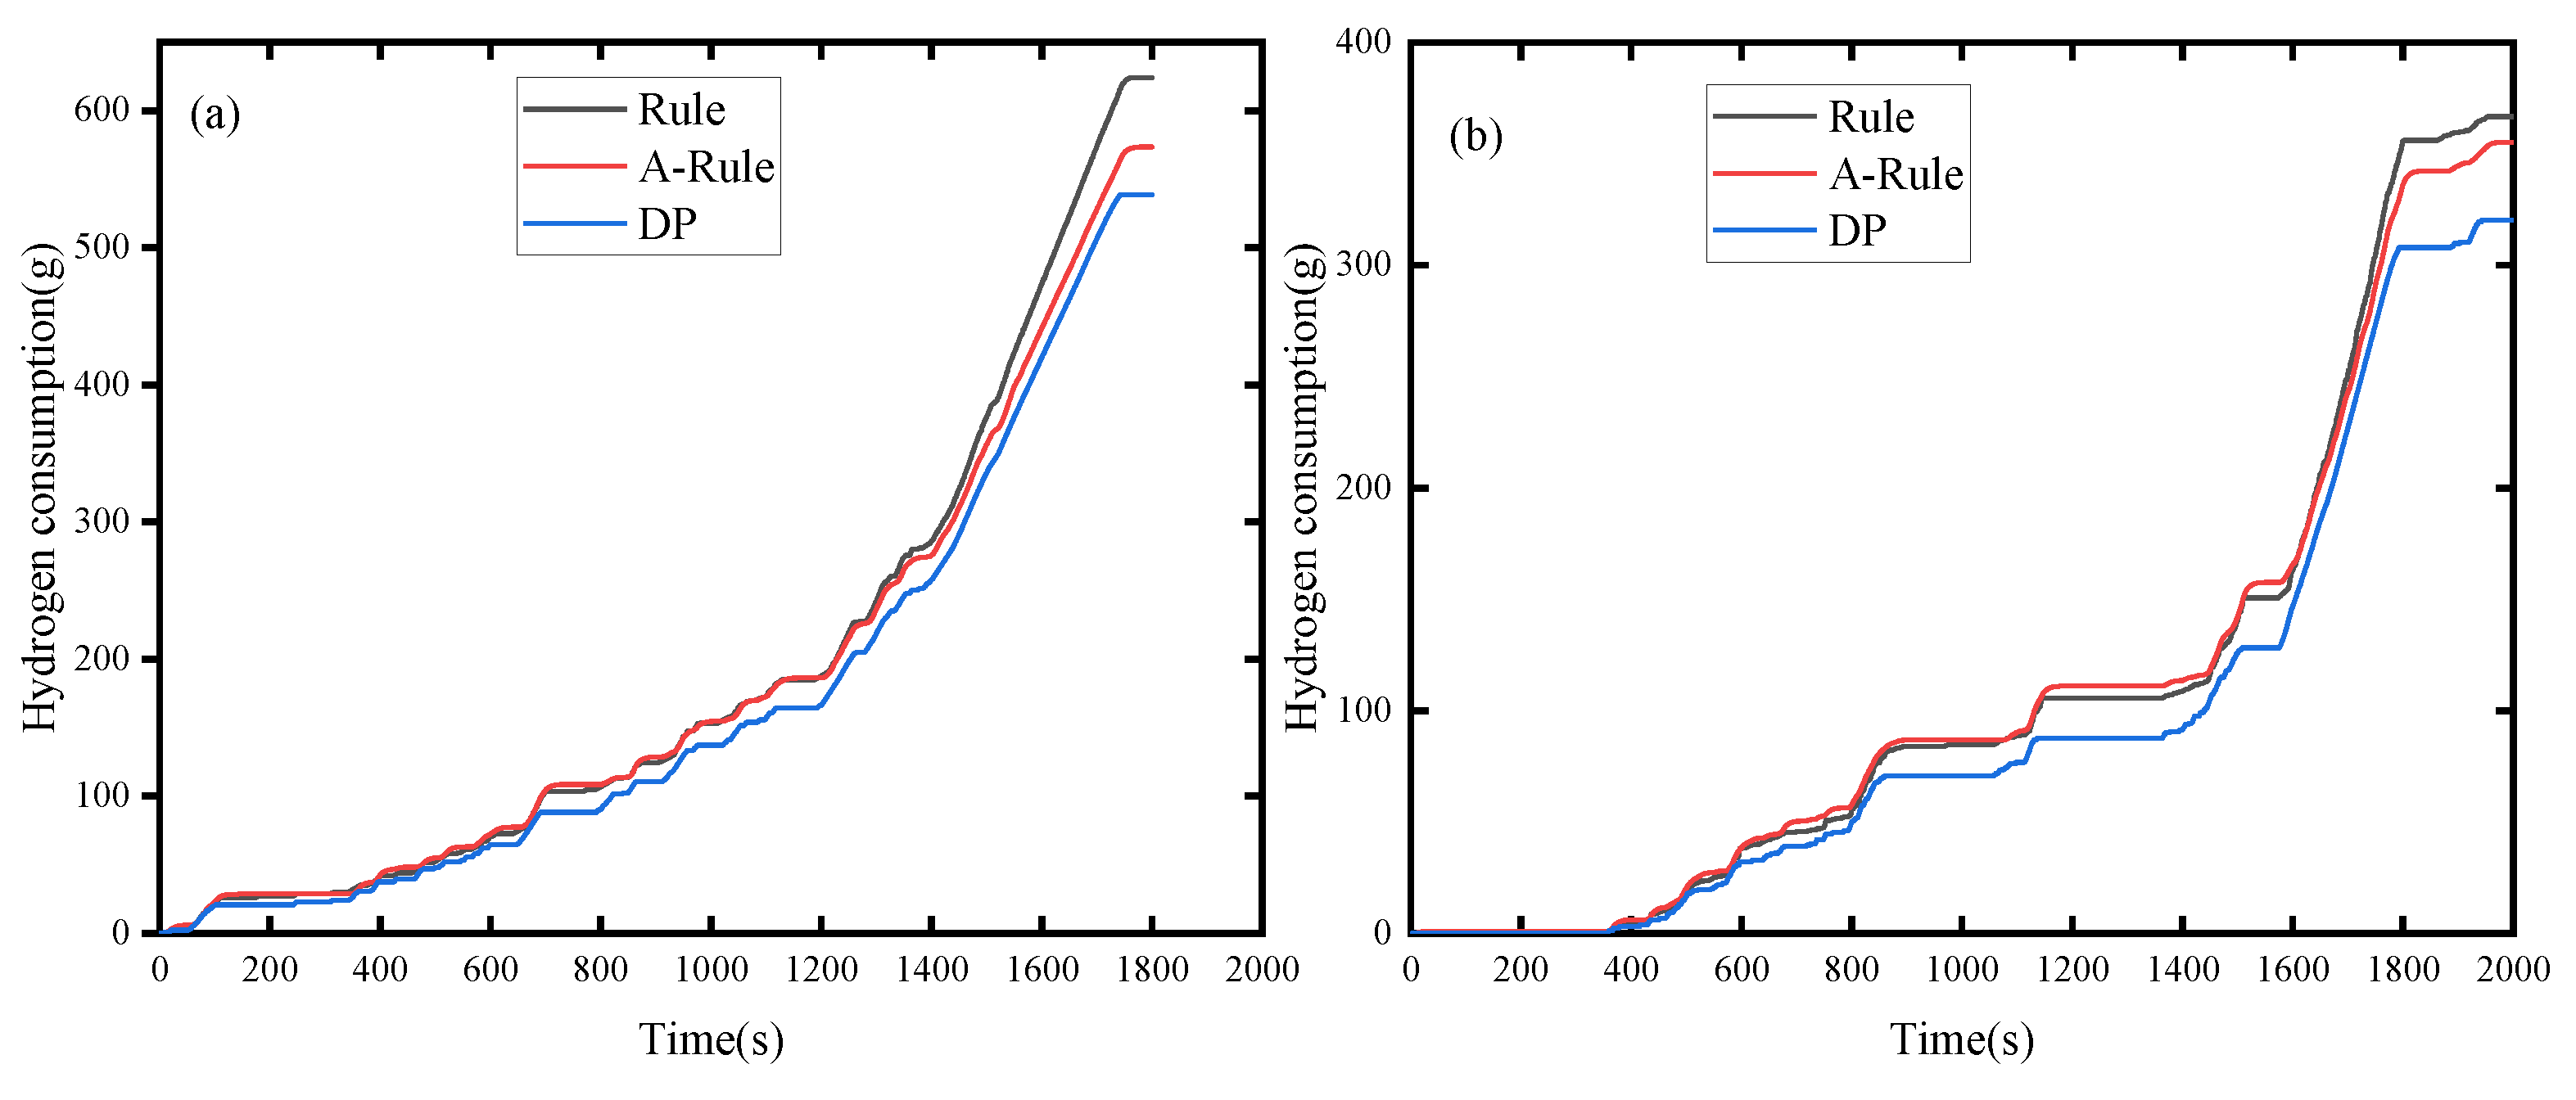
In order to investigate the impact of A-Rule on the vehicle’s economy, two strategies, designated as Rule and DP, are used for comparative analysis. The simulation results are shown in Figure 15 and Figure 16 and Table 6 and Table 7.
Figure 15 illustrates the variation in hydrogen consumption with time for each control strategy under WTVC and CDC. Figure 15 shows that the equivalent hydrogen consumption of the vehicle with DP is the lowest in the simulation test. This indicates that, under the same driving conditions, its energy consumption is the lowest and can reach the optimal state, followed by the hydrogen consumption of A-Rule, which is closer to that of DP, and that of Rule is the largest. Figure 16 presents the SOC versus time curves of each control strategy under WTVC and CDC. In Figure 16, the SOC of A-Rule is maintained within the limited interval, and the change trend is also close to DP, which verifies the effectiveness of its strategy.
The comparison of vehicle economy under WTVC and CDC with three control strategies is presented in Table 6 and Table 7, respectively. As can be seen from the tables, the equivalent hydrogen consumption of A-Rule is much closer to that of DP under both operating conditions. Specifically, the equivalent hydrogen consumption of A-Rule is 560.5958 g when the vehicle driving condition is WTVC, which is 7.04% less than that of Rule. Similarly, the equivalent hydrogen consumption of A-Rule is 341.2862 g when the vehicle driving condition is CDC, which is 4.76% less than Rule. In summary, under both conditions, the proposed strategy demonstrates a lower equivalent hydrogen consumption than Rule.

5. Conclusions

In this paper, key components of fuel cell hybrid commercial vehicles are first modeled, and nine typical working conditions of commercial vehicles are classified into three categories of low, medium and high speeds using PCA and K-means. Considering the time-domain and geographical nature of vehicle working conditions and the large influence of thresholds and weights in the BP recognizer, the weights and thresholds of the BP recognizer are optimized by using COA, which improves the total accuracy of the working condition recognition model by 7.31%.
Secondly, considering that Rule is commonly used in commercial vehicles in the current market, but Rule is greatly affected by the logic threshold value, which increases hydrogen consumption, in this paper, COA is used to optimize the logic threshold value of Rule under three categories of driving conditions, and obtain the optimal logic threshold value under each category of driving conditions. The vehicle identifies the categories of driving conditions in real time, and then tunes the optimal threshold value and adopts the sliding average filtering algorithm to filter the fuel cell output power in real time, reducing the fuel cell start/stop and realizing adaptive control, so as to obtain the optimal fuel cell power.
Finally, the established A-Rule control strategy, DP control strategy and Rule control strategy are compared and analyzed under WTVC as well as CDC in this paper. The findings show that there is little difference between the equivalent hydrogen consumption of A-Rule and DP. Compared with Rule, A-Rule decreases the equivalence hydrogen consumption in WTVC and CDC by 7.04% and 4.76%, respectively, and reduces the start/stop of the fuel cell. Overall, A-Rule can effectively improve the economy and enhance the overall performance of the vehicle. The research in this paper mainly considered the vehicle’s economy, and further HIL tests can be conducted in the future to validate the strategy and consider factors such as battery life to further improve the overall vehicle performance.

Author Contributions

Conceptualization, S.T., Z.P. and W.Z.; methodology, S.T. and W.Z.; software, W.Z. and S.T.; validation, S.T., Z.P. and W.Z.; investigation, W.Z.; data curation, Z.P. and W.Z.; writing—original draft preparation, S.T.; writing—review and editing, W.Z., S.T. and Z.P.; visualization, Z.P. and S.T.; project administration, W.Z. and Z.P. All authors have read and agreed to the published version of the manuscript.

Funding

This research was funded by the Central Guidance for Local Scientific and Technological Development Funds, grant number Guike ZY23055014; the Innovation-Driven Development Special Fund Project of Guangxi, grant number Guike AA22068060; the Science and Technology Planning Project of Liuzhou, grant number 2022AAA0102, 2022AAA0104; Guangxi Transportation Science and Technology Promotion Project, grant number GXJT-ZDSYS-2023-03-03.

Institutional Review Board Statement

Not applicable.

Informed Consent Statement

Not applicable.

Data Availability Statement

Data are available on reasonable demand from the corresponding author.

Conflicts of Interest

The authors declare no conflicts of interest.

Abbreviations

Abbreviated NameFull Name
EMSEnergy Management Strategy
DPDynamic Programming Strategy
PMPPontryagin’s Minimum Principle
ECMSEquivalent Fuel Consumption Minimization Strategy
BPBack Propagation
A-RuleAdaptive Rule-based Energy Management Strategy
PCAPrincipal Component Analysis
COACrayfish Optimization Algorithm
CDCCombined Driving Condition
RuleTraditional Rule-based Energy Management Strategy
PEMFCProton Exchange Membrane Fuel Cell

References

  1. Sun, C.; Negro, E.; Vezzù, K.; Pagot, G.; Cavinato, G.; Nale, A.; Bang, Y.H.; Di Noto, V. Hybrid inorganic-organic proton-conducting membranes based on SPEEK doped with WO3 nanoparticles for application in vanadium redox flow batteries. Electrochim. Acta 2019, 309, 311–325. [Google Scholar] [CrossRef]
  2. Shusheng, X.; Qiujie, S.; Baosheng, G.; Encong, Z.; Zhankuan, W. Research and development of on-board hydrogen-producing fuel cell vehicles. Int. J. Hydrogen Energy 2020, 45, 17844–17857. [Google Scholar] [CrossRef]
  3. Deng, K.; Liu, Y.; Hai, D.; Peng, H.; Löwenstein, L.; Pischinger, S.; Hameyer, K. Deep reinforcement learning based energy management strategy of fuel cell hybrid railway vehicles considering fuel cell aging. Energy Convers. Manag. 2022, 251, 115030. [Google Scholar] [CrossRef]
  4. Kasimalla, V.K.; Srinivasulu, N.G.; Velisala, V. A review on energy allocation of fuel cell/battery/ultracapacitor for hybrid electric vehicles. Int. J. Energy Res. 2018, 42, 4263–4283. [Google Scholar] [CrossRef]
  5. Guo, Z.; Sun, S.; Wang, Y.; Ni, J.; Qian, X. Impact of new energy vehicle development on china’s crude oil imports: An empirical analysis. World Electr. Veh. J. 2023, 14, 46. [Google Scholar] [CrossRef]
  6. Fathabadi, H. Combining a proton exchange membrane fuel cell (PEMFC) stack with a Li-ion battery to supply the power needs of a hybrid electric vehicle. Renew. Energy 2019, 130, 714–724. [Google Scholar] [CrossRef]
  7. Chi, Y.; Xu, W.; Xiao, M.; Wang, Z.; Zhang, X.; Chen, Y. Fuel-cycle based environmental and economic assessment of hydrogen fuel cell vehicles in China. Energy 2023, 282, 128773. [Google Scholar] [CrossRef]
  8. Kang, X.; Wang, Y.; Chen, Z. A reinforcement learning energy management strategy for fuel cell hybrid electric vehicles considering driving condition classification. Sustain. Energy Grids Netw. 2024, 38, 101298. [Google Scholar] [CrossRef]
  9. Jia, C.; Qiao, W.; Cui, J.; Qu, L. Adaptive model-predictive-control-based real-time energy management of fuel cell hybrid electric vehicles. IEEE Trans. Power Electron. 2022, 38, 2681–2694. [Google Scholar] [CrossRef]
  10. Anbarasu, A.; Dinh, T.Q.; Sengupta, S. Novel enhancement of energy management in fuel cell hybrid electric vehicle by an advanced dynamic model predictive control. Energy Convers. Manag. 2022, 267, 115883. [Google Scholar] [CrossRef]
  11. Olatomiwa, L.; Mekhilef, S.; Ismail, M.S.; Moghavvemi, M. Energy management strategies in hybrid renewable energy systems: A review. Renew. Sustain. Energy Rev. 2016, 62, 821–835. [Google Scholar] [CrossRef]
  12. Liu, T.; Hu, X.; Li, S.E.; Cao, D. Reinforcement learning optimized look-ahead energy management of a parallel hybrid electric vehicle. IEEE/ASME Trans. Mechatron. 2017, 22, 1497–1507. [Google Scholar] [CrossRef]
  13. Davis, K.; Hayes, J.G. Fuel cell vehicle energy management strategy based on the cost of ownership. IET Electr. Syst. Transp. 2019, 9, 226–236. [Google Scholar] [CrossRef]
  14. Li, S.; Chu, L.; Hu, J.; Pu, S.; Li, J.; Hou, Z.; Sun, W. A novel A-ECMS energy management strategy based on dragonfly algorithm for plug-in FCEVs. Sensors 2023, 23, 1192. [Google Scholar] [CrossRef] [PubMed]
  15. Guo, N.; Zhang, W.; Li, J.; Chen, Z.; Li, J.; Sun, C. Predictive energy management of fuel cell plug-in hybrid electric vehicles: A co-state boundaries-oriented PMP optimization approach. Appl. Energy 2024, 362, 122882. [Google Scholar] [CrossRef]
  16. Enang, W.; Bannister, C. Modelling and control of hybrid electric vehicles (A comprehensive review). Renew. Sustain. Energy Rev. 2017, 74, 1210–1239. [Google Scholar] [CrossRef]
  17. Du, G.; Zou, Y.; Zhang, X.; Liu, T.; Wu, J.; He, D. Deep reinforcement learning based energy management for a hybrid electric vehicle. Energy 2020, 201, 117591. [Google Scholar] [CrossRef]
  18. Xie, S.; Hu, X.; Qi, S.; Lang, K. An artificial neural network-enhanced energy management strategy for plug-in hybrid electric vehicles. Energy 2018, 163, 837–848. [Google Scholar] [CrossRef]
  19. Paganelli, G.; Delprat, S.; Guerra, T.-M.; Rimaux, J.; Santin, J.-J. Equivalent consumption minimization strategy for parallel hybrid powertrains. In Proceedings of the Vehicular Technology Conference, IEEE 55th Vehicular Technology Conference, VTC Spring 2002 (cat. No. 02CH37367), Birmingham, AL, USA, 6–9 May 2002; pp. 2076–2081. [Google Scholar]
  20. İnci, M.; Büyük, M.; Demir, M.H.; İlbey, G. A review and research on fuel cell electric vehicles: Topologies, power electronic converters, energy management methods, technical challenges, marketing and future aspects. Renew. Sustain. Energy Rev. 2021, 137, 110648. [Google Scholar] [CrossRef]
  21. Sorrentino, M.; Pianese, C.; Cilento, M. A specification independent control strategy for simultaneous optimization of fuel cell hybrid vehicles design and energy management. IFAC-PapersOnLine 2016, 49, 369–376. [Google Scholar] [CrossRef]
  22. Wang, Y.; Sun, Z.; Chen, Z. Development of energy management system based on a rule-based power distribution strategy for hybrid power sources. Energy 2019, 175, 1055–1066. [Google Scholar] [CrossRef]
  23. Geng, C.; Jin, X.; Zhang, X. Simulation research on a novel control strategy for fuel cell extended-range vehicles. Int. J. Hydrogen Energy 2019, 44, 408–420. [Google Scholar] [CrossRef]
  24. Hu, Z.; Xu, L.; Li, J.; Ouyang, M.; Song, Z.; Huang, H. A reconstructed fuel cell life-prediction model for a fuel cell hybrid city bus. Energy Convers. Manag. 2018, 156, 723–732. [Google Scholar] [CrossRef]
  25. Lü, X.; Wu, Y.; Lian, J.; Zhang, Y.; Chen, C.; Wang, P.; Meng, L. Energy management of hybrid electric vehicles: A review of energy optimization of fuel cell hybrid power system based on genetic algorithm. Energy Convers. Manag. 2020, 205, 112474. [Google Scholar] [CrossRef]
  26. Shi, J.; Xu, B.; Shen, Y.; Wu, J. Energy management strategy for battery/supercapacitor hybrid electric city bus based on driving pattern recognition. Energy 2022, 243, 122752. [Google Scholar] [CrossRef]
  27. Song, K.; Li, F.; Hu, X.; He, L.; Niu, W.; Lu, S.; Zhang, T. Multi-mode energy management strategy for fuel cell electric vehicles based on driving pattern identification using learning vector quantization neural network algorithm. J. Power Sources 2018, 389, 230–239. [Google Scholar] [CrossRef]
  28. Chen, Z.; Xiong, R.; Cao, J. Particle swarm optimization-based optimal power management of plug-in hybrid electric vehicles considering uncertain driving conditions. Energy 2016, 96, 197–208. [Google Scholar] [CrossRef]
  29. Wang, Y.; Zhang, Y.; Zhang, C.; Zhou, J.; Hu, D.; Yi, F.; Fan, Z.; Zeng, T. Genetic algorithm-based fuzzy optimization of energy management strategy for fuel cell vehicles considering driving cycles recognition. Energy 2023, 263, 126112. [Google Scholar] [CrossRef]
  30. Lei, Z.; Cheng, D.; Liu, Y.; Qin, D.; Zhang, Y.; Xie, Q. A dynamic control strategy for hybrid electric vehicles based on parameter optimization for multiple driving cycles and driving pattern recognition. Energies 2017, 10, 54. [Google Scholar] [CrossRef]
  31. Kandi Dayeni, M.; Soleymani, M. Intelligent energy management of a fuel cell vehicle based on traffic condition recognition. Clean Technol. Environ. Policy 2016, 18, 1945–1960. [Google Scholar] [CrossRef]
  32. Wang, Y.; Guo, Z.; Wu, J.; Fu, S. Research on vehicle adaptive cruise control based on BP neural network working condition recognition. J. Eng. 2022, 2022, 132–147. [Google Scholar] [CrossRef]
  33. Zhang, X.; Ma, H.; Wang, T.; Wu, M.; Wang, L. Energy Management Strategy for Fuel Cell Vehicle Based on Working Condition Identification. In Proceedings of the 2023 IEEE/IAS Industrial and Commercial Power System Asia (I&CPS Asia), Chongqing, China, 14–16 July 2023; pp. 1704–1709. [Google Scholar]
  34. Khan, M.; Iqbal, M. Modelling and analysis of electro-chemical, thermal, and reactant flow dynamics for a PEM fuel cell system. Fuel Cells 2005, 5, 463–475. [Google Scholar] [CrossRef]
  35. Pukrushpan, J.T.; Peng, H.; Stefanopoulou, A.G. Control-oriented modeling and analysis for automotive fuel cell systems. J. Dyn. Sys. Meas. Control 2004, 126, 14–25. [Google Scholar] [CrossRef]
  36. Shuai, Q.; Wang, Y.; Jiang, Z.; Hua, Q. Reinforcement Learning-Based Energy Management for Fuel Cell Electrical Vehicles Considering Fuel Cell Degradation. Energies 2024, 17, 1586. [Google Scholar] [CrossRef]
  37. Xu, L.; Ouyang, M.; Li, J.; Yang, F. Dynamic programming algorithm for minimizing operating cost of a PEM fuel cell vehicle. In Proceedings of the 2012 IEEE International Symposium on Industrial Electronics, Hangzhou, China, 28–31 May 2012; pp. 1490–1495. [Google Scholar]
  38. Duan, Z.-H.; Kou, S.-C.; Poon, C.-S. Prediction of compressive strength of recycled aggregate concrete using artificial neural networks. Constr. Build. Mater. 2013, 40, 1200–1206. [Google Scholar] [CrossRef]
  39. Yu, H.; Yin, A.; Xu, Z.; Zhang, J.; Wu, J.; Xu, X.; Zhang, Z. Grain size characterization of TA1 with GA-BP neural network using laser ultrasonics. Optik 2023, 275, 170600. [Google Scholar] [CrossRef]
  40. Jia, H.; Rao, H.; Wen, C.; Mirjalili, S. Crayfish optimization algorithm. Artif. Intell. Rev. 2023, 56, 1919–1979. [Google Scholar] [CrossRef]
  41. Mei, J.; Meng, X.; Tang, X.; Li, H.; Hasanien, H.M.; Alharbi, M.; Dong, Z.; Shen, J.; Sun, C.; Fan, F.; et al. An Accurate Parameter Estimation Method of the Voltage Model for Proton Exchange Membrane Fuel Cells. Energies 2024, 17, 2917. [Google Scholar] [CrossRef]
  42. Yang, J.; Huang, X.; Tan, Y.; He, X. Forecast of driving load of hybrid electric vehicles by using discrete cosine transform and support vector machine. In Proceedings of the 2008 IEEE International Joint Conference on Neural Networks (IEEE World Congress on Computational Intelligence), Hong Kong, China, 1–8 June 2008; pp. 2227–2234. [Google Scholar]
  43. Li, X.; Wang, Y.; Yang, D.; Chen, Z. Adaptive energy management strategy for fuel cell/battery hybrid vehicles using Pontryagin’s Minimal Principle. J. Power Sources 2019, 440, 227105. [Google Scholar] [CrossRef]
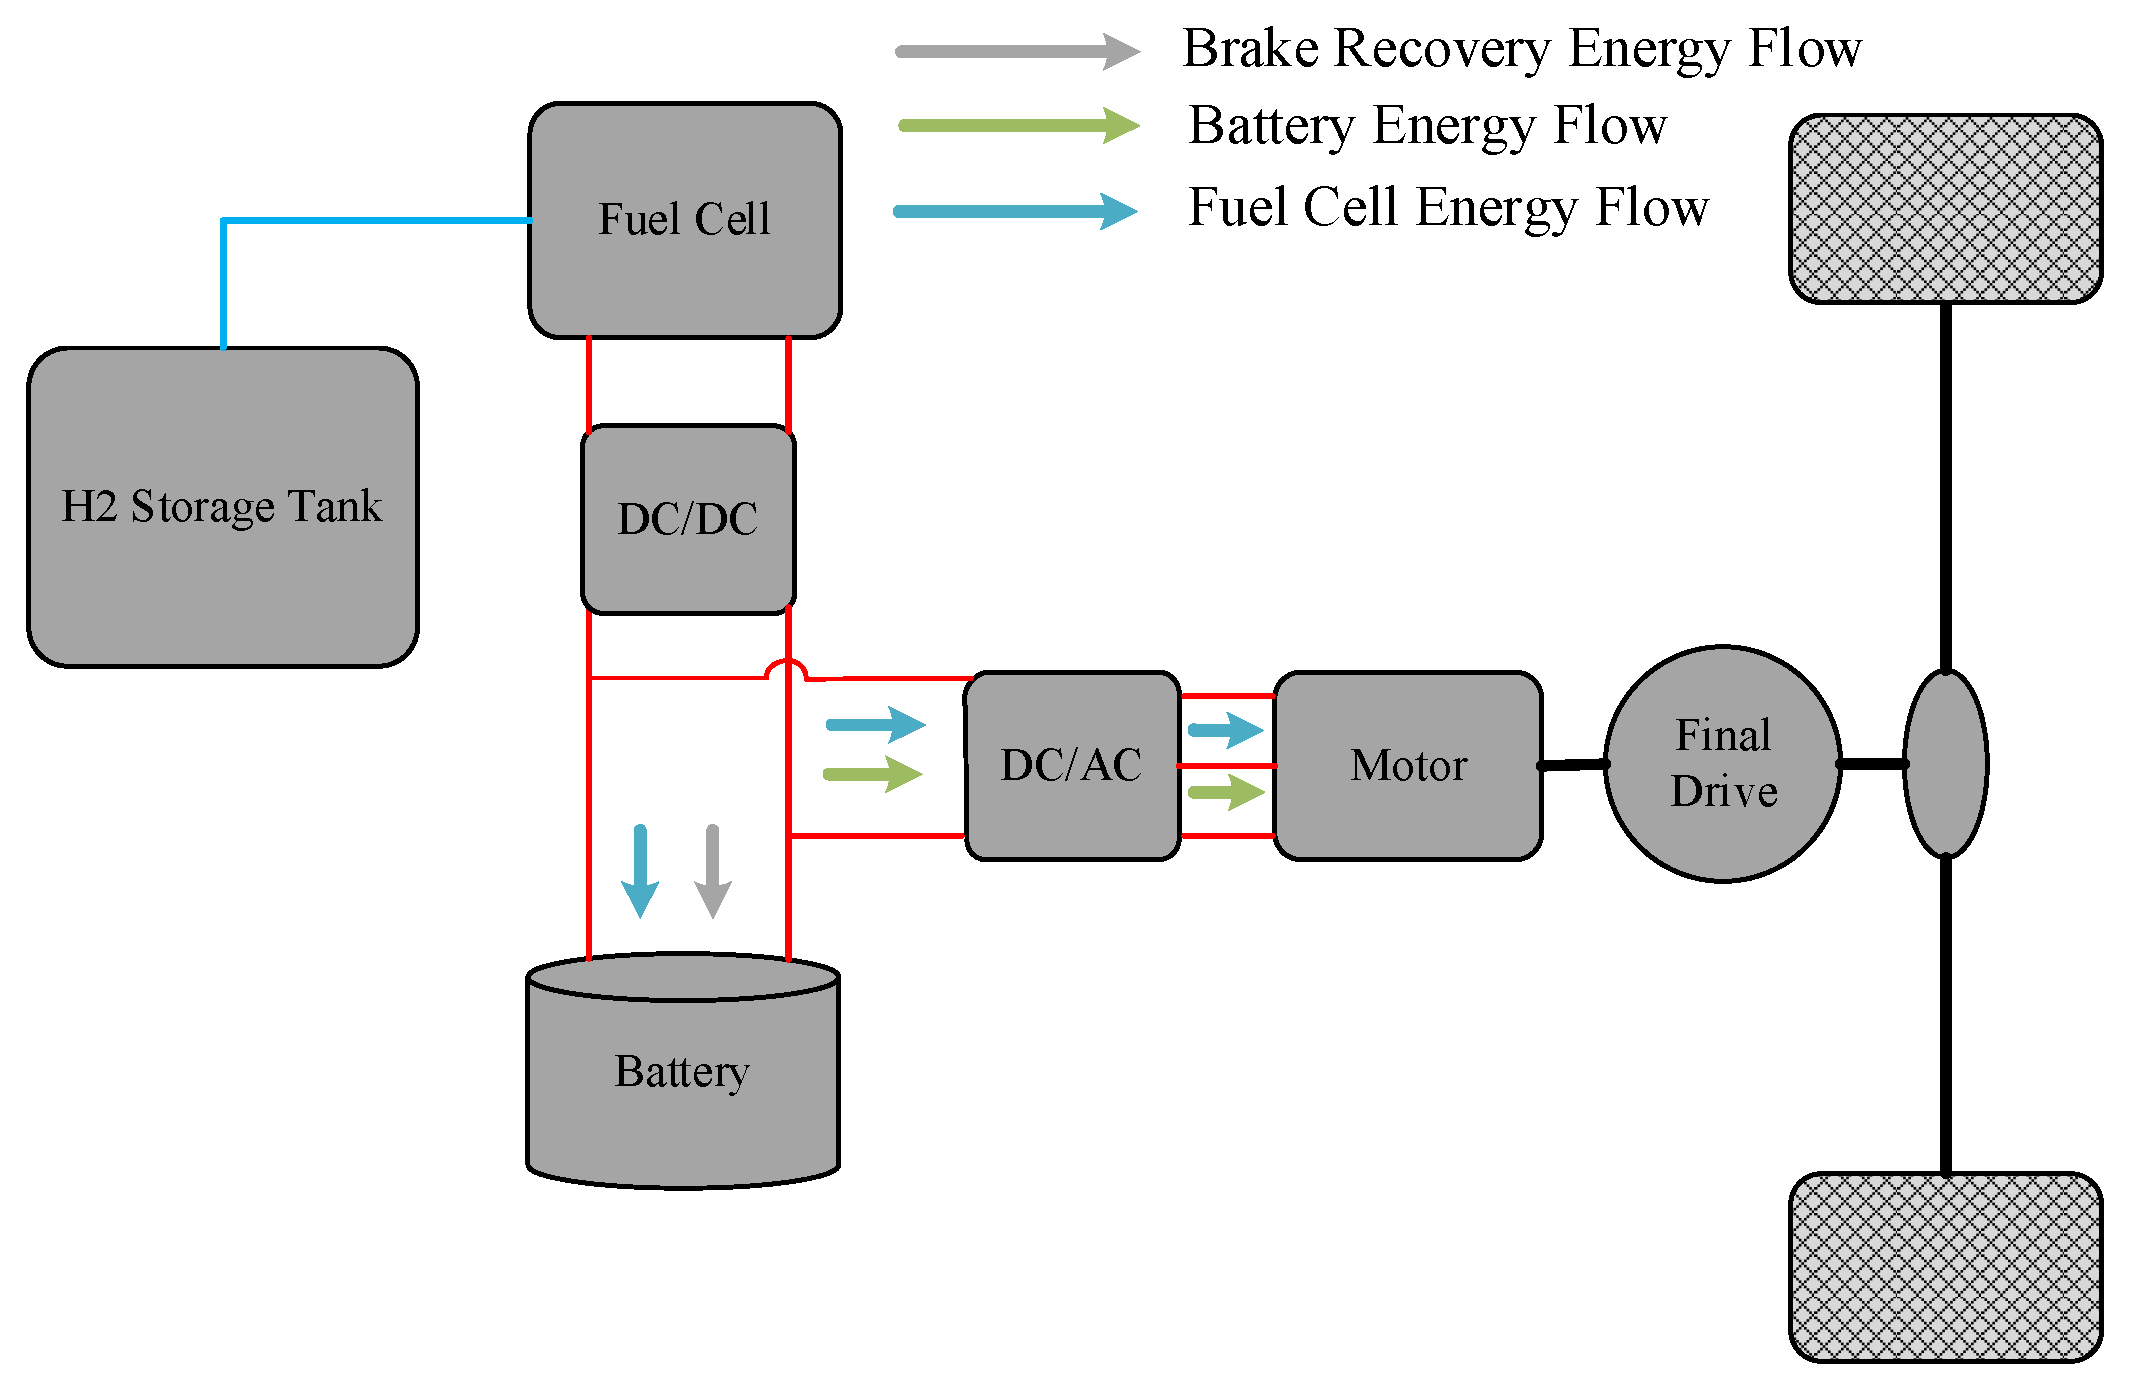
Figure 1. Structure of the fuel cell hybrid commercial vehicle: The red connection line represents electrical connection; the black connection line represents mechanical connection.
Sustainability 16 07356 g001
Figure 2. The drive motor efficiency map.
Sustainability 16 07356 g002
Figure 3. Efficiency and hydrogen consumption characteristic curves.
Sustainability 16 07356 g003
Figure 4. Equivalent circuit of the battery.
Sustainability 16 07356 g004
Figure 5. A framework for A-Rule: the green box represents the offline part; the red box represents the online part.
Sustainability 16 07356 g005
Figure 6. K-means clustering results:(a) Type I vehicle cycle conditions; (b) Type II vehicle cycle conditions; (c) Type III vehicle cycle conditions.
Sustainability 16 07356 g006
Figure 7. BP neural network structure.
Sustainability 16 07356 g007
Figure 8. Driving-pattern recognition effect: (a) Driving-pattern recognition effect of BP; (b) Driving-pattern recognition effect of COA-BP.
Sustainability 16 07356 g008
Figure 9. Total recognition accuracy: (a) Total recognition accuracy of BP; (b) Total recognition accuracy of COA-BP.
Sustainability 16 07356 g009
Figure 10. Structure of Rule.
Sustainability 16 07356 g010
Figure 11. Fuel cell efficiency interval node determination map.
Sustainability 16 07356 g011
Figure 12. Iterative diagrams for three types of working conditions: (a) Iterative results at low-speed conditions; (b) Iterative results for medium-speed conditions; (c) Iterative results at high-speed conditions.
Sustainability 16 07356 g012
Figure 13. Vehicle driving condition category identification results: (a) WTVC identification results; (b) CDC identification results.
Sustainability 16 07356 g013
Figure 14. Comparison of results before and after fuel cell power optimization: (a) Optimization results of fuel cell output power under WTVC; (b) Optimization results of fuel cell power output under CDC.
Sustainability 16 07356 g014
Figure 15. Hydrogen consumption curves under different strategies: (a) Hydrogen consumption curves for four strategies under WTVC; (b) Hydrogen consumption curves for four strategies under CDC.
Sustainability 16 07356 g015
Figure 16. SOC curves under different strategies: (a) SOC curves of different strategies under WTVC; (b) SOC curves of different strategies under CDC.
Sustainability 16 07356 g016
Table 1. Parameter of the full cell vehicle.
ParameterValueUnit
Vehicle total mass6000 k g
Wheel radius0.420 m
Rolling resistance coefficient0.013-
Aerodynamic drag coefficient0.625-
Vehicle frontal area6.685 m 2
Gravitational acceleration9.8 m / s 2
Table 2. Kinematic fragment characterization parameters.
NumberParameterUnit
1Maximum speed k m · h 1
2Average speed k m · h 1
3Average operating speed k m · h 1
4Operating ratio %
5Maximum acceleration m · s 2
6Average acceleration of the acceleration segment m · s 2
7Acceleration ratio %
8Maximum deceleration m · s 2
9Average deceleration speed of deceleration segment m · s 2
10Deceleration ratio %
Table 3. Characteristic root and cumulative contributions rate.
Principal ComponentCharacteristic RootCumulative Contributions Rate (%)
M14.43244.317
M23.01274.440
M31.55990.031
M40.52095.232
M50.23197.540
M60.13698.896
M70.04999.390
M80.03099.689
M90.02599.937
M100.006100
Table 4. COA-Rule process.
Optimization StepsConcrete Content
Step 1Initialize the population to obtain X G ,   X L ; define the temperature T e m p ; proceed to Step 2
Step 2Define the temperature T e m p and feeding amount p ; perform Step 3
Step 3Judge T e m p > 30   ° C , then carry out Step 4; on the contrary, carry out Step 5
Step 4Define the burrow location; determine r a n d > 0.5 for heat avoidance and vice versa for competition; proceed to Step 6
Step 5Calculate the food size Q and feeding amount p ; if Q > C 3 + 1 / 2 , chop and forage again; otherwise, forage directly; and finally perform Step 6
Step 6Update X G ,   X L ; perform Step 7
Step 7Determine whether the maximum number of iterations has been reached; if so, proceed to Step 8; otherwise, proceed to Step 2
Table 5. Optimization results table.
Working Condition CategoryType IType IIType III
S O C m i n 0.2000770.2422190.333029
S O C m a x 0.8314490.7573180.844596
P f c _ η l 37.30653337.37617837.489022
P f c _ η u 81.58208574.34000087.340141
Adaptation value47.503655487.6494012807.179853
Table 6. Economy of vehicles under WTVC with different strategies.
EMSRule A-Rule DP
Terminal value SOC0.60510.60700.6000
Hydrogen consumption (g)615.1087573.5216538.6627
Equivalent hydrogen consumption (g)603.0509560.5958538.6627
Table 7. Economy of vehicles under CDC with different strategies.
EMSRule A-Rule DP
Terminal value SOC0.60370.60830.6000
Hydrogen consumption (g)366.6733355.2492320.3836
Equivalent hydrogen consumption (g)358.3372341.2862320.3836
Disclaimer/Publisher’s Note: The statements, opinions and data contained in all publications are solely those of the individual author(s) and contributor(s) and not of MDPI and/or the editor(s). MDPI and/or the editor(s) disclaim responsibility for any injury to people or property resulting from any ideas, methods, instructions or products referred to in the content.