Article

Distribution of Carbon-Sequestering Microbes in Different Habitats and the Interaction with Habitat Factors in a Natural Karst Cave

1
College of Environmental Science and Engineering, Guilin University of Technology, Guilin 541004, China
2
Guangxi Key Laboratory of Environmental Pollution Control Theory and Technology, Guilin University of Technology, Guilin 541004, China
3
College of Natural Resources and Environment, Northwest A&F University, Xianyang 712100, China
4
College of Materials Science and Engineering, Guilin University of Technology, Guilin 541004, China
*
Author to whom correspondence should be addressed.
Sustainability 2024, 16(17), 7357; https://doi.org/10.3390/su16177357
Submission received: 24 July 2024 / Revised: 21 August 2024 / Accepted: 23 August 2024 / Published: 27 August 2024

Abstract

:
The distributional characteristics of microorganisms in karst cave ecosystems have been widely studied. However, in such a dark, humid, and oligotrophic habitat, studies on the differences in carbon-sequestering bacteria in multiple habitats are limited. Therefore, to learn the distribution characteristics of carbon-sequestering colonies in cave habitats and their correlation with habitat factors (e.g., pH, Ca2+, Mg2+, etc.), samples from five cave habitats (weathered rock walls, underground river water, drips, sediments, and air) were collected from the twilight and dark zones of Shiziyan Cave (CO2 concentration 5385 ppm). The results of high-throughput sequencing and statistical analyses showed that there were significant differences in the distribution of communities in different habitats, with higher abundance in sediments habitat and underground river water habitat, and the dominant phyla of Pseudomonadota (30.53%) and Cyanobacteria (75.11%) in these two habitats. The microbial diversity of the carbon-sequestering microbial community was higher in sediments than in underground river water. The pH, and Ca2+, SO 4 2 , and NO 3 concentrations can alter the diversity of carbon-sequestering microbes, thereby affecting carbon cycling in caves. Carbon metabolism analyses suggest that microbes in the habitat can cooperate and coexist by participating in different carbon metabolic pathways. These results expanded our understanding of carbon-sequestering microbial communities in cave systems and their responses to the environment.

1. Introduction

Karst caves are an important component of terrestrial ecosystems, where it has been reported that the lithosphere stores 99.9% of the global carbon on Earth, and carbonate rocks in the geologic crust store 90% of the global carbon stock [1]. The unique terrestrial caves of karst respond to changes in external environmental conditions, thus making karst caves a strategic area for the study of climate change and carbon fluxes [2].
Despite that, karst caves are often regarded as an extremely nutrient-poor ecosystem; they contain relatively rich microbial communities [3]. Bacteria, Archaea, and fungi, as major contributors to the biodiversity in karst cave systems, are widely distributed in various habitats of karst cave systems, such as cave water [4], soil [5], weathered rock walls [6], sediment [7], and bat guano [8]. Some researchers have revealed that microbes can participate in the carbon cycle in karst caves; for example, Bauermeister et al. [9] found that the dominant species Acidithiobacillus thiooxidans is associated with sulfur oxidation and carbon dioxide fixation in Fraser’s Cave. The involvement of bacterial genes in carbon degradation, carbon fixation, and methane metabolism in five caves in Mizoram, northeastern India, was studied [10]. These microorganisms promote the biological weathering of carbonate minerals or accelerate the production of calcium carbonate by participating in the cycling of elements within ecosystems [11].
However, the current reports on the carbon-sequestering microbes in karst cave areas are inadequate, and the distribution characteristics of the carbon-sequestering microbial communities and the relationships with habitat factors in a natural karst cave are indistinct. Therefore, to reveal the distribution of carbon-sequestering microbial communities and their response to habitat factors in karst caves, samples were collected from a natural karst cave, Shiziyan Cave, located in Guilin Huixian Karst National Wetland Park, across five different habitats. Here, we aim to (1) determine the carbon-sequestering microbial community structure in different habitats (cave underground river water and sediments), (2) analyze the correlation between the carbon-sequestering microbes and habitat factors, and (3) reveal the interaction between carbon-sequestering microbial communities and habitat factors in a natural karst cave.

2. Materials and Methods

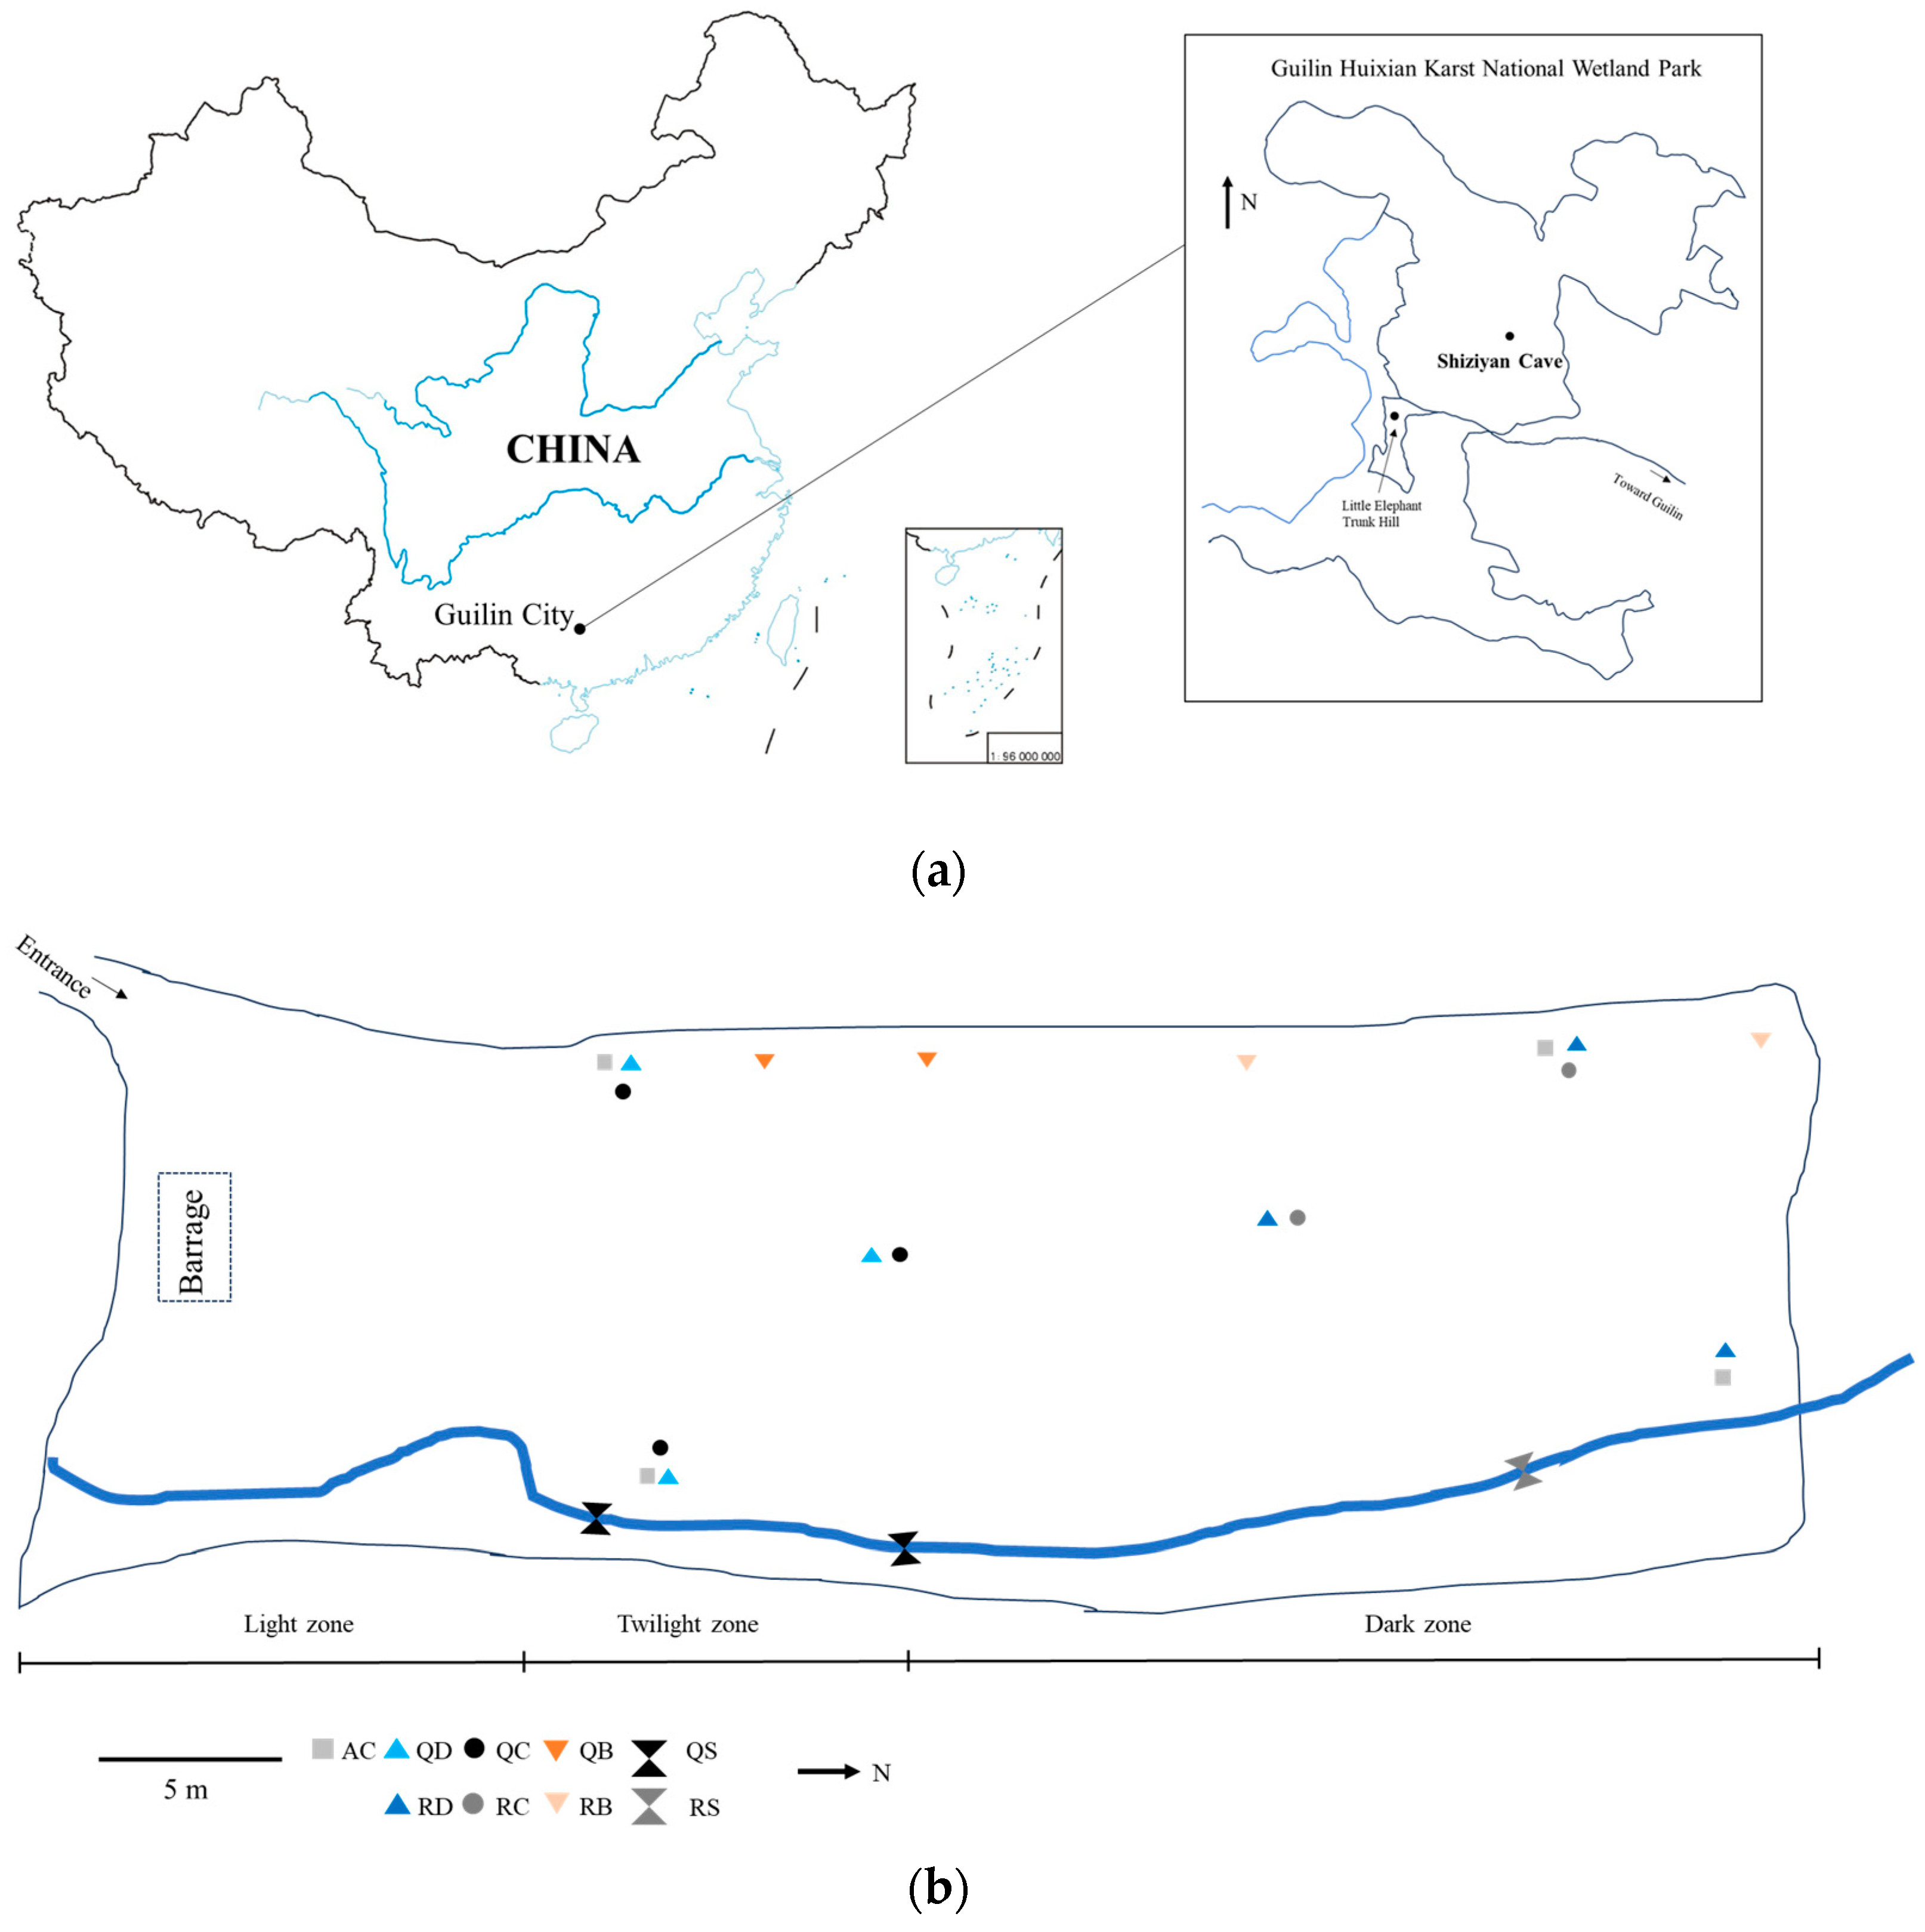
2.1. Study Area and Sampling

The Shiziyan Cave (25°4′39″ N, 110°14′7″ E) (Figure 1), located in the eastern part of Huixian Wetland, Guilin, Guangxi, China, is an area dominated by a subtropical monsoon climate and affected by the East Asian monsoon. The average annual precipitation is 1863 mm, the atmospheric rainfall is its main source of recharge, and the type of underground river water is dominated by fissure cave water, supplemented by bedrock fissure water. The soil layers are mainly Quaternary red clay and sandy clay [12]. The study was conducted in May 2023, and the basic characteristics of Shiziyan Cave were as follows: CO2 concentration: 5385 ppm (collected in the cave via using 500 mL gas bags and then measured by gas phase chromatography); temperature: 23.8 °C (outside the cave: 27.1 °C); and humidity: more than 92.9% RH. At present, the Shiziyan Cave has not been developed for tourism, with fewer human activities, representing a karst cave ecosystem in a more primitive and natural state.
Depending on the distribution of habitats within the cave, different numbers of samples were collected from each of the five habitats as follows: weathered rock wall (FHYB), sediments (CJW), drips (DXDS), underground river water (DXHS), and air (AC). The sampling sites are shown in Table 1. Among them, the drip samples were gathered in sterile plastic bottles, lubricated three times before collection, brought back to the laboratory, and filtered through 0.2 μm microporous filter membranes in an ultra-clean bench. Then, the membranes were stored in 50 mL sterile centrifuge tubes in the refrigerator (−20 Celsius degrees) until further use. The pretreatment methods of underground river water samples are the same as for the drip samples. Four cave air samples were collected by using the Anderson FA-1 six-stage sieve air microbial sampler (Qingdao Juchuang Environmental Protection Co., Ltd., Qingdao, China) at 1.5 m from the ground for 30 min by using the sterile ultrafine glass fiber filter membrane that had been dried after sterilizing, each of which collected 849 L of air (flow rate: 28.3 L/min). Then, the filter membranes were stored in 50 mL sterile centrifuge tubes and placed in an insulated box. All samples were carried back to the laboratory in 7 h.

2.2. Carbon-Free Inorganic Medium Composition

For the samples collected from the five habitats, we carried out cultivation of the carbon-sequestering strains with two inorganic media without an external carbon source [13,14], and its composition is as follows: (1) MnSO4 0.02 g, Na2HPO4 1 g, KH2PO4 1.8 g, MgSO4 0.4 g, CaCl2 0.05 g, NaCl 1 g, NH4Cl 0.5 g, FeCl3 0.02 g, and Na2S2O3 10 g, and distilled water was added to 1000 mL and sterilized at 121 °C for 20 min. (2) MnSO4 1 g, Na2HPO4 0.5 g, KH2PO4 0.5 g, MgSO4 1 g, CaCl2 0.2 g, NaHCO3 1 g, NH4Cl 0.5 g, KNO3 1 g, and NaCl 0.4 g, 2 mL of the trace elements solution, and distilled water was added to 1000 mL and sterilized at 121 °C for 20 min. In this case, the trace elements solution was formulated as follows: FeCl3 0.3 g, FeSO4·7H2O 0.3 g, MnSO4·H2O 0.15 g, ZnSO4 0.14 g, and CoCl2 0.2 g volumes to 1000 mL, which was filtered and sterilized for further use.

2.3. Physicochemical Analysis

A determination of the physical and chemical parameters of the samples is as follows: After freeze-drying for 24 h to remove water, each solid sample was taken in 5 g quantities and added to 25 mL of deionized water, placed in an incubator and shaken for 30 min, and centrifuged for 10 min at 12,000 rpm. Then, the supernatant was filtered through a 0.45 μm membrane; the sample solution was taken to determine the pH value by using a pH meter (FE28-Bio, METTLER TOLEDO Technology (China) Co., Shanghai, China), the anions ( NO 3 , Cl and SO 4 2 ) by ion chromatography (ICS-2100, Thermo Fisher Scientific, Waltham, MA, USA), and the cations (K+, Na+, Ca2+ and Mg2+) by ICP-OES (Optima 7000DV, PerkinElmer, Waltham, MA, USA), respectively. Moreover, the total organic carbon and total inorganic carbon of the samples were determined by the total organic carbon analyzer (Multi N/C 3100, Analytik Jena, Jena, German).

2.4. Isolation, Purification, and Screening of Carbon-Sequestering Strains

To obtain pure carbon-sequestering strains, we employed 10 g of the sample (solid and liquid) into a triangular flask containing 90 mL of sterile water, mixed it thoroughly, and placed it in a 30 °C 150 r/min shaker for about 20 min to make a suspension, and then we performed gradient dilution. The process was operated on a clean bench. We selected the 10−1–10−5 dilution concentration, took 100 μL of the dilution, added it to two solid media without a carbon source, cultured it at 28 °C for 7–10 d, picked a single colony to label, separated and cultivated it 3–5 times, and obtained pure carbon-sequestering colonies to store at 4 °C [15]. The air samples were collected by putting the two media into an Anderson FA-1 six-stage sieve air microbial sampler, setting the flow rate to 20 L/min and the collection time to 10 min for each medium, and were cultivated as above. The fast-growing strains were screened for strain identification.

2.5. DNA Extraction and Sequencing

2.5.1. Sequencing of Microbial Communities

The Zymo Research Biomics DNA Microprep Kit was used for the DNA extracted following the manufacturer’s instructions. The V4 region of the 16S rRNA gene was amplified with 515F (5′-GTGYCAGCMGCCGCGGTAA-3′) and 806R (5′-GGACTACHVGGGTWTCTAAT-3′). High-throughput sequencing was performed using Illumina PE250 sequencing (Chengdu Ronin Biotechnology Co., Ltd., Chengdu, China). Raw sequence reads were deposited in the NCBI SRA (Sequence Read Archive) database with the number PRJNA1096995.

2.5.2. Sequencing of cbbL-Related Carbon-Sequestering Microbes

DNA was extracted from the samples using the E.Z.N.A Mag-Bind Soil DNA Kit. PCR amplification was performed using the cbbL gene K2f (ACCAYCAAGCCSAAGCTSGG) and V2r (GCCTTCSAGCTTGCCSACCRC) for amplification [16]. Tests were performed using the Illumina MiSeq platform (Shanghai Sangon Bioengineering Co., Ltd., Shanghai, China). Raw sequence reads were deposited in the NCBI SRA database with the number PRJNA1097058.

2.6. Carbon-Sequestering Strains Identification

The upper primer was 27F, 5′-AGAGTTTGATCCTGGCTCAG-3′, and the lower primer was 1492R, 5′-GGTTACCTTGTTACGACTT-3′. PCR amplification was performed in a 50 μL reaction containing 2 μL of DNA template, 2.5 μL of upper primer, 2.5 μL of lower primer, 25 μL of 2×PCR Bestaq MasterMix, and 18 μL of ddH2O. The following PCR program 16S rDNA gene abundance was used: a pre-denaturation at 95 °C for 5 min; 30 cycles of denaturation at 94 °C for 45 s; annealing at 55 °C for 45 s; extension at 72 °C for 45 s; and a final extension at 72 °C for 1 min.

2.7. Bioinformatics and Statistical Analysis

The raw data reads (PRJNA1096995 and PRJNA1097058) used PEAR to merge the pairs of reads into a single sequence based on the overlapping relationship between the PE reads and the correct sequence orientation. Moreover, we removed the bases with a quality value of 20 or less at the end of the reads by RINSEQ and filtered out low-complexity sequences by setting a 10 bp window. Finally, the sequences were clustered into OTUs with a similarity of 97% using the Usearch (version 11.0.667) and were identified.
Microbial communities were analyzed by R language to carry out various data transformations and graphing with the ggplot2 package, and the alpha diversity indices were calculated by the Vegan package. Simultaneously, the differences in microbial abundance across habitats were analyzed using one-way ANOVA by SPSS 22.0 software, Beta diversity analysis by the GUniFrac package (version 1.7) was used to calculate the Unifrac distances, PCoA analysis by the Ape package, and Cluster analysis by the Hclust function of the Stas package. Finally, the interaction between the physicochemical factors and high abundance species was analyzed using the Pearson’s rank correlation method to obtain the correlation and its significance and was used in conjunction with the physicochemical data, which was performed using the RDA method from the Vegan package.

3. Results

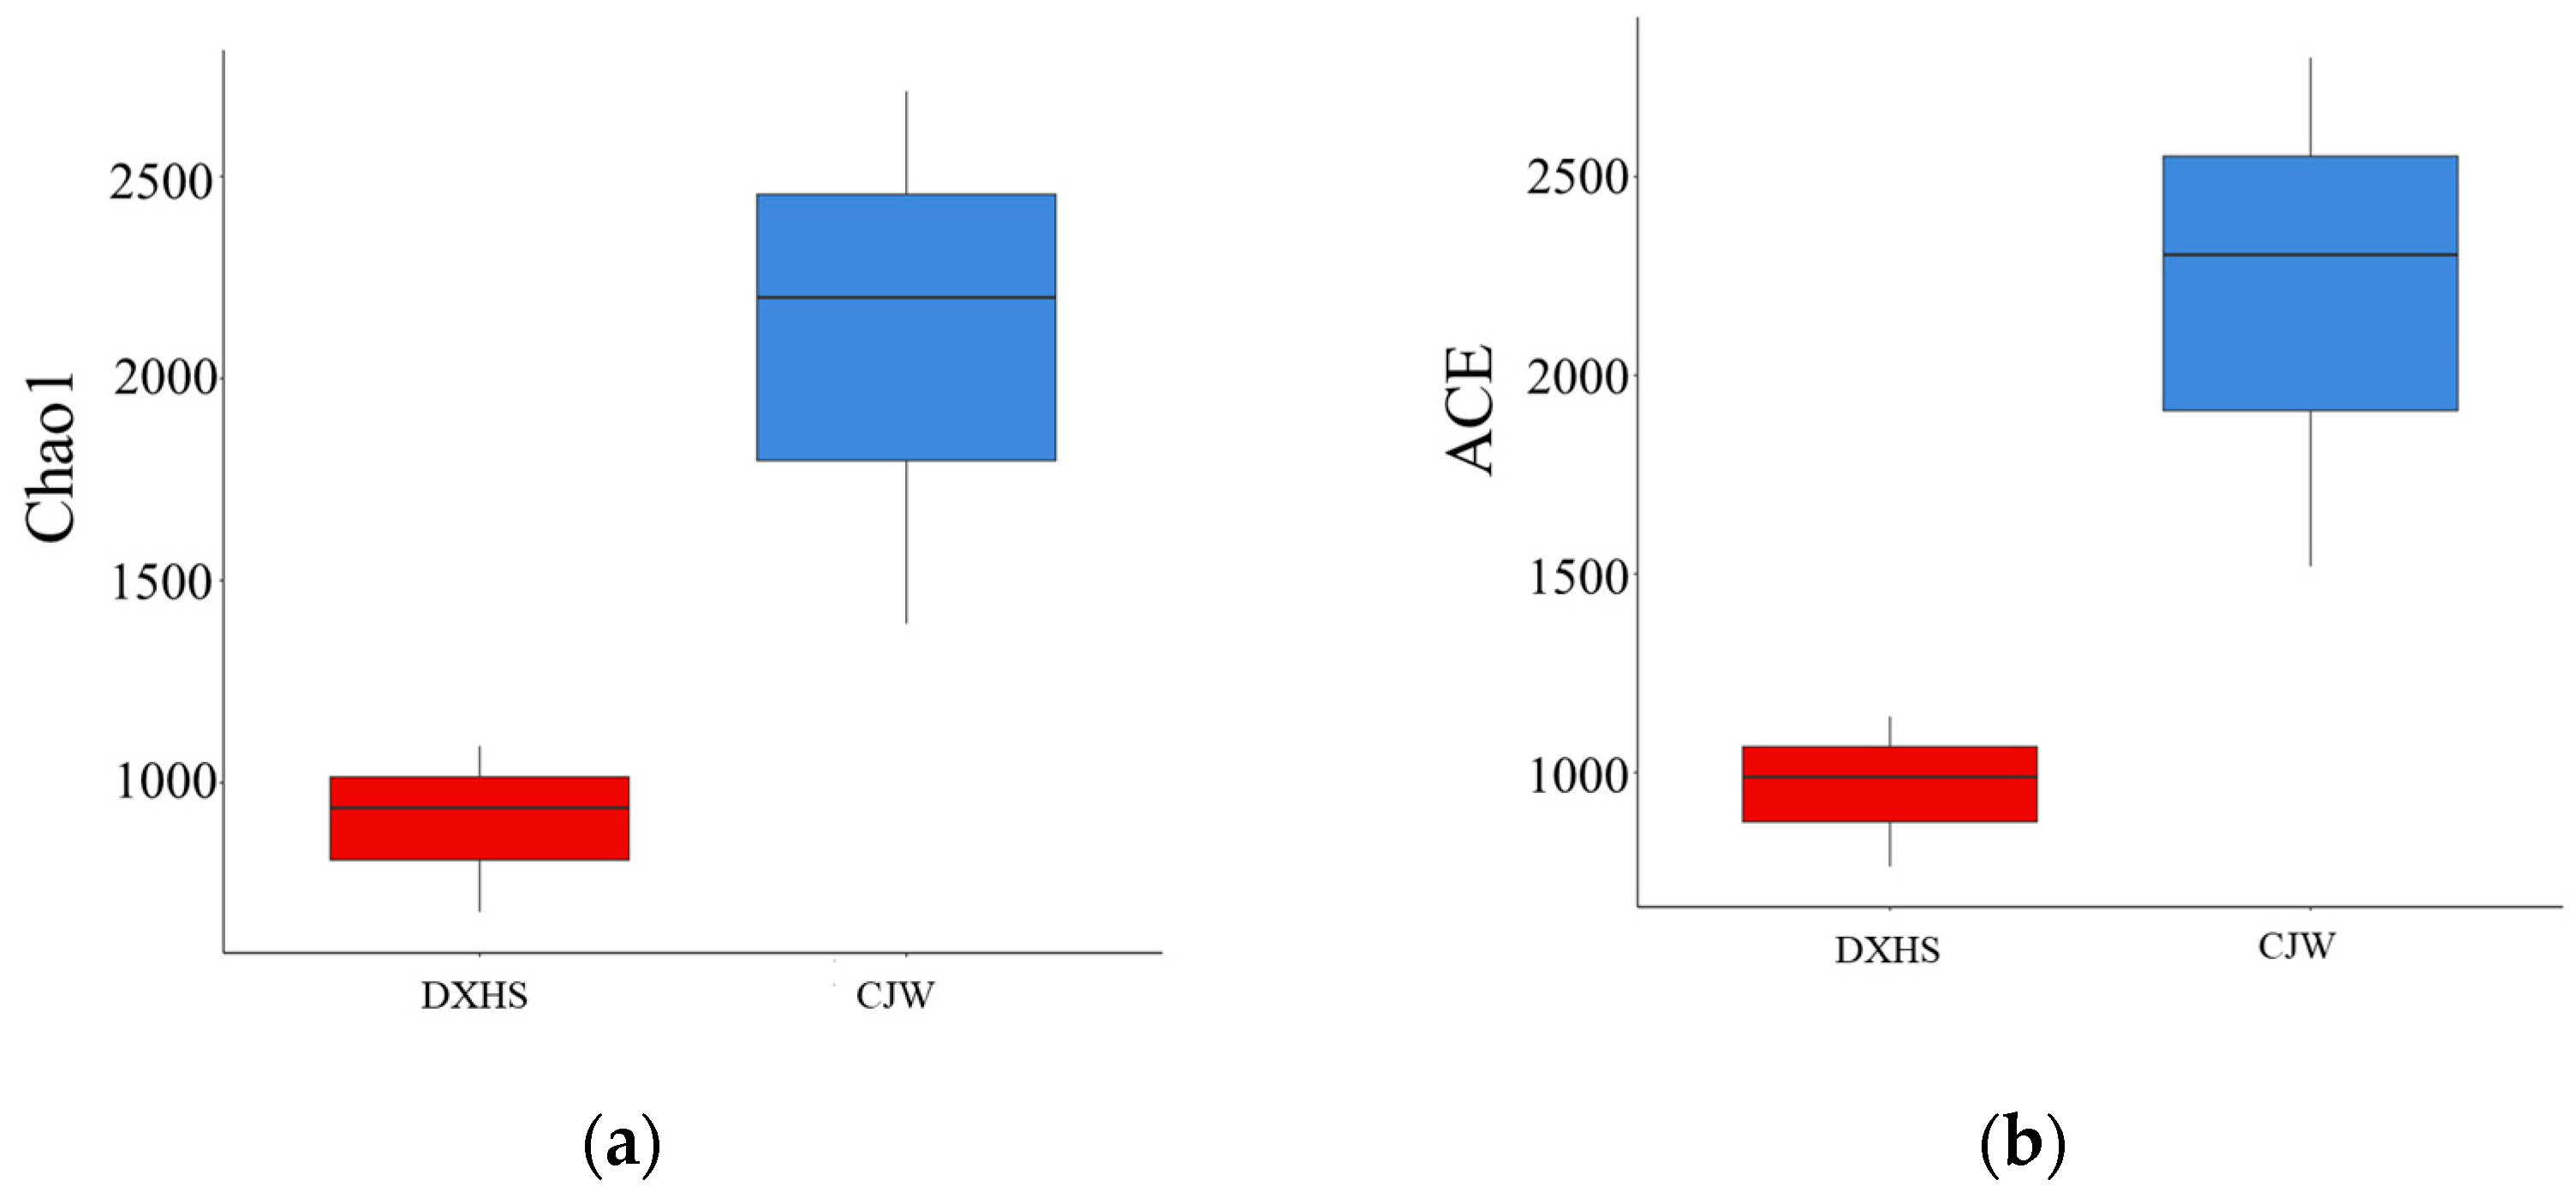
3.1. Physicochemical Characteristics of Different Habitats in Shiziyan Cave

The details of the cave samples from each habitat are shown in Table 2. All samples were weakly alkaline, with pH values ranging from 7.15 to 7.67. The sediment samples (CJW) had a significantly higher total organic carbon (TOC) concentration than the underground river water samples (DXHS), and the total inorganic carbon (TIC) concentration trends were approximately the same as the TOC concentration. As shown in the table, although the TOC content of Shiziyan Cave is slightly higher, it is similar to that found in other local caves in Guangxi, such as Xincuntun Cave [17] and Luohandu Cave [18]. On the other hand, the Ca2+ concentration showed the greatest variation (5.82–53.10 mg/L) in the DXHS, with a difference of about 9.12 times between the maximum and minimum values. Higher concentrations of Mg2+ and NO 3 were observed in CJW.

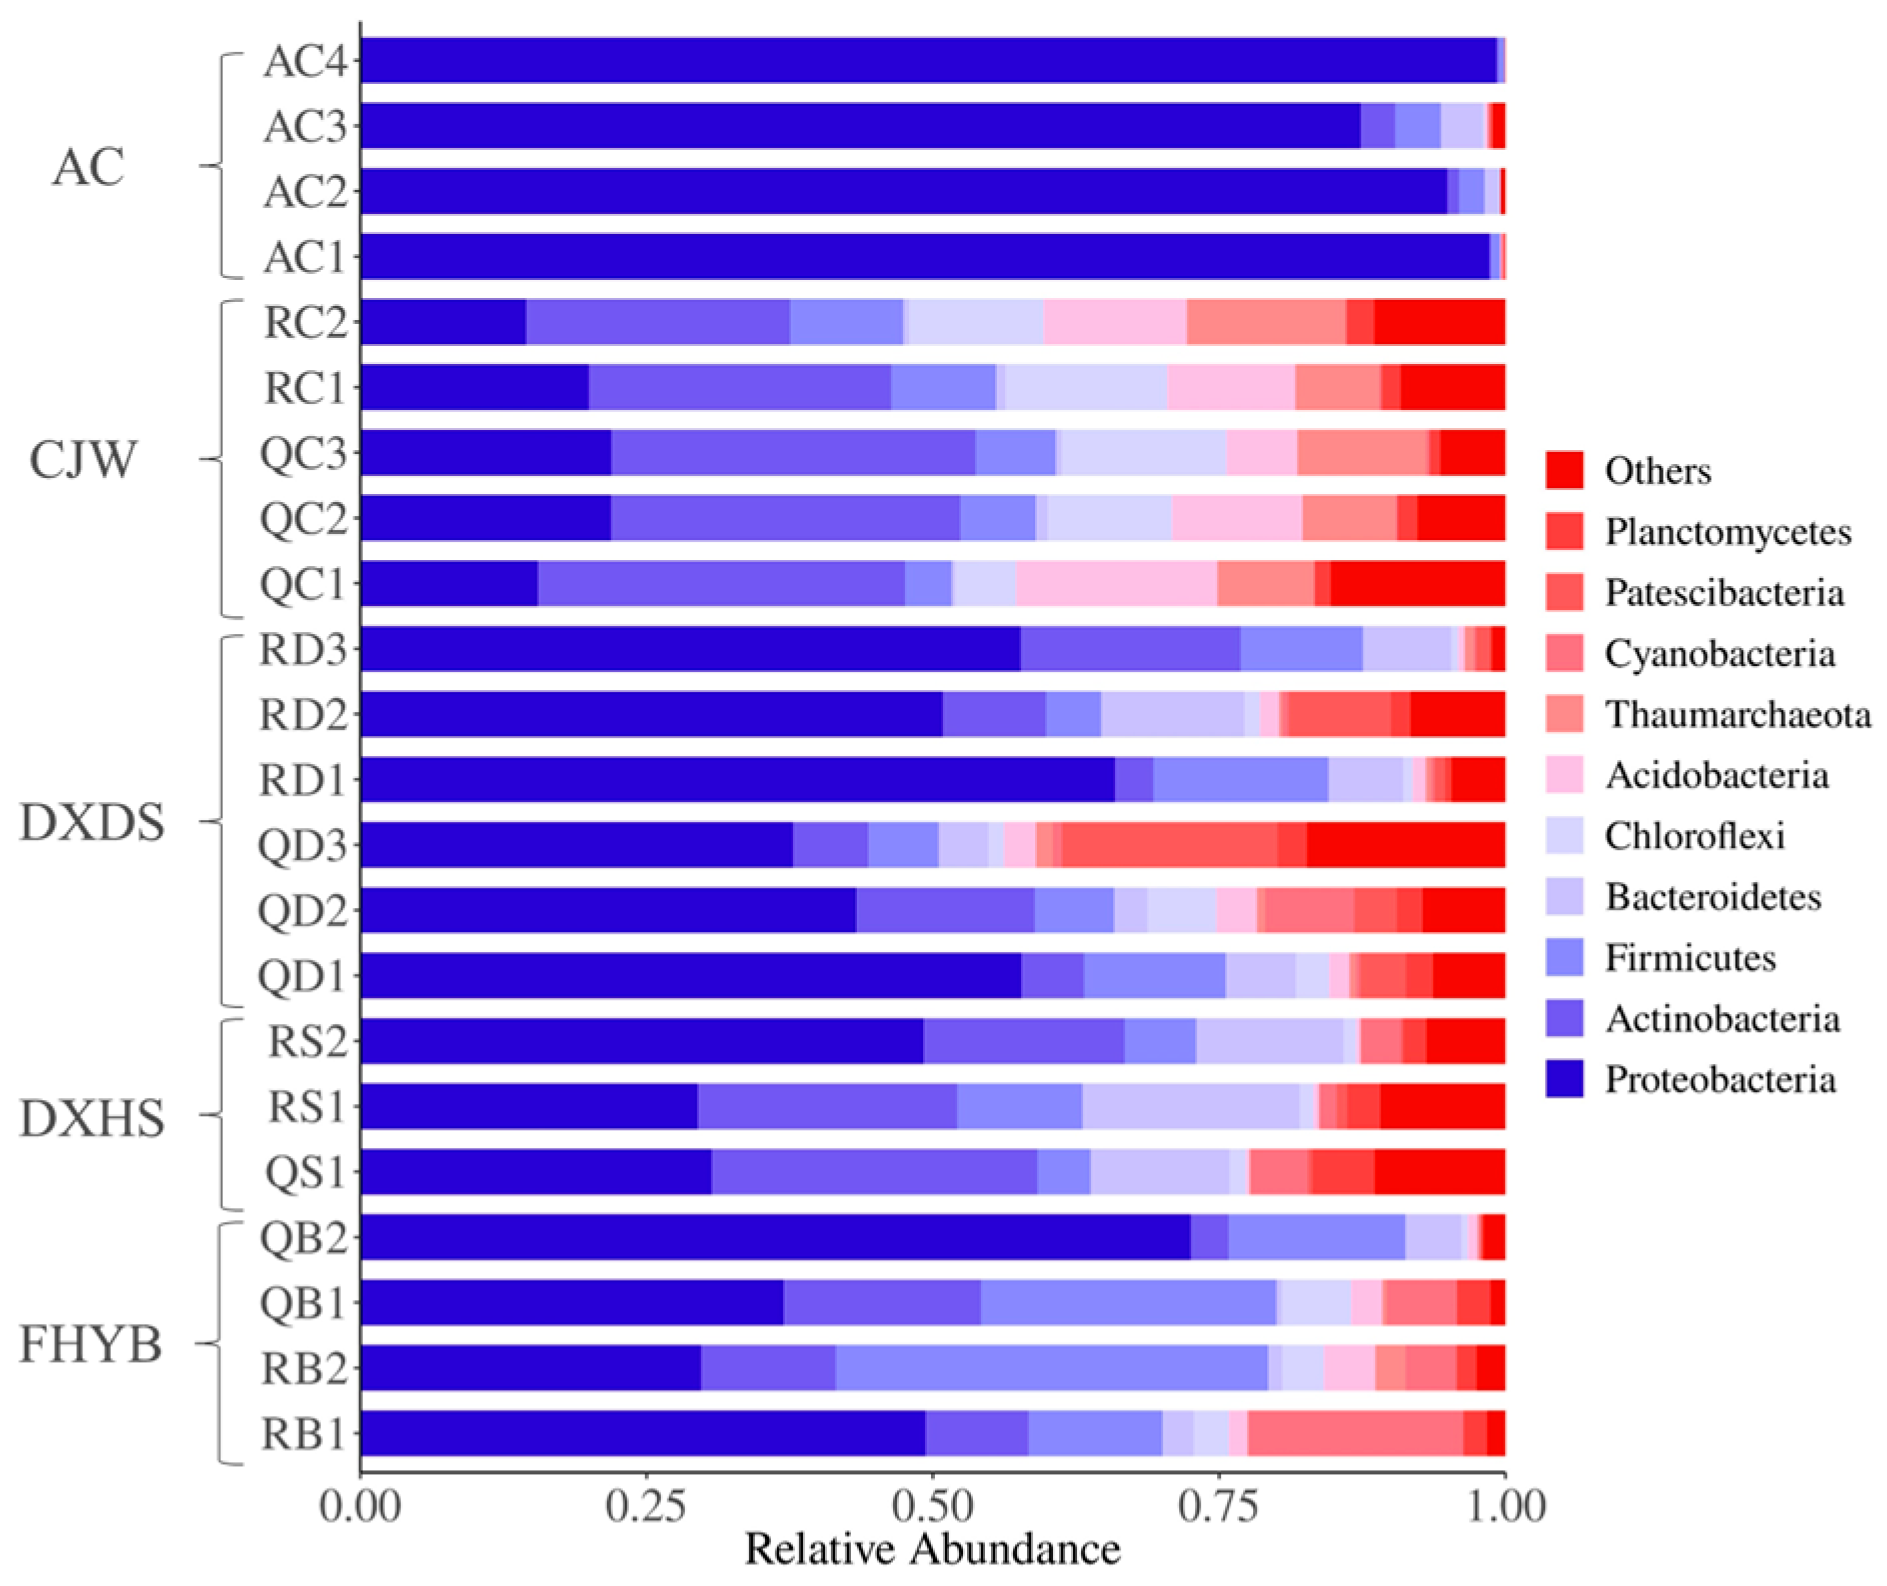
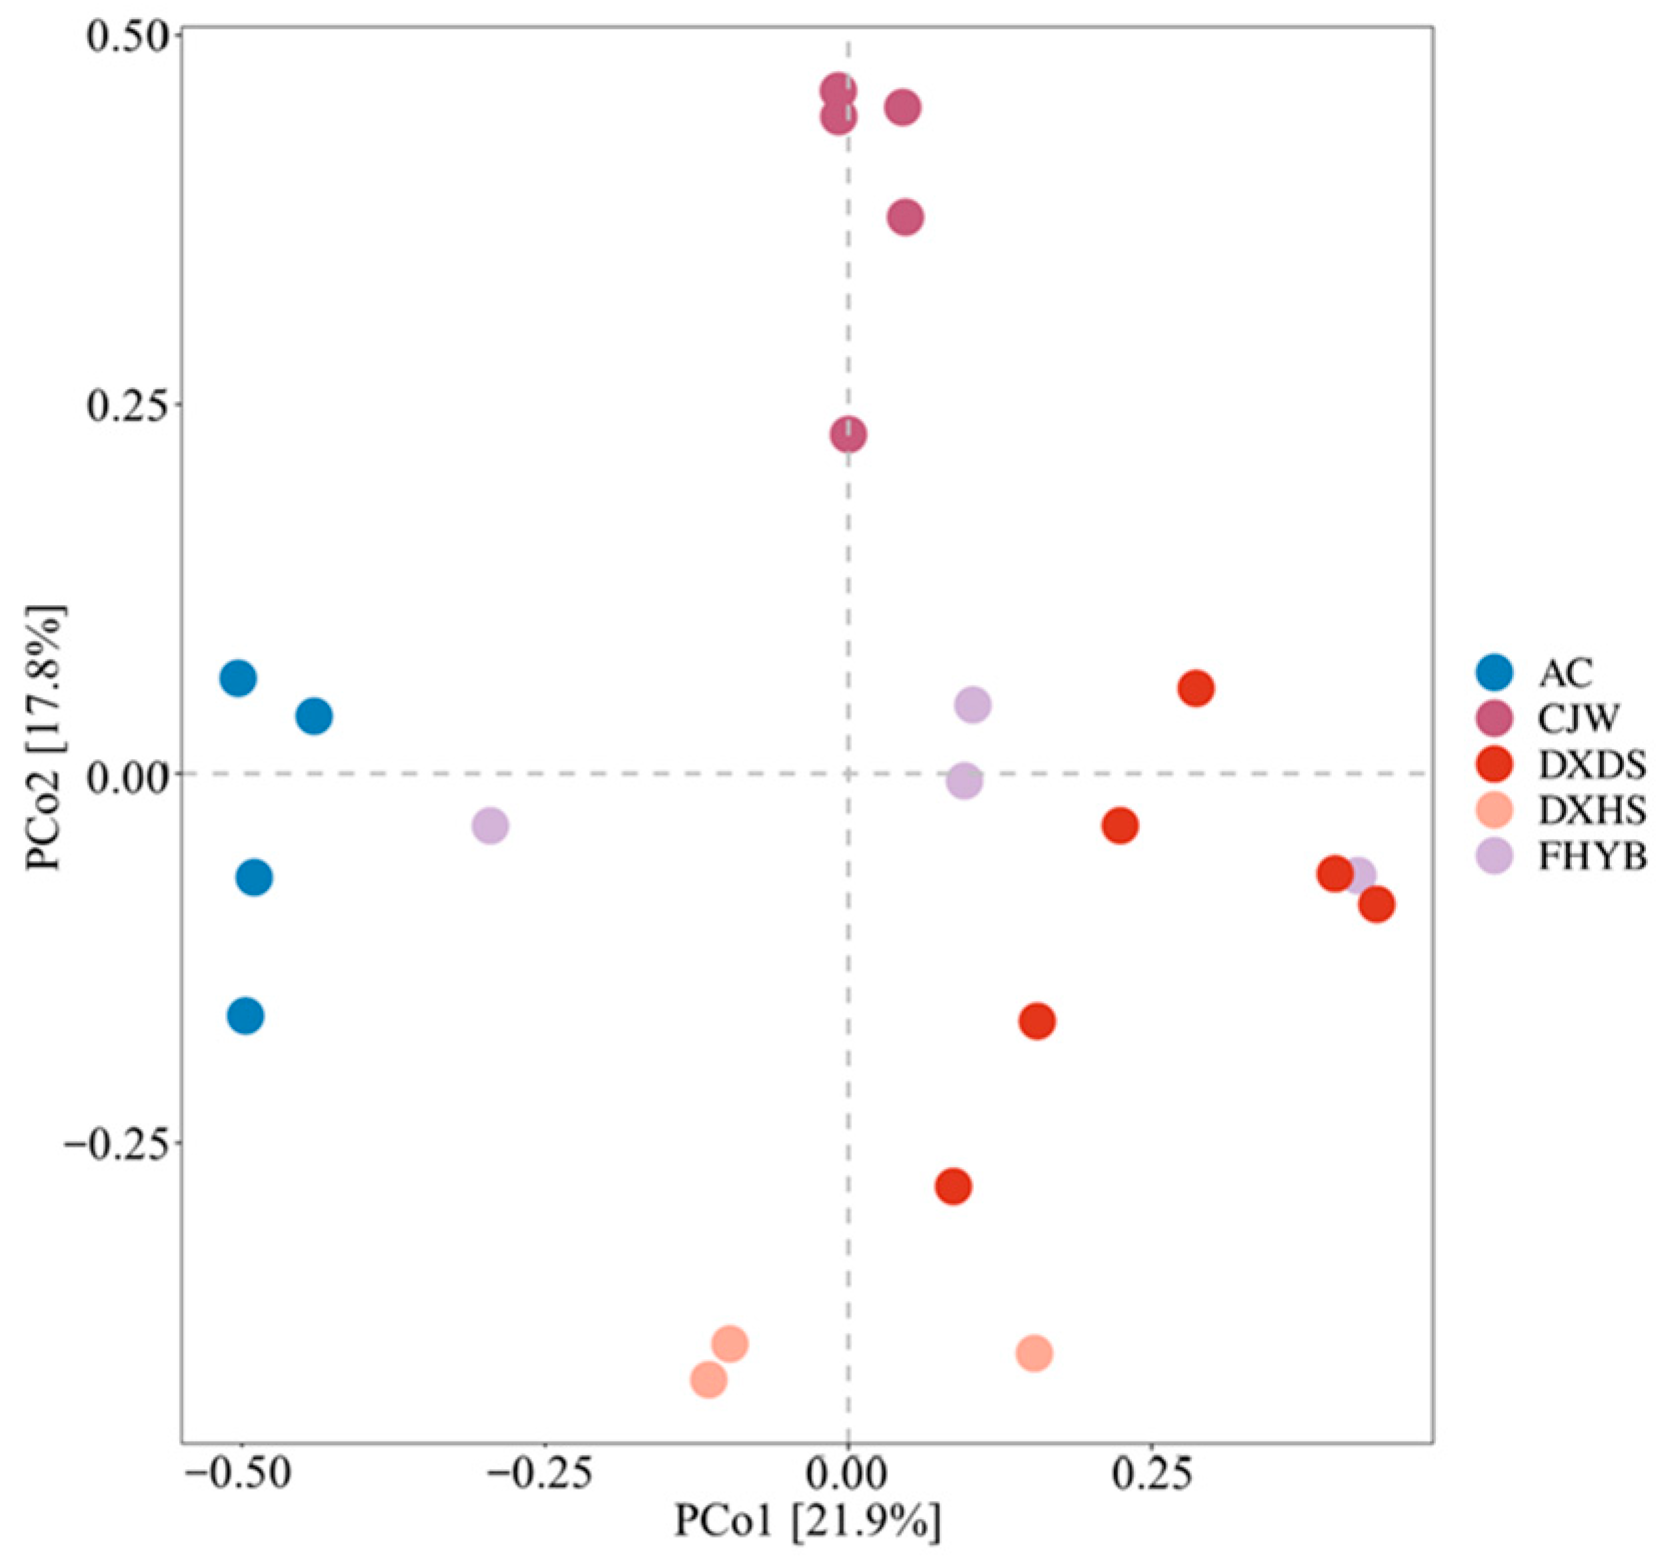
3.2. Microbial Community and Their Diversity in Shiziyan Cave

By analyzing the sequencing of samples from five habitats, a total of 12,167 OTUs from 22 samples belonging to 56 phyla and 402 orders were obtained. The microbial distribution differed among habitats at the phylum level (Figure 2). In the sediment samples (CJW), the dominant phyla were Actinomycetota (28.77%), Pseudomonadota (18.73%), and Bacillota (11.76%), and Actinomycetota had the highest percentage in CJW compared to the other four habitats. In the weathered rock wall samples (FHYB), the dominant phyla were Pseudomonadota (47.13%), Bacillota (22.67%), Actinomycetota (10.33%), and Cyanobacteria (7.33%). In the cave air samples (AC), the dominant phylum was Pseudomonadota (95.00%). Among the liquid samples, in the cave drip samples (DXDS), the dominant phyla were Pseudomonadota (52.20%), Actinomycetota (9.88%), Bacillota (9.37%), and Bacteroidota (6.67%); in the cave’s underground river water samples (DXHS), the dominant phyla were Pseudomonadota (36.44%), Actinomycetota (22.89%), Bacteroidota (14.65%), and Bacillota (7.27%). The above results indicate that microbes are more abundant, and their distribution is characterized by specificity in each habitat of the cave.
At the genus level, some of the genera associated with the carbon cycle were found, and the species abundance is shown in Figure 3, which suggests the presence of carbon-sequestering microbes in Shiziyan Cave habitats. Among them, Janthinobacterium was mainly present in FHYB (14.23%) and DXDS (4.21%), ‘Ca. Planktophila’ was mainly present in DXHS (5.51%), with smaller portions in DXDS (0.50%), and Nocardioides was found in FHYB (0.29%), DXDS (0.65%), and CJW (1.60%).
The ANOVA test showed that the microbial alpha diversity index was significantly various (p < 0.05) among the different habitats (Table 3). The highest microbial abundance was found in CJW, while the Shannon index (1.26 ± 0.19) showed that the lowest microbial diversity was found in AC.
The results of the PCoA based on Bray–Curtis at the OTU level revealed the distribution of microbial communities in each habitat of the cave system (Figure 4). The results showed that some of the FHYB and DXDS samples were grouped together, indicating that their microbial community structures were similar, while the microbial community structure of the AC samples was closest to that of the FHYB samples and more distant from the DXDS, DXHS, and CJW samples, which may be due to the FHYB samples being in closer contact with the air than other habitats.

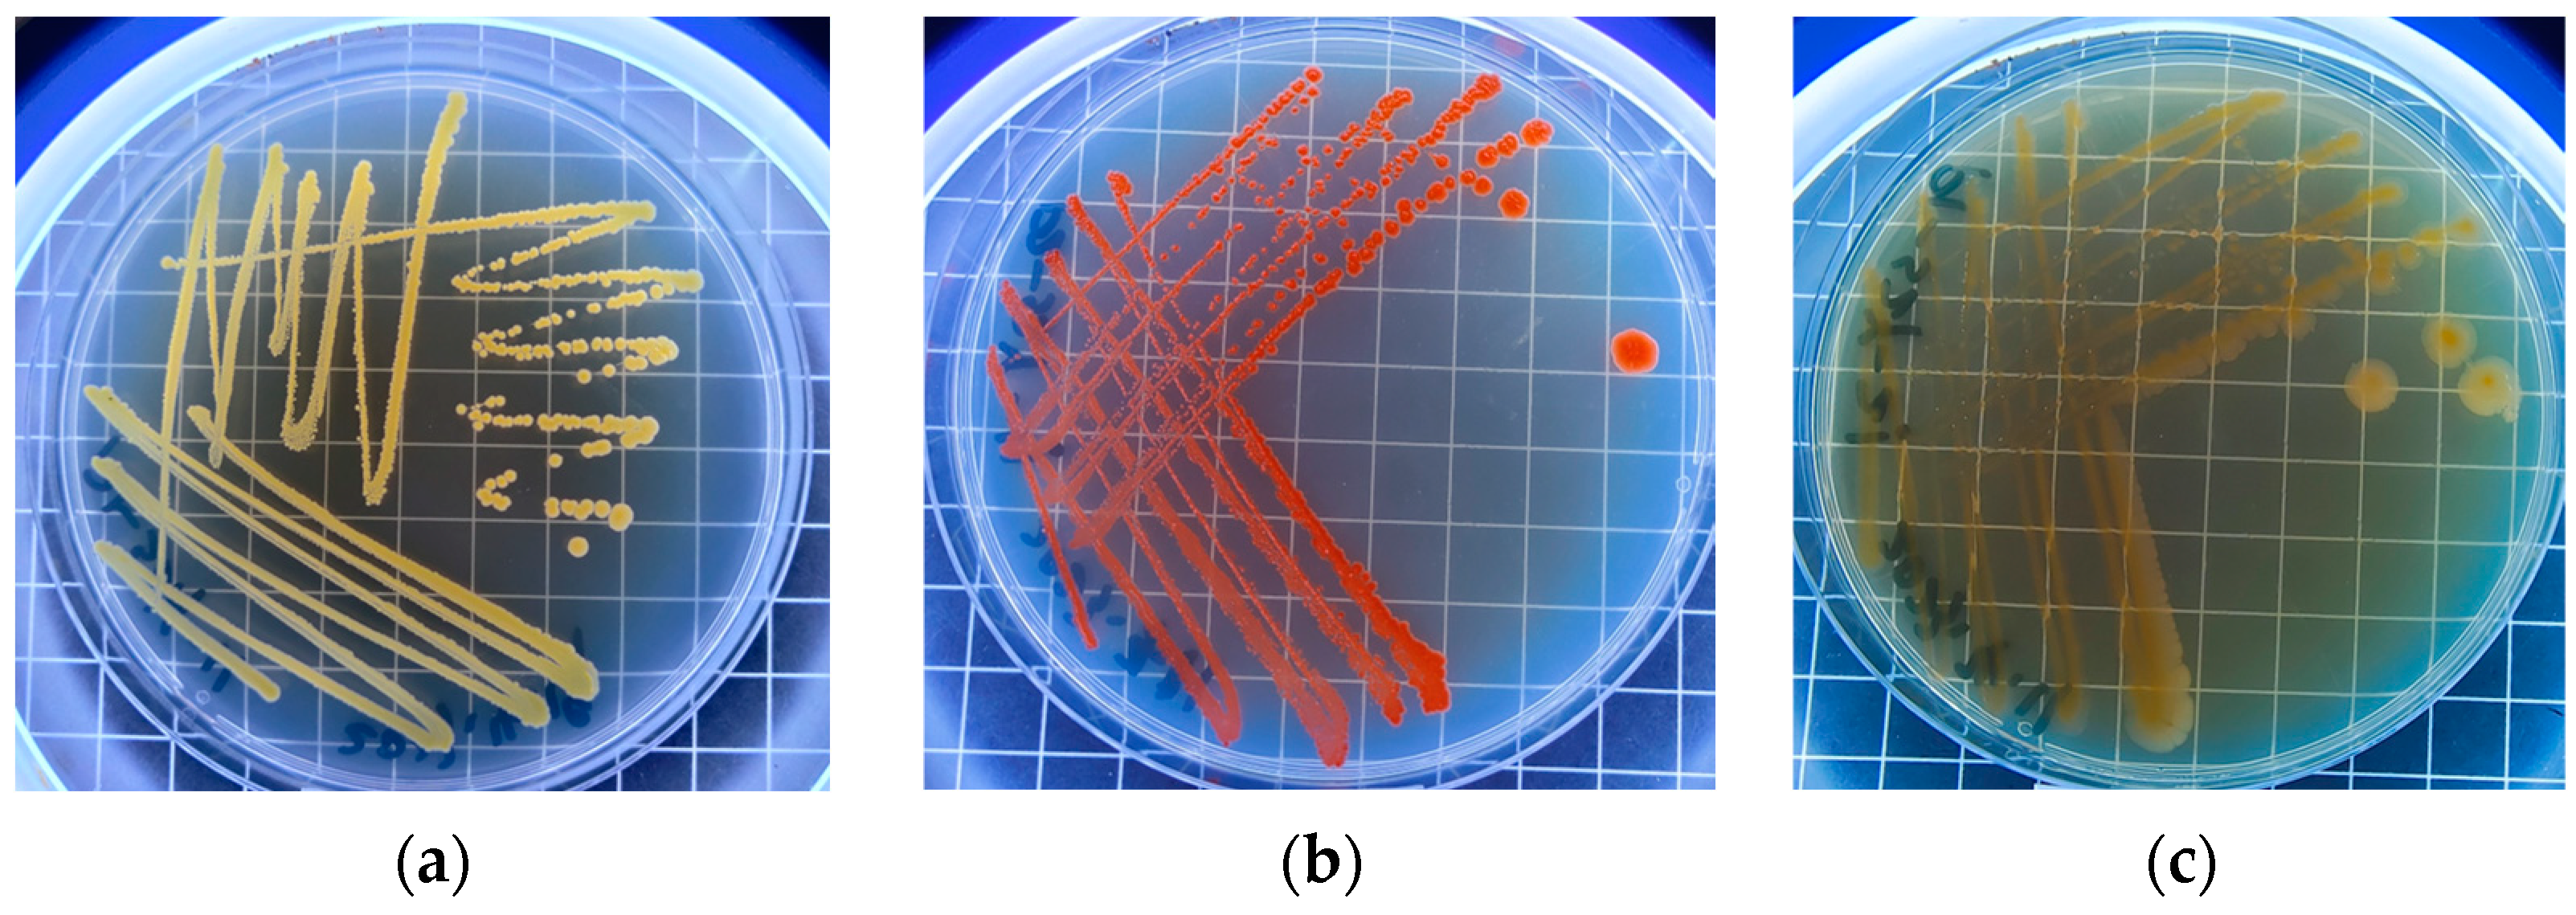
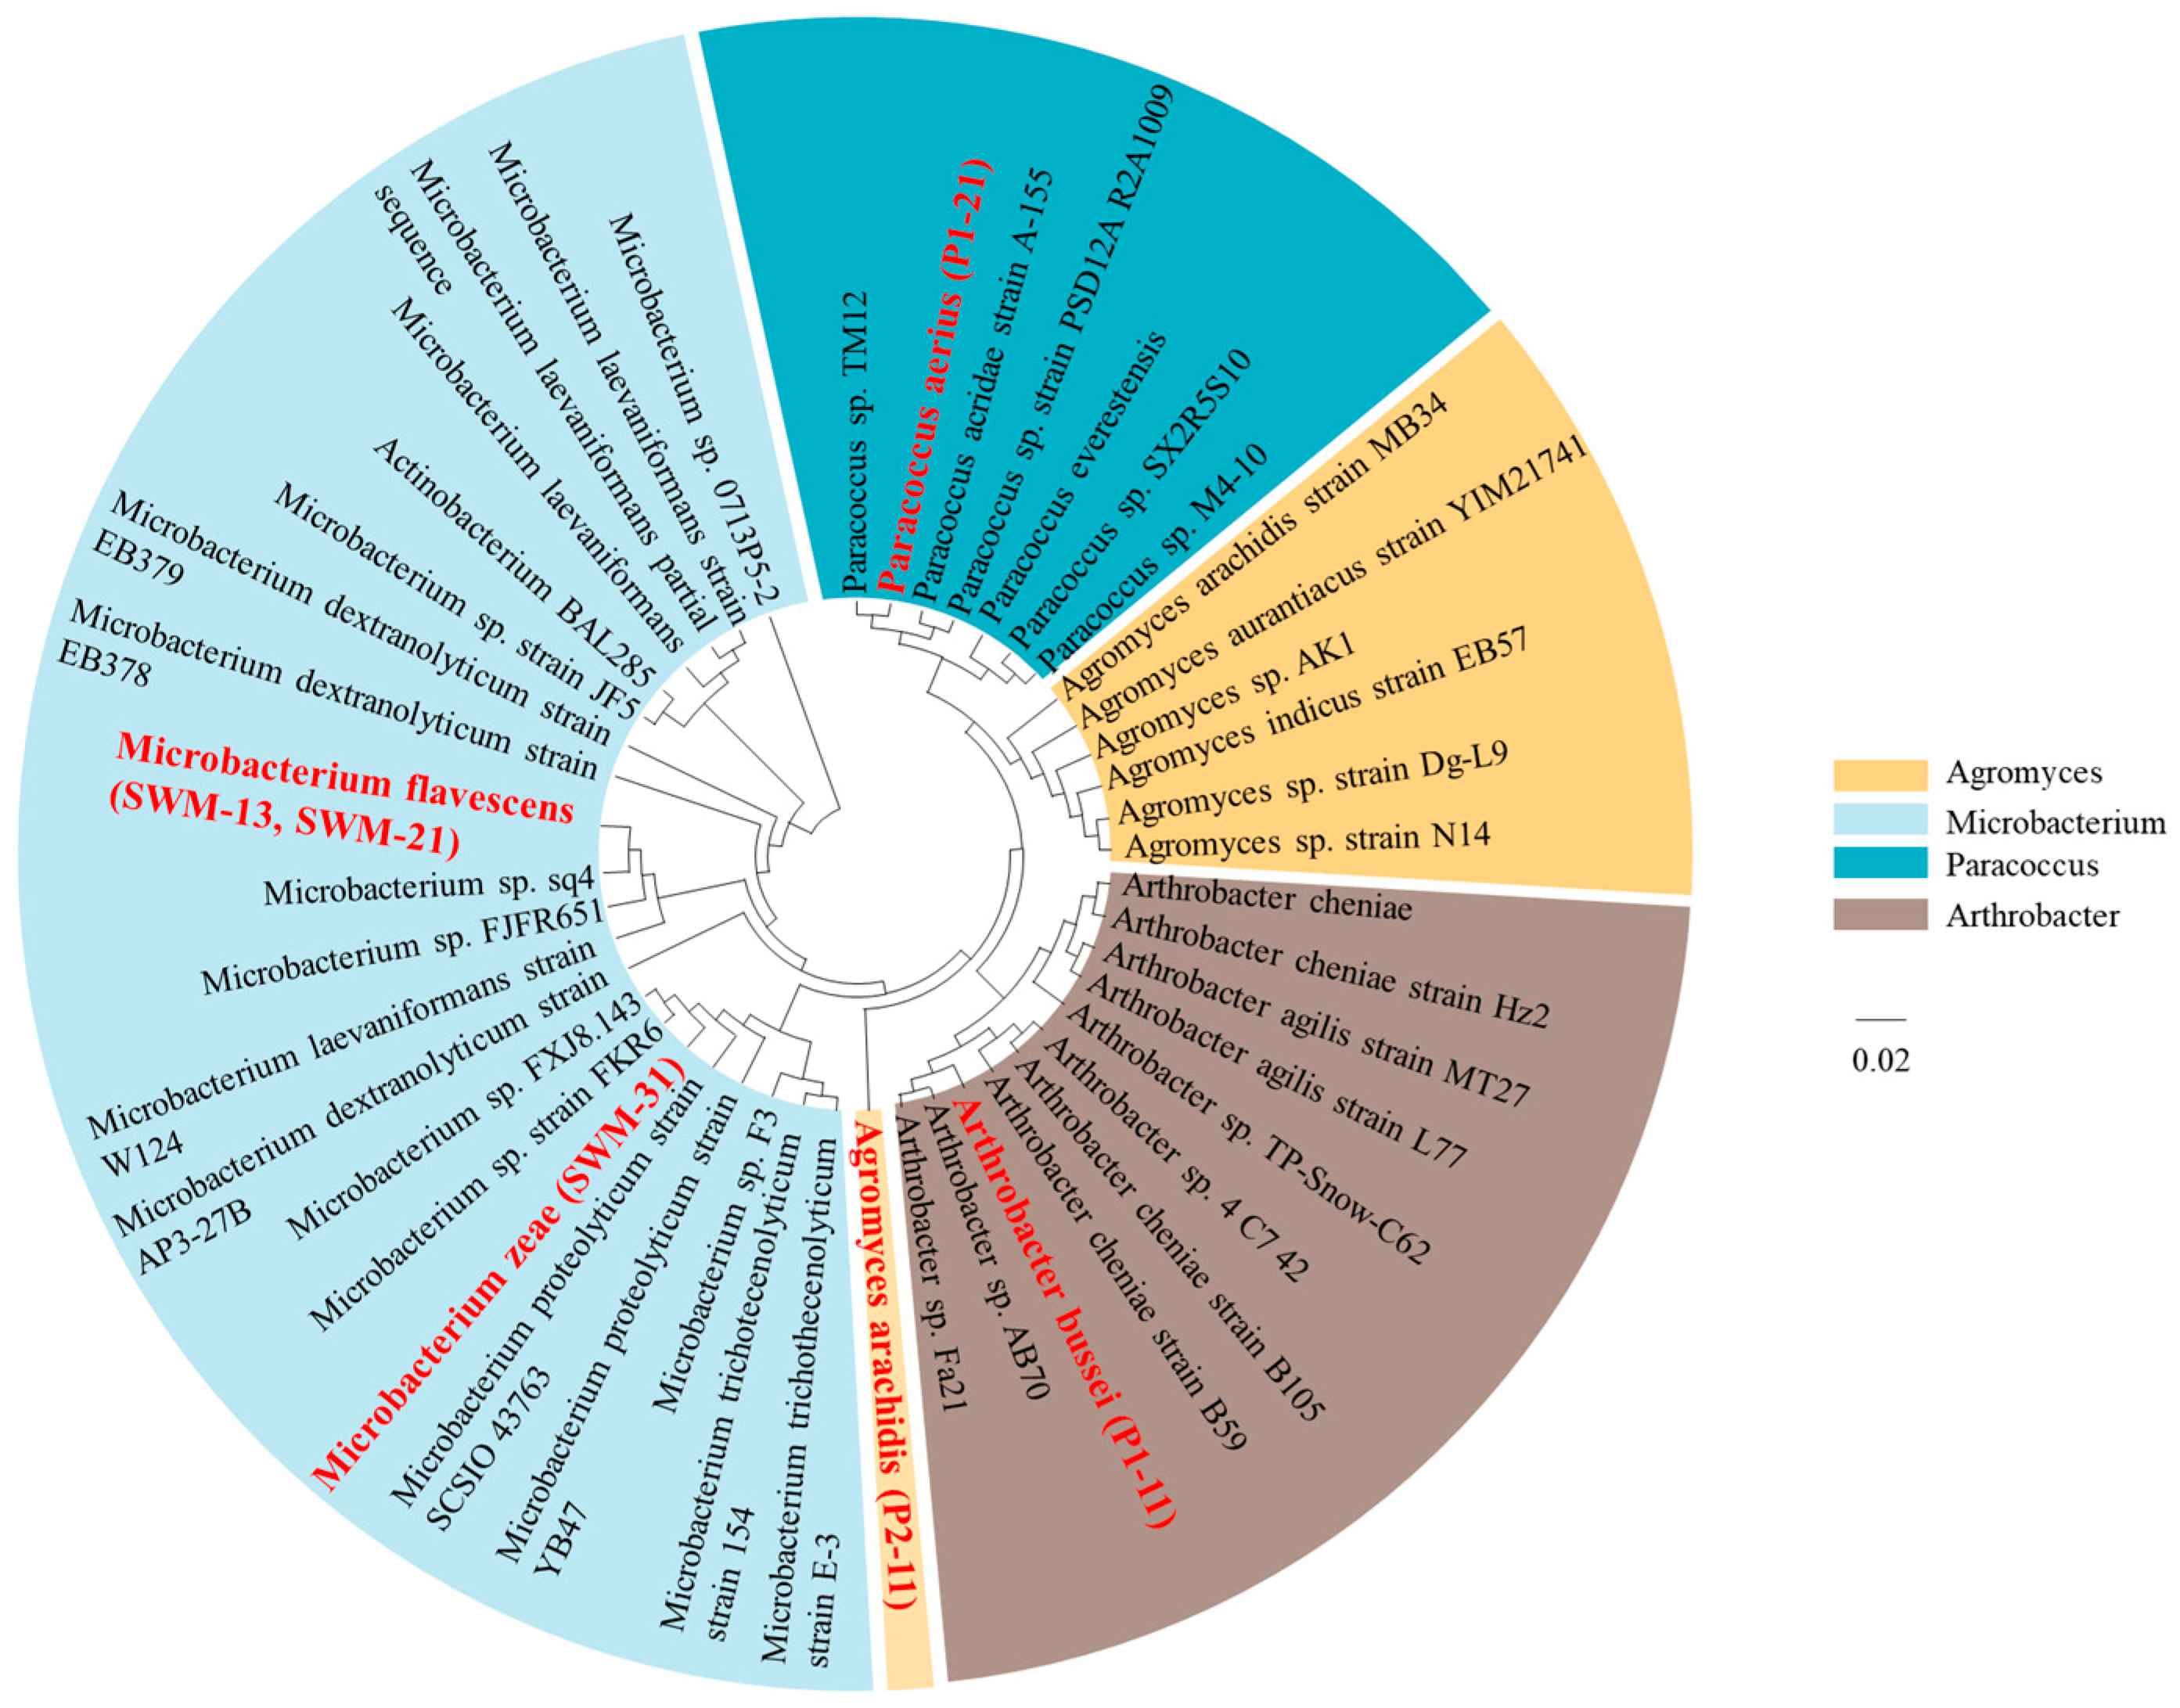
3.3. Screening of the Predominant Carbon-Sequestering Strains in Shiziyan Cave

Twenty-eight carbon-sequestering strains were isolated from the five habitat samples using an inorganic medium without an external carbon source. Their growth was observed after isolation and purification by scratching, and six strains with a faster growth rate were screened out. The results are shown in Figure 5 and then numbered as CJW-11, CJW-13, CJW-21, DXDS-21, DXHS-31, and DXHS-11, respectively. Their colony morphology is shown in Figure A1, and the SEM (scanning electron microscope) observation is shown in Figure A2. The six dominant carbon-sequestering strains were performed to 16S rRNA amplification with fragment sizes ranging from 1370 to 1444 bp, and five species of bacteria were genetically identified. The dominant carbon-sequestering bacteria colonies isolated from Shiziyan Cave are shown in Table 4.
The known sequences in BLAST and GenBank were used for the homology comparison, and the phylogenetic tree was constructed using the neighbor-joining method via the Mega11 software, showing the 16S rRNA gene phylogenetic tree of each strain with the related gene strains. A total of 1000 similarity repetitions were carried out to construct the phylogenetic tree (Figure A3). The five dominant carbon-sequestering strains belong to two phyla, Pseudomonadota and Actinomycetota, respectively.

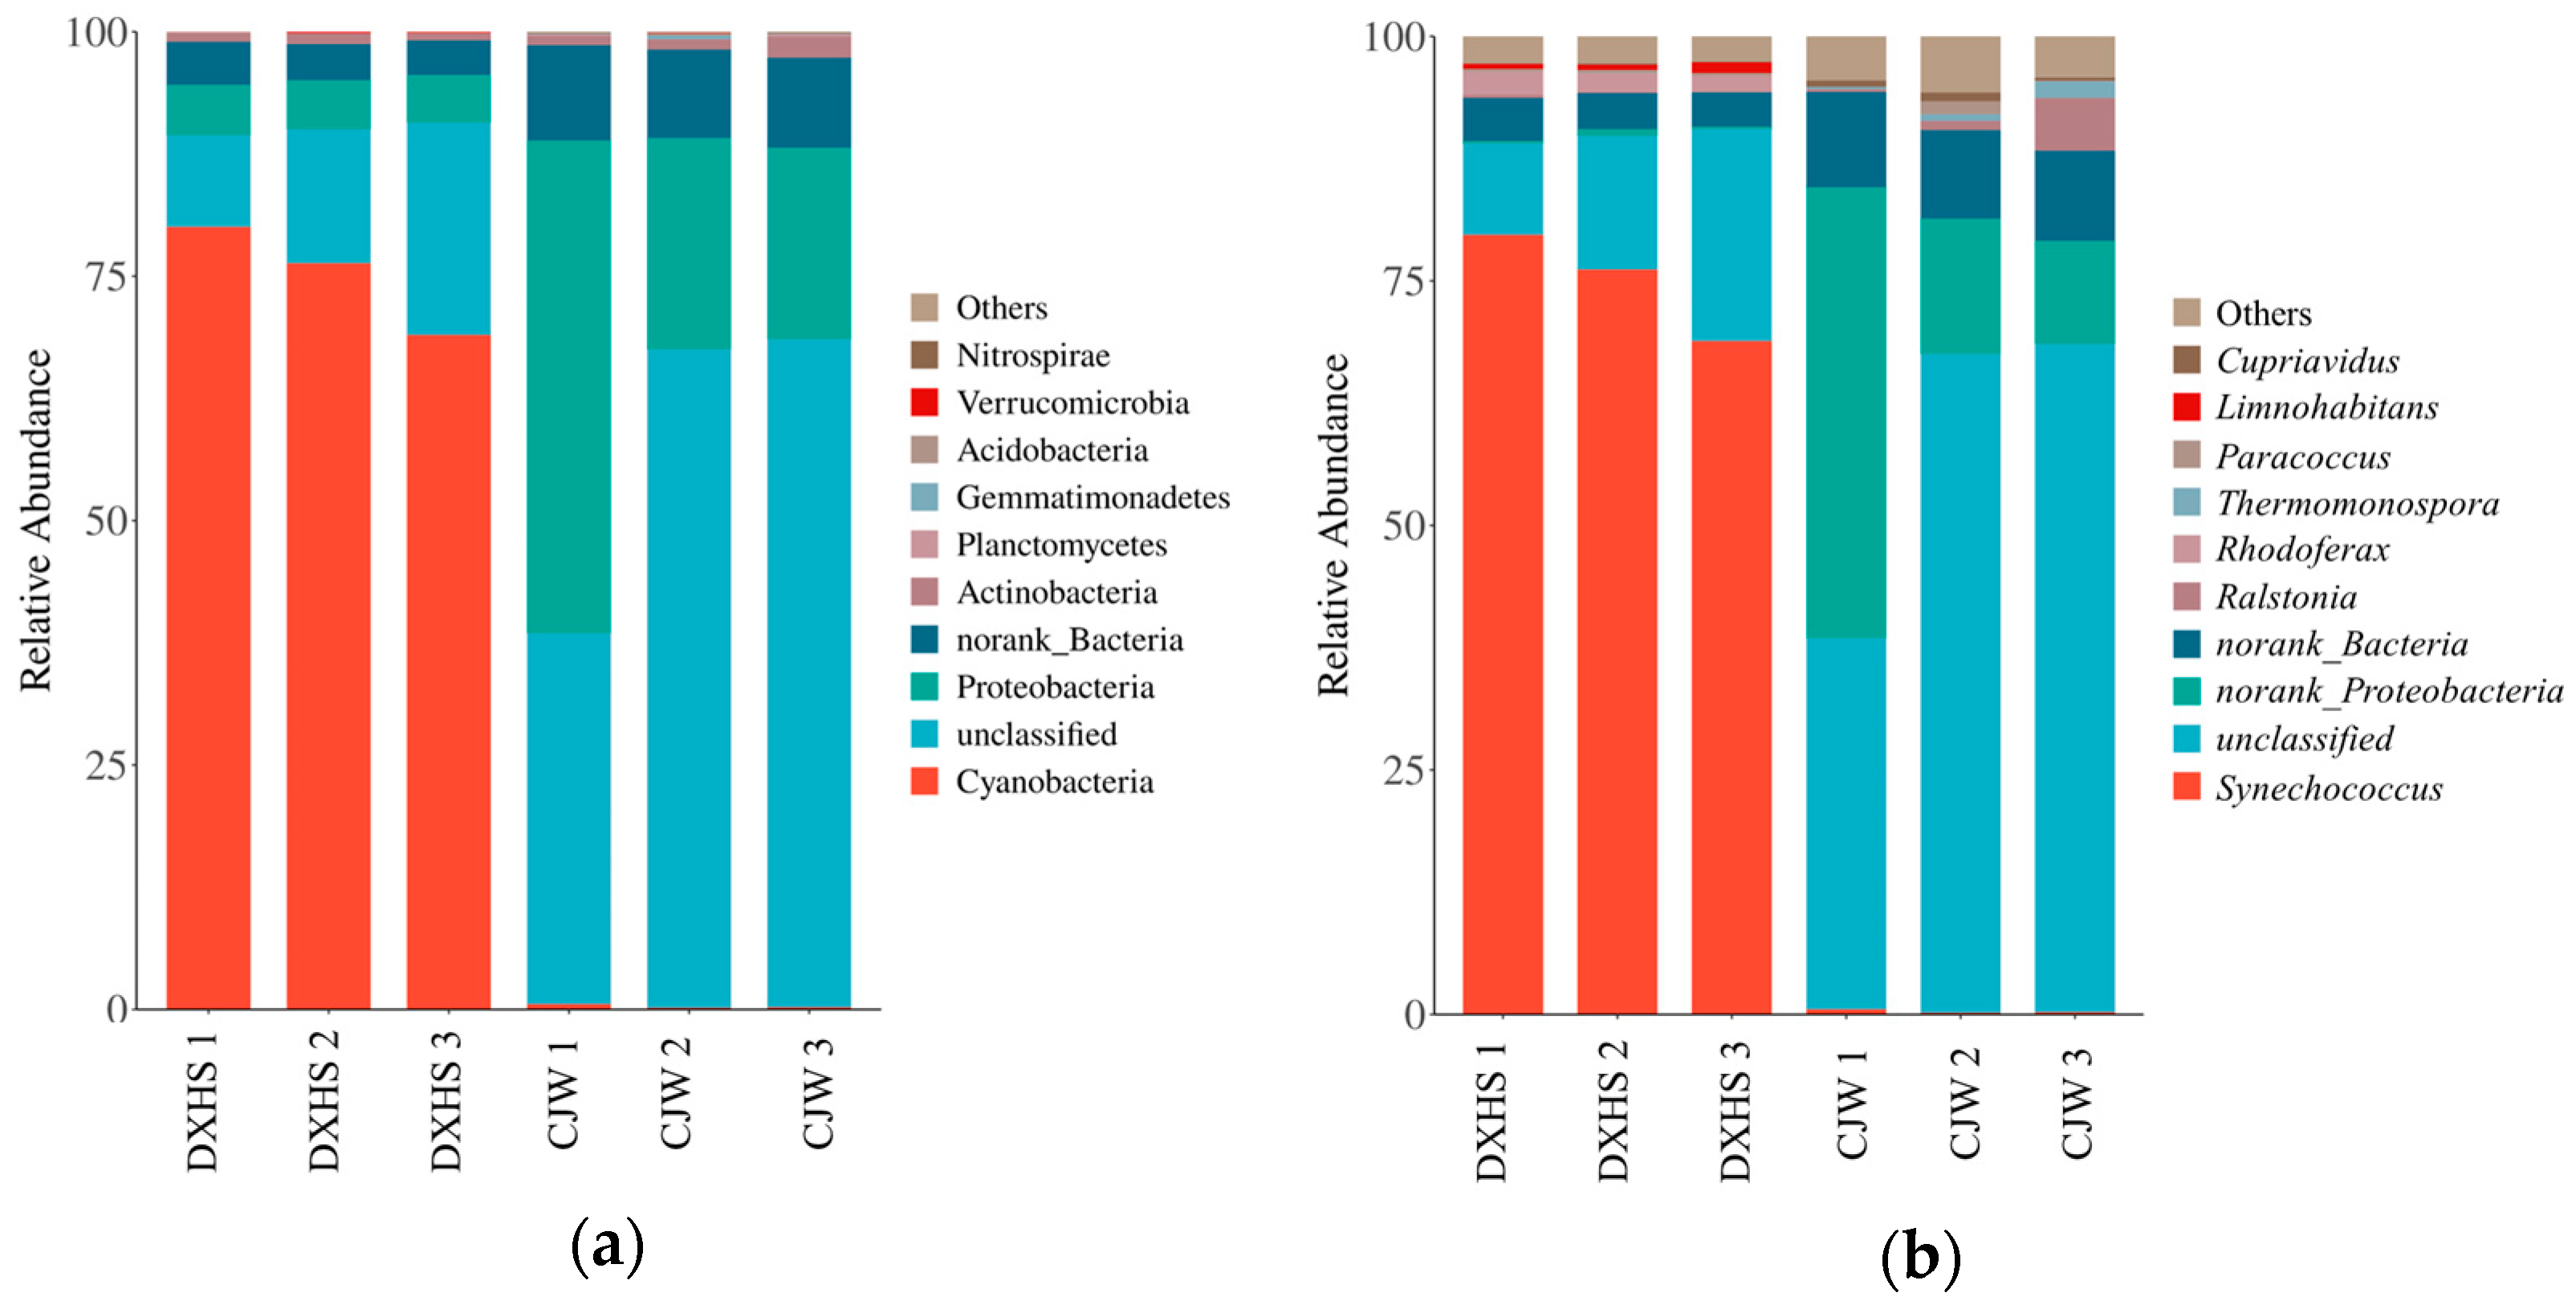
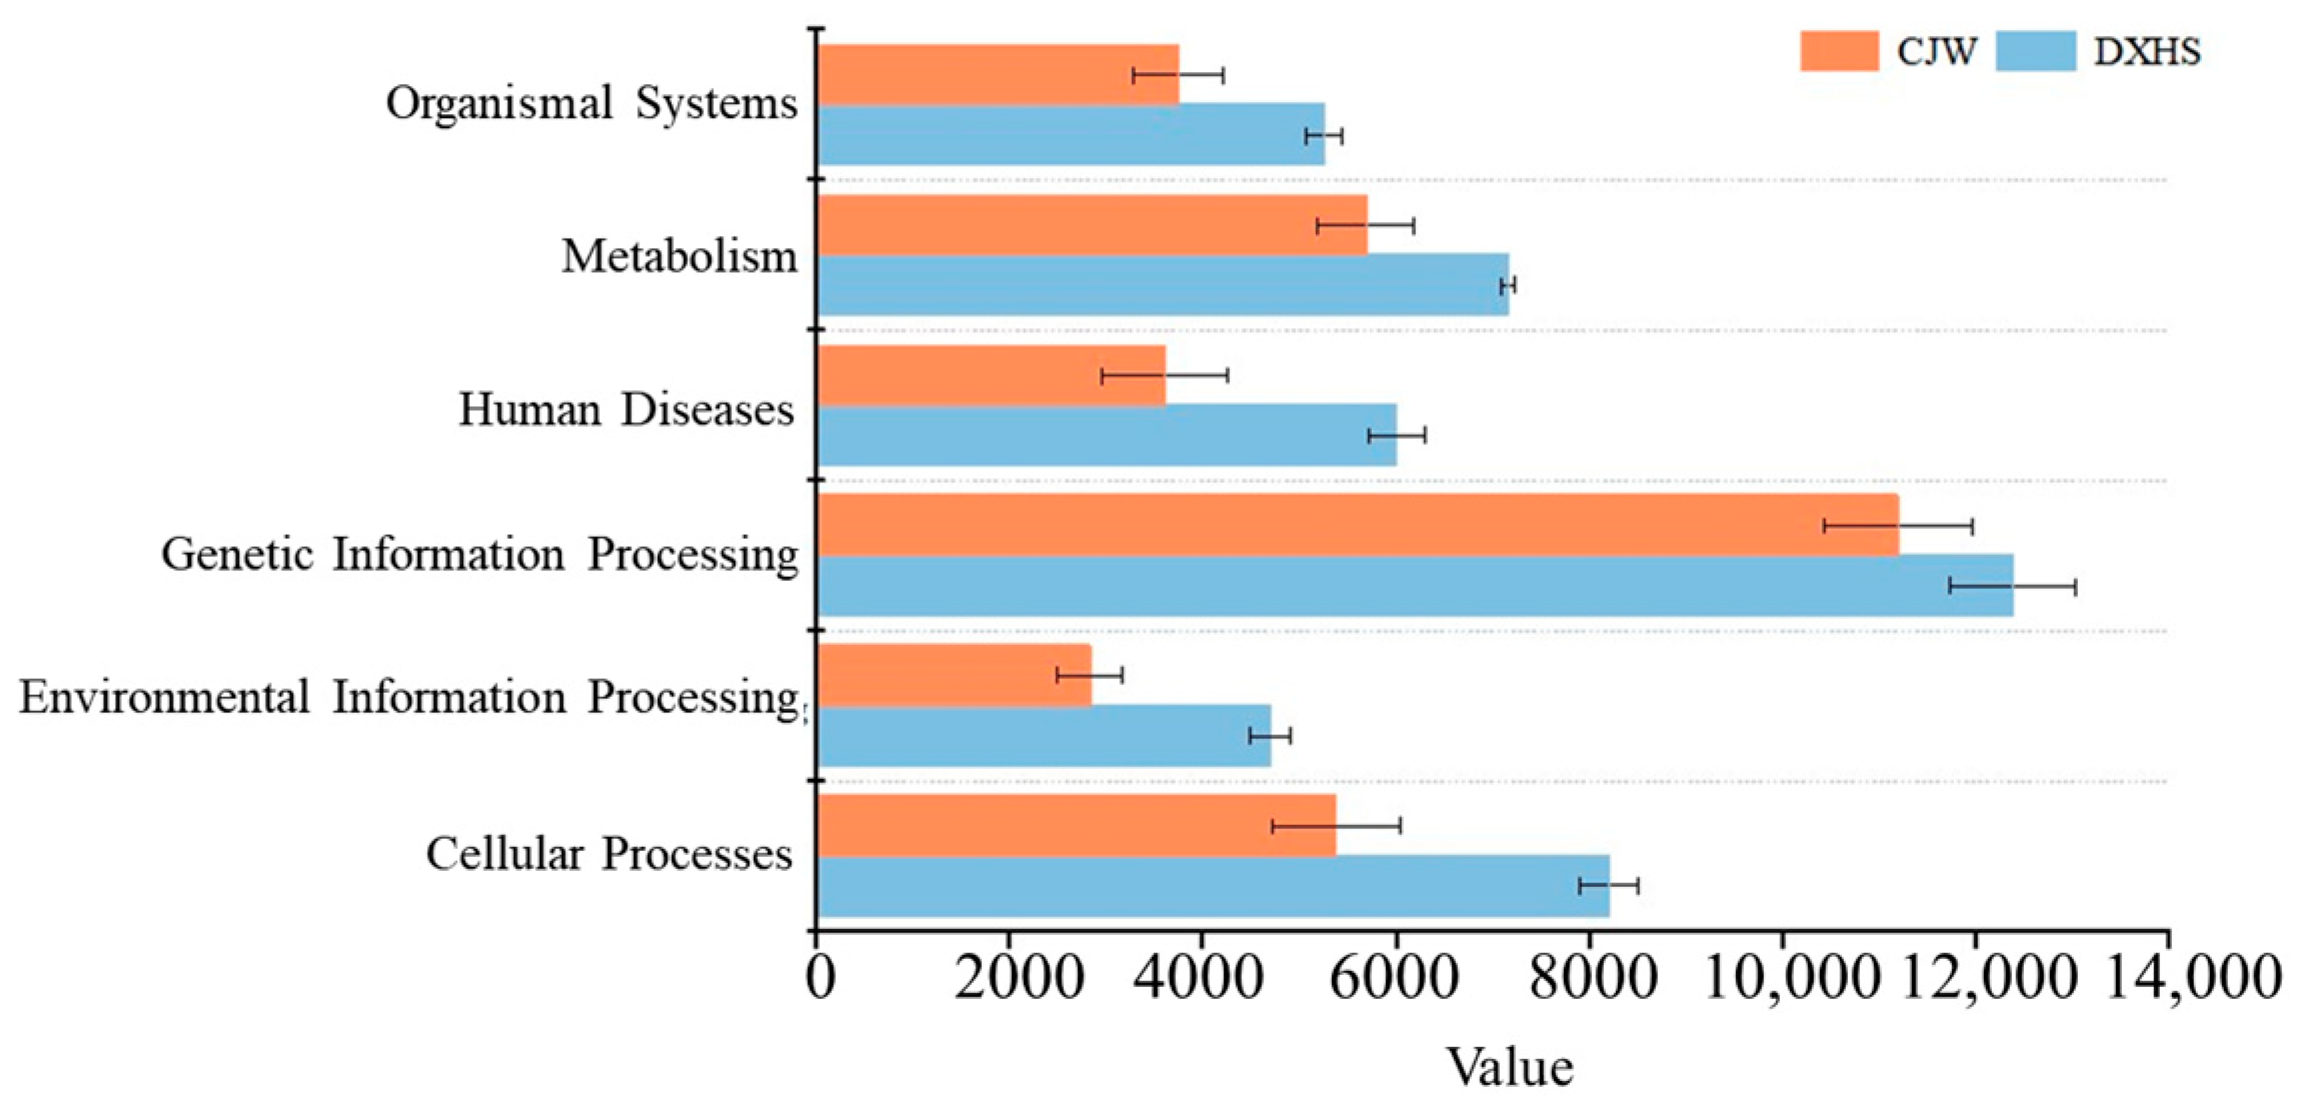
3.4. Community Structure of the Carbon-Sequestering Bacteria in Shiziyan Cave

The results of one-way ANOVA showed that the abundance of cbbL genes in the cave’s underground river water (DXHS1, 2, and 3) and sediment (CJW1, 2, and 3) habitat were significantly different (p < 0.05). The abundance indices (Chao1, ACE) and diversity index (Shannon) of the carbon-sequestering microbial community containing cbbL genes were higher in CJW than those of DXHS, but the diversity index (Simpson) of DXHS was significantly higher than CJW (Figure 6).
Based on cbbL gene abundance, the percentage of potential carbon-sequestering bacterial communities was estimated, and all OTUs belonged to 18 phyla, 40 classes, 72 orders, 137 families, and 280 genera, as analyzed by cbbL sequencing. The top 10 colonies with the highest relative abundance were selected to construct species compositional abundance maps at the phylum (Figure 7a) and genus (Figure 7b) levels, respectively. At the phylum level, the percentage of Cyanobacteria in DXHS accounted for more than 70%, which was significantly higher than CJW, and the percentages of Actinomycetota phylum in CJW were 50.38%, 21.62%, and 19.59%, which is much larger than the proportion in DXHS (5.18%, 5.04%, and 4.89%), respectively. However, a larger number of unclassified bacterial groups existed in CJW; thus, further research on the bacterial communities in Shiziyan Cave is still needed. At the genus level, DXHS had an absolute predominance of the genus Micrococcus (79.69%, 76.15%, and 68.81%), followed by the unclassified groups (with an average relative abundance of about 14.92%), while CJW had a very small percentage of the genus Micrococcus (with an average relative abundance of only 0.30%), a high percentage of the unclassified or norank_Pseudomonadota (with no clear taxonomic information or name at some taxonomic levels).
Different habitat factors affect the structure of bacterial communities in cave habitats in different ways (Figure 8). The results showed that the main habitat factors affecting the abundance of bacteria community in the DXHS samples were SO 4 2 and NO 3 concentrations (Figure 8a). And we found that the main habitat factors affecting the abundance of the bacterial communities in the CJW samples were the pH and Ca2+ concentrations (Figure 8b).

3.5. Inferring Microbial Carbon Metabolic Function in Cave Samples by PICRUSt2

The results of the KEGG (Kyoto Encyclopedia of Genes and Genomes) pathway abundance in each sample were obtained based on PICRUSt2 analysis (Figure 9). A total of six functional modules were organized in the sample dataset, including cellular processes, genetic information processing, human diseases, environmental information processing, metabolism, and organismal systems. The most abundant functional module in both sample types was genetic information processing. A total of 46 pathways were predicted in both sample types, with the top 20 pathways relevant to the bacterial communities shown in Figure 10. Among them, the pathways were more abundant in DXHS than in CJW.
In addition, to understand the potential carbon metabolism reactions involved by bacteria, we examined the carbon metabolism-related coding genes and enzymes in the Shiziyan Cave samples. The results suggested that the following carbon metabolism pathways exist in Shiziyan Cave, including the glycolysis/gluconeogenesis pathway, pentose phosphate pathway, citrate cycle (TCA cycle), and carbon fixation pathways in prokaryotes. The enzymes derived from the tests are listed in the Supplementary Material: Table S1, e.g., glyceraldehyde 3-phosphate dehydrogenase [EC: 1.2.1.12], hexokinase [EC: 2.7.1.1], and pyruvate kinase [EC: 2.7.1.40], involved in glycolysis/gluconeogenesis pathways; 6-phosphogluconate dehydrogenase [EC: 1.1.1.44 1.1.1.343], glucose-6-phosphate isomerase [EC: 5.3.1.9], and transaldolase/glucose-6-phosphate isomerase [EC: 2.2.1.2 5.3.1.9], involved in the pentose phosphate pathway; malate dehydrogenase [EC: 1.1.1.37], succinyl-CoA synthetase beta subunit [EC: 6.2.1.5], and aconitate hydratase [EC: 4.2.1.3], involved in the citrate cycle (TCA cycle); acetyl-CoA/propionyl-CoA carboxylase [EC: 6.4.1.2 6.4.1.3] and pyruvate ferredoxin oxidoreductase alpha subunit [EC: 1.2.7.1], involved in the carbon fixation pathways in prokaryotes.

4. Discussion

4.1. Distribution of Culturable Carbon-Sequestering Bacteria in Shiziyan Cave

Despite the extreme environment of karst caves, relatively abundant microbial communities were detected in Shiziyan Cave. The dominant carbon-sequestering bacteria isolated from the Shiziyan Cave belonged to Pseudomonadota and Actinomycetota, with Pseudomonadota as the dominant taxa and Microbacteria as the leading genus, which is not only consistent with the results of the study above but also similar to the results of Xiang’s study [19] on a karstic river ecosystem under the same oligotrophic environment, where carbon-sequestering bacteria were Pseudomonadota, Bacteroidota, Actinomycetota, Cyanobacteria, and Verrucomicrobiota.
The results showed that the largest total number of colonies of screened carbon-sequestering bacteria were present in the sediments (50%). Pseudomonadota and Actinomycetota belong to the dominant bacterial phyla among the screened carbon-sequestering bacteria. Related studies have shown that Pseudomonadota can autotrophically fix CO2 through the reductive tricarboxylic acid cycle [20], and Liu et al. [21] studied the metabolism network of forest soil and found that the dominant carbon cycle community belongs to Actinomycetota. Therefore, we reasonably hypothesize that Pseudomonadota and Actinomycetota play important roles in the carbon cycle process in Shiziyan Cave. In this study, carbon-sequestering bacteria were obtained by traditional isolation and culture methods, which can be used as a supplement to study the diversity of carbon-sequestering bacteria in karst caves.
The above findings show that bacterial communities survived even though the cave was oligotrophic [22,23] and that the largest number of carbon-sequestering bacteria were isolated in the sediment and underground river water habitats.

4.2. Structure of Carbon-Sequestering Microbes in Different Habitats

The results of Section 3.2 and Section 3.3 can be integrated to infer that a higher abundance of carbon-sequestering bacteria may be present in the sediment and underground river water habitats. Therefore, we selected three samples from each of the CJW and DXHS habitats for subsequent carbon-sequestration strain studies. Abundant cbbL genes were detected in samples, suggesting the presence of higher numbers of autotrophic carbon-sequestering bacterial communities in DXHS and CJW. In this study, the microbial community in the CJW ( NO 3 : 15.09–20.23 mg/L) samples was more diverse than the DXHS ( NO 3 : 6.37–11.33 mg/L) samples (Figure 6a–c). This finding was similar to previous studies on bacterial abundance in karst forests [24]. Therefore, it is reasonable to speculate that NO 3 may be one main factor affecting the bacterial diversity of the two habitat samples from Shiziyan Cave.
In both habitats (Figure 7a), Pseudomonadota was the main phylum shared by the carbon-sequestering bacteria community. The DXHS samples had a high proportion of Cyanobacteria (DXHS1, 2, and 3 represent 80.03%, 76.32%, and 68.99%, respectively), and the pH values of the corresponding samples were 7.62, 7.60, and 7.55, respectively, suggesting that a higher pH may promote Cyanobacteria in Shiziyan Cave. This finding was also consistent with previous studies that a high pH increases the ability of microalgae to sequester carbon [25]. The CJW samples were found to contain Rhodoferax, which was found to be a mixed-nutrient colony with high CO2 tolerance and even CO2 preference [26]. This suggests that more highly carbon-sequestering bacteria may be found in sediment habitats. The presence of a high number of unclassified or norank_bacteria in the CJW samples indicates that more extensive studies are still needed in the future.

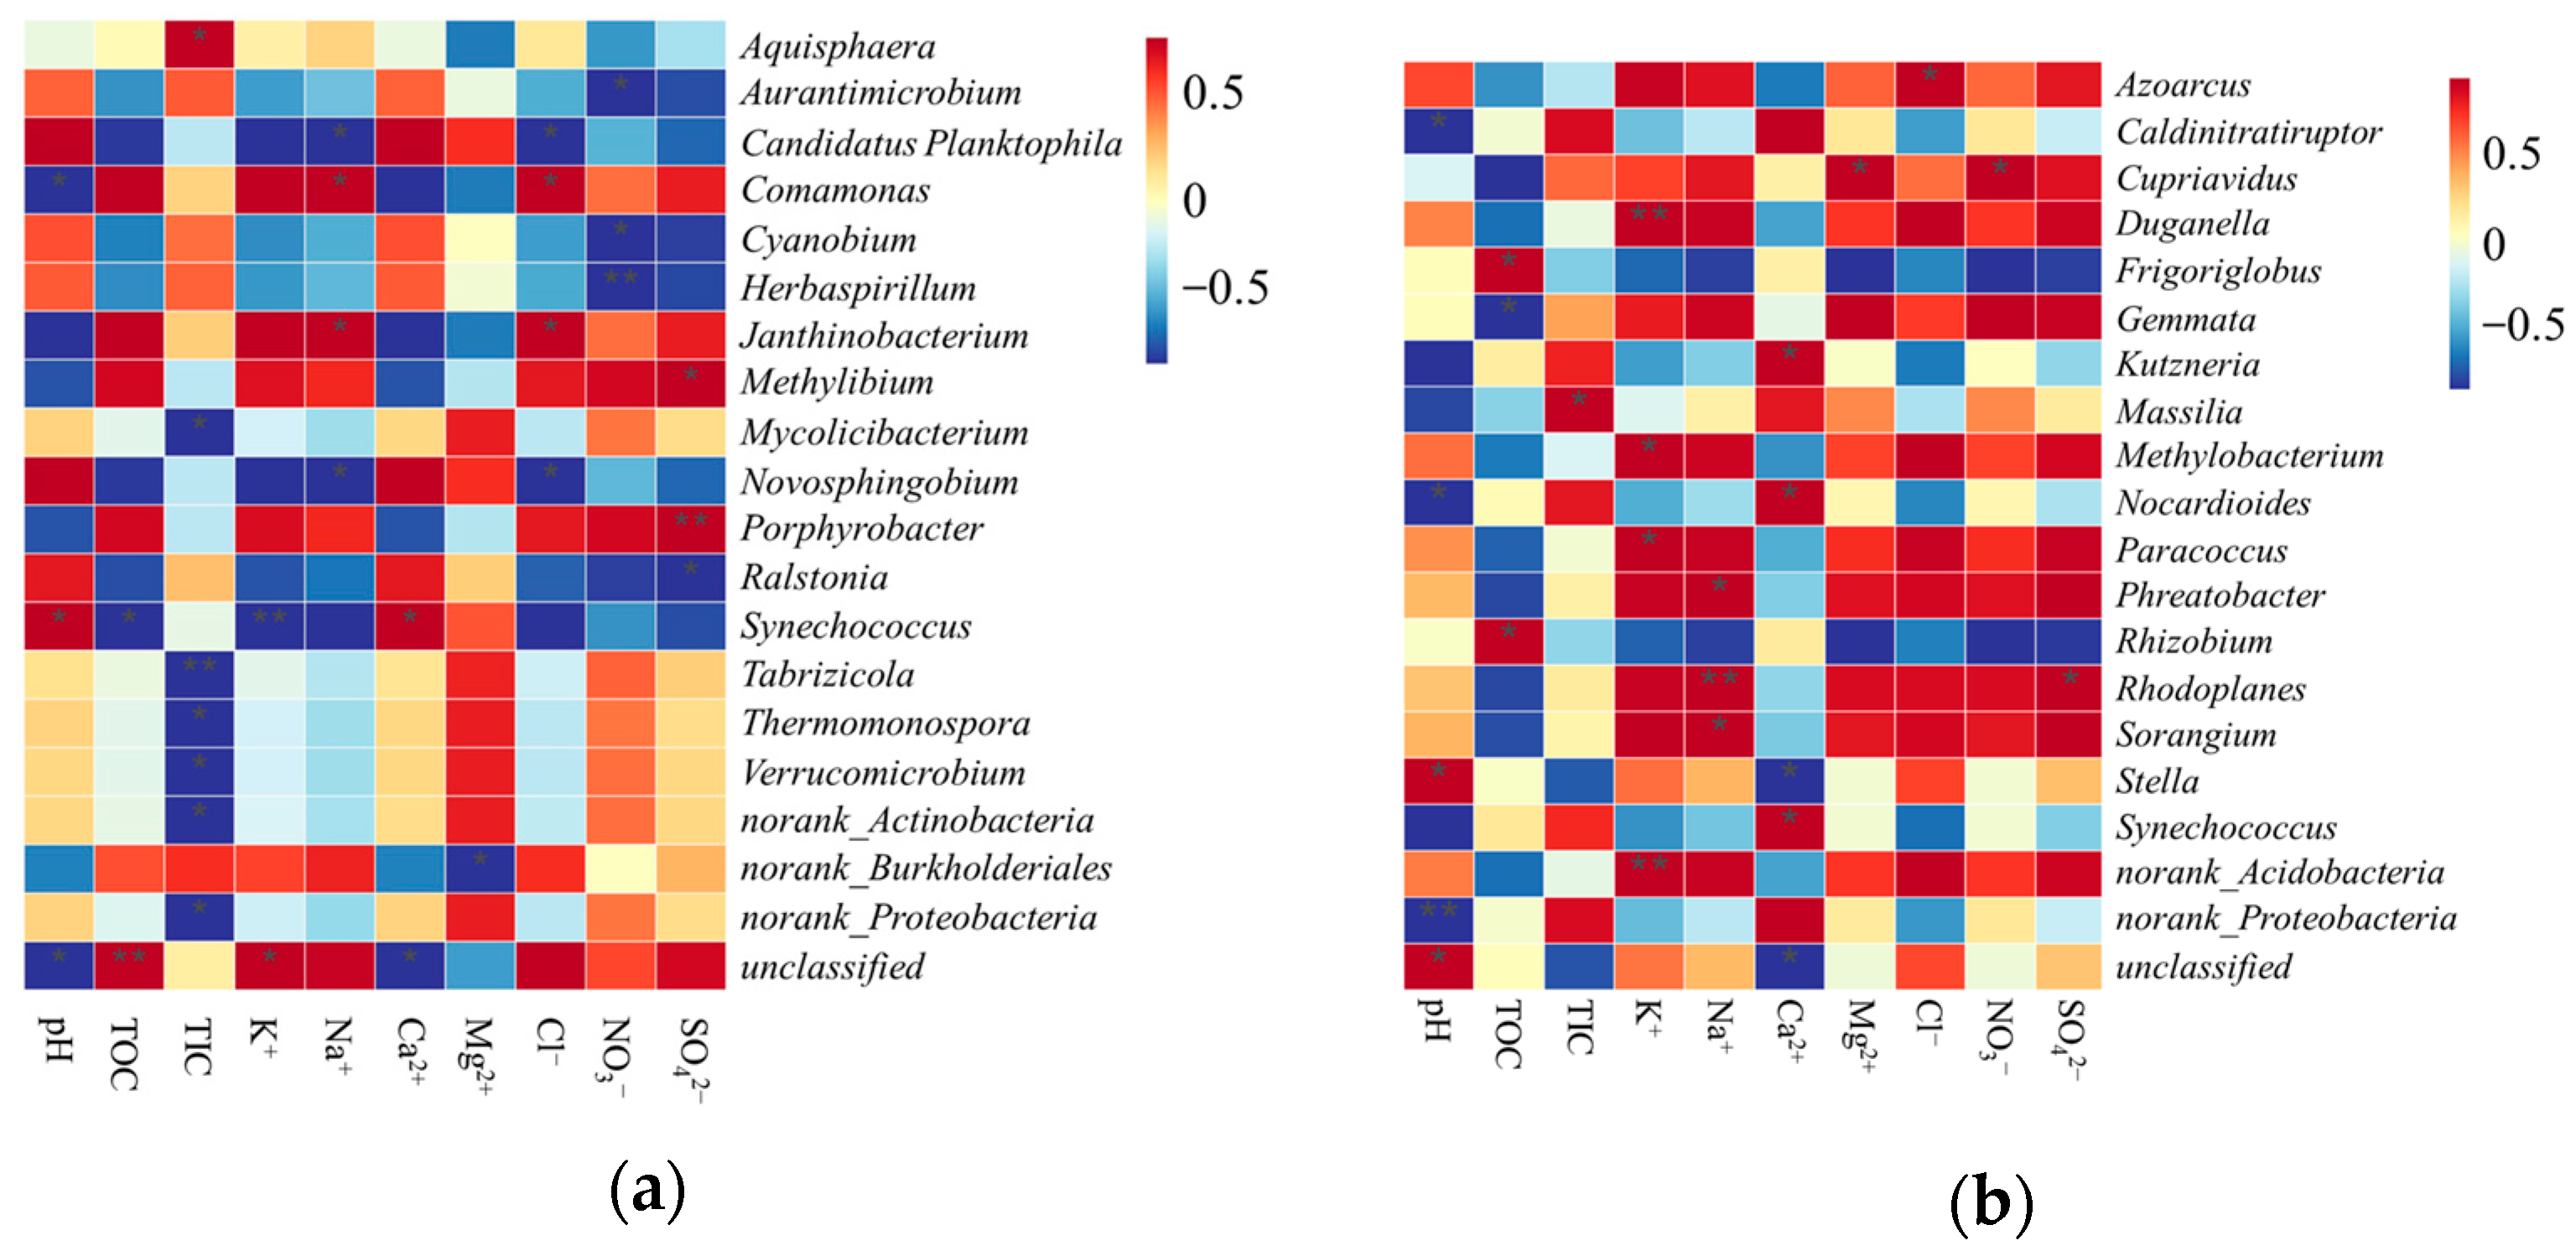
4.3. Effects of Habitat Factors on the Structure of Carbon-Sequestering Microbes in Shiziyan Cave

The extent to which different habitat factors influence the structure of bacterial communities in cave habitats is different. The changes in microbiome and habitat factors are usually covariate. Many environmental variables (pH, C/N) can explain the composition of microbial communities [27,28]. Most Actinomycetota grow best under weakly alkaline conditions [29]. In this study, the samples were weakly alkaline in pH, which favored the growth of Actinomycetota, and thus, the presence of Actinomycetota was found in both DXHS and CJW samples.
This study showed that there may be a synergistic relationship between the SO 4 2 , NO 3 concentrations and the bacterial abundance; for example, Aurantimicrobium (r = −0.99, p-value = 0.02), Cyanobium (r = −0.99, p-value = 0.03), and Herbaspirillum (r = −0.99, p-value < 0.01). Although, they only significantly negatively correlated with the NO 3 concentration and negatively correlated with the SO 4 2 concentration; the relationship between the change in their abundance with the SO 4 2 concentration (4.07–14.00 mg/L) trended similar to the NO 3 concentration (6.37–12.33 mg/L). This hypothesis has been confirmed in previous studies. Shi et al. [30] found that the distribution of NO 3 and SO 4 2 might be related to the partial reduction of the local underground river water environment. In the matrix-with-fractures zone, the higher proportion of organism-available organic matter and the enhancement of sulfate reduction lead to a decrease in the SO 4 2 concentration, whereas denitrification is enhanced prior to sulfate reduction, leading to a decrease in the   NO 3 concentration, as well.
The pH was significantly and negatively correlated with Nocardioides (r = −0.99, p-value = 0.04) and Caldinitratiruptor (r = −0.99, p-value = 0.02) and significantly and positively correlated with Stella (r = 0.99, p-value = 0.04), suggesting that the pH is one of the factors regulating microbial communities. Similarly, this result was confirmed in other studies [31,32]. In addition, there is antagonism between the pH and Ca2+, such as in the genus Stella, which was significantly and positively correlated with the pH (r = 0.99, p-value = 0.04) but negatively correlated with the Ca2+ concentration (r = −0.99, p-value = 0.03). The genus Nocardioides was significantly and negatively correlated with the pH (r = −0.99, p-value = 0.04) but significantly and positively correlated with the Ca2+ concentration (r = 0.99, p-value = 0.03). Xiao et al. [24] found that Ca was the main explanatory variable of bacterial community composition, and the pH was controlled by the Ca2+ concentration, and they affected each other, which is consistent with the results of this study. Therefore, it is reasonable to find antagonistic effects of the pH and Ca2+ in the samples. Ca2+ is an essential trace element for microbial growth, and bacteria can be promoted by enhancing the participation of microbes in the dissolution of carbonate rock weathering and the release of other elements [33].

4.4. Functional Potential of Carbon Metabolism in Cave Microbes

We found that microbes could survive in Shiziyan Cave through a variety of metabolic pathways and may be involved in multiple different metabolic reactions, which is supported by datasets on the metabolic pathways and associated enzymes from the results of the PICRUSt2. Due to the constant darkness in the cave, autotrophic bacteria may be both producers and energy investors [34,35]. Autotrophic organisms could fix CO2 through the Calvin cycle and be widely distributed in the environment [36]. The key enzymes of the Calvin cycle, phosphoribulokinase, and glyceraldehyde-3-phosphate dehydrogenase, were found in the samples, suggesting that the Calvin cycle is present in the Shiziyan Cave system and is found primarily in underground river water habitats. In addition, 4-hydroxybutyryl-CoA dehydratase is an indicator enzyme for the 3-hydroxypropionate/4-hydroxybutyrate [37] and dicarboxylate cycle/4-hydroxybutyrate cycles [38], and the results of this study showed that 4-hydroxybutyryl-CoA dehydratase was detected in DXHS and CJW, and the amount of 4-hydroxybutyryl-CoA dehydratase was significantly higher in CJW than DXHS. Similarily, Ortiz et al. [6] found that 4-hydroxybutyryl-CoA dehydratase was abundant in extreme nutrient environments and contributed to the carbon assimilation in cave environments, which is consistent with the results of this study.
The above results show that the abundance of metabolic pathways varied among the habitats of Shiziyan Cave, and the dominant metabolic pathways differed among the habitats. This suggests that microbes have different carbon metabolizing activities, and specific microbes play an important role in the carbon metabolism cycle of cave habitats.

5. Conclusions

Our research focuses on analyzing the cbbL sequencing data and to better understand its implications. Five dominant strains were screened from five habitat samples of Shiziyan Cave by using an inorganic medium without an external carbon source. And carbon-sequestering bacteria mainly existed in the cave sediment and underground river water habitat. Then, it was found that the carbon-sequestering bacteria communities responded differently to various habitat factors in the studied cave with high CO2. The important habitat factors affecting the distribution of carbon-sequestering bacteria are SO 4 2 , NO 3 , pH, and Ca2+. Moreover, functional analyses of carbon metabolism indicate that microbes in habitats can cooperate and coexist to promote cave carbon cycling by participating in different carbon metabolic pathways. These results will help to provide basic data and a theoretical basis for carbon sequestration or reduction by cave microbes. Nevertheless, this article only studied carbon-sequestering bacteria communities in two habitats, and in the future, more different habitats could be selected for study.

Supplementary Materials

The following supporting information can be downloaded at: https://www.mdpi.com/article/10.3390/su16177357/s1, Table S1: KO_KEGG.

Author Contributions

Conceptualization, W.X. and F.L.; methodology, W.X.; software, A.Q. and X.Z.; validation, S.M. and D.L.; formal analysis, A.Q. and D.L.; data curation, W.X.; writing—original draft preparation, W.X.; writing—review and editing, L.L. and X.Z.; supervision, F.L., S.M. and Y.F.; funding acquisition, L.L. All authors have read and agreed to the published version of the manuscript.

Funding

This research was funded by the National Natural Science Foundation of China (51468011) and the Central Guiding Local Development of Science and Technology Plan Project in Guigang City, Guangxi, China ([2023] No. 2).

Institutional Review Board Statement

Not applicable.

Informed Consent Statement

Not applicable.

Data Availability Statement

All data and models generated or used during the study appear in the submitted article.

Conflicts of Interest

The authors declare no conflicts of interest.

Appendix A

Figure A1. Different strains of carbon-sequestering bacteria growing in inorganic medium without external carbon source: (a) P2-11: Agromyces arachidis, (b) P1-11: Arthrobacter bussei, (c) P1-21: Paracoccus aerius, (d) SWM-21: Microbacterium flavescens, and (e) SWM-31: Microbacterium zeae.
Sustainability 16 07357 g0a1aSustainability 16 07357 g0a1b
Figure A2. The observations of five dominant carbon-sequestering strains at different SEM magnifications: (a,b) P2-11: Agromyces arachidis, (c,d) P1-11: Arthrobacter bussei, (e,f) P1-21: Paracoccus aerius, (g,h) SWM-21: Microbacterium flavescens, and (i,j) SWM-31: Microbacterium zeae.
Sustainability 16 07357 g0a2
Figure A3. Phylogenetic tree of six dominant carbon-sequestering strains based on 16S rRNA.
Sustainability 16 07357 g0a3

References

  1. Falkowski, P.; Scholes, R.J.; Boyle, E.; Canadell, J.; Canfield, D.; Elser, J.; Gruber, N.; Hibbard, K.; Hogberg, P.; Linder, S.; et al. The global carbon cycle: A test of our knowledge of earth as a system. Science 2000, 290, 291–296. [Google Scholar] [CrossRef] [PubMed]
  2. Wang, Z.; Yin, J.-J.; Pu, J.; Xiao, Q.; Zhang, T.; Li, J. Flux and influencing factors of CO2 outgassing in a karst spring-fed creek: Implications for carbonate weathering-related carbon sink assessment. J. Hydrol. 2021, 596, 125710. [Google Scholar] [CrossRef]
  3. Marques, E.; Dias, J.; Silva, G.; Pirovani, C.; Rezende, R. Organic matter enrichment affects archaea community in limestone cave sediments. J. Cave Karst Stud. 2017, 79, 95–99. [Google Scholar] [CrossRef]
  4. Buckerfield, S.J.; Waldron, S.; Quilliam, R.S.; Naylor, L.A.; Li, S.; Oliver, D.M. How can we improve understanding of faecal indicator dynamics in karst systems under changing climatic, population, and land use stressors?—Research opportunities in SW China. Sci. Total Environ. 2019, 646, 438–447. [Google Scholar] [CrossRef]
  5. Jiang, C.; Zeng, H. Unique habitat of Karst Tiankengs changes the taxonomy and potential metabolism of soil microbial communities. Microbiol. Spectr. 2023, 11, e0231622. [Google Scholar] [CrossRef]
  6. Ortiz, M.; Legatzki, A.; Neilson, J.W.; Fryslie, B.; Nelson, W.M.; A Wing, R.; A Soderlund, C.; Pryor, B.M.; Maier, R.M. Making a living while starving in the dark: Metagenomic insights into the energy dynamics of a carbonate cave. ISME J. 2014, 8, 478–491. [Google Scholar] [CrossRef]
  7. Martin-Pozas, T.; Cuezva, S.; Fernandez-Cortes, A.; Gonzalez-Pumariega, M.; Elez, J.; Duarte, E.; de la Rasilla, M.; Canaveras, J.C.; Saiz-Jimenez, C.; Sanchez-Moral, S. Adaptive response of prokaryotic communities to extreme pollution flooding in a Paleolithic rock art cave (Pindal Cave, northern Spain). Sci. Total Environ. 2024, 921, 171137. [Google Scholar] [CrossRef]
  8. Man, B.; Wang, H.; Xiang, X.; Wang, R.; Yun, Y.; Gong, L. Phylogenetic diversity of culturable fungi in the Heshang Cave, central China. Front. Microbiol. 2015, 6, 1158. [Google Scholar] [CrossRef]
  9. Bauermeister, J.; Ramette, A.; Dattagupta, S. Repeatedly evolved host-specific ectosymbioses between sulfur-oxidizing bacteria and amphipods living in a cave ecosystem. PLoS ONE 2012, 7, e50254. [Google Scholar] [CrossRef]
  10. De Mandal, S.; Chatterjee, R.; Kumar, N.S. Dominant bacterial phyla in caves and their predicted functional roles in C and N cycle. BMC Microbiol. 2017, 17, 90. [Google Scholar] [CrossRef]
  11. Li, Y.; Liu, X.; Zhang, L.; Xie, Y.; Cai, X.; Wang, S.; Lian, B. Effects of short-term application of chemical and organic fertilizers on bacterial diversity of cornfield soil in a karst area. J. Soil Sci. Plant Nutr. 2020, 20, 2048–2058. [Google Scholar] [CrossRef]
  12. Lu, L.; Zou, S.Z.; Zhao, Y. Response of water cycle to precipitation in Shizhiyan underground river system in Huixian wetland of Guilin. Chin. Hydrogeol. Eng. Geol. 2022, 49, 63–72. [Google Scholar]
  13. Hu, J.-J.; Wang, L.; Li, Y.-L.; Fu, X.-H.; Le, Y.-Q.; Xu, D.-S.; Lu, B.; Yu, J.-G. Breeding, optimization and community structure analysis of non-photosynthetic CO2 assimilation microbial flora. Huan Jing ke Xue = Huanjing Kexue 2009, 30, 2438–2444. [Google Scholar]
  14. Zhou, S.; Wei, B.Q.; Zhang, Q.; Jiang, X.J.; Lin, D.C.; Gan, Y.K.; Mo, Z.Z. Isolation, identification and validation of the facultative fixed carbon and nitrogen bacteria: A type of microorganisms that can fix CO2 and N2 at the same time. Acta Sci. Circumstantiae 2013, 33, 1043–1050. [Google Scholar]
  15. Fan, X.R.; Li, G.W.; Shen, P. Microbiology Experiment, 2nd ed.; Higher Education Press: Beijing, China, 1995; pp. 107–112. [Google Scholar]
  16. Bu, L.; Peng, Z.; Tian, J.; Zhang, X.; Chen, W.; An, D.; Wei, G.; Wang, H. Core autotrophic microbes drive functional stability of soil cbbL-containing autotrophic microbes during desertification. Appl. Soil Ecol. 2023, 190, 105027. [Google Scholar] [CrossRef]
  17. Cao, J.; Cheng, X.; Zeng, Z.; Yang, Z.; Liu, X.; Wang, H.; Ma, L.; Lu, X.; Su, C.; Huang, Q. Habitat specificity and co-occurrence network of bacterial communities in the Xincuntun Cave, Guilin, Guangxi. Chin. Sci. Bull. 2021, 66, 4003–4016. [Google Scholar] [CrossRef]
  18. Yang, Z.Q.; Cheng, X.Y.; Wang, H.M.; Zeng, Z.L.; Liu, X.Y.; Cao, J.; Su, C.T.; Huang, Q.B. Environmental driving mechanisms and community assembly process of bacterial communities in the Luohandu Cave, Guilin, Guangxi Province, China. Chin. Acta Microbiol. Sin. 2021, 61, 4118–4136. [Google Scholar]
  19. Xiang, S.; Li, Y.; Wang, W.; Zhang, B.; Shi, W.; Zhang, J.; Huang, F.; Liu, F.; Guan, X. Antibiotics adaptation costs alter carbon sequestration strategies of microorganisms in karst river. Environ. Pollut. 2021, 288, 117819. [Google Scholar] [CrossRef]
  20. Hügler, M.; Wirsen, C.O.; Fuchs, G.; Taylor, C.D.; Sievert, S.M. Evidence for autotrophic CO2 fixation via the reductive tricarboxylic acid cycle by members of the ε subdivision of Proteobacteria. J. Bacteriol. 2005, 187, 3020–3027. [Google Scholar] [CrossRef]
  21. Liu, S.; Li, X.; Fu, Y.; Li, P.; Qiao, J.; Li, H.; Wu, L.; Wang, B.; Lu, S. Exploring the effects of different fertilizer application durations on the functional microbial profiles of soil carbon and nitrogen cycling by using metagenomics in Paulownia plantations in a subtropical zone. Eur. J. For. Res. 2024, 143, 955–969. [Google Scholar] [CrossRef]
  22. Dong, Y.; Gao, J.; Wu, Q.; Ai, Y.; Huang, Y.; Wei, W.; Sun, S.; Weng, Q. Co-occurrence pattern and function prediction of bacterial community in Karst cave. BMC Microbiol. 2020, 20, 137. [Google Scholar] [CrossRef]
  23. Ma, L.; Huang, X.; Wang, H.; Yun, Y.; Cheng, X.; Liu, D.; Lu, X.; Qiu, X. Microbial interactions drive distinct taxonomic and potential metabolic responses to habitats in karst cave ecosystem. Microbiol. Spectr. 2021, 9, e0115221. [Google Scholar] [CrossRef] [PubMed]
  24. Xiao, D.; He, X.; Zhang, W.; Hu, P.; Sun, M.; Wang, K. Comparison of bacterial and fungal diversity and network connectivity in karst and non-karst forests in southwest China. Sci. Total Environ. 2022, 822, 153179. [Google Scholar] [CrossRef] [PubMed]
  25. Yan, Z.; Shen, T.; Li, W.; Cheng, W.; Wang, X.; Zhu, M.; Yu, Q.; Xiao, Y.; Yu, L. Contribution of microalgae to carbon sequestration in a natural karst wetland aquatic ecosystem: An in-situ mesocosm study. Sci. Total Environ. 2021, 768, 144387. [Google Scholar] [CrossRef] [PubMed]
  26. Chen, J.; Li, Q.; He, Q.; Schröder, H.C.; Lu, Z.; Yuan, D. Influence of CO2/HCO3− on microbial communities in two karst caves with high CO2. J. Earth Sci. 2023, 34, 145–155. [Google Scholar] [CrossRef]
  27. Sperlea, T.; Kreuder, N.; Beisser, D.; Hattab, G.; Boenigk, J.; Heider, D. Quantification of the covariation of lake microbiomes and environmental variables using a machine learning-based framework. Mol. Ecol. 2021, 30, 2131–2144. [Google Scholar] [CrossRef]
  28. Hermans, S.M.; Buckley, H.L.; Case, B.S.; Curran-Cournane, F.; Taylor, M.; Lear, G. Bacteria as emerging indicators of soil condition. Appl. Environ. Microbiol. 2017, 83, e02826-16. [Google Scholar] [CrossRef]
  29. Lewin, G.R.; Carlos, C.; Chevrette, M.G.; Horn, H.A.; McDonald, B.R.; Stankey, R.J.; Fox, B.G.; Currie, C.R. Evolution and ecology of Actinomycetota and their bioenergy applications. Annu. Rev. Microbiol. 2016, 70, 235–254. [Google Scholar] [CrossRef]
  30. Shi, J.; Jiang, G.; Sun, Z.; Guo, F.; Wang, Q.; Liu, F. Dissolved organic matter tracers reveal contrasting characteristics in the concentrated flow zone and matrix-with-fractures zone of a sulfate-contaminated karst aquifer in South China. Appl. Geochem. 2022, 146, 1054. [Google Scholar] [CrossRef]
  31. Jiang, X.T.; Zhang, H.; Sheng, H.F.; Wang, Y.; He, Y.; Zou, F.; Zhou, H.W. Two-Stage Clustering (TSC): A pipeline for selecting operational taxonomic units for the high-throughput sequencing of PCR amplicons. PLoS ONE 2017, 7, 30230. [Google Scholar] [CrossRef]
  32. Guo, L.; Wang, G.; Sheng, Y.; Shi, Z.; Sun, X. Groundwater microbial communities and their connection to hydrochemical environment in Golmud, Northwest China. Sci. Total Environ. 2019, 695, 133848. [Google Scholar] [CrossRef] [PubMed]
  33. Fan, Z.; Lu, S.; Liu, S.; Guo, H.; Wang, T.; Zhou, J.; Peng, X. Changes in plant rhizosphere microbial communities under different vegetation restoration patterns in karst and non-karst ecosystems. Sci. Rep. 2019, 9, 8761. [Google Scholar] [CrossRef] [PubMed]
  34. Parker, C.W.; Wolf, J.A.; Auler, A.S.; Barton, H.A.; Senko, J.M. Microbial reducibility of Fe(III) phases associated with the genesis of iron ore caves in the iron quadrangle, Minas Gerais, Brazil. Minerals 2013, 3, 395–411. [Google Scholar] [CrossRef]
  35. Jones, D.S.; Macalady, J.L. The snotty and the stringy: Energy for subsurface life in caves. In Their World: A Diversity of Microbial Environments; Springer: Berlin/Heidelberg, Germany, 2016; Volume 1, pp. 203–224. [Google Scholar]
  36. Lyu, X.; Shen, C.; Xie, J.; Fu, Y.; Jiang, D.; Hu, Z.; Tang, L.; Tang, L.; Ding, F.; Li, K.; et al. A “footprint” of plant carbon fixation cycle functions during the development of a heterotrophic fungus. Sci. Rep. 2015, 5, 12952. [Google Scholar] [CrossRef] [PubMed]
  37. Berg, I.A.; Kockelkorn, D.; Ramos-Vera, W.H.; Say, R.F.; Zarzycki, J.; Hügler, M.; Alber, B.E.; Fuchs, G. Autotrophic carbon fixation in archaea. Nat. Rev. Microbiol. 2010, 8, 447–460. [Google Scholar] [CrossRef]
  38. Huber, H.; Gallenberger, M.; Jahn, U.; Eylert, E.; Berg, I.A.; Kockelkorn, D.; Eisenreich, W.; Fuchs, G. A dicarboxylate/4-hydroxybutyrate autotrophic carbon assimilation cycle in the hyperthermophilic Archaeum Ignicoccus hospitalis. Proc. Natl. Acad. Sci. USA 2008, 105, 7851–7856. [Google Scholar] [CrossRef]
Figure 1. (a) Location of Shiziyan Cave. (b) Schematic diagram of the horizontal profile of the ecosystem of Shiziyan Cave and the sampling points inside the cave.
Sustainability 16 07357 g001
Figure 2. The top ten phyla in relative abundance across habitat samples in the Shiziyan cave system.
Sustainability 16 07357 g002
Figure 3. Heatmap of species abundance of carbon cycle-associated bacterial genera. The abbreviations in the figure are as follows: AC: air samples; CJW: cave sediment samples; DXDS: drip water samples; DXHS: underground river water samples; and FHYB: weathered rock wall samples.
Sustainability 16 07357 g003
Figure 4. The principal coordinate analysis (PCoA) of systematic samples based on the Bray–Curtis method.
Sustainability 16 07357 g004
Figure 5. Screening of dominant carbon-sequestering strains. HX1, 2, and 3 represent the first isolation, the second isolation, and the third isolation of the T-streak method, respectively. FHYB, DXHS, DXDS, CJW, and AC represent the habitat of weathered rock wall, underground river water, cave drip, cave sediment, and cave air, respectively. The vertical coordinate indicates the number of dominant strains screened.
Sustainability 16 07357 g005
Figure 6. Boxplots of underground river water and sediment samples on diversity. (a) Chao1 index, (b) ACE index, (c) Shannon index, and (d) Simpson index.
Sustainability 16 07357 g006aSustainability 16 07357 g006b
Figure 7. Differential comparisons of the top ten phyla (a) and genera (b) in relative abundance across habitat samples in the cave’s underground river water (DXHS1, 2, and 3) and cave sediments (CJW1, 2, and 3). DXHS 1, DXHS 2, DXHS 3, and CJW 1, CJW 2, and CJW 3 represent different sampling points in the same habitat, respectively.
Sustainability 16 07357 g007
Figure 8. The correlation heatmap between microbes (based on genus level) and habitat factors in different habitats: (a) DXHS (cave underground river water) and (b) CJW (cave sediments).
Sustainability 16 07357 g008
Figure 9. The PICRUSt2 predicted function of bacteria among two habitats.
Sustainability 16 07357 g009
Figure 10. The second level top 20, which are relevant to the bacterial communities of the KEGG pathway.
Sustainability 16 07357 g010
Table 1. The sampling of different habitats in Shiziyan Cave.
HabitatTypeNameNumberLocation Point
FHYBweathered rock wall samplesQB-1, 22twilight zone
RB-1, 22dark zone
CJWsediment samplesQC-1, 2, 33twilight zone
RC-1, 22dark zone
DXDSdrip water samplesQD-1, 2, 33twilight zone
RD-1, 2, 33dark zone
DXHSunderground river water samplesQS-1, 22twilight zone
RS-11dark zone
ACair samplesAC-1, 22twilight zone
AC-3, 42dark zone
The abbreviations in the table are as follows: QB: weathered rock wall in twilight zone; RB: weathered rock wall in dark zone; QC: sediments in twilight zone; RC: sediments in dark zone; QD: drips in twilight zone; RD: drips in dark zone; QS: underground river water in twilight zone; RS: underground river water in dark zone; AC: air inside the cave.
Table 2. Physicochemical parameters of samples from various habitats in the Shiziyan cave system.
Sample TypesNum.pHTOC (%)TIC (%)K+ (mg/L)Na+ (mg/L)Ca2+ (mg/L)Mg2+ (mg/L)Cl (mg/L) NO 3 (mg/L) SO 4 2 (mg/L)
CJWCJW17.155.502.640.590.56149.923.391.9317.925.80
CJW27.634.292.431.781.9896.384.652.6120.2312.74
CJW37.676.602.220.730.3199.021.862.1315.094.18
DXHSDXHS17.622.252.38Na 1Na 153.101.061.856.374.07
DXHS27.602.530.210.050.0239.311.642.5411.3310.95
DXHS37.553.022.230.160.135.820.434.7010.8314.00
Na 1 Indicates that the concentration of the sample is below the detection limit. CJW1, 2, and 3: cave sediment samples in different locations. DXHS1, 2, and 3: cave underground river water samples in different locations.
Table 3. Alpha diversity indices of individual habitat samples in Shiziyan Cave.
HabitatsChao1ACEShannonSimpson
FHYB514.82 ± 28.42 bc514.43 ± 27.86 bc4.41 ± 0.33 bc0.94 ± 0.03 ab
DXHS644.72 ± 168.81 abc646.30 ± 170.28 abc5.28 ± 0.07 ab0.99 ± 0.00 a
DXDS997.20 ± 165.14 ab993.10 ± 164.10 ab5.38 ± 0.33 a0.97 ± 0.02 a
CJW1174.96 ± 240.50 a1180.60 ± 242.37 a6.00 ± 0.16 a0.99 ± 0.00 a
AC138.58 ± 47.79 c135.66 ± 42.55 c1.26 ± 0.19 c0.50 ± 0.03 b
In the table, the values are standard errors of the mean (mean ± standard error) (n ≥ 3). Different lowercase letters (a–c) in each row indicate significant differences (p < 0.05).
Table 4. Morphological description of dominant colonies.
NameHabitatScientific NameGram StainColony DescriptionSEM Observation
DXHS-31FHYBMicrobacterium zeaepositiveyellow, and the diameter of single colony is about 1 mmshort rod with a smooth surface
DXDS-21DXDSParacoccus aeriusnegativeyellow, and the diameter of single colony is about 4.5 mmball-shaped with an uneven surface
DXHS-11DXHSArthrobacter busseipositiveorange, and the diameter of single colony is about 3 mmshort rod with an uneven surface
CJW-11CJWAgromyces arachidispositiveyellow, and the diameter of single colony is about 2.5 mmoval-shaped with an uneven and crumpled surface
CJW-13CJWMicrobacterium flavescenspositivelight yellow, and the diameter of single colony is about 1.5 mmshort rod with a smooth surface
CJW-21
Disclaimer/Publisher’s Note: The statements, opinions and data contained in all publications are solely those of the individual author(s) and contributor(s) and not of MDPI and/or the editor(s). MDPI and/or the editor(s) disclaim responsibility for any injury to people or property resulting from any ideas, methods, instructions or products referred to in the content.

