Article

Enhancing Sustainability through Weather Derivative Option Contracts: A Risk Management Tool in Greek Agriculture

by
Angelos Prentzas
1,
Thomas Bournaris
1,*,
Stefanos Nastis
1,
Christina Moulogianni
1 and
George Vlontzos
2
1
Department of Agricultural Economics, Aristotle University of Thessaloniki, 54124 Thessaloniki, Greece
2
Department of Agriculture, Crop Production and Rural Development, University of Thessaly, 38446 Volos, Greece
*
Author to whom correspondence should be addressed.
Sustainability 2024, 16(17), 7372; https://doi.org/10.3390/su16177372
Submission received: 10 July 2024 / Revised: 23 August 2024 / Accepted: 24 August 2024 / Published: 27 August 2024

Abstract

:
This paper investigates the efficacy of weather derivatives as a risk management tool in the agricultural sector of Naousa, Greece, focusing on tree crops sensitive to temperature variations. The specific purpose is to assess how effectively weather derivative options can mitigate financial risks for farmers by providing strategic solutions. The study assesses the strategic application of Heating Degree Days (HDD) index options and their potential to alleviate economic vulnerabilities faced by farmers due to temperatures fluctuations. Employing different strike prices in Long Call and Straddle options strategies on the HDD index, the research offers tailored risk management solutions that cater to varying risk aversions among farmers. Moreover, the study applies the Value at Risk (VaR) methodology to quantify the financial security that weather derivatives can furnish, revealing a significantly reduced probability of severe financial losses in hedged scenarios compared to no-hedge conditions. Results show that all implemented strategies effectively enhance financial outcomes compared to scenarios without hedging, highlighting the exceptional utility of weather derivatives as risk management tools in the agricultural sector. Strategy 4, which exhibits the lowest VaR, emerges as the most effective, providing substantial protection against adverse weather conditions. This research supports the notion that weather derivatives can substantially contribute to the economic sustainability of rural economies, influencing policy decisions toward enhancing financial instruments for risk management in agriculture.

1. Introduction

It is an undeniable fact that weather significantly impacts the global economy, either directly or indirectly [1]. Many sectors are directly correlated with the weather, one of the most important being the agricultural sector [2]. Fluctuations in weather conditions affect almost the entire range of agricultural products, with the economic impact being visible to both farmers and consumers through changes in supply and demand. For example, the negative impact of weather on agricultural products can have a negative effect on a multitude of stakeholders such as farmers, energy providers, supply chains, and industries related to the agricultural sector [3,4,5,6].
Due to the effects of climate change, various extreme weather events, including floods, hurricanes, and tornadoes, frequently result in near-total destruction of agricultural production [7,8]. While such events are infrequent, they result in substantial income losses for farm owners. Conversely, non-destructive weather-related losses occur more frequently, although the deviations from normal weather conditions are generally not significant [9,10].
The weather variations caused by climate change are expected to increase in the future [11], with different risk management tools playing a particularly important role in safeguarding farmers’ incomes. Some risk management strategies based on climate change include crop diversification, which involves planting a variety of crops rather than relying on a single crop. This approach reduces the risk of total crop failure from extreme weather events [12]. Additionally, the use of climate-resilient crop varieties—those bred to withstand specific climate stresses such as drought, heat, or floods—can help ensure agricultural productivity under changing climatic conditions [13]. The most common risk management practice in the agricultural sector is traditional crop insurance, which help, to a certain extent, to cover significant losses from extreme weather events, but does not adequately addressing the economic impacts of moderate suboptimal weather conditions [14].
One of the main limitations of traditional insurance is that it typically requires farmers to insure their entire production, even though they might prefer to insure only a portion of it [8]. Furthermore, various crop insurance packages are often unsuitable for covering weather risks, particularly when significant natural risks are absent or the risks involve infrequent phenomena, lacking a justifiable basis for insurance coverage [8,15,16]. In addition, the subjectivity in the assessment of losses by each insurance carrier’s assessor not only creates doubts for producers, but also increases the cost of insurance administration in many cases. Moreover, crops are not fully compensated after extreme weather events. The impact of climate change on weather predictability poses challenges for insurers and policyholders, as insurers often lack clear cause-effect relationships due to insufficient historical data [15,17] and those insured exaggerate the actual losses that hit their crops with the ulterior motive of receiving higher compensation [18,19]. This highlights the difficulty of establishing a fair and transparent definition of insurance between the two contractors [19].
All of the above raises questions and concerns about existing insurance schemes, making room for the development of new risk management strategies that are capable of dealing effectively with different constraints, but also providing more flexibility in terms of the risks to be addressed with a much fairer pricing system.
One risk management tool capable of addressing these constraints is weather derivatives, which are contracts whose payment depends on weather events [20]. These instruments can be integrated with existing risk management tools such as insurance because they provide a financial mechanism to hedge against specific weather-related risks that traditional insurance products may not cover. By leveraging statistical data on weather patterns and their impact on agricultural productivity, weather derivatives offer a targeted response to the financial risks posed by climate variability. This integration allows insurers to combine traditional coverage with weather derivatives, creating a more comprehensive risk management strategy that addresses both frequent minor weather fluctuations and less common catastrophic events. This hybrid approach not only enhances the resilience of agricultural enterprises against climate-induced uncertainties but also stabilizes the financial landscape for insurers by diversifying risk portfolios and minimizing exposure to individual claim events. Common forms of weather derivatives include options, swap contracts, and forward contracts [21]. They are traded both on over-the-counter markets and in organized exchanges and their usage is increasing globally [14].
Weather derivatives were first developed in the United States in relation to the energy sector, where demand and supply are influenced by variations in temperature [8]. In addition, they have been used by a variety of weather-related sectors of the economy with particularly important results [8,22]. Weather derivatives ensure a high degree of objectivity because they are triggered by measurable natural events, such as temperature changes, and are based not on estimates but on objective measurements. In addition, as the underlying proxy (climate indicator) is not tradable as a financial proxy, the value is unaffected by the dynamics of the capital market [8]. The absence of required proof of insurance relevance permits other companies to leverage weather derivatives to manage weather-related risks [23,24].
The agricultural sector’s dependence on weather conditions surpasses that of other sectors, a relationship underscored by the Common Agricultural Policy (CAP). The CAP’s primary goals include ensuring food security and supporting farmers sustainably, both economically and environmentally [2]. The direct impact of weather events on crop yields and the intricate correlation between them have been extensively studied [25,26]. Crop yields are affected by different meteorological elements, including temperature, rainfall, hail, and frost [27].
The use of weather derivatives in agriculture has been explored by various studies as a risk management strategy. For example, a paper by Ender and Zhang [28] analyzed the effectiveness of temperature-based derivatives for hedging against fluctuations in agricultural income due to adverse temperatures in China. In other research, weather derivatives are also emerging as a promising tool for farmers, offering an alternative to traditional insurance methods and recognizing the effectiveness of weather derivatives in rainfall events in wheat production in North-East German [21]. Additionally, Sharma and Vashishtha [29] discussed the limitations of traditional risk management tools in the agriculture and power sectors in India, proposing weather derivatives as a viable solution.
From another perspective, weather derivatives have proven effective on a northern German farm experiencing limited water supply and high costs, not only mitigating income uncertainty due to water restrictions but also facilitating varied farm designs [30]. Similarly, in tree crops like nectarines, grapes, and almonds, weather derivatives have stabilized farm incomes through the strategic use of long put and long call option contracts [31].
The aforementioned research suggests that weather derivatives can significantly reduce income volatility among farmers. Although the recognized potential of weather derivatives as a risk management tool in agriculture is well-documented, their practical application within the Greek agricultural context, especially in areas predominantly engaged in tree crop cultivation, remains insufficiently investigated. This gap is particularly critical considering Greece’s exposure to climatic fluctuations and the substantial role that agriculture plays in the national economy. Prior research has fallen short in closely examining the customization of weather derivatives to meet the distinctive weather and economic realities faced by Greek agricultural producers. The present research attempts to examine the use of weather derivatives in one of the most important regions of Greece in terms of tree crops. This study focuses on Naousa, a key region for tree crops in the regional unit of Imathia, which has a robust export presence. In Imathia, the Greek Agricultural Insurance Organization (ELGA) compensates farmers for natural disasters, yet many still face significant operational restrictions. Given the critical role of ELGA in providing insurance services to the Greek agricultural sector, this study explores weather derivatives as an additional tool to help farmers reduce the uncertainty caused by extreme weather events.
The paper is organized into five main sections. Section 1 lays the groundwork by introducing the potential contributions of weather derivatives to risk management in agriculture. Section 2 details the study’s methodology, covering the study area, the temperature data utilized, the processes of pricing weather derivatives, the design of various option strategies, and an explanation of the Value at Risk (VaR) methodology. Section 3 presents the empirical results, and Section 4 discusses the implications of these findings. Finally, Section 5 summarizes the study’s conclusions, encapsulating the core insights and implications of the research.

2. Materials and Methods

This study was developed to design and assess weather derivatives as risk management tools within an important agricultural region of Greece, particularly focusing on their effectiveness during extreme weather events. The methodology of the present research is the examination of weather temperature indicators and their modelling through the Burn analysis. Then, based on the different option and strike price strategies, a comparison of their effectiveness is made.
The most common underlying weather indicators are those of temperature, precipitation, and wind speed. As weather derivatives of temperature, three indicators are important: Heating Degree Days (HDD), Cooling Degree Days (CDD), and Cumulative Mean Temperature (CAT) [2,10,32]. In addition, the Rainfall Index measures the amount of rainfall in a given period [33], while the Wind Index (CAWS) calculates the sum of daily averages over a designated time frame [34]. The rationale for selecting Heating Degree Days (HDD) as the primary indicator over other indices such as Cooling Degree Days (CDD) or precipitation indices is grounded in the specific vulnerability of tree crops to temperature variations, particularly cold stress. HDD is particularly relevant in regions where cold weather poses a significant risk to agricultural productivity, making it a more critical measure for assessing potential crop damage and financial risk than CDD, which is more relevant in hotter climates.
In the context of the present study, the indicator chosen for examination is Heating Degree Days (HDD), which is a measure of how cold a day was in a specified period of time. HDD measures the number of degrees that a day’s average temperature is below a certain threshold (usually 65 °F or 18 °C). Higher HDD values indicate colder weather, and thus more heating is needed. In agriculture, especially in crops sensitive to frost, a high HDD value could imply a greater risk of frost damage, as it indicates a larger number of colder days. Low temperatures can cause significant problems in crop yields, especially in orchards containing apple, peach, nectarine, and acorn crops [35].
Tree crops are cultivated in the regional unit of Imathia. Through Heating Degree Days (HDD), economic compensation is provided when temperatures fall below a critical threshold (reference price), offering protection to revenues from yield losses due to frosts, especially in winter months [14,36,37,38,39,40]. By using the Heating Degree Days (HDD) index, farmers can achieve more predictable financial planning, helping to cope with uncertainty [14,41,42].

2.1. Pricing Weather Derivatives

In the present research, the Burn analysis method is used for the pricing of options [14,42,43]; it is based on historical data from weather events in the municipality of Naousa in the regional unit of Imathia. Based on previous years’ daily temperature data, the strike price, premium, and payoffs can be calculated. The Heating Degree Days (HDD) index has been used in numerous studies [14,41,42]. The HDD index for a given day is calculated according to the following formula:
d a i l y   H D D ( t ) = m a x ( T b a s e T ( t ) , 0 )
The base date (Τbase) is usually 18 °C [44]. T(t) denotes the daily mean temperature, which is determined by taking the average of the highest and lowest temperatures of the day as in the formula below:
T t = T m a x + T m i n 2
Since weather derivatives are not traded in the market, three variables must be determined in order to set their price, such as the strike value, the tick size, and the spot value of the index [2,21]. The strike prices for weather derivatives follow the following forms [14,23,45,46]:
A : Χ = p e r i o d   a v e r a g e   H D D
B : X = p e r i o d   a v e r a g e   H D D s t a n d a r d   d e v i a t i o n   o f   p e r i o d   H D D 2
Γ : X = p e r i o d   a v e r a g e   H D D + s t a n d a r d   d e v i a t i o n   o f   p e r i o d   H D D 2
The weather derivatives are based on the total Heating Degree Days (HDD) accumulated in a specific period, which in the context of this research is the period from 15 December to 15 April. Farmers have the option to engage in two types of derivative contracts: call options and put options. These contracts provide the right, but not the obligation, to buy or sell a predefined amount of the HDD index at a predetermined strike price. Under a call option, the farmer receives payment when the HDDT is greater than the strike price, and for a put option, when the HDDT is less than the strike price. The payment of the specific period is calculated according to the following types [2]:
E x p e c t e d   p e r i o d   p a y o f f c a l l = m a x   ( 0 , H D D T K ) t i c k   s i z e
E x p e c t e d   p e r i o d   p a y o f f p u t = m a x   ( 0 , K H D D T ) t i c k   s i z e
The HDDT element represents the final count of Heating Degree Days at the end of the contract. The previous equations multiply the Heating Degree Days (HDD) over the specified period by the tick size. The tick size is set at EUR 1.
The fair premium can be quantified using the Burn analysis method, which calculates expected payoffs based on historical data, assuming that past weather patterns are indicative of future trends. The expected payoffs are then adjusted on the basis of present values, where r is the risk-free rate and T is the option’s time to maturity, which in the present study is 5 months, the duration of the contract. This approach aims to establish a fair insurance premium, achieving a price equilibrium where neither the buyer nor the seller can expect to profit from arbitrage. The type of premium calculation is given below [2,14]:
o p t i o n   p r e m i u m = e r T 1 n i = 1 n p i
The risk-free interest rate used was the yield of the Greek government bond for 30 years maturity (3.76%).

2.2. Design of Different Option Strategies

The next phase involves designing various option strategies. With the Long Call option, farmers are safeguarded against excessively low temperatures. By choosing this type of option and paying the premium, a farmer can profit if colder temperatures lead to an HDDT index value exceeding the strike price K during the expiration period T. In this scenario, the buyer of the option stands to gain potentially unlimited profits, with the only risk being the loss of the premium paid. On the other hand, the seller of the insurance policy assumes the risk of the option (writer), where in cases where the actual price of the HDDT index is lower than the strike price, he receives the premium. HDD options are usually of the European type, which can only be exercised during the T-period.
The Long Straddle option was also examined. This option works by using a combination of a Long Put and a Long Call with the same strike price K but with a double insurance cost (pL and cL) [2,14]. Typically, this type of contract is more expensive but proves advantageous in scenarios involving extreme temperatures or significant temperature volatility. Tree crops are sensitive to temperature fluctuations, requiring specific conditions for optimal development and to the need to guard against unfavorable weather.
First, late spring frosts can destroy young flowers and drastically reduce the season’s harvest [35]. By selecting a call option, farmers are covered by the large Heating Degree Days (HDD) index values, which indicate colder conditions. When the HDD exceeds the strike price, the call option is triggered, providing payments that compensate for frost damage losses [36].
On the other hand, many tree crops, such as apples, cherries, and peaches, need a certain number of hours of chilling during winter to properly break dormancy and enhance healthy bud growth [47]. When winters are unusually warm, failure to meet these chilling requirements can lead to poor fruit set and reduced yields. By choosing a put option, farmers can compensate for the risk of not accumulating the required cooling hours needed by the crops. By using the Long Straddle strategy [48], farmers can effectively manage both ends of the temperature spectrum: frost conditions and not enough cold.

2.3. Value at Risk (VaR) Methodology

This study uses the Value at Risk (VaR) methodology to quantify the potential economic losses associated with not hedging but also with various weather derivatives strategies designed to mitigate risk in tree crop production in the Naousa region. The central hypothesis of this study is that weather derivatives reduce financial losses for farmers in Naousa compared to non-hedging scenarios. This is tested using the Value at Risk (VaR) methodology, which assesses the economic impact of six derivative strategies with varying strike prices. Key strategies include Long Call and Straddle options based on the Heating Degree Days (HDD) index. The Long Call mitigates risks of cold weather by fixing heating costs, influencing crop yields. The Straddle option, using different strike prices, covers temperature extremes, essential in Naousa’s variable climate. These strategies, fundamental to the VaR approach, enable tailored financial protection against temperature shifts, quantifying risk reduction effectively.
The Value at Risk (VaR) methodology has been extensively used in analyzing the risk-reducing performance of weather derivatives by comparing farmers’ returns with and without such contracts [48], to assess and manage risk in weather derivatives portfolios [49], to quantify potential weather-related losses [40], and to assess financial risk by determining the maximum potential loss at different confidence levels, which helps to evaluate the effectiveness of climate zone-based contracts versus city-based contracts for Growing Degree Days (GDD) [50].
Initially, the application of the Value at Risk (VaR) methodology involved calculating the value without hedging and the value after applying six weather derivative strategies. Specifically, for the non-hedged scenario, the production quantities of major tree crops within the Naousa Municipality area were multiplied by the producer prices annually for each growing season. This procedure was carried out for each growing season. Areas cultivating small quantities of tree crops were not included in the calculations.
Similarly, to evaluate the contribution of each weather derivative strategy using the HDD index, the calculation of profits and losses for each strategy were performed. More specifically, each strategy was applied to each acre of tree crop for winter contracts between 15 December and 15 April over the years 2010 to 2021. For each acre, the expected payoff was calculated after subtracting the premium, in accordance with actual HDD values of each winter season. Subsequently, the economic results were compiled, comparing outcomes between the scenario without hedging and each of the six strategies.
The analysis is conducted at a 95% confidence level, allowing an assessment of the relative effectiveness of each hedging strategy in reducing potential financial exposure to climate risks.
The VaR for each strategy is calculated based on the historical price and yield data as described above, and consists of the following equation:
V a R α = μ Ζ α × σ
  • μ is the mean (average) value the total market value of tree crops for all winter periods.
  • σ is the standard deviation of total market value of tree crops for all winter periods.
  • Ζα is the Z-value corresponding to the confidence level (95%).
  • VaRα represents the value at risk at the α confidence level, which represents the maximum expected loss.
In calculating VaR, it is pivotal to clarify the assumptions regarding the distribution of returns. For this analysis, returns are assumed to be normally distributed. This assumption impacts the results significantly because it assumes symmetrical data around the mean, simplifying the calculation of VaR by enabling the use of the mean and standard deviation to estimate potential losses.
This equation, which provides a statistical measure, will be used to evaluate and compare the financial risk associated with each of the six weather derivatives strategies and also with no hedging.

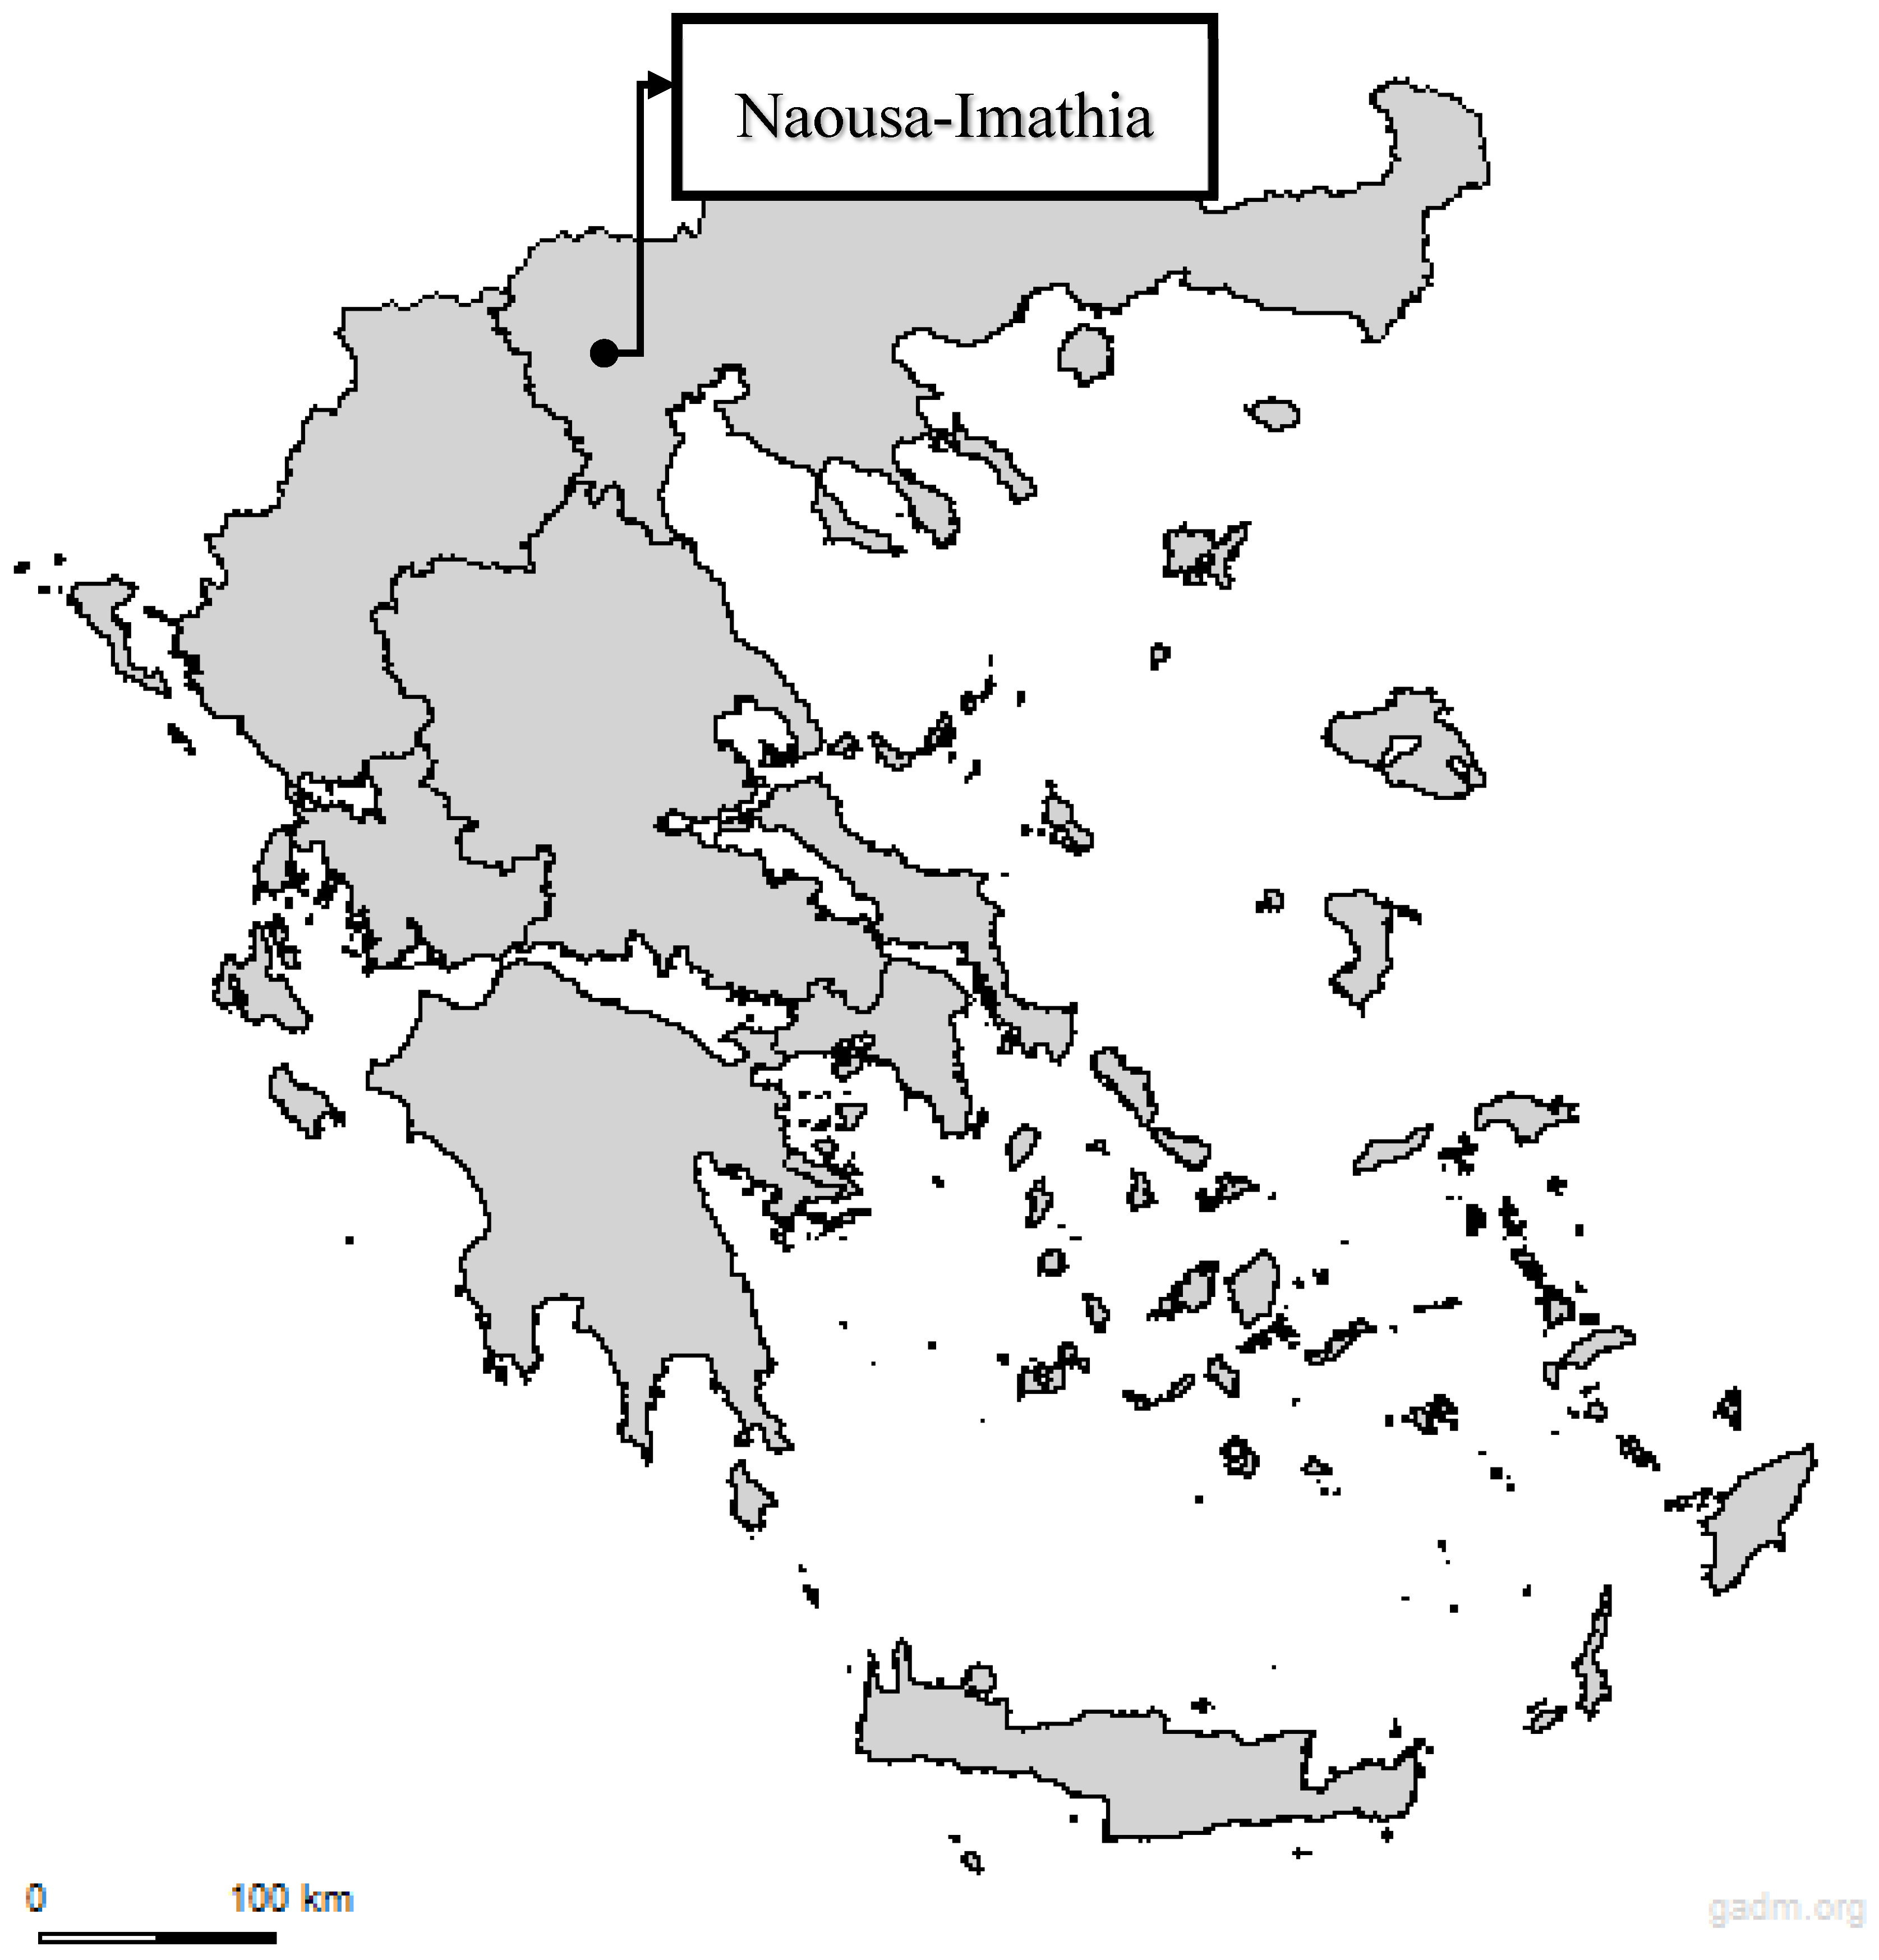
2.4. Study Area and Temperature Data

The study area of the research is the area of the municipality of Naousa in the regional unit of Imathia in Central Macedonia, Greece. The meteorological data were extracted from the databases of the Institute of Environmental Research and Sustainable Development, one of the three institutes that make up the Athens Observatory.
This study analyzes the temperature index using daily data from the Naousa region’s meteorological station for the years 2009–2023 to price options with Burn Analysis. Additionally, it examines the annual yields and their value of agricultural products for the period 2010–2021 to apply the Value at Risk (VaR) methodology. The chosen length of the historical data for temperatures is appropriate as it exceeds the minimum required data length of 10 years [43]. As the annual data are not large in number, it is considered appropriate to not perform detrending [43].
Based on the provided weather data (Table 1), significant fluctuations in temperature are observed during the transition months, particularly in spring (March–April) and autumn (October–November). During these months, the deviation between the average high and low temperatures is more pronounced, indicating a period of unstable weather conditions. For example, in April, the average high temperature is approximately 19.1 °C, while the average low is around 10.5 °C, showing a fluctuation of about 8.6 °C. These fluctuations can have varying impacts on agricultural practices, as they can lead to unpredictable weather patterns that may deviate from climatic norms. The extent of these deviations can affect the planning and implementation of risk management strategies for crops that are sensitive to temperature changes.
Extreme weather events, particularly those involving sharp temperature drops or unseasonal frosts, are most likely to occur in the late winter to early spring months (January–March). During these periods, tree crops such as apples, peaches, and cherries in the Naousa region (Figure 1) are particularly vulnerable, especially during critical growth stages like bud break and flowering. If temperatures fall below the required chilling hours or if a frost event occurs, it can lead to significant damage to the buds, reducing overall fruit set and yield. The use of weather derivatives, such as the Heating Degree Days (HDD) index, can provide financial protection to farmers during these vulnerable stages by compensating for losses caused by extreme cold conditions.

3. Results

In this section, the results of the different statistical characteristics of the HDD index, the six different strategies of weather derivatives, and the Value at Risk (VaR) tool for evaluating the effectiveness of various strategies are presented.

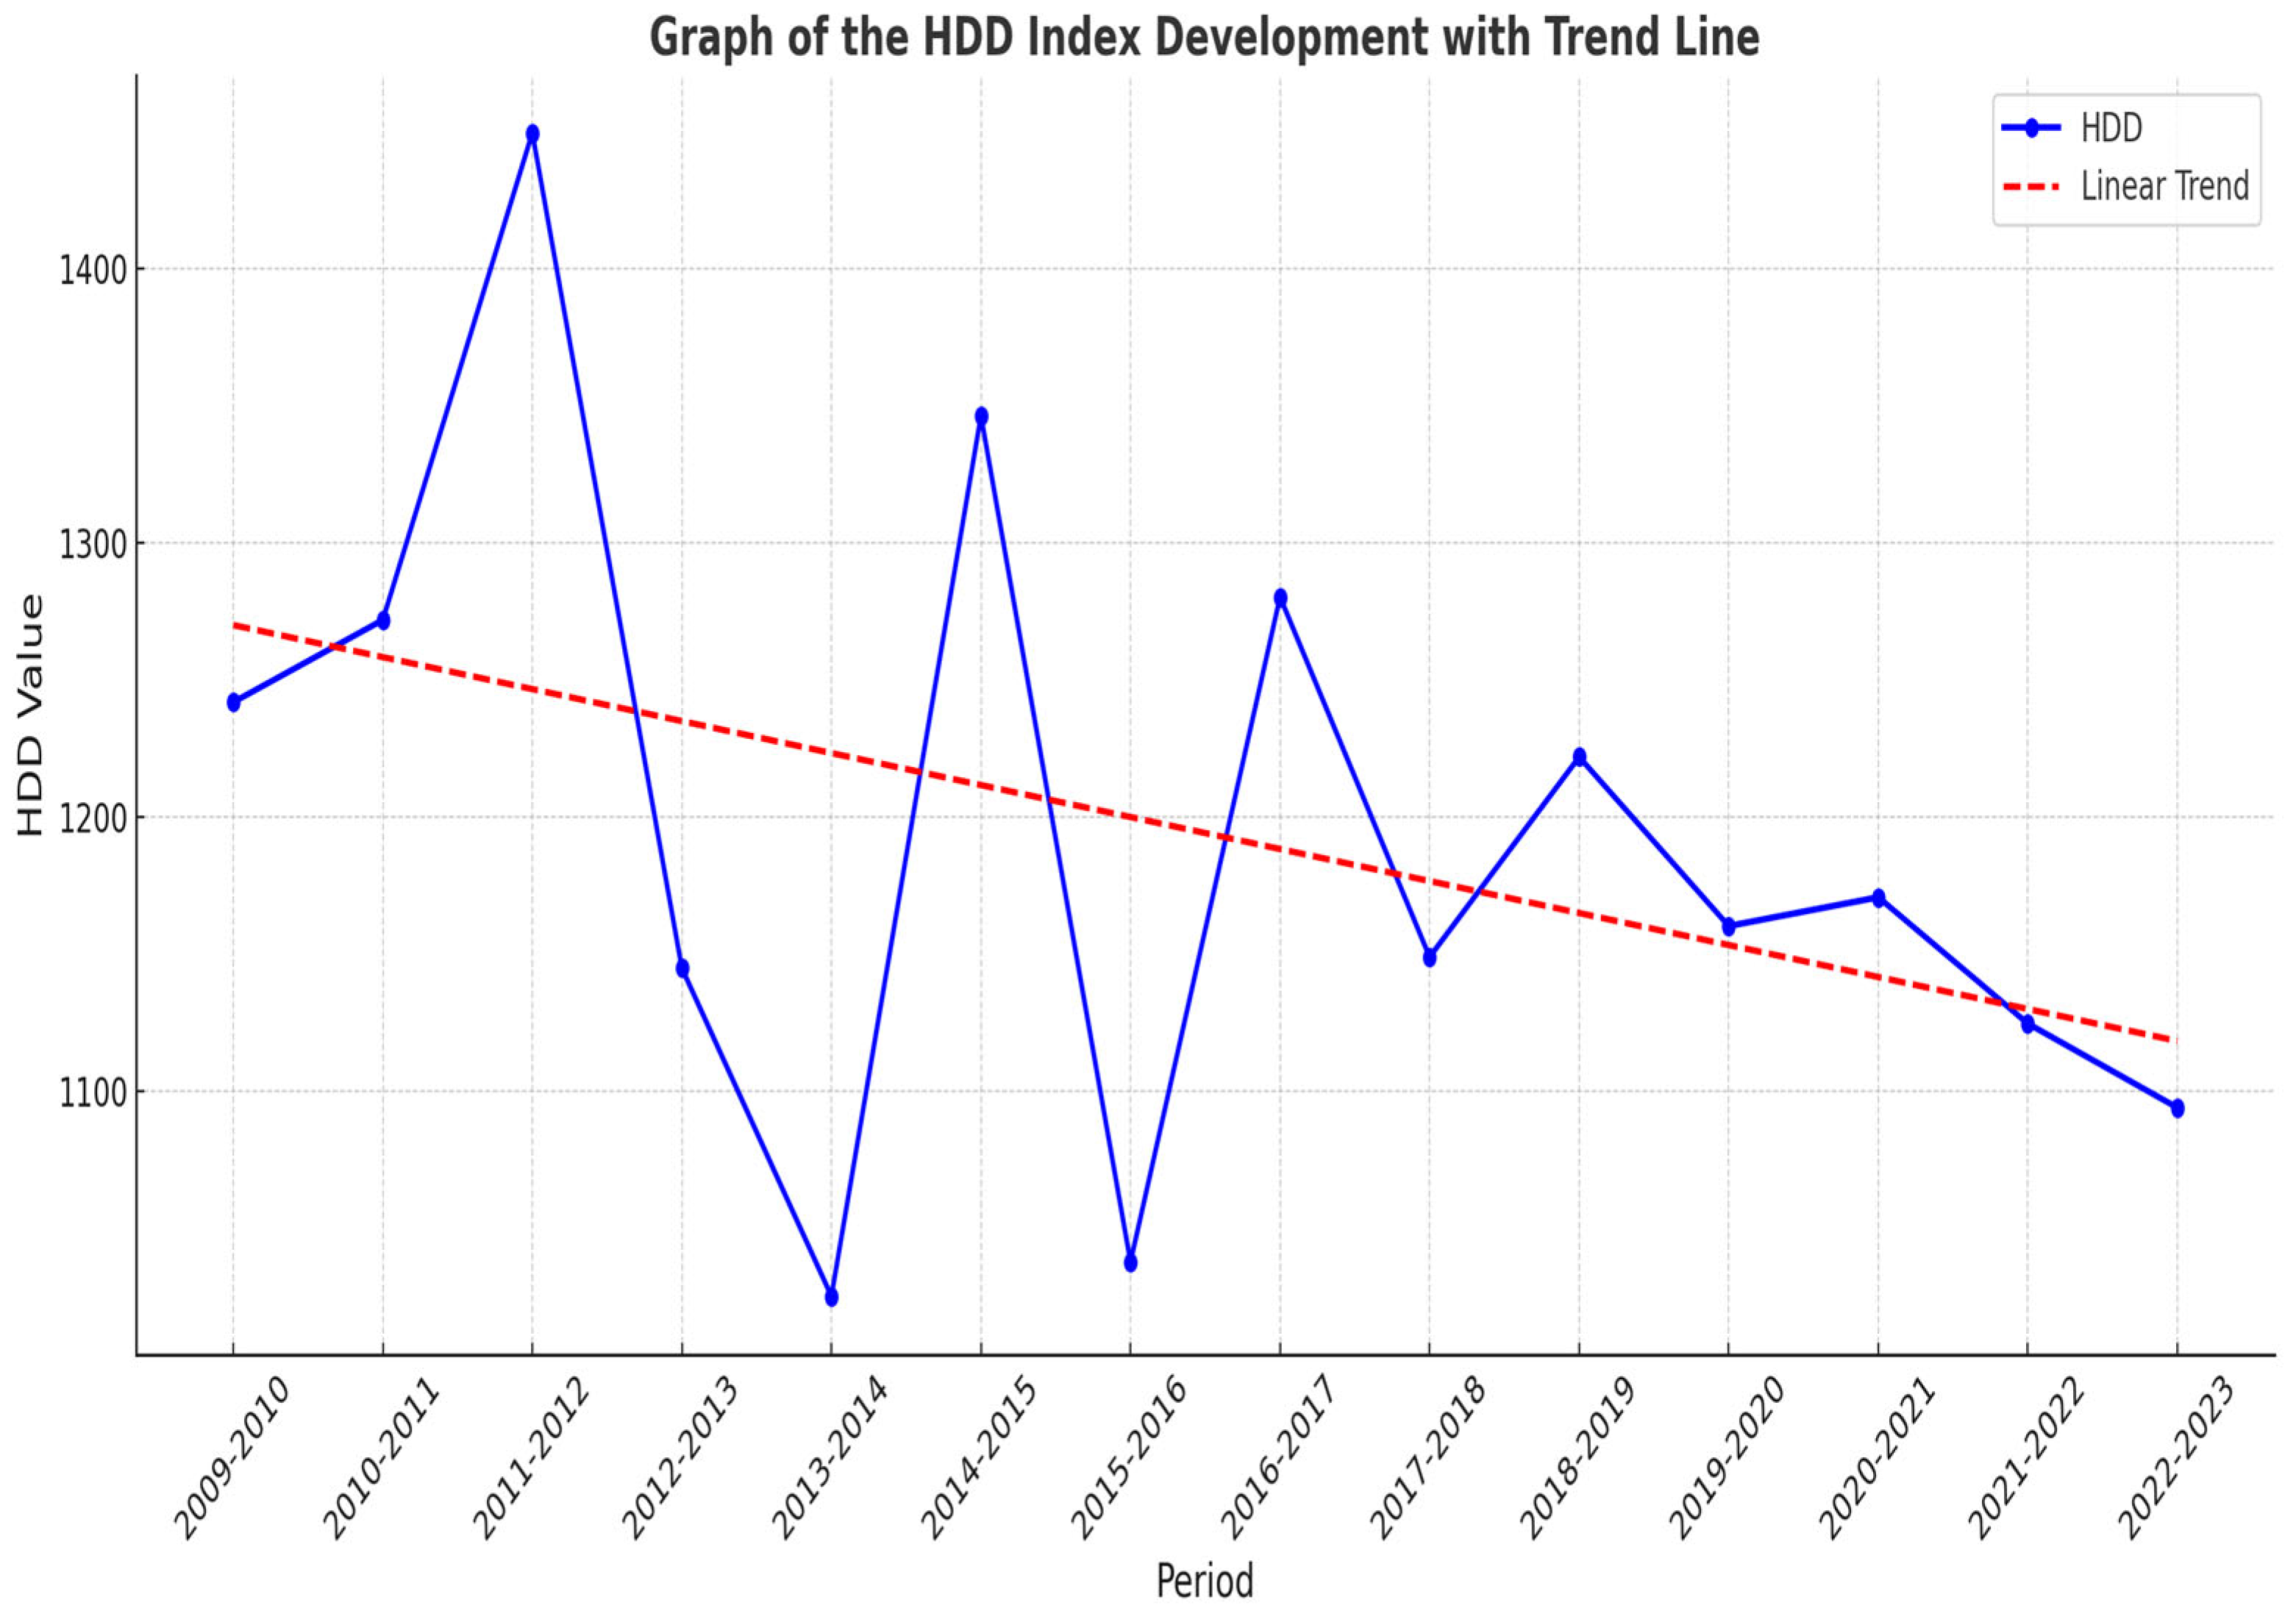
3.1. Basis Statistical Characteristics of HDD Index and the Graph of Index Development

Table 2 shows different statistical characteristics of the HDD index based on the previous 14 winter periods, between 15 December and 15 April, for the years from 2009 to 2023. The average of each winter period is 1194.1 HDD, with a minimum 1025.1 HDD and a maximum 1449.7 HDD. Also significant are the median of 1165.45 and the standard deviation of 117.39.
Figure 2 displays the total Heating Degree Days for each winter session. It is evident from the data that years with a high HDD sum are often followed by years with a lower sum, indicating significant variability in temperature. Additionally, recent years have shown a trend of lower HDD totals per winter season.

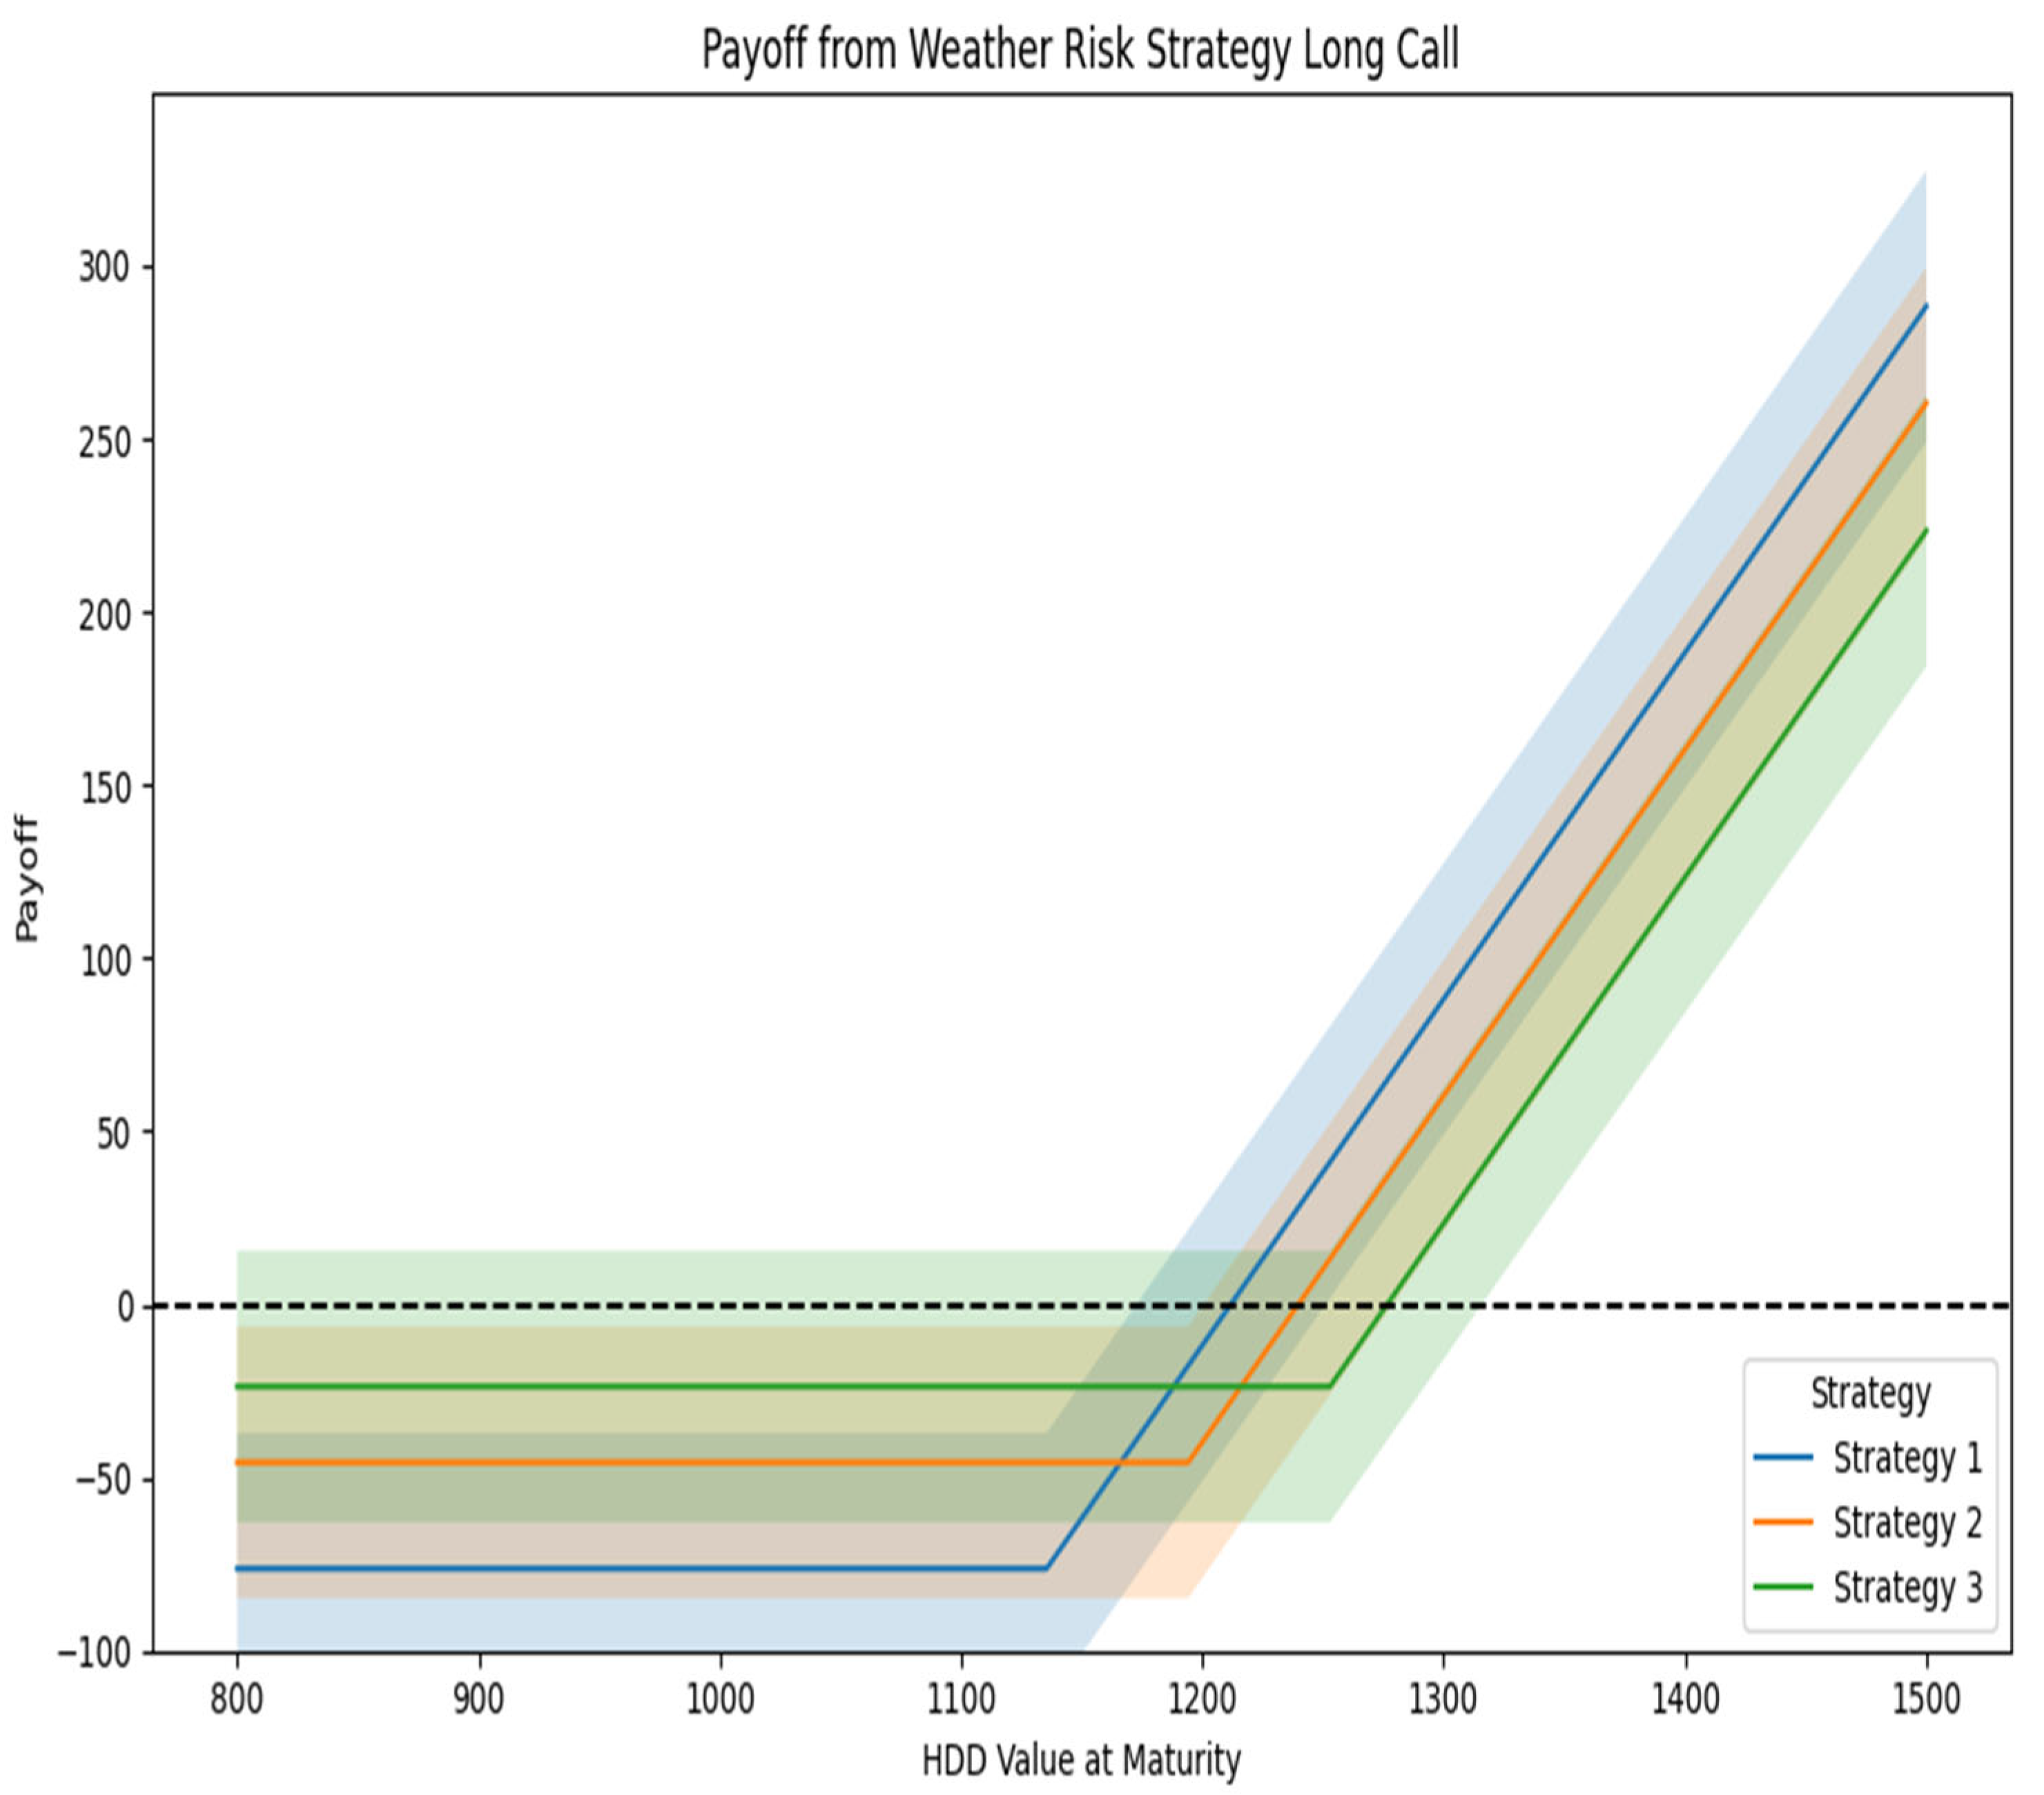
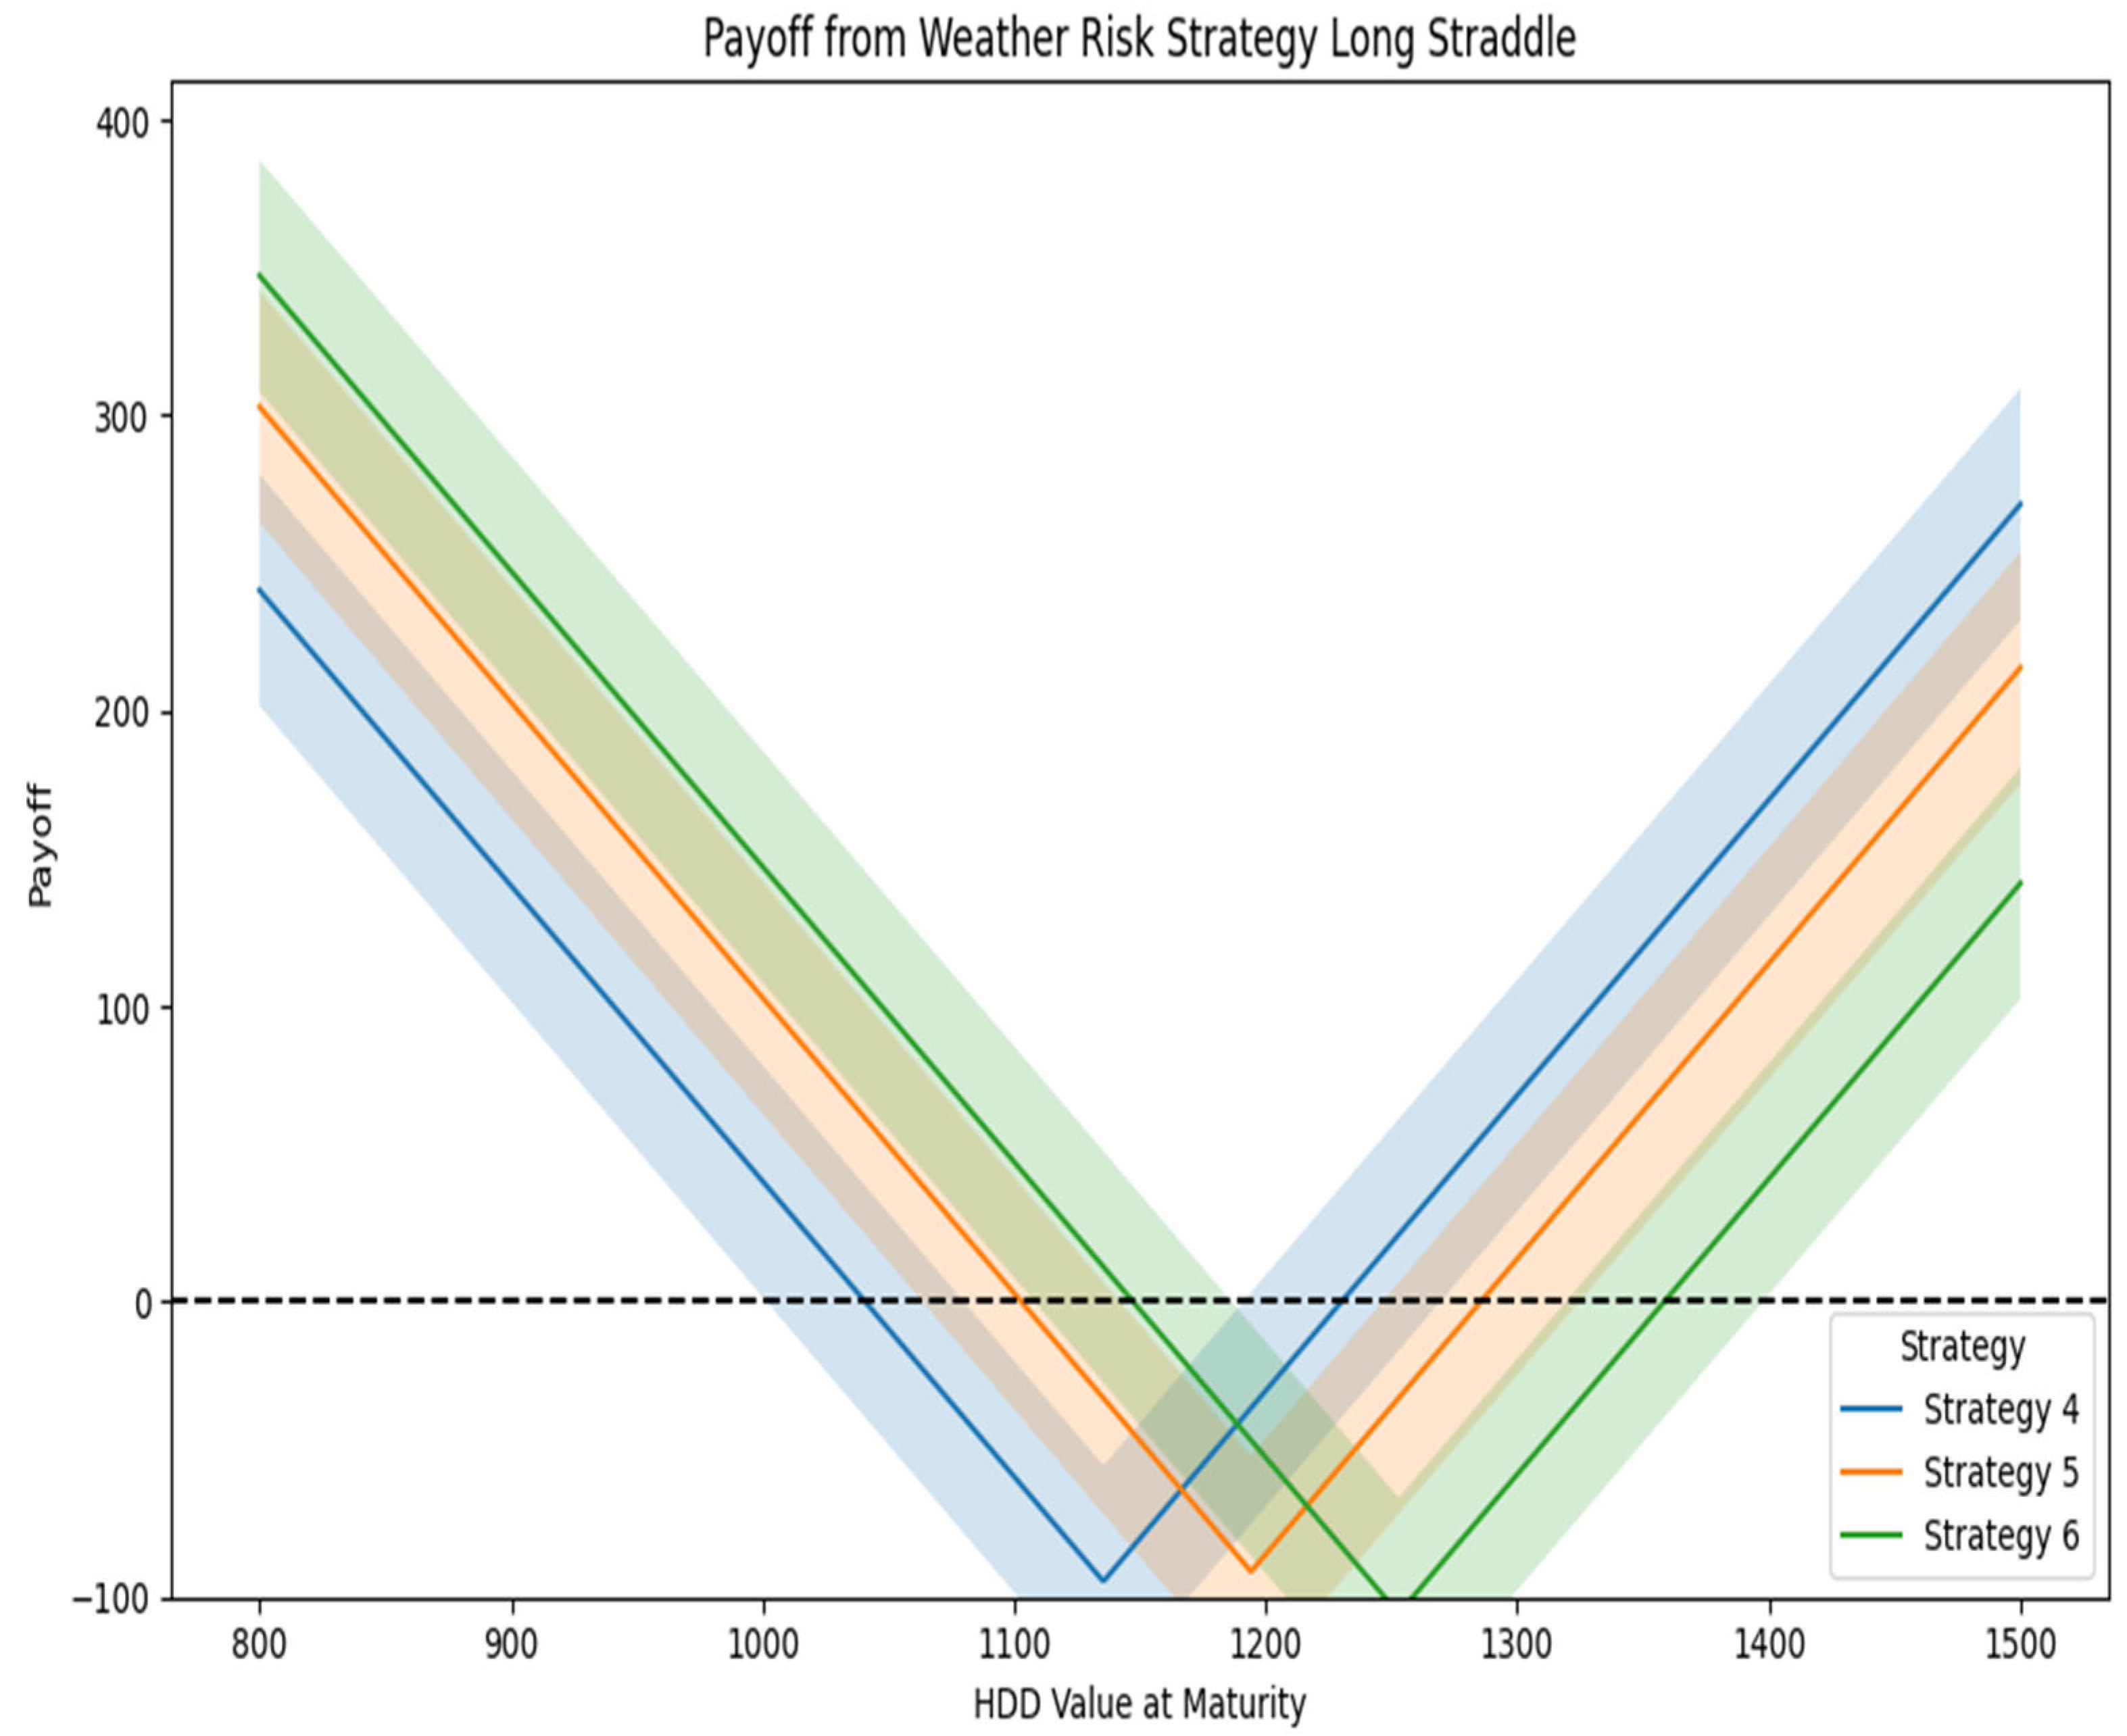
3.2. Analysis of HDD Options Strategies

In this study, six strategies featuring different strike prices were developed. The initial three strategies are Long Call options, each with a unique strike price and corresponding premium, while the remaining three are Straddle strategies, also featuring varied strike prices. Specifically, the first Long Call strategy has a strike price of 1135.44 with a premium of EUR 76.34, the second a strike price of 1194.1 with a premium of EUR 45.6, and the third a strike price of 1252.8 with a premium of EUR 23.7, as indicated in Table 3.
Utilizing options with varying exercise prices allows farmers to manage their risk exposure. In an option contract, a higher strike price typically results in a lower premium, but it also decreases the likelihood of a payout.
Strategy 1, with a lower strike price, yields a higher profit for the farmer when at maturity period T; the actual price of the HDDT index exceeds the strike price of 1135.4. The trade-off for the highest potential profit is the highest insurance premium paid by the buyer, making it ideal for those who are risk averse. Conversely, a low risk-averse farmer may be attracted to Strategy 3, which has a smaller insurance premium but less chance of it happening, as the actual value of the HDDT index must exceed the exercise price of 1252.8 in order to be triggered. Strategy 2 represents the middle path, which is the optimal option for a farmer with moderate tolerance to the risk. For each strategy, if HDDT-K then the payoff is HDDT-K-Premium of Call (cL). Conversely, if HDDT ≤ K (strike price), the farmer receives no payoff, losing the premium he has paid. Each scenario for Long Call strategies is presented in Table 4.
Figure 3 illustrates the comparison of payoffs resulting from Strategies 1, 2, and 3 across different levels of development of the HDD index value at the maturity date. The shaded areas around each strategy line represent the confidence intervals, which indicate the range of possible payoffs at each HDD level with a 95% confidence level. These intervals highlight the inherent uncertainty in predicting exact payoffs due to potential variability in the HDD index. As a result, the wider the confidence interval, the greater the uncertainty associated with that strategy’s payoff.
For the Long Straddle option, strategies 4, 5, and 6 were used with different strike prices K (Table 4). Long straddle strategy 4, with strike price 1135.44, is highly capable of protecting farmers from severe cold winters; it expects low temperatures by raising the threshold of HDD. Additionally, in strategy 4, warmer winter conditions are possible but are not as likely as colder conditions. This strategy is great for farmers who want to protect themselves from both cold and warmer winters, with an emphasis on extreme cold conditions. Conversely, Long Straddle strategy 6 is appropriate in conditions where extremely cold winters are possible but not highly likely, compared with warmer winters, where farmers expect lower temperatures during the winter. Strategy 5, with an intermediate strike price, is suitable for conditions of cold or warmer winters with an emphasis on their likelihood. In addition, each strategy presents a different premium for call (cL) or put (pL) options. The net payoff for each strategy equals the Long Straddle Payoff (LP) minus the combined premiums of the call (cL) and put (pL) options. These scenarios are detailed in Table 5.
Figure 4 illustrates the comparison of payoffs resulting from Strategies 4, 5, and 6 across different levels of development of the HDD index value at the maturity date. The figure also includes shaded regions around each strategy’s payoff curve, representing the 95% confidence intervals. These intervals indicate the range within which the actual payoff is expected to fall, considering the inherent uncertainty.

3.3. Hedging Effectiveness

As shown in Table 6, all strategies evaluated over the years collectively result in a higher production value compared to scenarios without hedging. The value of total tree crop production for the years in the period under consideration is higher with any strategy when compared to without hedging. The best strategies for hedging are 1 and 4, with a total of 227,346,673 and 227,331,213, respectively, compared to the scenario without hedging, which recorded a total of 223,329,946. Strategy 3 would increase benefits by EUR 4,016,727, while Strategy 1 would yield a slightly lower increase of EUR 4,001,267. Strategy 2 follows with an increase of EUR 3,068,337, with similar increases offered by strategies 4 and 5. Finally, Strategy 6 provides the smallest increase at EUR 1,125,773. However, it is important to consider that while these strategies enhance production value, they also involve economic costs and risks. These include the premiums paid for the options and the possibility that hedging may reduce overall profits in years where weather conditions do not trigger payouts.
Although the provided results bring positive results for an entire region as an entity, it is shown that they can provide risk hedging to any farmer affected by weather events by increasing the profits received from the use of weather derivatives.
The Value at Risk (VaR) approach was applied to compare the risk profiles of six different strategies and their evaluation for the mitigation of weather-related financial risks, as shown in Table 7. Initially, without any hedging, the VaR of EUR 11,706,580 represents the maximum expected loss for the region’s tree crop values that could occur in the worst 5% of cases within a year. This is calculated based on historical data on prices and production levels over several years.
A lower VaR across the six strategies suggests a reduced likelihood of incurring substantial financial losses (Table 6). For instance, a strategy with a significantly lower VaR is considered more effective in risk mitigation. All strategies offer effectiveness in reducing financial risk relative to not hedging. Strategy 4 demonstrates the lowest VaR among the remaining strategies, offering protection against adverse weather conditions, followed by strategy 1. Strategies 2, 4, and 5 also offer protection to a lesser extent than strategy 6. The lower VaR indicates a more effective hedge against weather-related risks compared to the No Hedge approach. This reduction in financial vulnerability enhances the stability of agricultural revenues for tree crop farmers in the municipality of Naousa.

4. Discussion

This research presents a significant contribution to understanding the role and effectiveness of weather derivatives [51,52], particularly Heating Degree Days (HDD) options [14], in managing agricultural risks due to temperature-related adverse weather conditions in Naousa, Greece. The use of the HDD index is crucial for maintaining the stability of temperature-sensitive crops [53]. The strategic application of weather derivatives has emphasized their potential in mitigating economic vulnerabilities within agricultural practices, particularly in tree crops that are sensitive to climatic fluctuations [54].
Implementing weather derivatives through Burn analysis has resulted in a quantifiable improvement in the financial resilience of agricultural operations. This methodology not only validates the practical application of such financial instruments under varying climatic conditions, but also emphasizes their adaptability and effectiveness in safeguarding farmer incomes across diverse environmental scenarios, as demonstrated in similar studies [14,55].
The application of various strike prices for Long Call and Straddle options strategies in HDD index is pivotal for providing flexibility based on farmers’ risk aversion. Higher strike prices in the Long Call strategy corresponded to lower premiums, offering a cost-effective option for low risk-averse farmers [31,56]. Conversely, lower strike prices offer higher payoff levels in extreme temperature conditions, suitable for farmers willing to invest more for increased income security. Furthermore, the application of the Straddle strategy can provide directionally independent protection in extreme high and low temperatures; this has also been explored in similar studies [2,14,31]. The adaptability of these strategies is crucial for managing diverse agricultural risks, enabling tailored financial solutions that align with varying weather patterns and farmer risk profiles, thereby enhancing the robustness and accessibility of weather derivatives in the agricultural finance.
The findings are corroborated by demonstrating similar benefits in mitigating economic risks associated with adverse weather conditions. Weather derivatives have proven effective for agricultural risk management, particularly in mitigating the financial impact of unexpectedly low temperatures. By establishing a predetermined strike price, this strategy enables farmers to secure financial returns when temperatures drop below this threshold, effectively hedging against potential crop damage due to cold weather, as demonstrated by Bobriková [2]. In this study, strategies with lower exercise prices proved more effective, which contrasts with findings by Spicka and Hnilica [57], where it was shown that offering protection from income variability makes contracts more effective at higher strike levels. Nevertheless, as temperature variability is greater in winter periods, as shown in studies by Spicka and Hnilica and Lee and Craine [57,58], the use of various strategies presented in this work can be particularly beneficial.
All the strategies implemented herein effectively enhanced economic performance compared with situations without hedging, affirming their value as effective risk management tools in agriculture [1,14,59]. Weather derivatives can provide a significant increase in income for farmers across the region against potential adverse temperature fluctuations, as the employment of the Value at Risk (VaR) methodology further demonstrates the financial security that weather derivatives can offer, as proven in similar studies [40,48,49,50]. The application of weather derivatives in regions with volatile weather patterns is crucial, as it directly contributes to more stable and predictable agricultural outputs, reducing economic vulnerability [14,51]. This demonstrates the effectiveness of weather derivatives in stabilizing income for farmers facing uncertain climate impacts [60].
Weather derivatives, through their capability to manage financial risks arising from adverse weather conditions, underscore a critical approach in agricultural financial management, enhancing both resilience and sustainability in different arable and tree crops in similar studies [61,62,63]. This reflects broader trends across various economic sectors where implementing comprehensive risk mitigation strategies is essential for ensuring long-term sustainability and resilience [64].
Finally, an important discussion point is whether weather derivatives can replace existing risk management systems such as agricultural insurance. As the findings of this research demonstrate, all strategies used enhanced economic performance compared to scenarios without hedging, with spatial risk basis being a major concern. The effective use of weather derivatives requires data specialized for each microclimate of the area. For example, a study by Van Asseldonk [38] has proven to decrease spatial risk basis significantly, thereby enhancing the overall efficiency of the risk transfer process. While the effectiveness of weather derivatives is clear, their use as a primary risk management tool encounters various disadvantages that need improvement [65].

5. Conclusions

This study has underscored the significant potential of weather derivatives as a risk management tool within the agricultural sector of Naousa, Greece, with a particular focus on tree crops sensitive to temperature variations. Through the strategic use of Heating Degree Days (HDD) index options, we have demonstrated that weather derivatives can effectively mitigate economic vulnerabilities that arise due to temperature fluctuations, enhancing sustainability.
The empirical findings from employing various strike prices in Long Call and Straddle options strategies on the HDD index reveal that such tailored risk management solutions are not only feasible but also highly beneficial. They cater to differing levels of risk aversion among farmers, thereby enhancing their financial resilience against adverse weather conditions. The use of the Value at Risk (VaR) methodology further substantiates the financial security offered by these derivatives, showing a significantly reduced probability of severe financial losses in hedged scenarios compared to no-hedge conditions. A lower VaR across strategies compared to the no-hedge scenario suggests a reduced probability of significant financial losses. Notably, Strategy 4, which showed the lowest VaR, is an example of an optimal hedge; it is highly effective against extreme temperatures that negatively affect the yields of tree crops and lower their overall value.
The empirical insights provided by this study are crucial for farmers as well as policy makers in formulating strategies that use financial instruments to enhance rural resilience. To begin, through the use of different weather derivative strategies by farmers, they can help to stabilize income by reducing its variability caused by adverse weather conditions [30,66]. Additionally, government agencies and policy makers can adjust their support programs accordingly [19]. In scenarios where government funds are limited, the strategic use of weather derivatives could contribute to stability from income fluctuations in order to help farmers survive financially in catastrophic years.
The study highlights, as limitations, the no use detrending for pricing and the relatively few years taking into consideration, although their non-application is not prohibitive in the context of the present work [43]. A key methodological aspect of our study is our reliance on historical temperature data, analyzed through the Burn analysis method, to price weather derivatives. While this approach is practical for preliminary assessments, it assumes continuity in historical temperature trends, an assumption that may not hold amid climate change and increased weather variability. Such non-stationarity in temperature data could lead to biases in derivative pricing, which might impact the accuracy and reliability of our financial risk evaluations. To address this concern, we suggest that future researchers employ dynamic statistical methods that adapt to shifts in climate patterns. By incorporating advanced forecasting models, we can enhance the robustness of derivative pricing to environmental changes, thereby refining our financial risk management strategies in agriculture. For example, the use of various mathematical tools, such as wavelet and B-Spline functions, can predict results with greater accuracy [67].
Future studies could explore the integration of other weather indexes, such as rainfall or wind speed, which could provide a more holistic approach to weather risk management. In addition, extending the analysis to different geographic regions and crop types could validate the adaptability and scalability of weather derivatives as a global agricultural risk management tool.

Author Contributions

Writing—original draft, A.P.; Writing—review & editing, S.N., C.M. and G.V.; Project administration, T.B. All authors have read and agreed to the published version of the manuscript.

Funding

The research work was supported by the Hellenic Foundation for Research and Innovation (HFRI) under the 3rd Call for HFRI PhD Fellowships (Fellowship Number: 5806). Sustainability 16 07372 i001

Data Availability Statement

The original contributions presented in the study are included in the article. Further inquiries can be directed to the corresponding author.

Conflicts of Interest

The authors declare no conflicts of interest.

References

  1. Štulec, I. Effectiveness of Weather Derivatives as a Risk Management Tool in Food Retail: The Case of Croatia. Int. J. Financ. Stud. 2017, 5, 2. [Google Scholar] [CrossRef]
  2. Bobriková, M. Weather Risk Management in Agriculture Using Weather Derivatives. Ital. Rev. Agric. Econ. 2022, 77, 15–26. [Google Scholar] [CrossRef]
  3. Fu, H.; Li, J.; Li, Y.; Huang, S.; Sun, X. Risk Transfer Mechanism for Agricultural Products Supply Chain Based on Weather Index Insurance. Complexity 2018, 2018, 2369423. [Google Scholar] [CrossRef]
  4. Jaffee, S.; Siegel, P.; Andrews, C. Rapid Agricultural Supply Chain Risk Assessment: A Conceptual Framework; The World Bank: Washington, DC, USA, 2010. [Google Scholar]
  5. Chen, F.; Yano, C. Improving Supply Chain Performance and Managing Risk Under Weather-Related Demand Uncertainty. Manag. Sci. 2010, 56, 1380–1397. [Google Scholar] [CrossRef]
  6. Brusset, X.; Bertrand, J.-L. Hedging Weather Risk and Coordinating Supply Chains. J. Oper. Manag. 2018, 64, 41–52. [Google Scholar] [CrossRef]
  7. Černý, I.; Veverková, A.; Kovar, M.; Mátyás, M. The Variability of Sunflower (Helianthus Annuus L.) Yield and Quality Influenced by Wheater Conditions. Acta Univ. Agric. Et Silvic. Mendel. Brun. 2013, 61, 595–600. [Google Scholar] [CrossRef]
  8. Zara, C. Weather Derivatives in the Wine Industry. Int. J. Wine Bus. Res. 2008, 22, 222–237. [Google Scholar] [CrossRef]
  9. Brockett, P.L.; Wang, M.; Yang, C. Weather Derivatives and Weather Risk Management. Risk Manag. Insur. Rev. 2005, 8, 127–140. [Google Scholar] [CrossRef]
  10. Bartkowiak, M. Weather Derivatives. Math. Econ. 2009, 5–17. [Google Scholar]
  11. Pérez-González, F.; Yun, H. Risk Management and Firm Value: Evidence from Weather Derivatives; Wiley: Hoboken, NJ, USA, 2010. [Google Scholar]
  12. Vernooy, R. Does Crop Diversification Lead to Climate-Related Resilience? Improving the Theory through Insights on Practice. Agroecol. Sustain. Food Syst. 2022, 46, 877–901. [Google Scholar] [CrossRef]
  13. Kopeć, P. Climate Change—The Rise of Climate-Resilient Crops. Plants 2024, 13, 490. [Google Scholar] [CrossRef] [PubMed]
  14. Bobriková, M. Weather Risk Management in Agriculture. Acta Univ. Agric. Et Silvic. Mendel. Brun. 2016, 64, 1303–1309. [Google Scholar] [CrossRef]
  15. Moschini, G.; Hennessy, D. Uncertainty, Risk Aversion, and Risk Management for Agricultural Producers. Handb. Agric. Econ. 2001, 1, 88–153. [Google Scholar] [CrossRef]
  16. Kramer, B.; Hazell, P.; Alderman, H.; Ceballos, F.; Kumar, N.; Timu, A.G. Is Agricultural Insurance Fulfilling Its Promise for the Developing World? A Review of Recent Evidence. Annu. Rev. Resour. Econ. 2022, 14, 291–311. [Google Scholar] [CrossRef]
  17. Turvey, C. Weather Derivatives for Specific Event Risks in Agriculture. Rev. Agric. Econ. 2001, 23, 333–351. [Google Scholar] [CrossRef]
  18. Quiggin, J.; Karagiannis, G.; Stanton, J. Crop Insurance and Crop Production: An Empirical Study of Moral Hazard and Adverse Selection. In Economics of Agricultural Crop Insurance: Theory and Evidence; Hueth, D.L., Furtan, W.H., Eds.; Springer: Dordrecht, The Netherlands, 1994; pp. 253–272. ISBN 978-94-011-1386-1. [Google Scholar]
  19. Stoppa, A.; Hess, U.; Stoppa, A.; Hess, U. Design and Use of Weather Derivatives in Agricultural Policies: The Case of Rainfall Index Insurance in Morocco. In Proceedings of the International Conference “Agricultural Policy Reform and the WTO: Where Are We Heading”, Capri, Italy, 23–26 June 2003. [Google Scholar]
  20. Alexandridis, A.; Zapranis, A. Weather Derivatives: Modeling and Pricing Weather-Related Risk; Springer Science & Business Media: Berlin, Germany, 2013; ISBN 9781461460701. [Google Scholar]
  21. Musshoff, O.; Odening, M.; Xu, W. Management of Climate Risks in Agriculture—Will Weather Derivatives Permeate? Appl. Econ. 2011, 43, 1067–1077. [Google Scholar] [CrossRef]
  22. Yang, C.; Li, L.; Wen, M.-M. Weather Risk Hedging in the European Markets and International Investment Diversification. Geneva Risk Insur. Rev. 2010, 36, 74–94. [Google Scholar] [CrossRef]
  23. Platen, E.; West, J. Fair Pricing of Weather Derivatives; University of Technology Sydney: Ultimo, Australia, 2004. [Google Scholar]
  24. Oetomo, T.; Stevenson, M. Hot or Cold? A Comparison of Different Approaches to the Pricing of Weather Derivatives. J. Emerg. Mark. Financ. 2005, 4, 101–133. [Google Scholar] [CrossRef]
  25. Chavas, J.-P.; Di Falco, S.; Adinolfi, F.; Capitanio, F. Weather Effects and Their Long-Term Impact on the Distribution of Agricultural Yields: Evidence from Italy. Eur. Rev. Agric. Econ. 2019, 46, 29–51. [Google Scholar] [CrossRef]
  26. Trnka, M.; Olesen, J.; Kersebaum, K.; Rötter, R.P.; Brázdil, R.; Eitzinger, J.; Jansen, S.; Skjelvåg, A.; Peltonen-Sainio, P.; Hlavinka, P.; et al. Changing Regional Weather-Crop Yield Relationships across Europe between 1901 and 2012. Clim. Res. 2016, 70, 195–214. [Google Scholar] [CrossRef]
  27. Stulec, I.; Petljak, K.; Bakovic, T. Effectiveness of Weather Derivatives as a Hedge against the Weather Risk in Agriculture. Agric. Econ. 2016, 62, 356–362. [Google Scholar] [CrossRef]
  28. Ender, M.; Zhang, R. Efficiency of Weather Derivatives for Chinese Agriculture Industry. China Agric. Econ. Rev. 2015, 7, 102–121. [Google Scholar] [CrossRef]
  29. Sharma, A.K.; Vashishtha, A. Weather Derivatives: Risk-Hedging Prospects for Agriculture and Power Sectors in India. J. Risk Financ. 2007, 8, 112–132. [Google Scholar] [CrossRef]
  30. Buchholz, M.; Musshoff, O. The Role of Weather Derivatives and Portfolio Effects in Agricultural Water Management. Agric. Water Manag. 2014, 146, 34–44. [Google Scholar] [CrossRef]
  31. Fleege, T.; Richards, T.; Manfredo, M.; Sanders, D. The Performance of Weather Derivatives in Managing Risks of Specialty Crops. 2004. Available online: https://ageconsearch.umn.edu/record/19026/?v=pdf (accessed on 10 July 2024).
  32. Alaton, P.; Djehiche, B.; Stillberger, D. On Modelling and Pricing Weather Derivatives. Appl Math Financ. 2002, 9, 1–20. [Google Scholar] [CrossRef]
  33. Cramer, S.; Kampouridis, M.; Freitas, A.; Alexandridis, A. Stochastic Model Genetic Programming: Deriving Pricing Equations for Rainfall Weather Derivatives. Swarm Evol. Comput. 2019, 46, 184–200. [Google Scholar] [CrossRef]
  34. Alexandridis, G.; Mavrovitis, C.F.; Travlos, N.G. How Have M&As Changed? Evidence from the Sixth Merger Wave. Eur. J. Financ. 2012, 18, 663–688. [Google Scholar] [CrossRef]
  35. Wassan, S.; Xi, C.; Jhanjhi, N.; Imran, L. Effect of Frost on Plants, Leaves, and Forecast of Frost Events Using Convolutional Neural Networks. Int. J. Distrib. Sens. Netw. 2021, 17, 155014772110537. [Google Scholar] [CrossRef]
  36. Jones, T. Agricultural Applications of Weather Derivatives. Int. Bus. Econ. Res. J. (IBER) 2011, 6, 56. [Google Scholar] [CrossRef]
  37. Müller, A.; Grandi, M. Weather Derivatives: A Risk Management Tool for Weather-Sensitive Industries. Geneva Pap. Risk Insurance. Issues Pract. 2000, 25, 273–287. [Google Scholar] [CrossRef]
  38. Asseldonk, M. Insurance against Weather Risk: Use of Heating Degree-Days from Non-Local Stations for Weather Derivatives. Theor. Appl. Clim. 2003, 74, 137–144. [Google Scholar] [CrossRef]
  39. Cao, M.; Wei, J. Weather Derivatives Valuation and Market Price of Weather Risk. J. Futures Mark. 2004, 24, 1065–1089. [Google Scholar] [CrossRef]
  40. Alramadan, N.; Hasan, M.F. Using Options Futures Derivatives Weather in Hedging. Technium Soc. Sci. J. 2022, 31, 430–436. [Google Scholar]
  41. Zapranis, A.; Alexandridis, A. Weather Derivatives Pricing: Modeling the Seasonal Residual Variance of an Ornstein–Uhlenbeck Temperature Process with Neural Networks. Neurocomputing 2009, 73, 37–48. [Google Scholar] [CrossRef]
  42. Benth, F.E.; Benth, J.Š. Weather Derivatives and Stochastic Modelling of Temperature. Int. J. Stoch. Anal. 2011, 2011, 576791. [Google Scholar] [CrossRef]
  43. Jewson, S.; Brix, A. Weather Derivative Pricing and the Year Ahead Forecasting of Temperature Part 1: Empirical Results. SSRN Electron. J. 2004, 1. [Google Scholar] [CrossRef]
  44. Alexandridis, A.K.; Gzyl, H.; ter Horst, E.; Molina, G. Extracting Pricing Densities for Weather Derivatives Using the Maximum Entropy Method. J. Oper. Res. Soc. 2021, 72, 2412–2428. [Google Scholar] [CrossRef]
  45. Garcia, A.F.; Sturzenegger, F. Hedging Corporate Revenues with Weather Derivatives: A Case Study. Master’s Thesis, Universite de Lausanne, Ecole des Hautes Etudes Commerciales, Lausanne, Switzerland, 2001. [Google Scholar]
  46. Roustant, O.; Laurent, J.-P.; Bay, X.; Carraro, L. Model Risk in the Pricing of Weather Derivatives. Bank. Mark. Invest. Acad. Prof. Rev. 2003, 72, 77. [Google Scholar]
  47. Luedeling, E.; Girvetz, E.; Semenov, M.; Brown, P. Climate Change Affects Winter Chill for Temperate Fruit and Nut Trees. PLoS ONE 2011, 6, e20155. [Google Scholar] [CrossRef]
  48. Vedenov, D.; Barnett, B. Efficiency of Weather Derivatives as Primary Crop Insurance Instruments. J. Agric. Resour. Econ. 2004, 29, 387–403. [Google Scholar] [CrossRef]
  49. Jewson, S. Weather Derivative Pricing and Risk Management: Volatility and Value at Risk. SSRN Electron. J. 2002, 16. [Google Scholar] [CrossRef]
  50. Zong, L.; Ender, M. Spatially-Aggregated Temperature Derivatives: Agricultural Risk Management in China. Int. J. Financ. Stud. 2016, 4, 17. [Google Scholar] [CrossRef]
  51. Gyamerah, S.; Ngare, P.; Ikpe, D. Hedging Crop Yields Against Weather Uncertainties-A Weather Derivative Perspective. Math. Comput. Appl. 2019, 24, 71. [Google Scholar] [CrossRef]
  52. Sun, B.; van Kooten, G. Financial Weather Options for Crop Production. 2014. Available online: https://ageconsearch.umn.edu/record/164323/?v=pdf (accessed on 10 July 2024).
  53. Göncü, A. Pricing Temperature-Based Weather Derivatives in China. J. Risk Financ. 2011, 13, 32–44. [Google Scholar] [CrossRef]
  54. Bressan, G.; Romagnoli, S. Climate Risks and Weather Derivatives: A Copula-Based Pricing Model. J. Financ. Stab. 2021, 54, 100877. [Google Scholar] [CrossRef]
  55. Schiller, F.; Seidler, G.; Wimmer, M. Temperature Models for Pricing Weather Derivatives. Quant Financ. 2010, 12, 489–500. [Google Scholar] [CrossRef]
  56. Candoi-Savu, R.-A. Using Meteorological Derivatives for Weather Risk Management in Agriculture. Theor. Approach 2022, 13, 13–22. [Google Scholar]
  57. Spicka, J.; Hnilica, J. A Methodical Approach to Design and Valuation of Weather Derivatives in Agriculture. Adv. Meteorol. 2013, 2013, 146036. [Google Scholar] [CrossRef]
  58. Lee, J.; Craine, R. Temperature Modeling in the Weather Derivative Pricing. Am. J. Sci. Res. 2012, 93–109. [Google Scholar]
  59. Berg, E.; Schmitz, B.; Starp, M.; Trenkel, H. Weather Derivatives as an Risk Management Tool in Agriculture. In Proceedings of the 86th EAAE Seminar: Income Stabilization in Agriculture, The Role of Public Policies; 2006; pp. 379–396. Available online: http://wpage.unina.it/cafiero/pubs/13.pdf#page=389 (accessed on 20 April 2024).
  60. Wang, H.; Zhao, Y. Do Weather Derivatives Mitigate the Revenue Risk of Farmers?—The Case of Tongliao, Inner Mongolia, China. Sustainability 2024, 16, 1038. [Google Scholar] [CrossRef]
  61. Richards, T.J.; Manfredo, M.R.; Sanders, D.R. Pricing Weather Derivatives. Am. J. Agric. Econ. 2004, 86, 1005–1017. [Google Scholar] [CrossRef]
  62. Geyser, J.M. Weather Derivatives: Concept and Application for Their Use In South Africa. Univ. Pretoria Dep. Agric. Econ. Ext. Rural Dev. Work. Pap. 2004, 43, 444–464. [Google Scholar] [CrossRef]
  63. Young, S.J. Temperature-Based Weather Derivatives as a Technique for Maize Production Hedging; University of Johannesburg: Johannesburg, South Africa, 2014. [Google Scholar]
  64. Lai, S.; Qiu, J.; Tao, Y.; Liu, Y. Risk Hedging Strategies for Electricity Retailers Using Insurance and Strangle Weather Derivatives. Int. J. Electr. Power Energy Syst. 2022, 134, 107372. [Google Scholar] [CrossRef]
  65. Manfredo, M.; Richards, T. Hedging with Weather Derivatives: A Role for Options in Reducing Basis Risk. Appl. Financ. Econ. 2009, 19, 87–97. [Google Scholar] [CrossRef]
  66. Raucci, G.; Lanna Franco da Silveira, R.; Capitani, D. Development of Weather Derivatives: Evidence from the Brazilian Soybean Market. Riv. Econ. Agrar. 2019, 74, 17–28. [Google Scholar] [CrossRef]
  67. Wang, Z.; Li, P.; Li, L.; Huang, C.; Liu, M. Modeling and Forecasting Average Temperature for Weather Derivative Pricing. Adv. Meteorol. 2015, 2015, 837293. [Google Scholar] [CrossRef]
Figure 1. GADM. (2024). Database of Global Administrative Areas, version 4.1. Available online: https://gadm.org/, accessed on 15 April 2024.
Sustainability 16 07372 g001
Figure 2. HDD index development with Trend Line.
Sustainability 16 07372 g002
Figure 3. Comparison of payoffs from the weather risk strategy Long Call.
Sustainability 16 07372 g003
Figure 4. Comparison of payoffs from the weather risk Straddle strategies.
Sustainability 16 07372 g004
Table 1. Monthly Average High and Low Temperatures.
MonthAvg High (°C)Avg Low (°C)
January8.52.4
February10.84.3
March14.06.7
April19.110.5
May22.914.6
June27.519.7
July31.121.4
August31.021.5
September25.718.7
October20.213.2
November15.19.8
December10.55.1
Table 2. Basis statistical characteristics of HDD index.
Statistical CharacteristicsHDD Index
Average1194.13
Median1165.45
Standard Deviation117.39
Range (Dispersion)424.6
Minimum1025.1
Maximum1449.7
Coefficient of Variation0.0983
Skewness0.552
Kurtosis−0.185
Source: The author’s processing.
Table 3. Call and Put option premiums.
Premium of Call OptionStrike Price Based on HDD IndexPremium of Put Option
EUR 76.341135.44EUR 18.38
EUR 45.621194.14EUR 45.68
EUR 23.771252.83EUR 81.80
Source: The author’s processing.
Table 4. Scenarios by Long Call strategy.
HDD Index Range
HDDT
Strike Price
(K)
Payoff from Long StrategyPremium of Call (cL)Net Payoff
HDDT-cL
Strategy 1
HDDT ≤ K1135.44077.3−76.3
HDDT ≥ K1135.44HDDT-
1135.44
77.3(HDDT-1135.44)-76.3
Strategy 2
HDDT ≤ K1194.14045.6−46.26
HDDT ≥ K1194.14HDDT-
1194.14
45.6(HDDT-1194.14)-45.6
Strategy 3
HDDT ≤ K1252.83023.7−23.7
HDDT ≥ K1252.83HDDT-
1252.83
23.7(HDDT-1252.83)-23.7
Source: The author’s processing.
Table 5. Scenarios by Straddle strategy.
HDD Index Range
HDDT
Strike Price
(K)
Payoff of LongPremium of Call (cL)Payoff of PutPremium of Put (pL)Long Straddle Payoff (LP)Net Payoff
(LP-cL-pL)
Strategy 4
HDDT ≤ K1135.44HDDT-1135.4476.31135.4-HDDT18.3Call + Put PayoffLP-
76.3-18.3
HDDT ≥ K1135.44HDDT-1135.4476.31135.4-HDDT18.3Call + Put PayoffLP-
76.3-18.3
Strategy 5
HDDT ≤ K1194.14HDDT-1135.4445.61194.1-HDDT45.6Call + Put PayoffLP-
45.6-45.6
HDDT ≥ K1194.14HDDT-1194.1445.61194.1-HDDT45.6Call + Put PayoffLP-
45.6-45.6
Strategy 6
HDDT ≤ K1252.8HDDT-1252.8323.71252.8-HDDT81.8Call + Put PayoffLP-
23.7-81.8
HDDT ≥ K1252.8HDDT-1252.823.71252.8-HDDT81.8Call + Put PayoffLP-
23.7-81.8
Table 6. Profit/losses in EUR from unhedged hedging strategies 1–6.
Without Hedging (WH)WH+S1WH+S2WH+S3WH+S4WH+S5WH+S6
2010–201125,607,03027,239,04726,480,58725,479,38426,740,10425,240,55823,258,841
2011–201226,909,95433,385,18532,624,76931,621,04332,884,95431,381,54229,394,774
2012–20138,864,0507,041,1227,622,4568,217,1266,540,8917,722,0668,931,001
2013–201426,339,42524,525,89225,255,67625,774,74526,710,49428,186,21629,241,457
2014–201514,426,55917,614,89816,953,16816,079,70117,179,58715,871,28314,142,350
2015–201617,254,71315,513,24516,214,03016,712,47217,325,88618,742,96719,756,276
2016–201720,374,43721,872,62621,261,71920,450,39221,470,74720,262,92618,661,835
2017–201817,579,56016,113,07316,515,61017,025,19615,684,41416,505,34817,541,311
2018–201921,037,21121,252,81720,657,55620,530,79120,861,23119,684,34419,447,005
2019–202022,780,02121,623,90621,757,49422,247,24021,211,93721,494,35422,489,983
2020–202122,156,98621,164,86321,055,21721,582,91720,720,96720,518,09921,590,886
SUM223,329,946227,346,673226,398,283225,721,006227,331,213225,609,703224,455,719
Source: The author’s processing.
Table 7. Value at Risk (VaR) results from unhedged hedging strategies 1–6.
Without HedgingS1S2S3S4S5S6
Value at Risk (VaR)11,706,5809,972,59710,412,17510,886,2089,899,08610,524,24111,044,387
Source: The author’s processing.
Disclaimer/Publisher’s Note: The statements, opinions and data contained in all publications are solely those of the individual author(s) and contributor(s) and not of MDPI and/or the editor(s). MDPI and/or the editor(s) disclaim responsibility for any injury to people or property resulting from any ideas, methods, instructions or products referred to in the content.

