Abstract
Implementing the “dual-carbon” objective has profoundly affected China’s businesses, prompting a continuous process of transformation and innovation. Green, low-carbon transformation, upgrading, and sustainable development have emerged as the means to achieve high-quality company growth, with firms playing a crucial role in achieving the “dual-carbon” target. By prioritizing firms’ green, low-carbon, and sustainable growth, not only can their economic efficiency be improved, but it also serves as a vital measure to advance high-quality development. To achieve this objective, it is crucial to analyze the elements that impact the energy-saving effectiveness of businesses to develop optimization tactics that can enhance their competitiveness. This study combines the three-stage Data Envelopment Analysis (DEA) and the Tobit model to assess the energy-saving efficiency of green and low-carbon firms from 2018 to 2022. The analysis focuses on selected samples from various areas and industries. The study investigates the relationship between energy-saving effectiveness and different regional and industrial parameters, considering the distinct attributes of each firm and the key elements that influence its energy-saving performance. The findings indicate that green, low-carbon firms typically demonstrate suboptimal energy-saving efficiency but have considerable room for improvement. Upon considering environmental concerns, it becomes clear that the primary limitation on energy-saving performance is the lower efficiency of the enterprise scale. The energy-saving efficiency of green, low-carbon firms varies significantly across different regions and industries. On average, northern firms in the energy-saving and carbon reduction industry, as well as the resource recycling industry, have higher energy-saving efficiency compared to southern enterprises. In contrast, the environmental protection industry in southern firms demonstrates a better average energy-saving efficiency compared to their northern counterparts. Employee quality, policy support, and automation are key factors that greatly enhance the energy-saving efficiency of firms in both regions. Enterprise size has a beneficial impact on the energy-saving efficiency of southern firms but a negative impact on northern enterprises. Moreover, the industry and financial structures exert a detrimental influence on enhancing the energy-saving efficiency of green and low-carbon firms. Thus, in order to improve the energy-saving effectiveness of businesses, it is essential to utilize the elements that have a positive influence on energy-saving performance and reduce the impact of those that have negative impacts. This strategy will enhance the energy-saving efficiency of businesses and promote the development of an environmentally friendly and low-carbon society.
1. Introduction
The dual-carbon aim is a significant strategic initiative the Party Central Committee established following thorough consideration. China’s objective is to reach the carbon emissions peak by 2030 and achieve carbon neutrality by 2060. This goal is crucial for China’s sustainable growth and the establishment of a global community that shares a common future. Advocating for carbon peaking and neutrality will significantly accelerate the development of an environmentally friendly, low-emission, and sustainable industrial system and a clean, low-emission, secure, and efficient energy system. These initiatives will significantly enhance energy efficiency, promote advancing and implementing environmentally friendly and low-carbon technologies, and guarantee that energy companies grow with superior quality, efficiency, sustainability, and security. Recently, the state has emphasized ecological protection and green development as critical financial investment areas. Based on the data provided by the Ministry of Finance, the national fiscal expenditure on energy saving and environmental protection experienced an average annual growth rate of 8.7% from 2012 to 2022. Between 2012 and 2019, China’s fiscal expenditure on energy saving and environmental preservation increased consistently. However, there was a fall in expenditure from 2020 to 2022. The national fiscal spending on energy conservation and ecological protection amounted to CNY 539.6 billion in 2022.
Enterprises play a crucial role in achieving the dual-carbon objective. China’s adoption of a dual-carbon policy has established the transition to environmentally friendly practices as a prominent and influential trend for contemporary businesses. The development of enterprises of superior quality is now closely intertwined with the process of transitioning toward environmentally friendly and low-carbon practices. Establishing and improving a novel economic system that focuses on environmentally friendly, low-carbon, and circular development is essential to achieve a more extensive transition toward a green economy and society [1]. Consequently, an increasing number of businesses are prioritizing energy preservation, adopting sustainable practices, improving their expansion, and minimizing resource inefficiency. The energy-saving service business in China has experienced a substantial surge in new players. As of the end of 2022, the number of enterprises involved in energy-saving services reached 11,835, marking a net increase of 3110 compared to the previous year. This represents a year-on-year growth rate of 35.6%. The trend of rapid expansion persists as energy-saving service firms propel crucial technology advancements for the industry’s robust and sustainable development. Following the 18th Party Congress, pertinent businesses have steadfastly pursued the green development strategy, effectively enforcing related policies that have resulted in significant accomplishments in energy conservation. Nevertheless, Chinese firms still face obstacles in implementing energy-saving methods and management models that are capable of meeting the requirements of the current period of environmentally friendly and low-carbon development in the energy industry. The energy-saving service industry in China experienced a 15.8% fall in its total output value in 2022, reaching CNY 511 billion. This decrease also led to a decline in corporate profitability. The energy-saving efficiency level directly impacts the economic development and social status of enterprises. Hence, it is crucial to assess and scrutinize the energy-saving efficacy of home environmentally friendly and low-carbon businesses while also examining the pivotal aspects that impact this efficacy. By analyzing their energy-saving efficiency, we can obtain a more thorough and unbiased assessment of the energy conservation efforts of China’s environmentally friendly and low-carbon businesses. This comprehension will aid in identifying the core elements that influence the efficacy of energy-saving measures, therefore making a substantial contribution to improving these businesses’ societal standing and energy-saving capacities.
The research theme of enterprises’ green development and energy efficiency has garnered significant attention from both academia and society. Energy efficiency analysis, characterized by its multi-input and multi-output nature, is influenced by various factors, making the quantification of production functions challenging. Data Envelopment Analysis (DEA), a non-parametric method, can analyze the parameters without establishing the production function. Additionally, DEA does not require pre-assigned weight values, reducing the impact of human subjectivity. As a result, DEA has become a widely used tool for efficiency measurement across various fields [2,3].
The conventional DEA method, initially proposed by Charnes et al., employs data envelopment analysis in statistics to assess issues with multiple inputs and outputs. Zhang et al. [4] utilized the typical DEA approach to evaluate the potential for energy conservation and emission reduction in traditional businesses in Jiangxi Province. They incorporated undesirable outputs, such as pollution, into their model. Their research uncovered significant energy conservation and pollution reduction opportunities in 29 conventional sectors across 11 cities in Jiangxi. However, the effectiveness of emission reduction was found to be low. Nevertheless, the conventional DEA method is inadequate in considering the impact of external environmental elements and random fluctuations, which might result in potential mistakes in efficiency outcomes. Fried et al. proposed that the three-stage DEA model provides benefits compared to the traditional DEA method. Integrating conventional DEA with the Stochastic Frontier Approach (SFA) regression effectively eliminates the impact of environmental factors, thereby offering a more accurate representation of efficiency evaluations. In their study, Sun et al. [5] utilized a three-stage DEA model to analyze 21 locations in Guangdong. They included energy consumption as the input variable, GDP as the desired output variable, and industrial waste gas, wastewater, and dust as the unwanted outputs. Their research determined that scale inefficiency was the main barrier impeding energy conservation and emission reduction in Guangdong Province. Wang et al. [6] conducted a study on the operational efficiency of China’s leading new energy wind power manufacturing companies. They analyzed input and output data from the years 2020 to 2022. The researchers utilized the three-stage DEA model to assess and compare the overall efficiency, scale efficiency, and technical efficiency before and after making adjustments. They then suggested strategies to improve market competitiveness. Zhang and his colleagues [7] employed the three-stage DEA (Data Envelopment Analysis) approach to examine 29 provinces and cities while eliminating the influence of environmental factors on energy efficiency. Their investigation unveiled notable regional disparities in energy conservation and emission reduction efficacy throughout China, with more advanced regions demonstrating superior energy efficiency. Zhu et al. [8] integrated traditional Data Envelopment Analysis (DEA) with the Slacks-Based Measure (SBM) model to assess the capacity of cities in Fujian Province to conserve energy and reduce emissions. According to their research, Fuzhou and Xiamen demonstrated high levels of energy-saving efficiency. However, in other regions, lesser energy-saving efficiency was primarily attributed to low-scale efficiency.
The three-stage DEA method is beneficial for estimating efficiency values. However, comprehending these values necessitates evaluating the elements that contribute to efficiency disparities among units. The Tobit model, renowned for its exceptional accuracy and precision in estimating parameters using maximum likelihood techniques, is frequently integrated with three-stage DEA to offer a thorough analysis. This combination enables a rigorous and accurate examination of the regression data, unveiling the links between components and their corresponding weights in efficiency analysis [9,10]. Ma et al. [11] recently utilized a three-stage DEA and Tobit model combination to evaluate the effectiveness of technical innovation in domestic green low-carbon firms. Their study revealed that the pure technological efficiency of small- and medium-sized firms (SMEs) was markedly superior to that of large enterprises. Additionally, it was found that variables, such as the firm’s scale and the level of government subsidies, had a favorable impact on the efficiency of innovation in enterprises. On the other hand, the intricate nature of the research organization had a detrimental effect on innovation efficiency. Li [12] utilized a three-stage DEA model to assess the efficiency of green innovation in 11 provinces in the Yangtze River Economic Belt during the previous decade. The results of his research uncovered a notable discrepancy in the effectiveness of green innovation across different provinces, indicating a considerable potential for enhancement. By employing the Tobit model for panel regression analysis, he identified five crucial characteristics that had different impacts on the efficiency of green innovation across the Yangtze River Economic Belt. These factors include the environmental regulation level and the talent development rate. Li suggested implementing specific and focused strategies in response to these observations. Tan et al. [13] employed the three-stage DEA approach to assess the forestry eco-efficiency (FECO) of 30 provinces and towns in China between 2008 and 2021. After conducting their research, the scholars used the Tobit model analysis to determine that the average FECO in China is 0.504, which suggests a comparatively low level. Researchers noted substantial regional variation, with elevated FECO levels primarily found in the eastern regions, while the middle and western regions exhibited lower levels. Han et al. [14] utilized the three-stage DEA approach to analyze 187 domestic companies in the new energy automotive industry. Upon eliminating the impact of environmental factors, it was discovered that the technological level of these firms displayed a growth pattern resembling the shape of the letter “N”. Their Tobit regression study proposed measures such as promoting mergers and acquisitions among new energy automotive companies, enhancing government funding mechanisms, and building a communication platform for these companies to improve innovation efficiency. Lu et al. [15] created a thorough evaluation methodology to promote low-carbon passenger transportation using the VPOSR model. They utilized the TOPSIS (Technique for Order Preference by Similarity to an Ideal Solution) method to assess data from Tianjin spanning the years 2017 to 2021. Their investigation revealed crucial factors that affect energy saving in different stages. They determined that Tianjin’s low-carbon passenger transportation, although making progress, is still at a moderate level. As a result, they suggested pertinent measures to enhance it further.
This work seeks to enhance and provide advancements in two crucial domains compared to prior research. Initially, although the majority of domestic research on green and low-carbon firms has mostly concentrated on innovation efficiency, there is an increasing demand for more comprehensive investigations into the energy-saving efficiency of these enterprises. Current studies on enterprise energy efficiency often have a broad scope, frequently encompassing national-level evaluations without much subdivision. This paper adopts a more sophisticated method by analyzing the variations between northern and southern regions and categorizing green low-carbon firms within these regions into three primary green industries. This enables a comprehensive examination of the influence of regional and industrial disparities on the energy efficiency of enterprises. In addition, the study examines and appraises the energy-saving effectiveness of businesses by considering factors such as the size of the organization, its financing structure, and the level of policy assistance. This approach results in more focused and precise conclusions. Furthermore, the majority of research has employed cross-sectional data to examine static efficiency when assessing efficiency through the three-stage DEA model. By employing panel data, this research conducts a dynamic analysis that provides a more comprehensive insight into efficiency trends across time. Moreover, the Tobit model is utilized to examine the aspects that impact energy-saving efficiency, offering practical suggestions for enhancing firm energy-saving efficiency. Improving energy-saving efficiency is essential for advancing the high-quality growth of businesses, enhancing their economic and social advantages, and making a constructive contribution to society’s broader environmental objectives. Hence, researching the determinants that impact the energy-saving efficacy of environmentally friendly, low-carbon businesses holds great importance.
2. Research Design
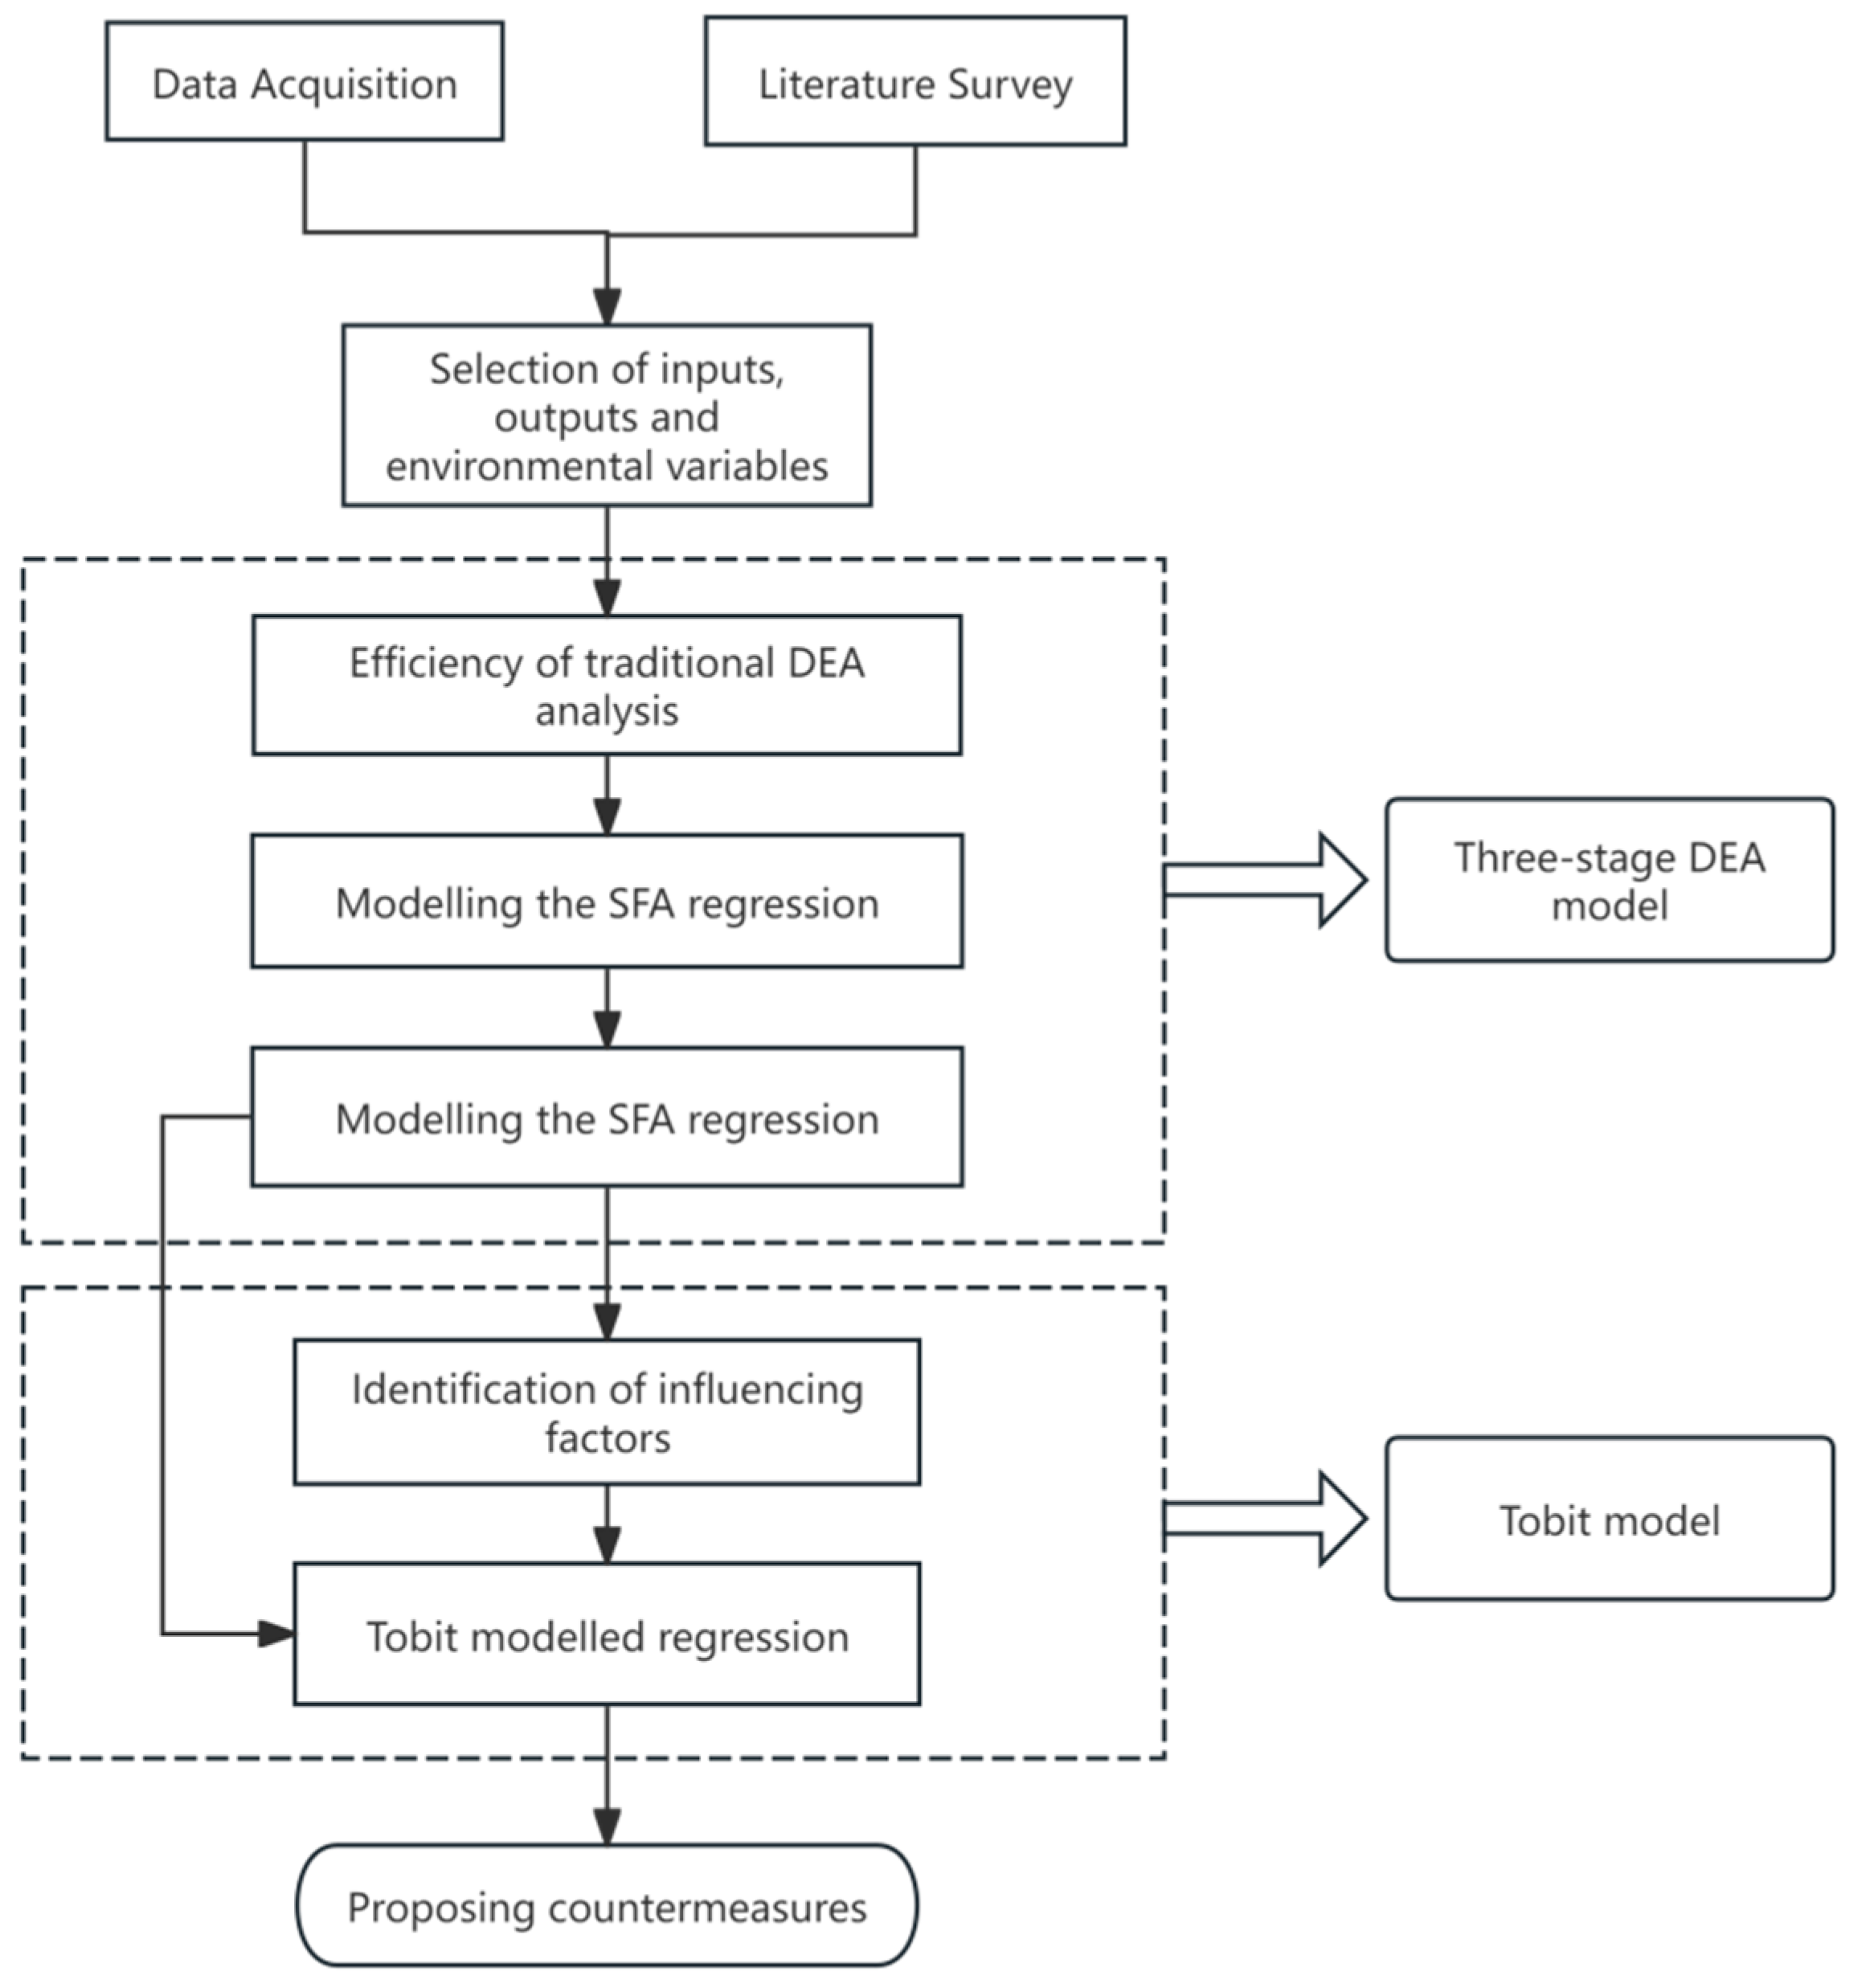
The conventional DEA model is founded on the premise of constant returns to scale, which restricts its capacity to precisely assess the efficiency of decision-making units that function under varying returns to scale. Moreover, it fails to consider the impact of environmental factors and unpredictable disruptions, which might undermine the precision of energy efficiency evaluations. To overcome these constraints, this study utilizes the three-stage DEA model introduced by Fried et al. [16] to accurately assess energy efficiency. The research employs the Tobit model to examine the factors that impact energy efficiency. The precise methods and processes are depicted in Figure 1.
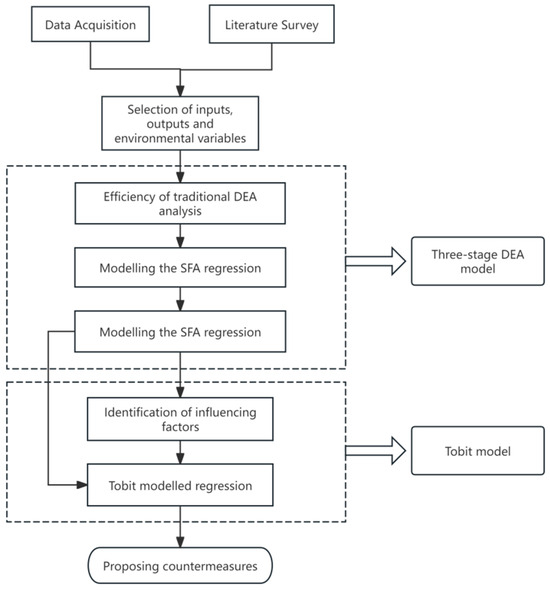
Figure 1.
Technology roadmap.
2.1. Three-Stage DEA Model Construction
2.1.1. Phase 1: Analyzing the Efficiency of Traditional DEA Models
Firstly, the original input and output data are imported for initial efficiency evaluation. The DEA model can be categorized as either input-oriented or output-oriented, with the selection of orientation contingent upon the particular setting of the study. The predominant approach in the current research is the DEA-BCC (Banker–Charnes–Cooper) model, grounded on input orientation. The input-oriented dyadic form of the BCC model can be used to define the model for any decision-making unit in the following manner:
where , n denotes the decision unit, and X and Y are the input and output vectors, respectively. The DEA model is essentially a linear programming problem.
If , the decision unit DEA is valid;
If 0 or 0, the decision unit weak DEA is valid;
If , the decision unit non-DEA is valid.
The combined technical efficiency (TE) is the value calculated by the model, which can be decomposed into scale efficiency (SE) and pure technical efficiency (PTE), TE = SE* PTE.
2.1.2. Phase 2: SFA Regression Modeling
Secondly, the slack variable is and it is argued that this slack variable captures the initial inefficiency and consists of environmental factors, managerial inefficiency, and statistical noise. The main objective in the second stage is to decompose the slack variable obtained from the first stage into three distinct effects: environmental, managerial, and random effects. This decomposition is achieved through Stochastic Frontier Analysis (SFA) regression, where the slack variable from the first stage is regressed on environmental variables and a composite error term. An input-oriented SFA regression model is constructed for this purpose, with each input slack as the dependent variable and the environmental variables as the independent variables. The model can be expressed as follows:
where is the slack value of the nth input of the ith decision unit; is the environmental variable; is the coefficient of the environmental variable; is the mixed error term; denotes random disturbances; denotes managerial inefficiency; ) is the random error term, which represents the effect of random disturbances on the input slack variable; and is the managerial inefficiency, which represents the effect of managerial factors on the input slack variable, assumed to follow a normal distribution truncated at the null point, i.e., (0,.
The SFA regression removes the effects of environmental variables and random disturbances by adjusting the factors to the same external conditions and thus removing the effects of environmental variables and random disturbances. The adjustment formula is as follows:
where is the adjusted input; is the pre-adjusted input; )] is adjusted for external environmental factors; and is used to bring all decision-making units to the same level of luck.
2.1.3. Phase 3: Adjusted DEA Efficiency Analysis
The adjusted input–output data are then re-entered into the DEA model to reassess the efficiency. This step allows for more objective and accurate measurements, as the effects of environmental variables and random disturbances have been removed, ensuring that the efficiency results reflect the true performance of the decision-making units.
2.2. Tobit Regression Model
To effectively enhance the energy efficiency of green and low-carbon enterprises, it is essential to analyze the factors affecting energy efficiency. The adjusted energy-saving efficiency values range between 0 and 1. The Tobit regression model can statistically analyze truncated data. The Tobit model established in this paper is formulated as follows:
where represents the adjusted technological innovation efficiency; is the factor affecting the technological innovation efficiency; is the constant term; is the estimated coefficients of each; and is the random error term.
2.3. Indicator Selection
2.3.1. Input and Output Variables
Based on the existing research and data on enterprise energy-saving measures, this paper will use energy-saving capital investment, electricity consumption, and equipment usage of green, low-carbon enterprises as the input variables. The output variables will include the average value of carbon emissions per unit of GDP, the average value of energy consumption per unit of GDP, and the firm’s operating revenue. Specific definitions of these variables are provided in Table 1.

Table 1.
Specific definitions of input and output variables.
A linear regression analysis of the input and output variables was performed using SPSS26.0 software, with the results presented in Table 2. The analysis shows that the input and output variables have a significant positive influence on each other at a level of 1% or higher. This finding aligns with the DEA theory of input–output homogeneity, validating the use of the DEA model in this study.
Table 2.
Linear regression test results of the input and output variables.
2.3.2. Environmental Variables
Environmental variables are factors that objectively impact the energy efficiency of green, low-carbon enterprises, but cannot be easily altered by the enterprises themselves. Green low-carbon enterprises are a strategic emerging industry with high investment, high risk, and rapid development. Therefore, this paper selects four environmental variables: environmental regulation, market competitiveness, labor quality, and economic development level, based on the existing relevant studies and the characteristics of green low-carbon enterprises [17,18,19,20,21].
- (1)
- Environmental regulation (env). Environmental regulation comprises a range of actions aimed at controlling activities that cause harm to the natural environment and public health, as well as protecting ecological systems and the well-being of the general population. The attainment of the “double-carbon” objectives, namely carbon peaking and carbon neutrality, largely depends on a wide range of environmental measures. These measures include establishing carbon emission regulations to restrict emissions from companies that consume large amounts of energy and produce high emissions levels, promoting the transition of industries toward more sustainable practices, and incentivizing the adoption of cleaner energy sources. Moreover, these regulations can potentially encourage investments in environmentally friendly and low-emission technologies by offering financial incentives. This research quantifies environmental regulation from an economic standpoint by assessing the percentage of local government funds provided to energy-saving investment funds compared to the overall investment in green, low-carbon firms in the region.
- (2)
- Market competitiveness (mar). Market competitiveness refers to an organization’s capacity to accomplish its production and operational goals and can impact energy-saving efficiency in two contrasting manners. Intense market competition might result in financial limitations, which may decrease the allocation of funds toward energy-saving initiatives and, as a result, diminish energy-saving effectiveness. On the other hand, it can also promote innovation, resulting in technological progress that improves energy-saving efficiency. This research assesses market competitiveness by utilizing the Herfindahl–Hirschman Index (HHI), computed as the aggregate of the squared market shares (operation revenues) of green and low-carbon firms within their respective industries about the overall industry revenues. This index offers valuable information about the concentration and competitive dynamics in the market, which impact energy-saving investments and efficiencies.
- (3)
- Labor quality (lab). The caliber of labor heavily influences the efficiency of energy-saving in firms. Individuals with advanced education and enhanced skill sets are generally more aware of energy conservation methods and are more inclined to adopt them with greater efficiency. In addition, a highly educated and trained workforce is better equipped to innovate and create energy-saving solutions, hence increasing the energy-saving efficiency of the firm. This study evaluates labor quality by quantifying the mean level of educational achievement among the workforce of environmentally friendly and low-carbon businesses. This statistic functions as a gauge of the workforce’s collective proficiency and consciousness in relation to energy efficiency.
- (4)
- Economic development level (eco). The energy-saving efficiency of enterprises is significantly impacted by economic development. Regions with advanced economic conditions generally have more significant financial resources, allowing businesses to invest in energy-efficient technology and innovations. Moreover, a greater degree of economic advancement is frequently linked to a more robust dedication to energy efficiency, influenced by both financial capability and legislative backing. The energy-saving efficiency of firms is intricately connected to the economic development level of the region in which they operate. The level of economic development will be measured in this study using the annual per capita GDP of the region where the green and low-carbon firms are located. This statistic indicates the economic well-being of the region and its possible influence on initiatives aimed at conserving energy.
2.3.3. Influencing Factors
It is known from the review of related information that the factors affecting the energy-saving efficiency of green low-carbon enterprises are also related to the relevant characteristics within the enterprise, such as the enterprise size, the quality of employees, the industry to which the enterprise belongs, and the structure of financing [22,23,24]. In this paper, the following six factors will be selected to analyze the energy-saving efficiency of green low-carbon enterprises:
- (1)
- Enterprise scale (Scale): The size of the enterprise will affect the enterprise’s economic returns and, to a certain extent, will also affect the enterprise’s energy-saving inputs, thus affecting the enterprise’s energy-saving efficiency, using the total assets of the enterprise at the end of the year to measure the indicator.
- (2)
- Employee quality (Quality): The higher the quality of the enterprise staff, the greater the ability to energy-saving innovation and transformation, thus enhancing the enterprise’s energy-saving efficiency, measured by the proportion of employees with bachelor’s degrees or above in the total staff.
- (3)
- Goverment support (Gov): Enterprise development cannot be separated from the local government’s relevant policy support; reasonable energy-saving policies will stimulate the enterprise’s energy-saving potential, measured by the amount of funds invested in energy-saving policies.
- (4)
- Industry (Ind): The different industries to which the enterprise belongs will also have a particular impact on the energy-saving effect of the enterprise. In highly polluting manufacturing sectors, attaining equivalent energy efficiency metrics that compare favorably with other industries requires enhanced exertion. The enterprise value attributed to the manufacturing industry is denoted by a value of 1, whereas the corresponding figure for other different sectors is 0.
- (5)
- The degree of automation (Auto): The higher the degree of automation, the higher the resource utilization, using the number of automated machines used by the enterprise as a percentage of the total number of employees to measure the degree of automation of the enterprise.
- (6)
- Financing structure (Lev): Whether the financing structure is reasonable or not also affects the energy-saving efficiency of the enterprise, and the gearing ratio is used to measure the financing structure of the enterprise.
3. Empirical Analysis
3.1. Data Sources
Green and low-carbon firms refer to new businesses that prioritize developing and implementing environmentally friendly and innovative technologies. These firms operate in three primary industries: new energy, energy conservation, and environmental protection. They specialize in producing new energy cars known for their low energy consumption, low pollution, and low emissions. This paper defines green and low-carbon enterprises using the content of the “14th Five-Year Plan for Industrial Green Development”. It screens out listed companies belonging to the three green industries, namely the energy-saving and carbon reduction industry (ESCRI), environmental protection industry (EPI), and resource recycling industry (RRI), in the North and the South according to the seven categories of the newly issued “Green and Low-Carbon Transformation Industry Guidance Catalogue (2024 Edition)” as the research object. This study specifically examines publicly traded enterprises located in the northern and southern parts of the country. Companies are anticipated to shift toward environmentally friendly, low-emission energy sources in the period from 2018 to 2022 in order to adjust to the changing dynamics of energy supply and demand and to conform with global energy patterns. This move is expected to gradually improve energy efficiency and produce significant outcomes in energy conservation and reduced consumption. Therefore, the chosen timeframe for this study extends from 2018 to 2022. To mitigate the influence of extreme values, we use the methodology employed in a previous study by omitting companies categorized as ST (Special Treatment) and PT (Particular Transfer), as well as companies with inadequate research data or a limited representation of green and low-carbon activities. Following the application of these criteria, we have chosen panel data from 160 environmentally friendly and low-carbon companies from 2018 to 2022. The environmental factors utilized in this analysis are obtained from the China Statistical Yearbook, the China Research Data Service Platform (CNRDS), and the annual reports of the pertinent enterprises.
3.2. Measurement of Energy-Saving Efficiency of Green and Low-Carbon Enterprises
3.2.1. Analysis of Traditional DEA Results in the First Stage
Using DEAP 2.1 software, the energy-saving efficiency of enterprises without excluding environmental variables is measured from 2018 to 2022. To examine whether the degree of regional economic development impacts enterprises’ energy-saving efficiency, the Qinling–Huaihe River line is used as the boundary to divide the study into two regions: north and south. The decision-making units were categorized into northern and southern enterprise groups, with the results presented in Table 3 and Figure 2.
Table 3.
Average energy efficiency of green and low-carbon enterprises in phase 1.
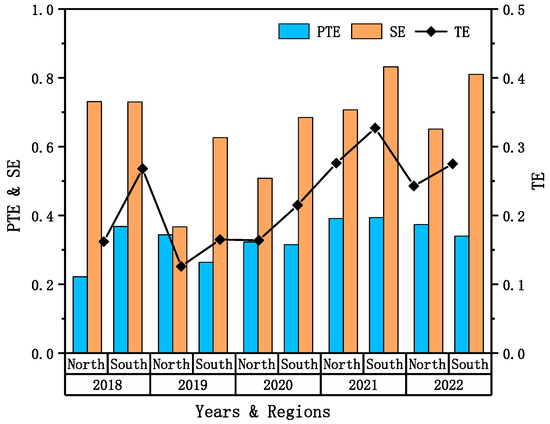
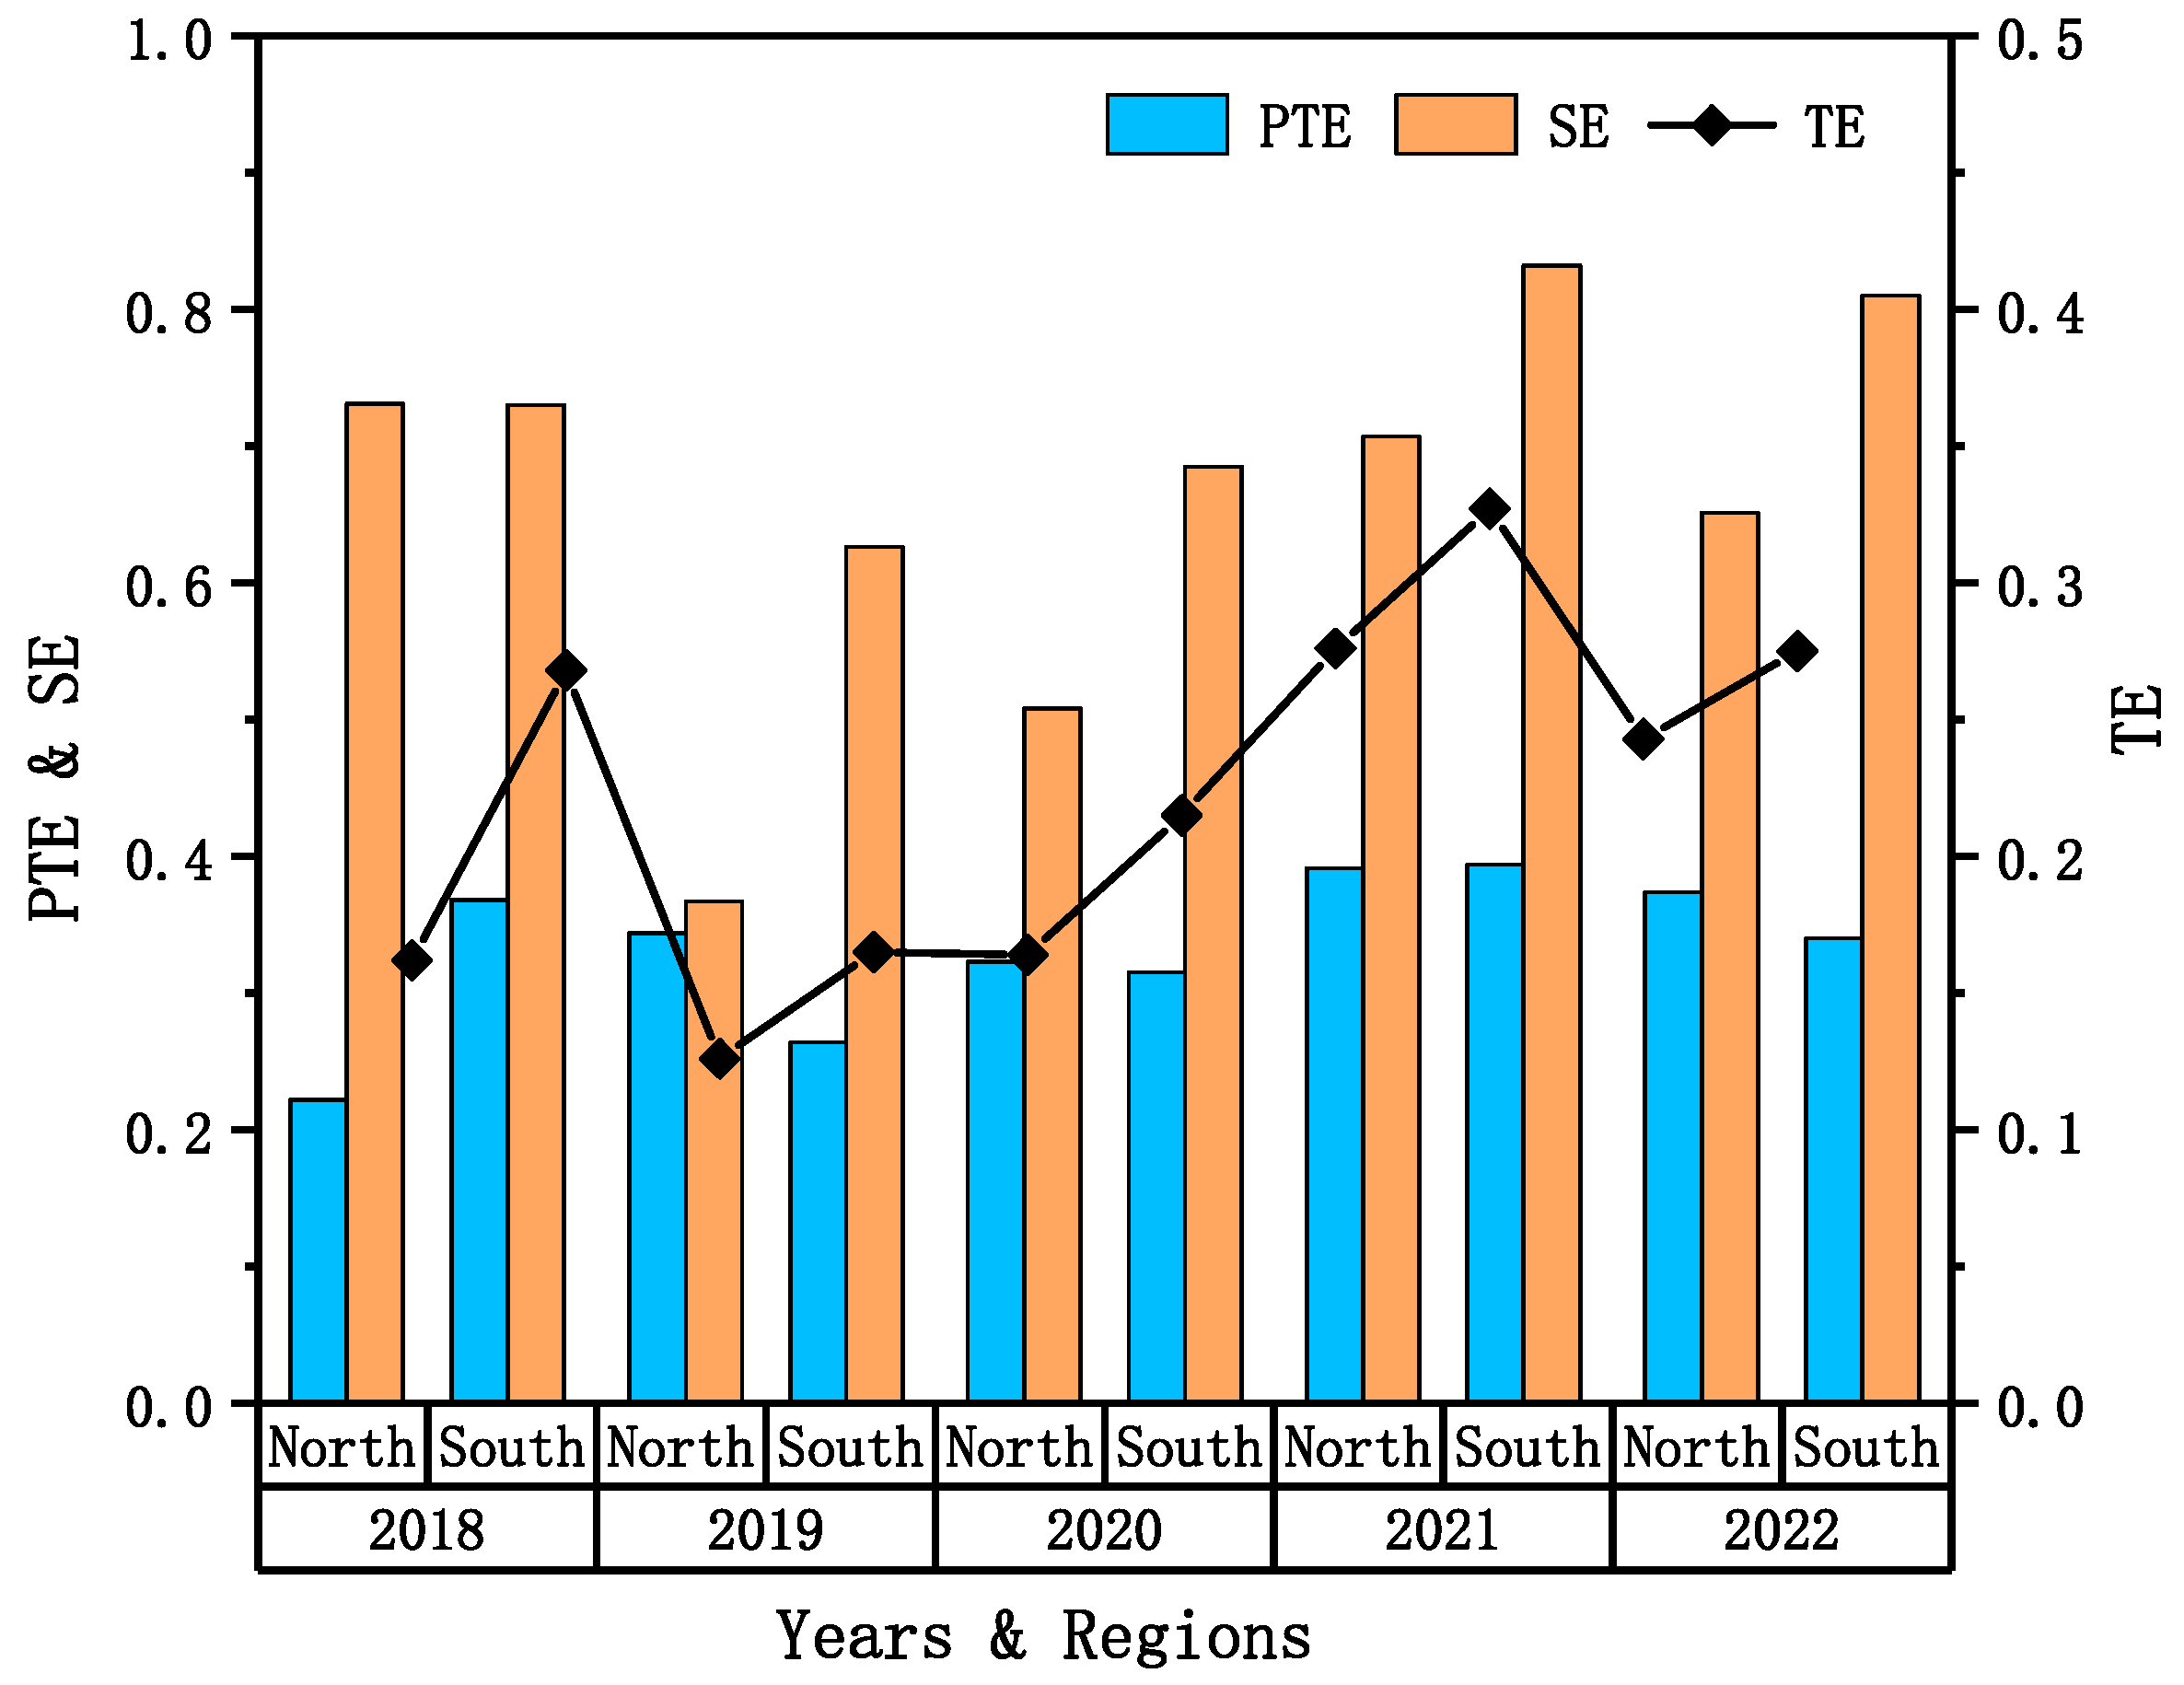
Figure 2.
Changes in average efficiency of energy savings in green low-carbon businesses in the south and north in the first phase.
- (1)
- According to Table 3, the average energy-saving efficiency, pure technical efficiency, and scale efficiency of these 160 enterprises in the past five years are 0.213, 0.328, and 0.643, respectively. It was found that the energy utilization efficiency of green and low-carbon enterprises could be higher due to their purely inefficient technical efficiency. In the period from 2018 to 2022, the energy efficiency of enterprises fluctuates and grows in the range of 0.139~0.291, indicating significant room for improvement, which has already reached 70%. Scale efficiency is higher, in the range of 0.450~0.754, but there is still nearly a 30% upward distance from the efficiency frontier. Compared to scale efficiency, pure technical efficiency remained consistently lower, with a maximum value below 0.4, although it demonstrated a steady upward trend.
- (2)
- According to Figure 2, the average energy efficiency of green low-carbon firms in the south is higher than that of green low-carbon firms in the north. The difference in pure technical efficiency between the two regions is minor, with both regions exhibiting relatively low levels overall. However, the scale efficiency of southern enterprises exceeds that of northern enterprises. Despite a minimum value of 0.626 in 2019, southern enterprises maintain a relatively stable development trajectory. In contrast, the scale efficiency of enterprises in the north reached 0.367 in 2019. The main reason for such a difference is that enterprises in the south are experiencing rapid economic development, with a better environmental terrain for their enterprises and with more abundant and sufficient resources, which means that they can afford to invest more capital shares in energy conservation, thus forming a more stable scale effect.
The selected samples consist of listed companies in the north and south across three green industries: energy saving and carbon reduction, environmental protection, and resource recycling. This study aims to examine the distribution of energy-saving efficiency within these three green sectors and explore the relationship between efficiency and regional factors. Using DEAP 2.1 software, we analyzed data from 2018 to 2022, with the results presented in Table 4.
Table 4.
Average energy-saving efficiency of the three green industries in the north and south in the first phase.
Table 4 reveals that environmental factors and economic development in the south are advancing more rapidly than in the north. The more favorable financial conditions in the south contribute to higher average energy-saving efficiency across all industries compared to the north. Among the three sectors, the environmental protection industry exhibits the highest average energy-saving efficiency, technical efficiency, and scale efficiency. Notably, the environmental protection industry in the south achieves the highest average energy-saving efficiency, with a value of 0.331.
3.2.2. Second-Stage SFA Regression Results
In the SFA regression, the dependent variable is set as the input slack variable analyzed by DEA in the first stage. In contrast, the independent variables are four environmental factors: environmental regulation, market competitiveness, labor quality, and economic development level. The second-stage regression analysis was conducted using Frontier 4.1 software, with the results shown in Table 5. The γ values of each input slack variable converge to 1, indicating that the problem applies to the SFA regression model. All parameters passed the 1% t-value test, meaning all the selected sample indicators also met the requirements. The results of the regression analysis are as follows:
Table 5.
Results of the second-stage SFA regression analysis.
- (1)
- There is a significant adverse effect between environmental regulation and the three input slack variables. Increased local financial investment in energy-saving initiatives, stricter environmental regulations, and stronger environmental controls enhance energy-saving awareness within enterprises, thereby improving energy-saving efficiency.
- (2)
- Significant negative effect between market competitiveness and three input slack variables. Increased local financial investment in energy-saving initiatives, stricter environmental regulations, and stronger environmental controls enhance energy-saving awareness within enterprises, thereby improving energy-saving efficiency.
- (3)
- There is a significant negative impact between the quality of labor and the three input relaxation variables. Higher labor quality facilitates the efficient allocation of resources within enterprises. Skilled labor can introduce innovative energy-saving strategies and methods, thereby enhancing energy-saving efficiency.
- (4)
- There is a significant negative effect between the level of economic development and the three input relaxation variables. Developed regions have abundant resources, better technical equipment and more sound management systems, providing a favorable energy conservation foundation.
3.2.3. Phase-III Adjusted DEA Efficiency Analysis
Following the completion of the second-stage regression analysis, the input and output variables were reintroduced into the DEA model to reevaluate the energy-saving efficiency of green and low-carbon firms. The results were subsequently compared and examined about the original inputs and outputs. The modified outcomes are provided in Table 6 and Figure 3. The efficiency findings in the third stage are assessed in a specific manner as outlined below:
Table 6.
Average energy efficiency of green and low-carbon enterprises in phase 3.
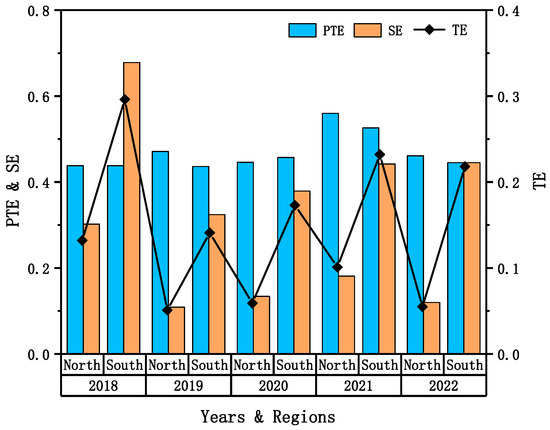
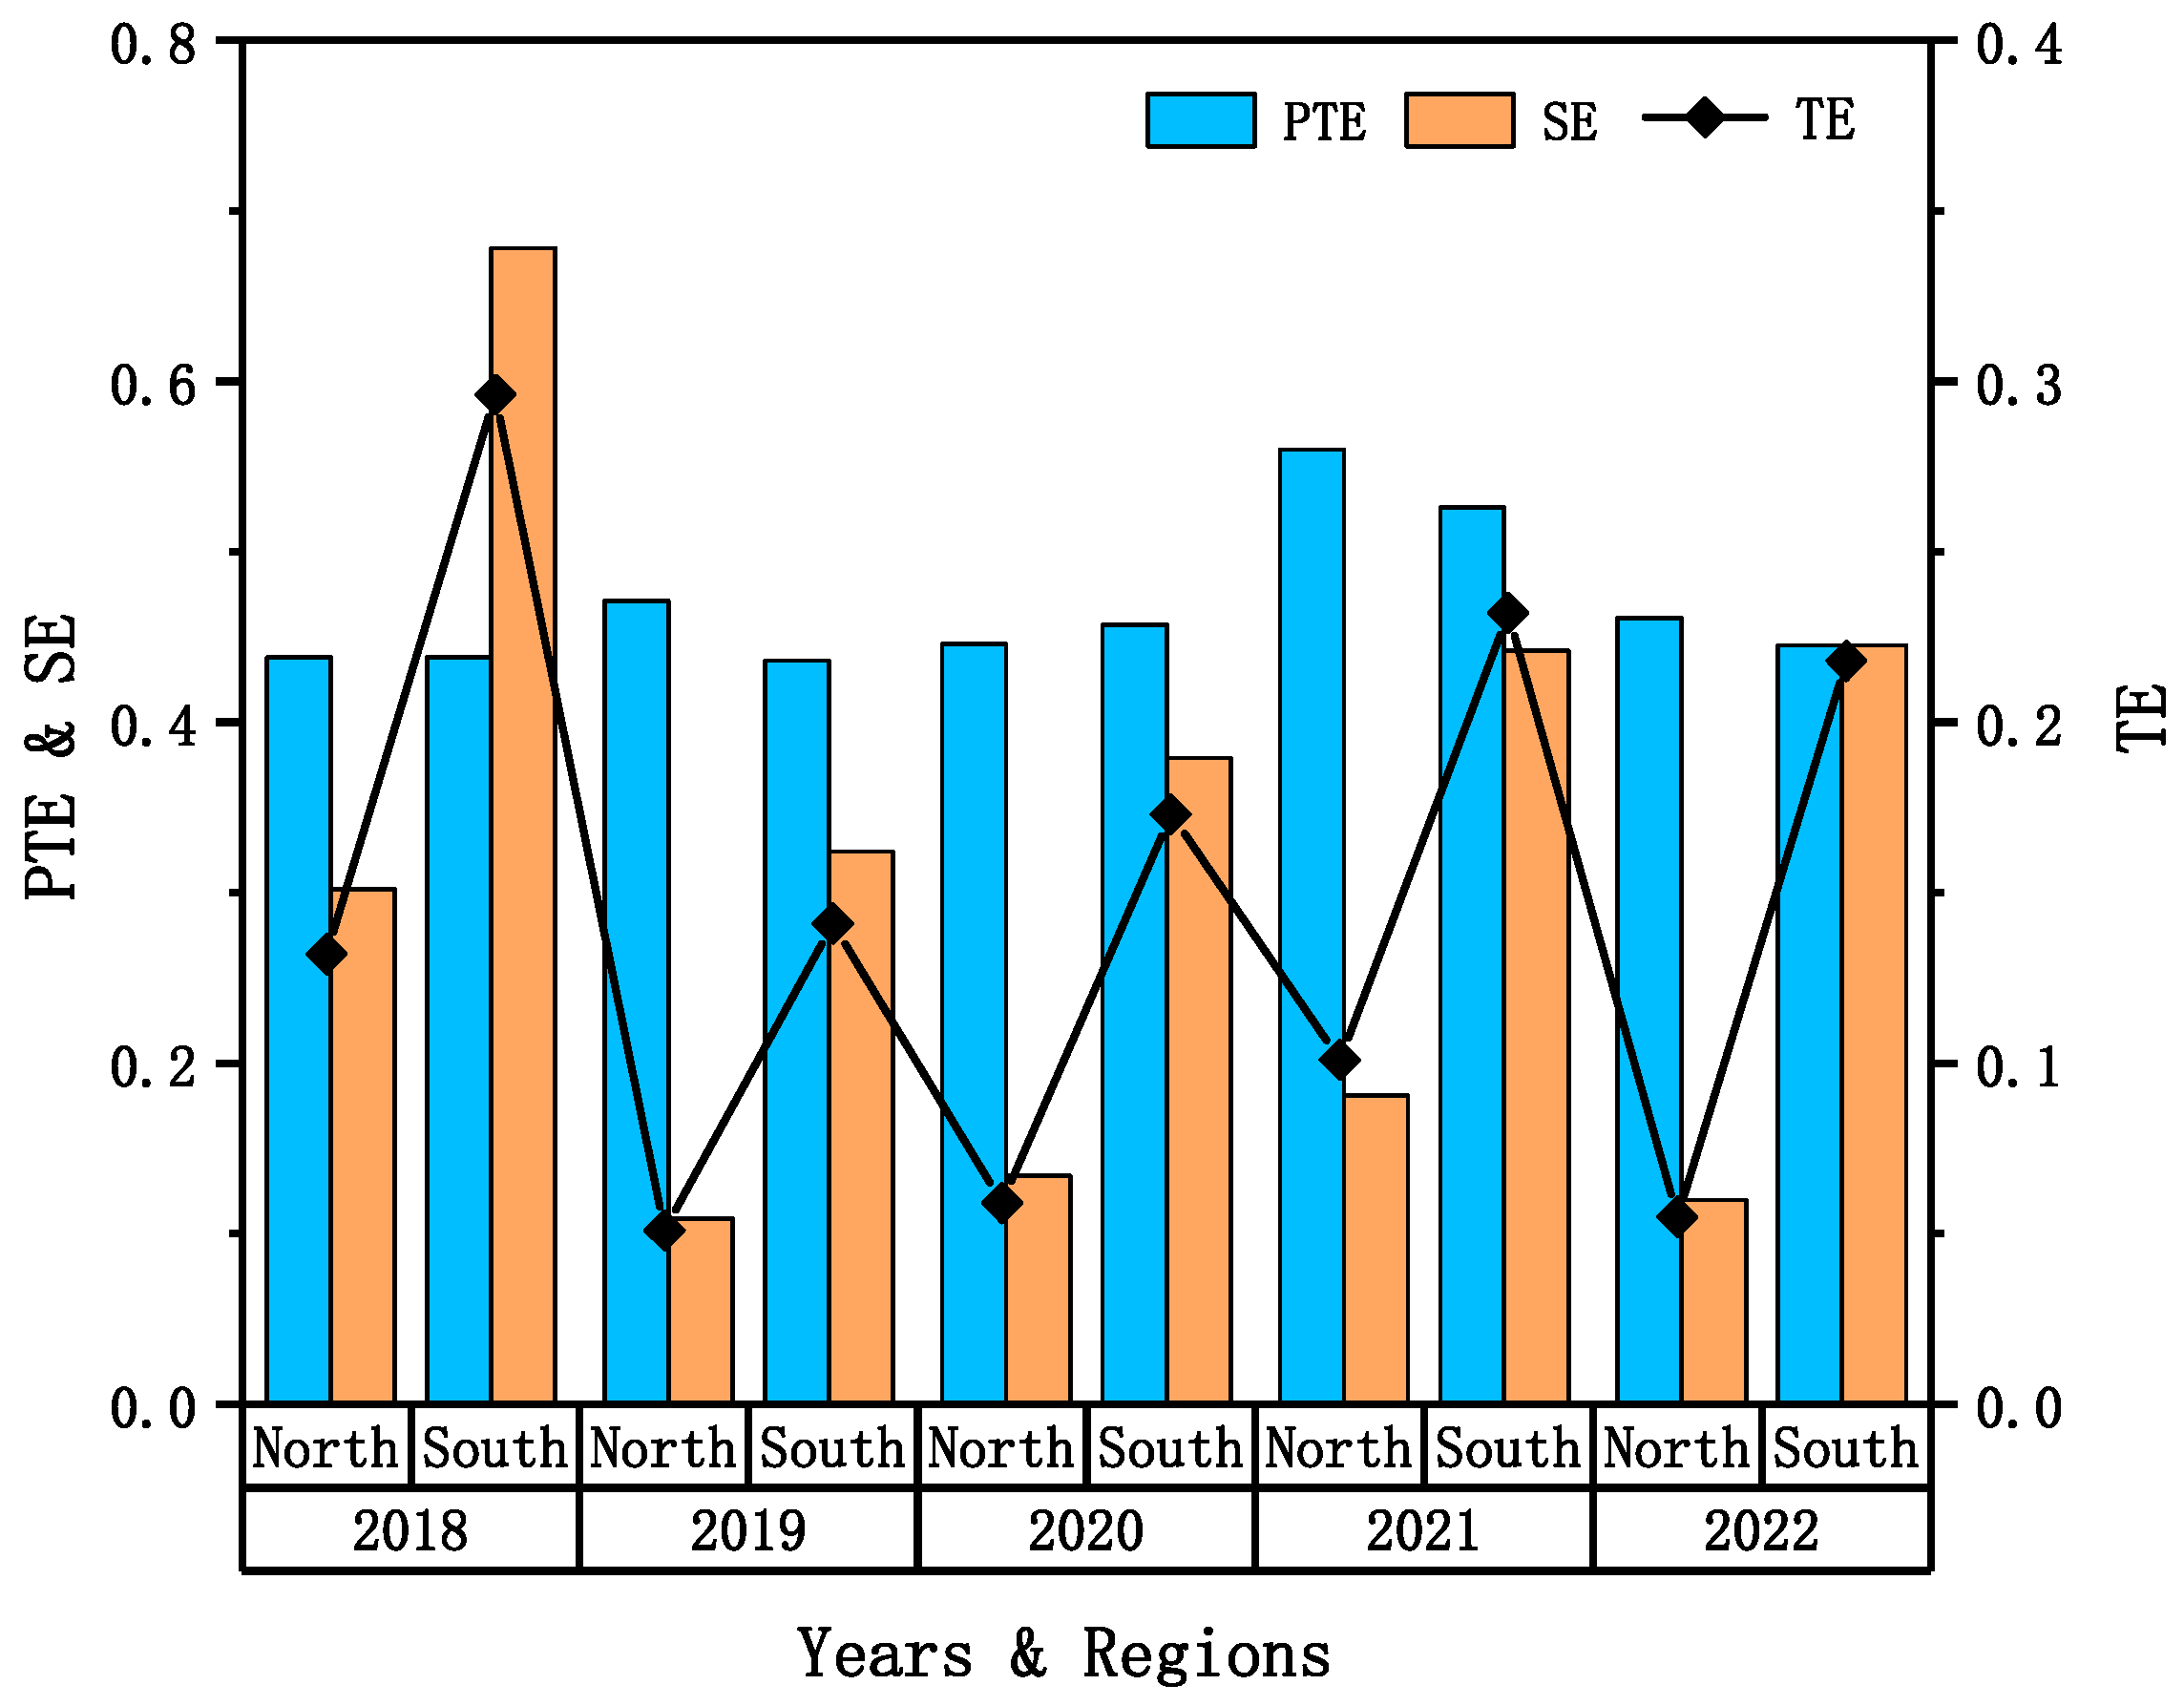
Figure 3.
Changes in average efficiency of energy savings in green low-carbon businesses in the south and north in the third phase.
- (1)
- The comparison shows that once environmental variables and random factors are removed, green and low-carbon firms’ energy-saving efficiency, pure technological efficiency, and scale efficiency become stable. This suggests that environmental factors substantially influence the assessment of energy conservation effectiveness. The three-stage DEA methodology is demonstrated to be more logical than the typical DEA approach. Upon examining the data in Table 4 and Table 6, we can observe that the energy-saving efficiency reduces from 0.213 to 0.113, suggesting a decline in value. The level of pure technical efficiency increases from 0.328 to 0.452, representing a growth of more than 25%. The scale efficiency is greatly diminished, reaching a minimum value of 0.187. These findings indicate that, when environmental factors are not considered, both energy efficiency and scale efficiency decrease to a lesser extent, whereas pure technical efficiency shows an improvement. Without the influence of environmental variables, the factors that affect energy-saving efficiency are no longer primarily determined by pure technical efficiency. Instead, lower-scale efficiency has become the primary limitation on the energy-saving efficiency of green and low-carbon enterprises.
- (2)
- Based on Figure 3, the scale efficiency of southern firms in 2018 and 2022 exceeds the pure technical efficiency for enterprises in different regions. Nevertheless, for all other businesses, the sequence of modifications remains the same both before and after the adjustment. From 2018 to 2022, the pure technical efficiency of southern enterprises was consistently lower than that of northern enterprises, suggesting geographical disparities in the pure technical efficiency of green and low-carbon businesses. Southern firms have yet to fully optimize their technical capabilities.
Table 7 presents the average energy-saving efficiency of the three major green industries in the north and south regions after the third step of the study, which included eliminating the impact of environmental variables.
Table 7.
Average energy-saving efficiency of the three green industries in the north and south in the third phase.
- (1)
- The energy-saving and carbon-reducing business encompasses manufacturing energy-efficient equipment, implementing energy-saving measures, and promoting environmentally friendly, low-carbon practices in essential industries. The resource recycling industry includes the manufacturing of equipment used for resource recycling as well as the actual process of resource recycling. According to the data presented in Table 7, when environmental factors are not considered, the energy-saving and carbon-reducing business and the resource recycling industry in the north have higher average energy-saving efficiencies than those in the south. In contrast, the environmental protection industry in the south consistently demonstrates superior energy-saving efficiency compared to its northern equivalent. The energy-saving and carbon-reducing industry has the highest average efficiency among the three industries, suggesting that environmental factors have a significant impact on energy-saving efficiency in both the north and south.
- (2)
- This diversity mainly stems from the contrasting industrial setups in the north and south. The economy of the south is predominantly propelled by light industry and foreign trade, whereas the north significantly depends on agricultural and heavy industry. The south’s superior energy-saving efficiency in the three major industries, when compared to the north, can be attributed to several factors. Firstly, the south enjoys a higher economic level, which provides ample funding for energy conservation and emission reduction efforts. Additionally, the south has a more vital awareness and commitment to energy conservation and innovation. Lastly, the favorable environmental variables in the region further contribute to its higher energy-saving efficiency. However, when environmental factors are eliminated, the north’s attention turns to heavy industry, leading to more intense pollution and a stronger emphasis on producing and utilizing equipment associated with the environmental protection sector. Consequently, the average effectiveness of the environmental protection business in the north still needs to be improved to that of the south. As a result of these structure variations, industries in the north demonstrate a higher capacity for conserving energy and a more pronounced emphasis on environmentally friendly changes. As a result, there is a greater demand for enterprises focused on energy conservation, carbon reduction, and resource recycling in the north. The heightened attention has prompted more investments in energy-conservation endeavors, leading to superior average energy-saving efficacy in these two sectors compared to the south.
In summary, the energy efficiency of environmentally friendly, low-carbon businesses in China is typically high between 2018 and 2022, and there is a significant opportunity for energy savings. Firms in the south generally exhibit higher energy-saving efficiency and scale efficiency than those in the north. The primary factor limiting the poor energy-saving efficiency of firms in the north is their lower-scale efficiency. The energy-saving efficiency of the carbon reduction business is higher in both the south and the north. Technical improvements can enhance this efficiency, leading to an overall improvement in the industry’s energy-saving efficiency. The energy-saving efficiency of the north’s carbon reduction business is the highest and possesses distinct advantages. In environmental protection and resource recycling businesses, energy-saving efficiency is typically suboptimal, leaving significant room for improvement in energy conservation. The energy-saving efficiency of the resource recycling business in the south is currently at its lowest, indicating a significant untapped energy-saving potential.
3.2.4. Analysis of Influencing Factors
The energy-saving efficiency, pure technical efficiency, and scale efficiency of green low-carbon enterprises adjusted by the three-stage DEA are taken as the explanatory variables, and the six influencing factors described in the previous section are taken as the explanatory variables and analyzed by using the Tobit model. The specific constructed regression model is shown in the following formula:
where i denotes the decision unit, t is time, and the other symbols are consistent with the previous explanation.
TEit = β0 + β1Scaleit + β2Qualityi t+ β3Govit + β4Indit + β5Autoit + β6Levit + εit
PTEit = β0 + β1Scaleit + β2Qualityit + β3Govit + β4Indit + β5Autoit + β6Levit + εit
SEit = β0 + β1Scaleit + β2Qualityit + β3Govit + β4Indit + β5Autoit + β6Levit + εit
Tobit regression analyses were performed using Stata17 software, and all continuous variables were trimmed at the 0.01 standard; the results are shown in Table 8.
Table 8.
Tobit model regression results.
The data presented in Table 8 indicate that the regression coefficients for employee quality, policy support, and enterprise automation are all positive. Furthermore, the coefficient for enterprise automation is statistically significant at a level of 1%. The relationship between employee quality and the dependent variable is also statistically significant at a level of 5%. On the other hand, the relationship between policy support and energy efficiency is significant at 10%. This implies that as the enterprise increases its utilization of automated production equipment, the level of human involvement decreases, resulting in reduced resource wastage caused by human intervention. Additionally, implementing advanced computerized machinery minimizes electricity wastage, thereby enhancing the energy efficiency of the enterprise. The higher the education level of enterprise employees, the more intellectual support they can provide regarding innovative technology and sensible resource allocation. This ensures the ongoing advancement of the enterprise’s energy-saving capabilities. The energy-saving assistance strategy the local government implements aims to enhance enterprises’ confidence in investing in energy-saving measures and motivate them to undertake further energy-saving renovations to transmit their energy-saving efficiency [25,26]. The magnitude of the enterprise, the sector in which it operates, and the financial framework all influence the enterprise’s energy conservation efforts, with the magnitude reaching a significant threshold of 10%. As the size of a company increases, the complexity of equipment procedures also increases, making workplace management more challenging. Manufacturing firms generate more pollutants and pollutant gases due to their operational features; there is room for improvement in treating these emissions. Businesses with significant assets and liabilities need to allocate more resources to manage costly inputs’ impact and maximize returns. They must also increase their production output to achieve a high-income level, significantly reducing the company’s pollutants. Policy support and corporate automation significantly enhance firm energy efficiency. Increasing investment by the local government in energy conservation leads to higher levels of enterprise automation, improves the internal and external environment for energy conservation inside enterprises, and enhances the efficient allocation of enterprise resources, resulting in increased resource utilization. Firms that receive more policy support for energy-saving tend to rely more on energy-saving measures, which in turn reduces their independent awareness of energy-saving and the transformation of technological equipment for energy-saving. If monitoring is insufficient, firms may not receive government energy-saving funding allocated to energy-saving enterprises, which can negatively impact the technological efficiency of these enterprises.
The regression coefficient indicates a positive relationship between southern enterprises and enterprise size, with a significant coefficient of 10%. On the other hand, the energy-saving efficiency of northern enterprises is negatively affected due to the differences in industrial structure between the north and south. The southern region primarily focuses on light industry and foreign trade, whereas the northern enterprises are predominantly engaged in agriculture and heavy industry. As the size of firms in the northern region grows, the pollution caused by emissions from heavy industries becomes more serious. Achieving the same degree of energy efficiency as in the southern region demands higher energy expenditure, making it challenging to improve energy efficiency. Moreover, the relationship between the regression coefficients of energy-saving efficiency in enterprises located in the south and north and factors such as employee quality, policy support, and enterprise automation is positive. However, the industry and financing structure have a detrimental effect on improving energy-saving efficiency.
The explanatory variables consist of the energy-saving and carbon-reduction sectors, environmental protection industries, and resource recycling businesses in both the south and north regions. The six influencing factors function as the independent variables. The Tobit model is employed in regression analysis to compute the regression coefficients for each industry in every location. Table 9 displays the six influential components and the regression coefficients derived from the investigation.
Table 9.
Table of regression coefficients for the three green industries in the north–south.
The findings in Table 9 indicate that employee quality and enterprise automation positively impact the energy-saving efficiency of the three green industries, regardless of the region. Enterprise automation has the most significant influence, achieving a statistically significant level of 5%. This suggests that the level of automation in green industries is the most crucial factor for enhancing energy-saving efficiency. The scale of enterprises in the south enhances energy-saving efficiency in the three green industries, whereas in contrast, it has a negative impact in the north. The provision of policy support in the southern region has a detrimental impact on the energy-saving efficiency of the environmental protection and resource recycling industries. This may be attributed to the developed economy in the southern region, resulting in increased government policy support. However, the lack of corresponding supervision and management in fund utilization leads to excessive inputs, thereby hindering improvements in energy-saving efficiency. Due to the nature of the energy-saving and carbon-reduction industries, as well as the resource recycling industry, which mainly involves the production of energy-saving equipment, facilities, and resource recycling facilities, there is a risk of environmental pollution. Therefore, these industries are not suitable for enhancing enterprise energy efficiency. The relationship between finance structure and the industries in each location is not substantial because the financing structure should accurately represent the connection with the energy-saving efficiency of enterprises.
4. Conclusions and Recommendations
This research uses a combination of the three-stage DEA model and the Tobit model to measure and analyze the energy efficiency and influencing factors of 160 green and low-carbon firms from 2018 to 2022. The following conclusions have been drawn:
- (1)
- After evaluating each enterprise’s datum using the three-stage DEA model, the average energy-saving efficiency of firms is 0.213, which is at the general energy-saving level, with substantial variances between regions and industries. Enterprises in the south have a higher average energy-saving efficiency than enterprises in the north, and the energy-saving efficiency of the south’s three key green industries is greater than that of the north. After adjustment, the energy-saving efficiency, pure technical efficiency, and scale efficiency all decreased to some extent compared to the pre-adjustment period, and the average energy-saving efficiency decreased to 0.113, with the energy-saving efficiency at a lower level and significant energy-saving potential of 80%. The average value of pure technical efficiency largely remained constant since the pre-adjustment period, resulting in an overall reduction in adjusted energy-saving efficiency due to a decrease in scale efficiency. Northern firms have a higher average efficiency in energy-saving and carbon-reduction industries, as well as resource recycling. In contrast, the average energy-saving efficiency of southern environmental protection firms remains higher than that of northern enterprises. This implies that the removed ecological variables and random disturbance term support increasing energy-saving efficiency. Because the random disturbance term is unpredictable, altering environmental conditions is one possibility for improving energy efficiency.
- (2)
- The regression results of the Tobit model show that the three factors of employee quality, policy support, and enterprise automation play a significant role in improving the energy-saving efficiency of the three major green industries in the north and the south: the enterprise scale plays a positive role in promoting the energy-saving efficiency of the enterprises in the south and is an impediment to the improvement of energy-saving efficiency of enterprises. The industrial and financial structure of firms has a detrimental impact on the improvement of energy-saving efficiency in both the north and south.
Given the preceding findings, the following countermeasures are proposed:
- (1)
- Strengthen energy-saving support policies. The regression findings of the Tobit model show that policy support helps firms improve their energy efficiency. As the state pushes for more significant energy conservation, energy consumption and environmental protection standards rise, and firms’ professional knowledge reserves and new energy-saving technologies must be enhanced. The government should promote energy-saving information and technology, create a platform for businesses to connect with one another, and offer the required technical assistance. At the same time, it should boost support, lower the enterprise’s energy-saving tax, fund energy-saving projects to provide firms with more financial support, and provide energy-saving subsidies as soon as possible to relieve pressure on energy-saving enterprises. They are unable to provide other assistance based on the “one size fits all” policy due to the disparities in firms’ degrees of development and energy-saving status. The Tobit regression results show that policy support and southern enterprises of the environmental protection industry and resource recycling industry, regarding energy-saving efficiency, plays a negative role, so enterprises in the south should increase their monitoring efforts to ensure that energy-saving funds are invested in the enterprise’s energy-saving transformation rather than used in other areas. Carbon emission policies must continuously be improved to encourage businesses to prioritize energy conservation and increase their energy-saving capabilities.
- (2)
- Improving enterprises’ technological energy savings. The three-stage DEA analysis yields data indicating that the enterprise’s pure technical efficiency is stable, with plenty of room for improvement; assuming that the scale efficiency is stable, improving the enterprise’s pure technical efficiency can significantly improve the enterprise’s energy-saving efficiency. It focuses on structural change, technology advancement, managerial strengthening, and increasing corporate energy efficiency. Among them, structural energy saving and management energy saving recognize that a longer battle line and technological energy saving are the most effective and rapid approaches for improving organizations’ energy efficiency. According to the Tobit model regression results, the degree of automation of enterprises, regardless of the industry, with the north and south regions between the energy-saving efficiency, has had a significant positive impact, so it is critical to improve the degree of automation of enterprises and increase the upgrading and transformation of enterprise equipment and facilities. It should create significant advances in technological, process, equipment, and material innovations. Frequency conversion energy-saving technology, process automation systems, and energy management systems should be employed to encourage automated manufacturing. Contract energy management and contract voluntary agreements are two innovative energy-saving approaches that can help businesses increase their energy efficiency.
- (3)
- Increase the quality of staff. According to the regression results of the Tobit model, the quality of employees plays a positive role in promoting energy-saving efficiency among the three major green industries in the north and south, implying that improving employee quality can improve enterprise energy-saving efficiency to some extent. Employees are a critical component of the organization and the foundation of energy conservation. We should aim to strengthen energy-saving education for enterprise staff and consciously control their conduct from the start. Enterprises must hire more relevant, well-educated technical workers and establish a talent introduction policy. We should define the enterprise’s talent needs, manage the talent strategy implementation process, change the structure of energy-saving R&D personnel, promote rational human resource allocation, accelerate cross-cultural intelligence and talent cultivation across enterprises, and close the talent gap. Enterprise competition is a talent competition that focuses on enhancing employee quality, acquiring highly educated personnel, and improving enterprise energy-saving technological innovation.
- (4)
- Reasonable expansion of enterprise size. The regression results of the Tobit model show that the enterprise scale has a significant positive impact on the improvement of energy-saving efficiency of the three green industries in the south, but has a significant negative impact on the improvement of energy-saving efficiency of the three green industries in the north. Southern firms should logically plan their development strategy, expand to a larger scale when money and policies are available, ensure energy-saving capital investment, and increase energy efficiency. Northern firms should focus on balanced development rather than blind expansion and should prioritize energy savings and emission reduction while extending their scale in order to alleviate the strain on environmental pollution and energy saving.
Author Contributions
Writing—original draft preparation and collecting field data, F.X.; writing—review and editing and formal analysis, T.S.; provision of experimental protocols and geometric modeling, R.H.; data processing and drawing, M.Z. All authors have read and agreed to the published version of the manuscript.
Funding
This research was funded by the Hebei Postdoctoral Innovation Fund; grant number B2019005005.
Institutional Review Board Statement
Not applicable.
Informed Consent Statement
Not applicable.
Data Availability Statement
The original contributions presented in the study are included in the article material, further inquiries can be directed to the corresponding author.
Conflicts of Interest
The authors declare no conflicts of interest.
References
- China Academy of Engineering Science and Technology Development Strategy. 2021 Report on the Development of Strategic Emerging Industries in China; Science Press: Beijing, China, 2020; pp. 141–142. [Google Scholar]
- Li, D.B.; Yuan, X.; Wang, Y. Efficiency analysis of science and technology-based enterprises in the new three boards of Sichuan province based on DEA model. Natl. Circ. Econ. 2023, 22, 136–139. [Google Scholar] [CrossRef]
- Wu, D.R.; Xu, Y.J. Research on the efficiency of rural e-commerce level and regional economic development in Jiangxi Province—Based on DEA model. Shanxi Agric. Econ. 2023, 21, 50–53. [Google Scholar] [CrossRef]
- Zhang, J.J.; Huang, B.R.; Su, L.Y. Research on energy saving and emission reduction potential of traditional industries in Jiangxi Province based on DEA model. Pract. Underst. Math. 2018, 48, 9–19. [Google Scholar]
- Sun, Y.C.; Rao, Z.H.; Tang, M.C. Evaluation of Energy Saving and Emission Reduction Efficiency in Guangdong Province Based on Undesired Output. J. Harbin Inst. 2020, 41, 31–33. [Google Scholar]
- Wang, H.Y.; Lian, J.L. Evaluation of operational efficiency of new energy wind power manufacturing enterprises based on three-stage DEA. Mod. Ind. Econ. Inf. Technol. 2023, 13, 238–241. [Google Scholar] [CrossRef]
- Zhang, J.G.; Yang, H.J. Evaluation of provincial energy saving and emission reduction efficiency based on DDF-DEA three-stage model. China Popul.-Resour. Environ. 2018, 28, 24–31. [Google Scholar]
- Zhu, Z.H.; Li, J.J. Evaluation and trend analysis of regional energy conservation and emission reduction efficiency in Fujian Province—Based on three-stage SBM-DEA model. J. Fujian Bus. Coll. 2020, 5, 1–8+81. [Google Scholar] [CrossRef]
- Zhang, H.; Mao, J.H.; Wang, T.Y. The main influencing factors of technological innovation efficiency improvement in China’s intelligent manufacturing enterprises—An analysis based on the three-stage DEA-Tobit model. Res. Sci. Technol. Manag. 2023, 43, 95–101. [Google Scholar]
- Yang, Q.S.; Yang, T.A.; Shen, Z.G. Evaluation of Innovation Efficiency and Analysis of Influencing Factors in National High-Tech Zones-Based on Three-Stage DEA-Tobit Model. Innov. Technol. 2023, 23, 13–27. [Google Scholar] [CrossRef]
- Ma, W.B.; Zhu, H. Research on the Measurement of Innovation Efficiency and Influencing Factors of Green and Low-Carbon Enterprises-Based on Three-Stage DEA and Tobit Model. Soft Sci. 2023, 1–12. [Google Scholar]
- Li, J.N. Research on Green Innovation Efficiency and Its Influencing Factors under the Perspective of Science and Technology Finance; Gannan Normal University: Ganzhou, China, 2023. [Google Scholar]
- Tian, J.L.; Xiang, S.; Rong, W. Exploring the Measurement of Regional Forestry Eco-Efficiency and Influencing Factors in China Based on the Super-Efficient DEA-Tobit Two Stage Model. Forests 2023, 14, 300. [Google Scholar] [CrossRef]
- Han, B.; Feng, X.W.; Su, Y. Research on innovation efficiency measurement and influencing factors of Chinese new energy vehicle listed companies—Based on three-stage DEA and Tobit panel model. Sci. Technol. Prog. Countermeas. 2023, 40, 110–120. [Google Scholar]
- Lu, F.; Han, H.; He, B. Evaluation on the development of urban low-carbon passenger transportation structure in Tianjin. Res. Transp. Bus. Manag. 2024, 55, 101142. [Google Scholar] [CrossRef]
- Fried, H.O.; Lovell, C.K.; Schmidt, S.S. Accounting for Environmental Effects and Statistical Noise in Data Envelopment Analysis. J. Product. Anal. 2002, 17, 157–174. [Google Scholar] [CrossRef]
- Qin, J.J. Energy saving and carbon reduction paths in industrial enterprises. Resour. Conserv. Environ. Prot. 2023, 12, 1–4. [Google Scholar] [CrossRef]
- Wen, Z.L.; Zou, W. Analysis of energy-saving diagnostic problems and countermeasures for green low-carbon transformation in small and medium-sized enterprises in Jiangxi Province. Energy Res. Manag. 2023, 4, 10–15. [Google Scholar] [CrossRef]
- Lin, R.J. Research on Energy Measurement Management and Energy Saving and Consumption Reduction of Enterprises under the Goal of “Double Carbon”. Energy Energy Conserv. 2023, 12, 72–74. [Google Scholar] [CrossRef]
- Dong, Y. Research on the Impact of Energy-Saving and Environmental Protection Industrial Policy on the Investment Efficiency of Green Enterprises; Hebei University: Tianjin, China, 2023. [Google Scholar] [CrossRef]
- Liu, S.; Kuang, J.; Ding, D.; Madsen, D.Ø.; Shi, X.; Fan, X. Low-carbon governance, fiscal decentralization, and enterprise green development: Evidence from China. PLoS ONE 2024, 19, e0296490. [Google Scholar] [CrossRef]
- Xiao, R.Q.; Chen, Z.W.; Qian, L. Research on innovation efficiency of China’s high-tech manufacturing industry under the perspective of heterogeneous technology. Manag. Sci. 2018, 31, 48–68. [Google Scholar]
- Dai, K.Z. The impact of technology market development on export technology complexity and its role mechanism. China Ind. Econ. 2018, 117–135. [Google Scholar]
- Vandevenne, N.; Riel, V.J.; Poels, G. Green Enterprise Architecture (GREAN)—Leveraging EA for Environmentally Sustainable Digital Transformation. Sustainability 2023, 15, 14342. [Google Scholar] [CrossRef]
- Xia, L. The impact of government subsidies on corporate R&D investment--an empirical analysis based on strategic emerging industries. Friends Account. 2020, 24, 132–137. [Google Scholar]
- Su, Y.; Lin, Y.N. Research on the impact of government subsidies on R&D investment of new energy enterprises. Sci. Manag. Res. 2021, 39, 102–110. [Google Scholar] [CrossRef]
Disclaimer/Publisher’s Note: The statements, opinions and data contained in all publications are solely those of the individual author(s) and contributor(s) and not of MDPI and/or the editor(s). MDPI and/or the editor(s) disclaim responsibility for any injury to people or property resulting from any ideas, methods, instructions or products referred to in the content. |
© 2024 by the authors. Licensee MDPI, Basel, Switzerland. This article is an open access article distributed under the terms and conditions of the Creative Commons Attribution (CC BY) license (https://creativecommons.org/licenses/by/4.0/).