Abstract
An integrated construction station for an expressway is characterized by complex carbon emission sources and high carbon emission intensity. Conducting carbon emissions accounting makes possible a comprehensive understanding of these characteristics, enabling targeted and guided carbon reduction efforts, which is crucial for advancing the low-carbon development of expressway construction. This paper, based on an in-depth analysis of the carbon emission structure during the operational period of an integrated expressway construction station identifies, as calculation boundaries, eight categories: residential areas, station transportation, mixing stations, precast beams, steel bar yards, artificial carbon emissions, chemical reactions during construction, and construction conditions. The study adopts a “bottom-up” approach to carbon emission measurement and constructs a carbon emission model for the production and operational period of the integrated construction station, based on the carbon emission factor method. Using the SG-2 section of the Fengqiu to Xiuwu stretch of the Changxiu Expressway as an engineering case, carbon emissions accounting for each component of the integrated construction station’s operational period was conducted, and the results were compared with the station’s monitoring system. High-precision characterization and calculation of total carbon emissions, as well as emissions from each process and piece of equipment during the operational period, were achieved. The results indicate that: (1) the relative error between the overall calculation results and actual monitoring is 3.6%, verifying the model’s accuracy; (2) the monthly carbon emissions of the integrated construction station during the operational period reached 72.15 tons; (3) there is a significant difference in carbon emissions among the different processes, with the highest emissions coming from transportation and residential areas, accounting for 43.4% and 23.7%, respectively. Therefore, electrification of transportation equipment could significantly reduce the overall carbon emissions of the integrated construction station.
1. Introduction
Carbon dioxide emissions are the main cause of the greenhouse effect [1]. To reduce these emissions, China has set ambitious goals: achieving peak carbon emission by 2030 and carbon neutrality by 2060. However, with China leading the world in expressway network size [2], the construction of these expressways will consume substantial energy and raw materials [3,4,5,6]. As temporary sites and transportation hubs for raw material processing, integrated expressway construction stations are hotspots for energy consumption and carbon emissions. The lifecycle of an integrated expressway construction station can be divided into three stages: land acquisition, construction, and operation. Among these, the operation stage is a significant source of carbon emissions, characterized by complex emission sources and high carbon intensity. Unfortunately, current methods for monitoring and management of carbon emissions and energy consumption at these stations are inadequate, leading to inefficient energy use. Therefore, it is crucial to implement precise emission reduction and source management strategies during the operation phase of expressway construction, utilizing a scientific carbon emissions accounting system. This approach would enable the construction of a high-precision carbon emissions accounting model to quantify emissions accurately, contributing significantly to the overall low-carbon transition in expressway construction.
Many scholars have conducted extensive research on accounting for carbon emissions related to highways [7,8,9,10]. The carbon emission coefficient method (which refers to the amount of carbon emissions produced per unit of energy consumed during the combustion or use of each type of energy) [11] and the life cycle assessment method [12] (LCA) (a method used to compile and evaluate the potential environmental impacts of all inputs and outputs associated with a product, activity, technology, or service system throughout its entire life cycle) have been widely used. For example, Barandica J. M. [13] and colleagues assessed greenhouse gasses in road construction projects from a life cycle perspective, identifying key contributors to emissions to develop strategies for their control and reduction. Hasan U. et al. [14] applied the LCA methodology to calculate and analyze the environmental impacts of roadworks throughout the life cycle of a highway project in Abu Dhabi. Xiaoyue Zhang et al. [15] divided the construction period of an expressway greening project into three stages: raw material production, raw material transportation, and site construction, and took the Beijing–Hong Kong–Macao expressway greening project as a case to quantitatively calculate the carbon emissions of an expressway greening project, and compared the carbon emissions of each stage. Hao Cheng et al. [16] applied life cycle theory to divide the road construction period into stages and established a quantitative calculation model for carbon emissions. Xiaohang Zhang et al. [17] proposed three carbon emission evaluation indexes for expressway assets, maintenance and repair, and traffic, and established a comprehensive evaluation system for carbon emission indexes during the operational period of Chinese expressways. Chunjing Shang et al. [18] calculated the energy consumption and atmospheric emissions generated during the life cycle of expressways by applying the life cycle assessment (LCA) theory and method. As a result, many scholars have established carbon emission models for different project stages, analyzing energy consumption structures, carbon emission intensity, and other related aspects.
However, the operational period of integrated construction stations involves complex process equipment and relying solely on the carbon emission coefficient method or the life cycle assessment (LCA) method has limitations. Additionally, there is no unified standard accounting guideline for integrated construction stations, leading to a lack of practical research outcomes. To accurately capture the carbon emission characteristics of integrated construction terminals during their operational period, this paper combines the carbon emission coefficient method with the life cycle assessment (LCA) method. After calculating energy consumption using the life cycle method, carbon emissions are estimated using default carbon emission factor values for energy types provided by the IPCC. Focusing on the operation phase of integrated expressway construction stations, this study analyzes the composition of carbon emission sources and constructs a carbon emission model for the production and operational periods. The model encompasses eight categories: residential areas, station transportation, mixing stations, precast beams, rebar yards, artificial carbon emissions, chemical reactions during construction, and construction conditions. Based on the SG-2 bid section of the Changxiu Highway from Fengqiu to Xiuwu, the carbon emissions for various parts of the comprehensive construction station during the operational phase are calculated and compared with the emissions data from the monitoring system to validate the model’s applicability. This analysis also assesses the carbon emissions for each process, providing a basis for energy conservation and carbon reduction efforts. This study establishes a comprehensive accounting method for the station based on the carbon emission factor and life cycle assessment (LCA) methodologies, filling a gap in the research on carbon emissions during the operational phase of comprehensive construction stations.
2. Carbon Emission Calculation Scope of Comprehensive Expressway Construction Station during Operational Period
2.1. Carbon Emission System Boundary
The actual carbon emissions during the operational period of an integrated expressway construction station are primarily concentrated into eight categories: residential areas, station transportation, mixing stations, precast beams, steel bar yards, labor, chemical reactions during construction, and construction conditions. Among these, the residential areas include living quarters, laboratories, and project offices. The station transportation category can be further divided into specific transportation vehicles, and each station can be further classified according to specific construction machinery.
2.2. Classification of Carbon Emission Sources
Carbon emissions during the operational period of the integrated construction station primarily include electricity consumed by machinery and equipment, fossil fuels, worker activities, chemical reactions during construction, and the effects of construction conditions. However, different types of equipment and energy sources have varying energy types and working modes. If carbon emissions across different categories are not calculated using a consistent index, it becomes challenging to quantify and compare them. Therefore, the carbon emissions per unit of energy consumption are selected as the standard index to calculate the emissions for each station.
2.3. Carbon Emission Factor Method
The carbon emissions were calculated using the emission factor method. By multiplying the amount of energy consumed by the corresponding carbon emission factor, the resulting carbon emissions can be determined:
where, E is the carbon emissions; T is the energy consumption; EF is the carbon emission factor.
2.4. Carbon Emission Factors
The carbon emission factor represents the amount of carbon dioxide (CO2) emitted per unit of energy or material consumed. It is a crucial parameter for assessing the environmental impact of energy use. This factor is typically expressed in terms of CO2 emissions per unit of energy, such as per kilowatt-hour of electricity or per kilogram of fuel, with units like tCO2/t or tCO2/kWh.
Based on extensive references [19,20,21,22,23,24,25] and industry standards, the carbon emission factors for fuel oil and electricity were determined according to the “Accounting Methods and Reporting Guidelines for Greenhouse Gas Emissions of Enterprises for Power Generation Facilities (Revised 2022 Edition)” (GEO Climate [2022] 111). The carbon emission factors for each energy source are presented in Table 1:

Table 1.
Carbon emission factors of each energy source.
3. Construction of Carbon Emissions Accounting Model during Operational of Integrated Expressway Construction Station
3.1. Carbon Emissions Accounting Model during the Operational Period
The carbon emission model for the operational period of an integrated expressway construction station was developed using a measurement-based approach. The total carbon emissions during this period are calculated as the sum of emissions from residential areas, station transportation, mixing stations, precast beams, steel bar yards, labor activities, chemical reactions during construction, and construction conditions. Therefore, the formula for calculating carbon emissions during the operational period of the integrated expressway construction station is as follows:
where, is the total carbon emissions during the operational period of the comprehensive construction terminal, ; is the resident carbon emissions during the operational period of the integrated construction station, ; is the transportation carbon emissions of the integrated construction station during the operational period, ; is the carbon emissions of the mixing station during the operational period of the complex, ; is the carbon emissions of the beam field during the operational period of the integrated construction station, ; is the carbon emissions of the steel bar yard during the operational period of the integrated construction station, ; is the artificial carbon emissions during the operational period of the complex construction station, ; is the chemical reaction carbon emissions of the construction process during the operational period of the integrated construction station, ; is the carbon emissions influenced by construction conditions during the operational period of the integrated construction station, .
The processes and machinery of different sites are different, so it is necessary to build corresponding carbon emission models according to the characteristics of each site.
3.2. Carbon Emission Model of Residential Area
The residential area primarily consists of three sections: the living area, the laboratory, and the project department. Therefore, the carbon emissions of a residential area are calculated as the sum of the electricity consumption of each section, multiplied by the carbon emission factor for electricity, as shown in the following formula:
where, is the total electricity consumption of the living area, KWh; is the total electricity consumption of the laboratory, KWh; is the total electricity consumption of the project department, KWh; is the local electric power carbon emission factor, .
3.3. Transportation Carbon Emissions of the Integrated Construction Station
During the operational period of the integrated expressway construction station, road transportation is generally used. The carbon emissions from road transport are influenced by factors such as transport distance, transport machinery, and transport management. The varying empty load rates of different transportation machinery complicate the calculation of carbon emissions during the transportation process. Therefore, a method using the vehicle transportation carbon emission factor is proposed to determine the carbon emissions during transport. Based on the actual production conditions of the integrated construction station, the distance from the transportation equipment to the construction site, along with the fuel consumption and empty load rate of each piece of transportation equipment, is monitored. These data are then multiplied by the corresponding fossil energy carbon emission factor to calculate the carbon consumption per unit shift of transportation equipment, as shown in the following formula:
where, represents the sensor number of the monitoring vehicle; indicates the transport distance of the -type monitoring vehicle, km/shift; represents the fuel consumption per 100 km of the -type monitoring vehicle, t/100 km; is the local fuel carbon emission factor, , is the empty load rate.
3.4. Carbon Emission Model of Each Station
The integrated construction station is divided into a mixing station, a steel bar yard, and a precast beam plant, and its energy consumption is mainly electric power. Different stations utilize different processes and equipment. The carbon emissions of a single device can be calculated by multiplying the equipment’s power consumption by its operating time and the power emission factor. The total carbon emissions for each station can then be determined by summing the carbon emissions of all equipment involved in the various processes.
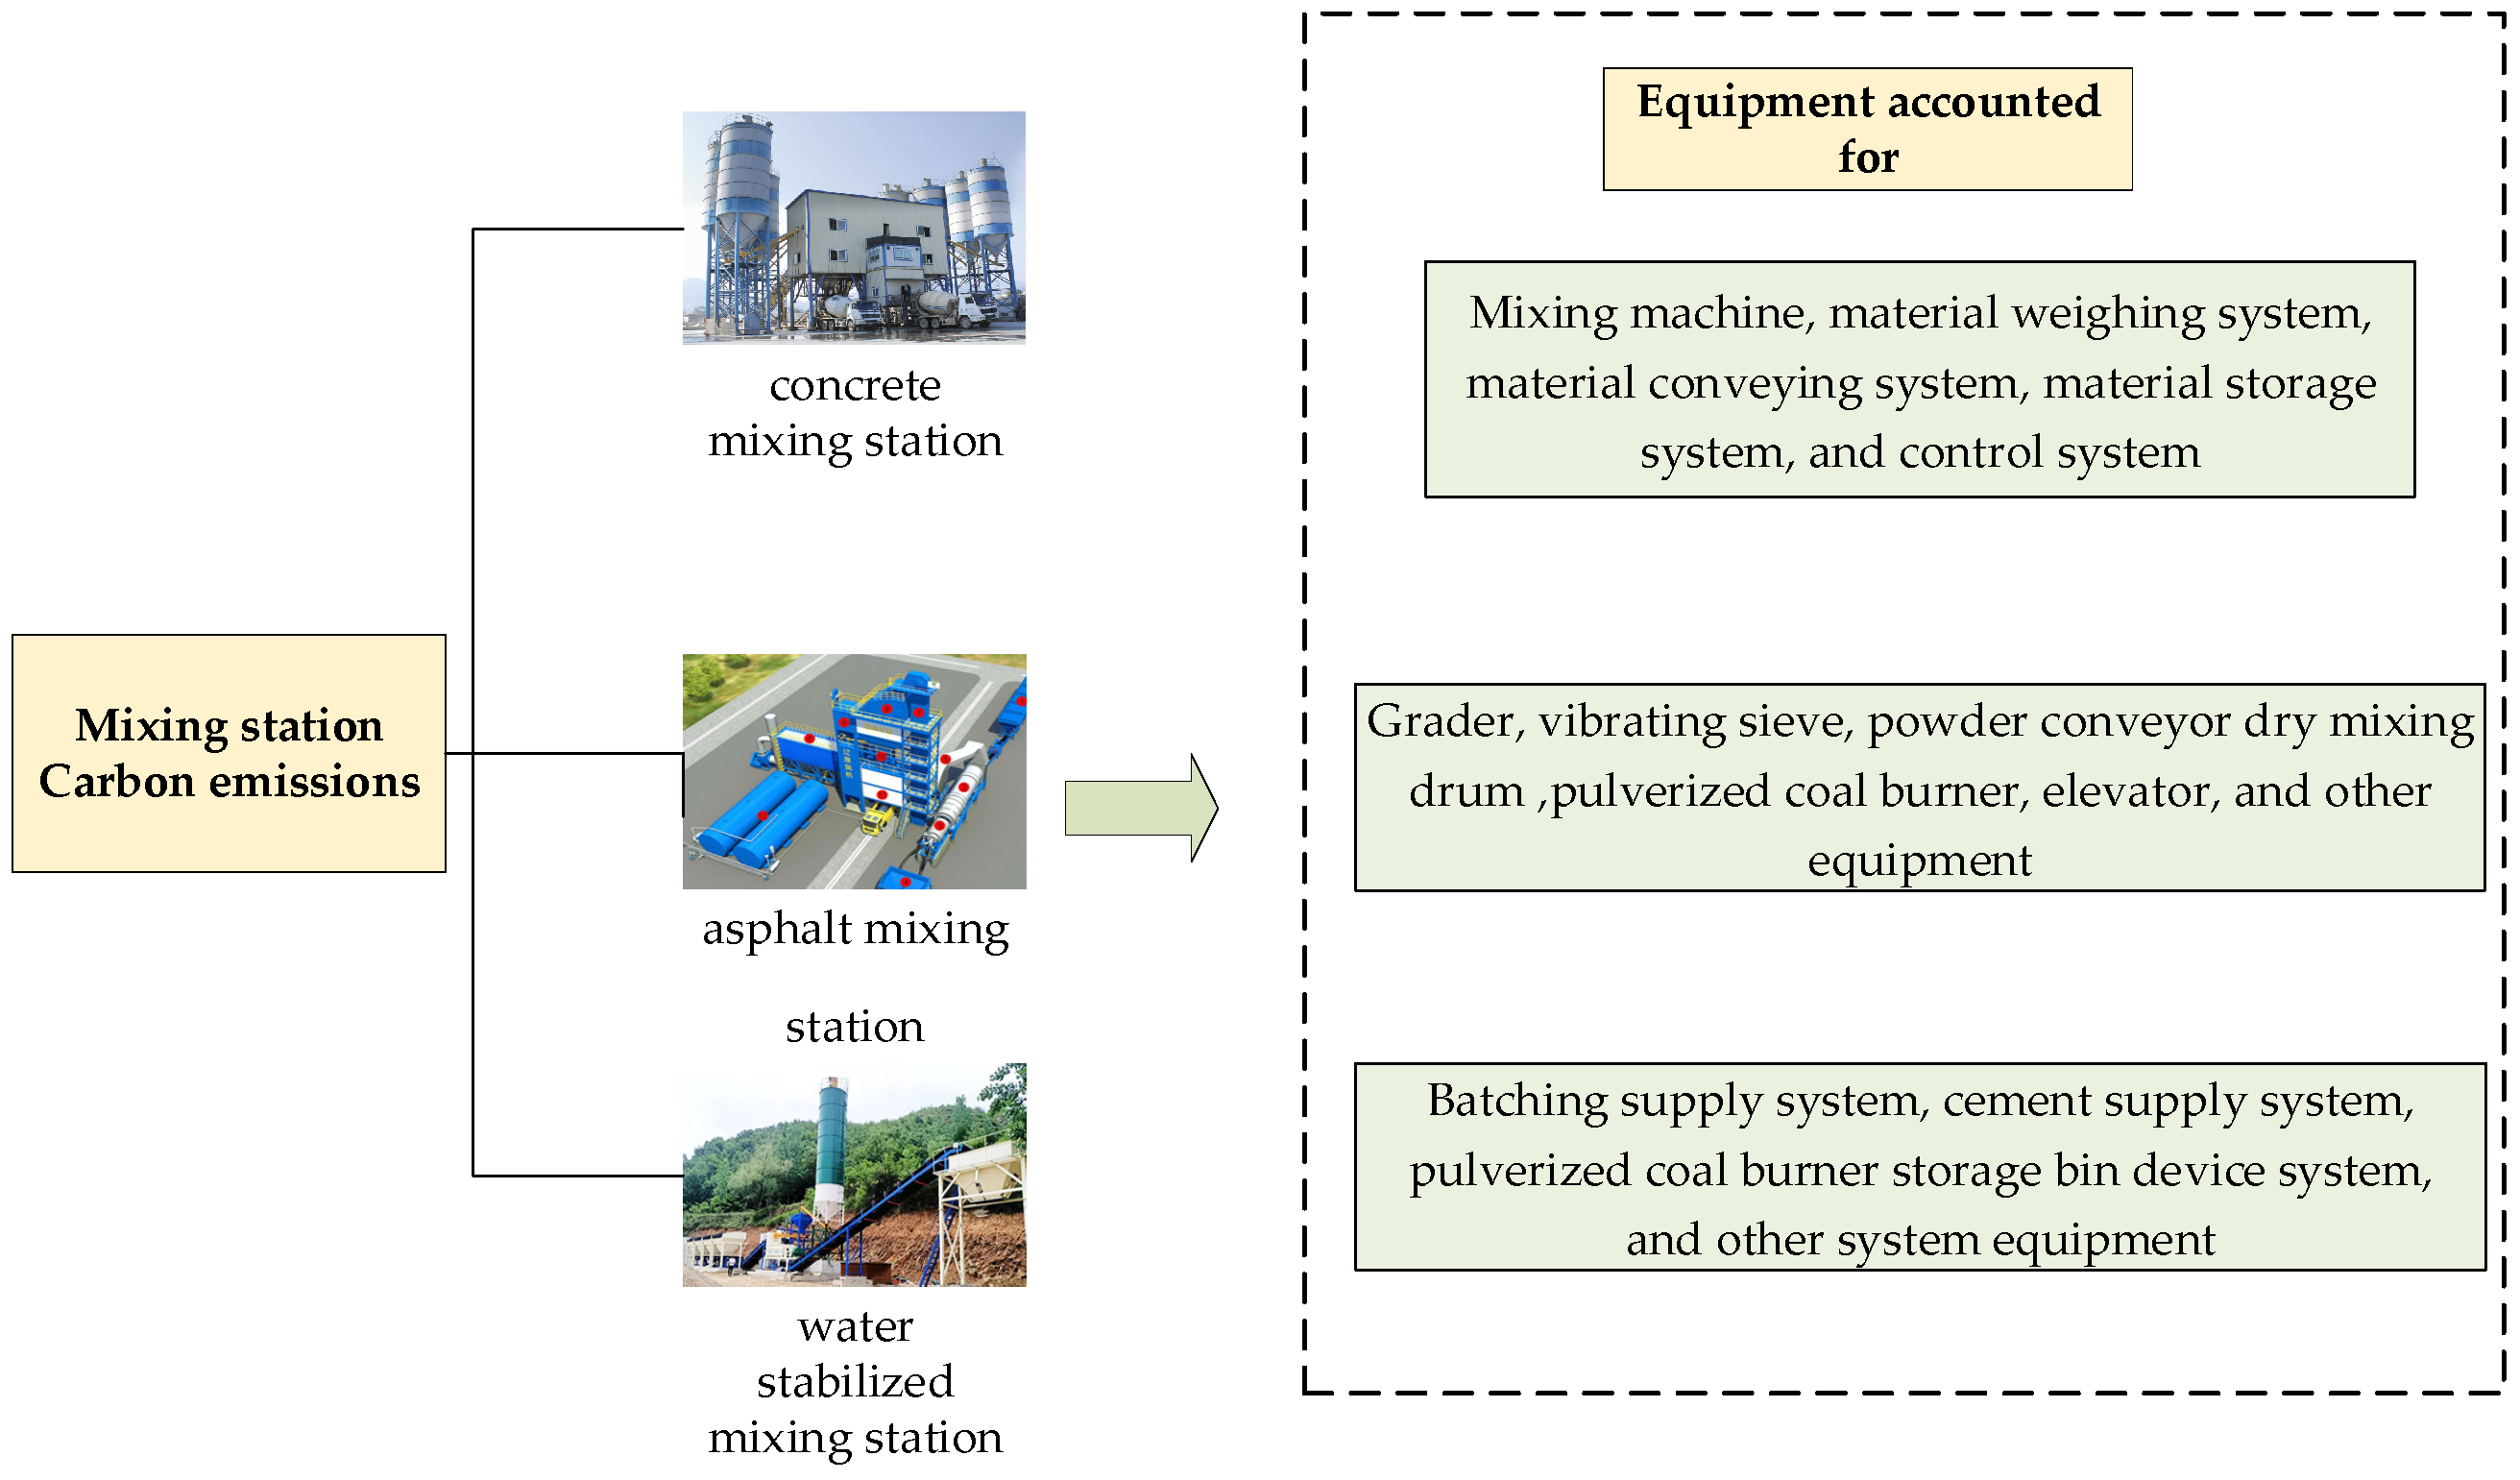
3.4.1. Mixing Station
The mixing station is divided into a water stabilized mixing station, an asphalt mixing station, and a concrete mixing station. Since the mixing station uses electrical energy, its carbon emissions can be calculated by multiplying the power consumption per shift of the mixing station by the carbon emission factor, as shown in the following formula:
where, is the power of the mixing station area, KW; is the carbon emission factor of the mixing station, KWh; is the working time, i.e., the machine shift. The carbon emissions accounting of the mixing station is shown in Figure 1.

Figure 1.
Carbon emissions accounting diagram of mixing station.
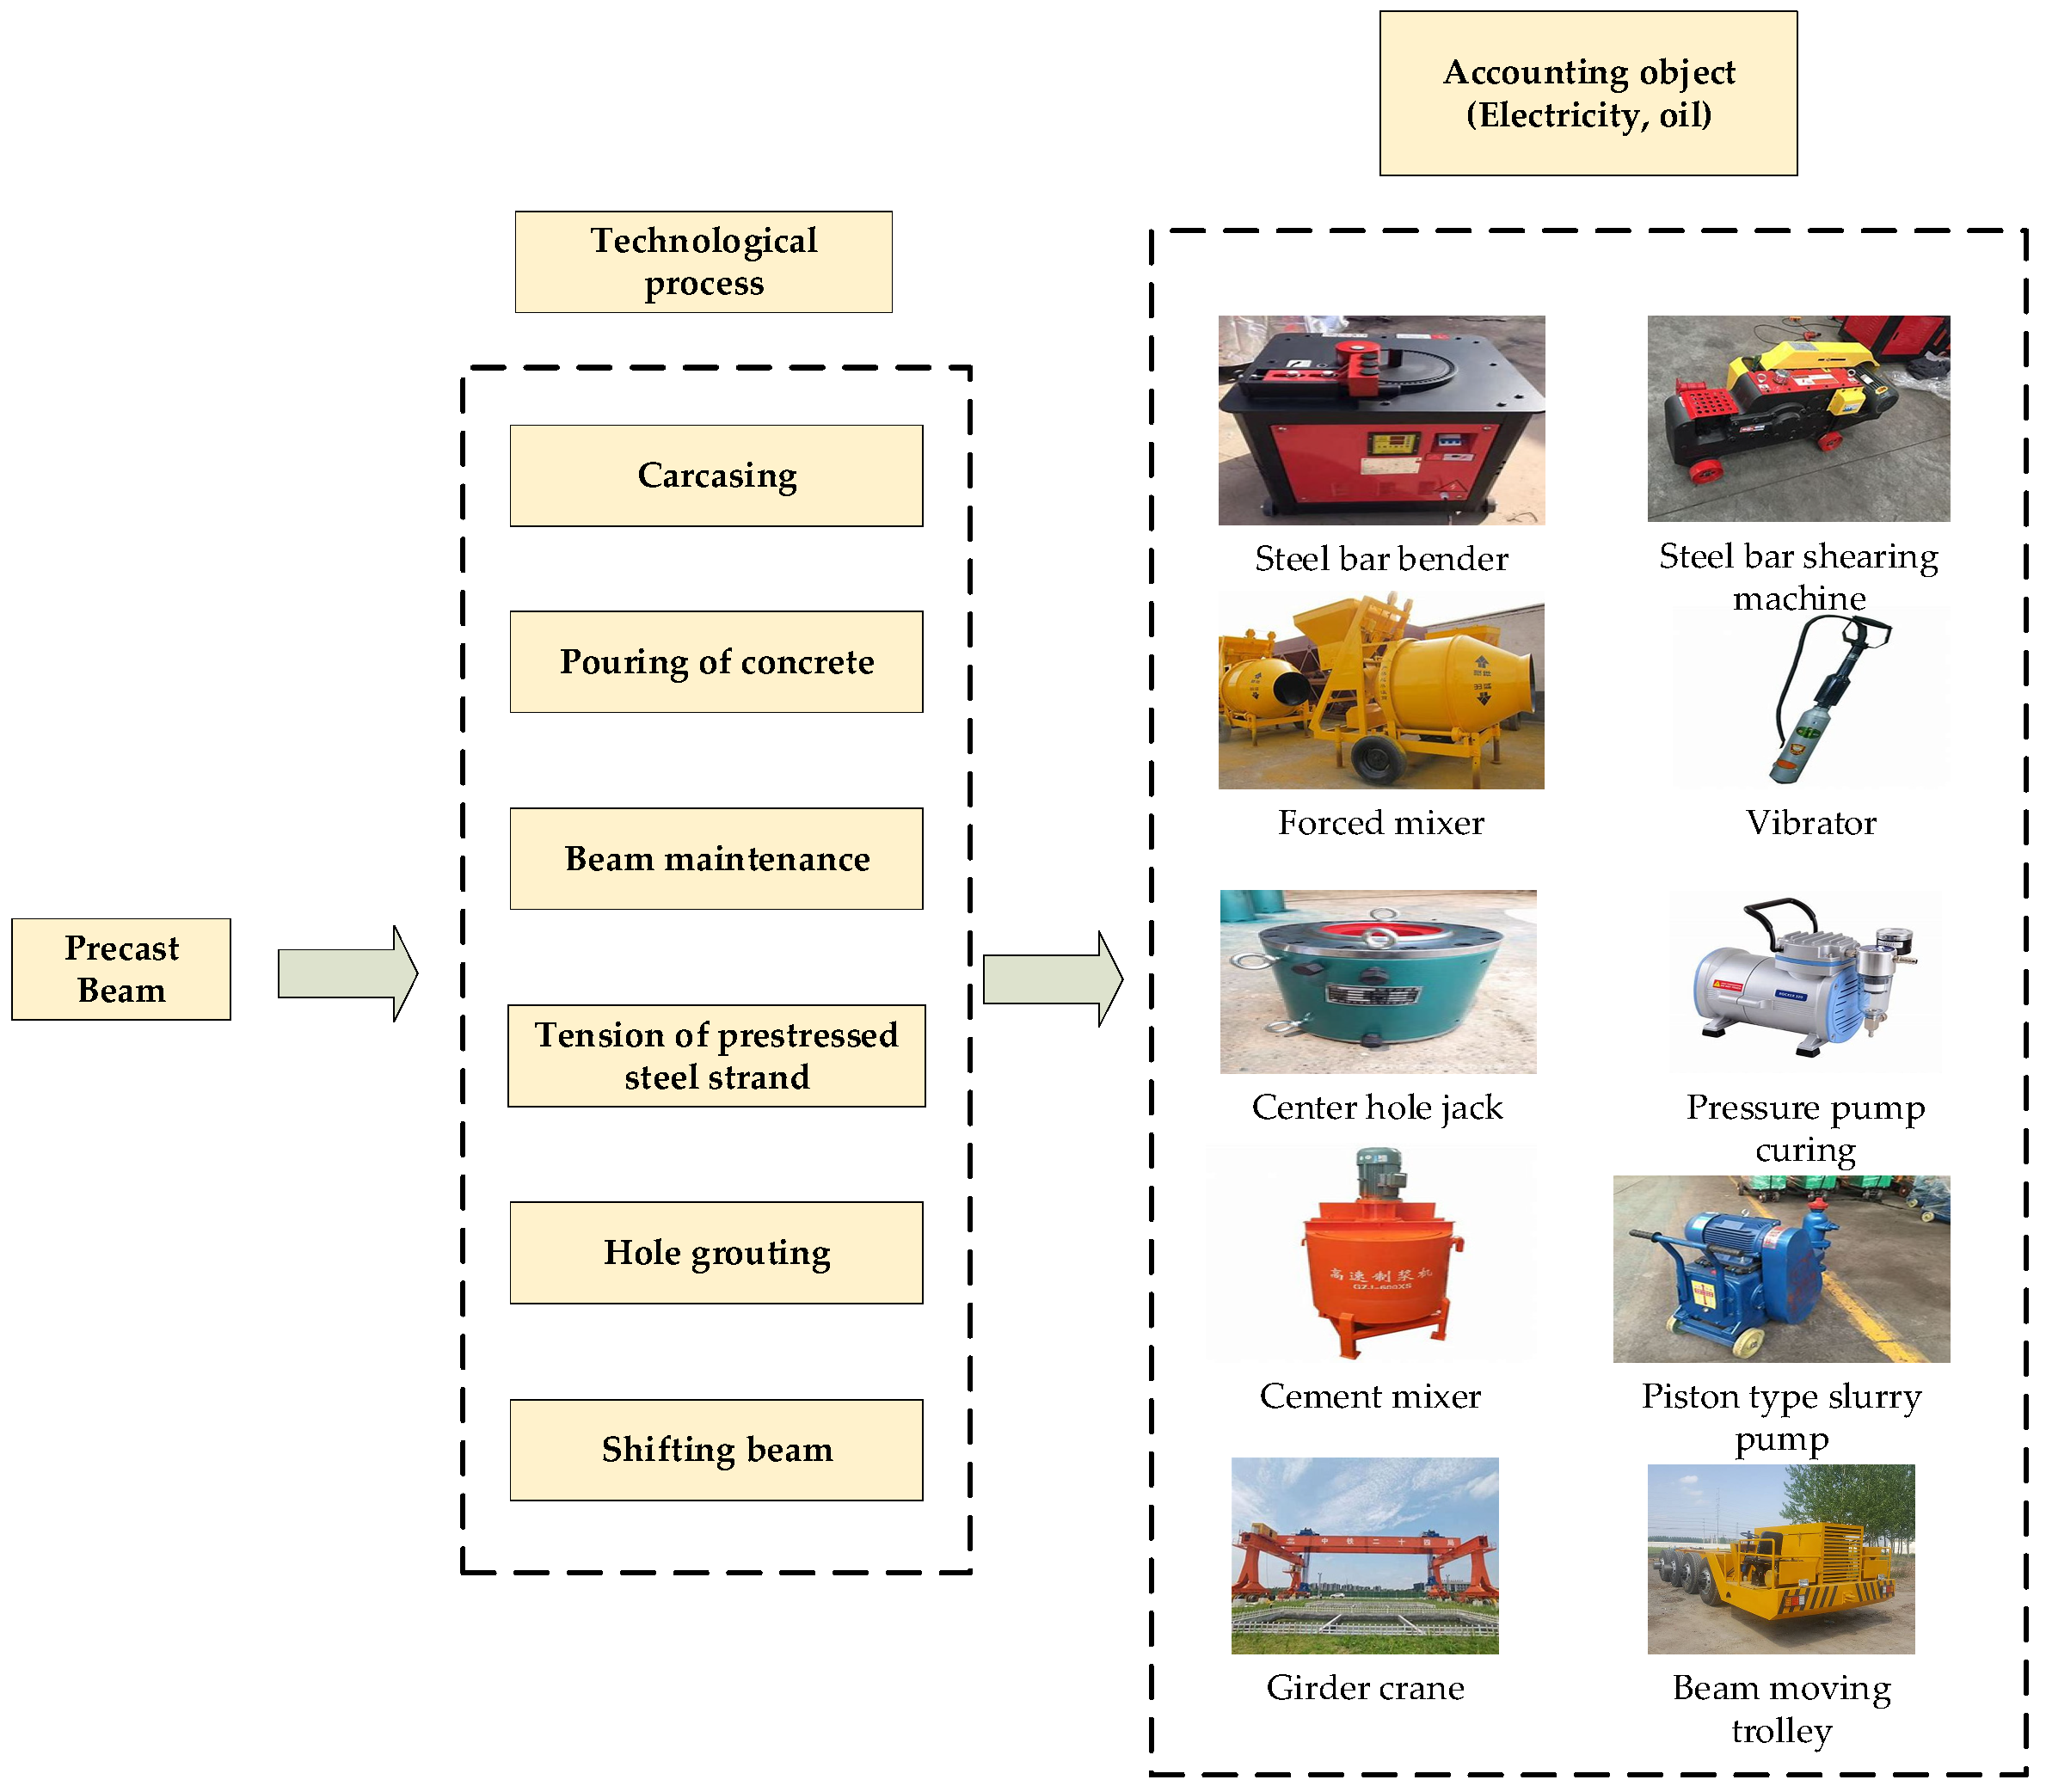
3.4.2. Precast Beam Plant
The precast beams, produced on-site as simple supported concrete beams for bridges, are transported to the construction site using a beam conveyor and beam erecting machine. The total carbon emissions per unit working cycle, as well as the carbon emissions of each piece of processing equipment, are calculated by multiplying the operating time of each piece of equipment by its power consumption. The resulting electricity usage is then multiplied by the corresponding energy’s carbon emission factor to determine the total carbon emissions per unit working cycle and for each piece of processing equipment. Refer to the following formula:
where, is the average working efficiency of the electric equipment i, kw; is the average working time of electric equipment i during the unit working week, h; is the electricity per unit working cycle of the gantry crane, KWh; is the electricity quantity per unit working cycle of the steam raising shed, KWh. The carbon emissions accounting diagram of the precast beam is shown in Figure 2.

Figure 2.
Carbon emissions accounting diagram of precast beam.
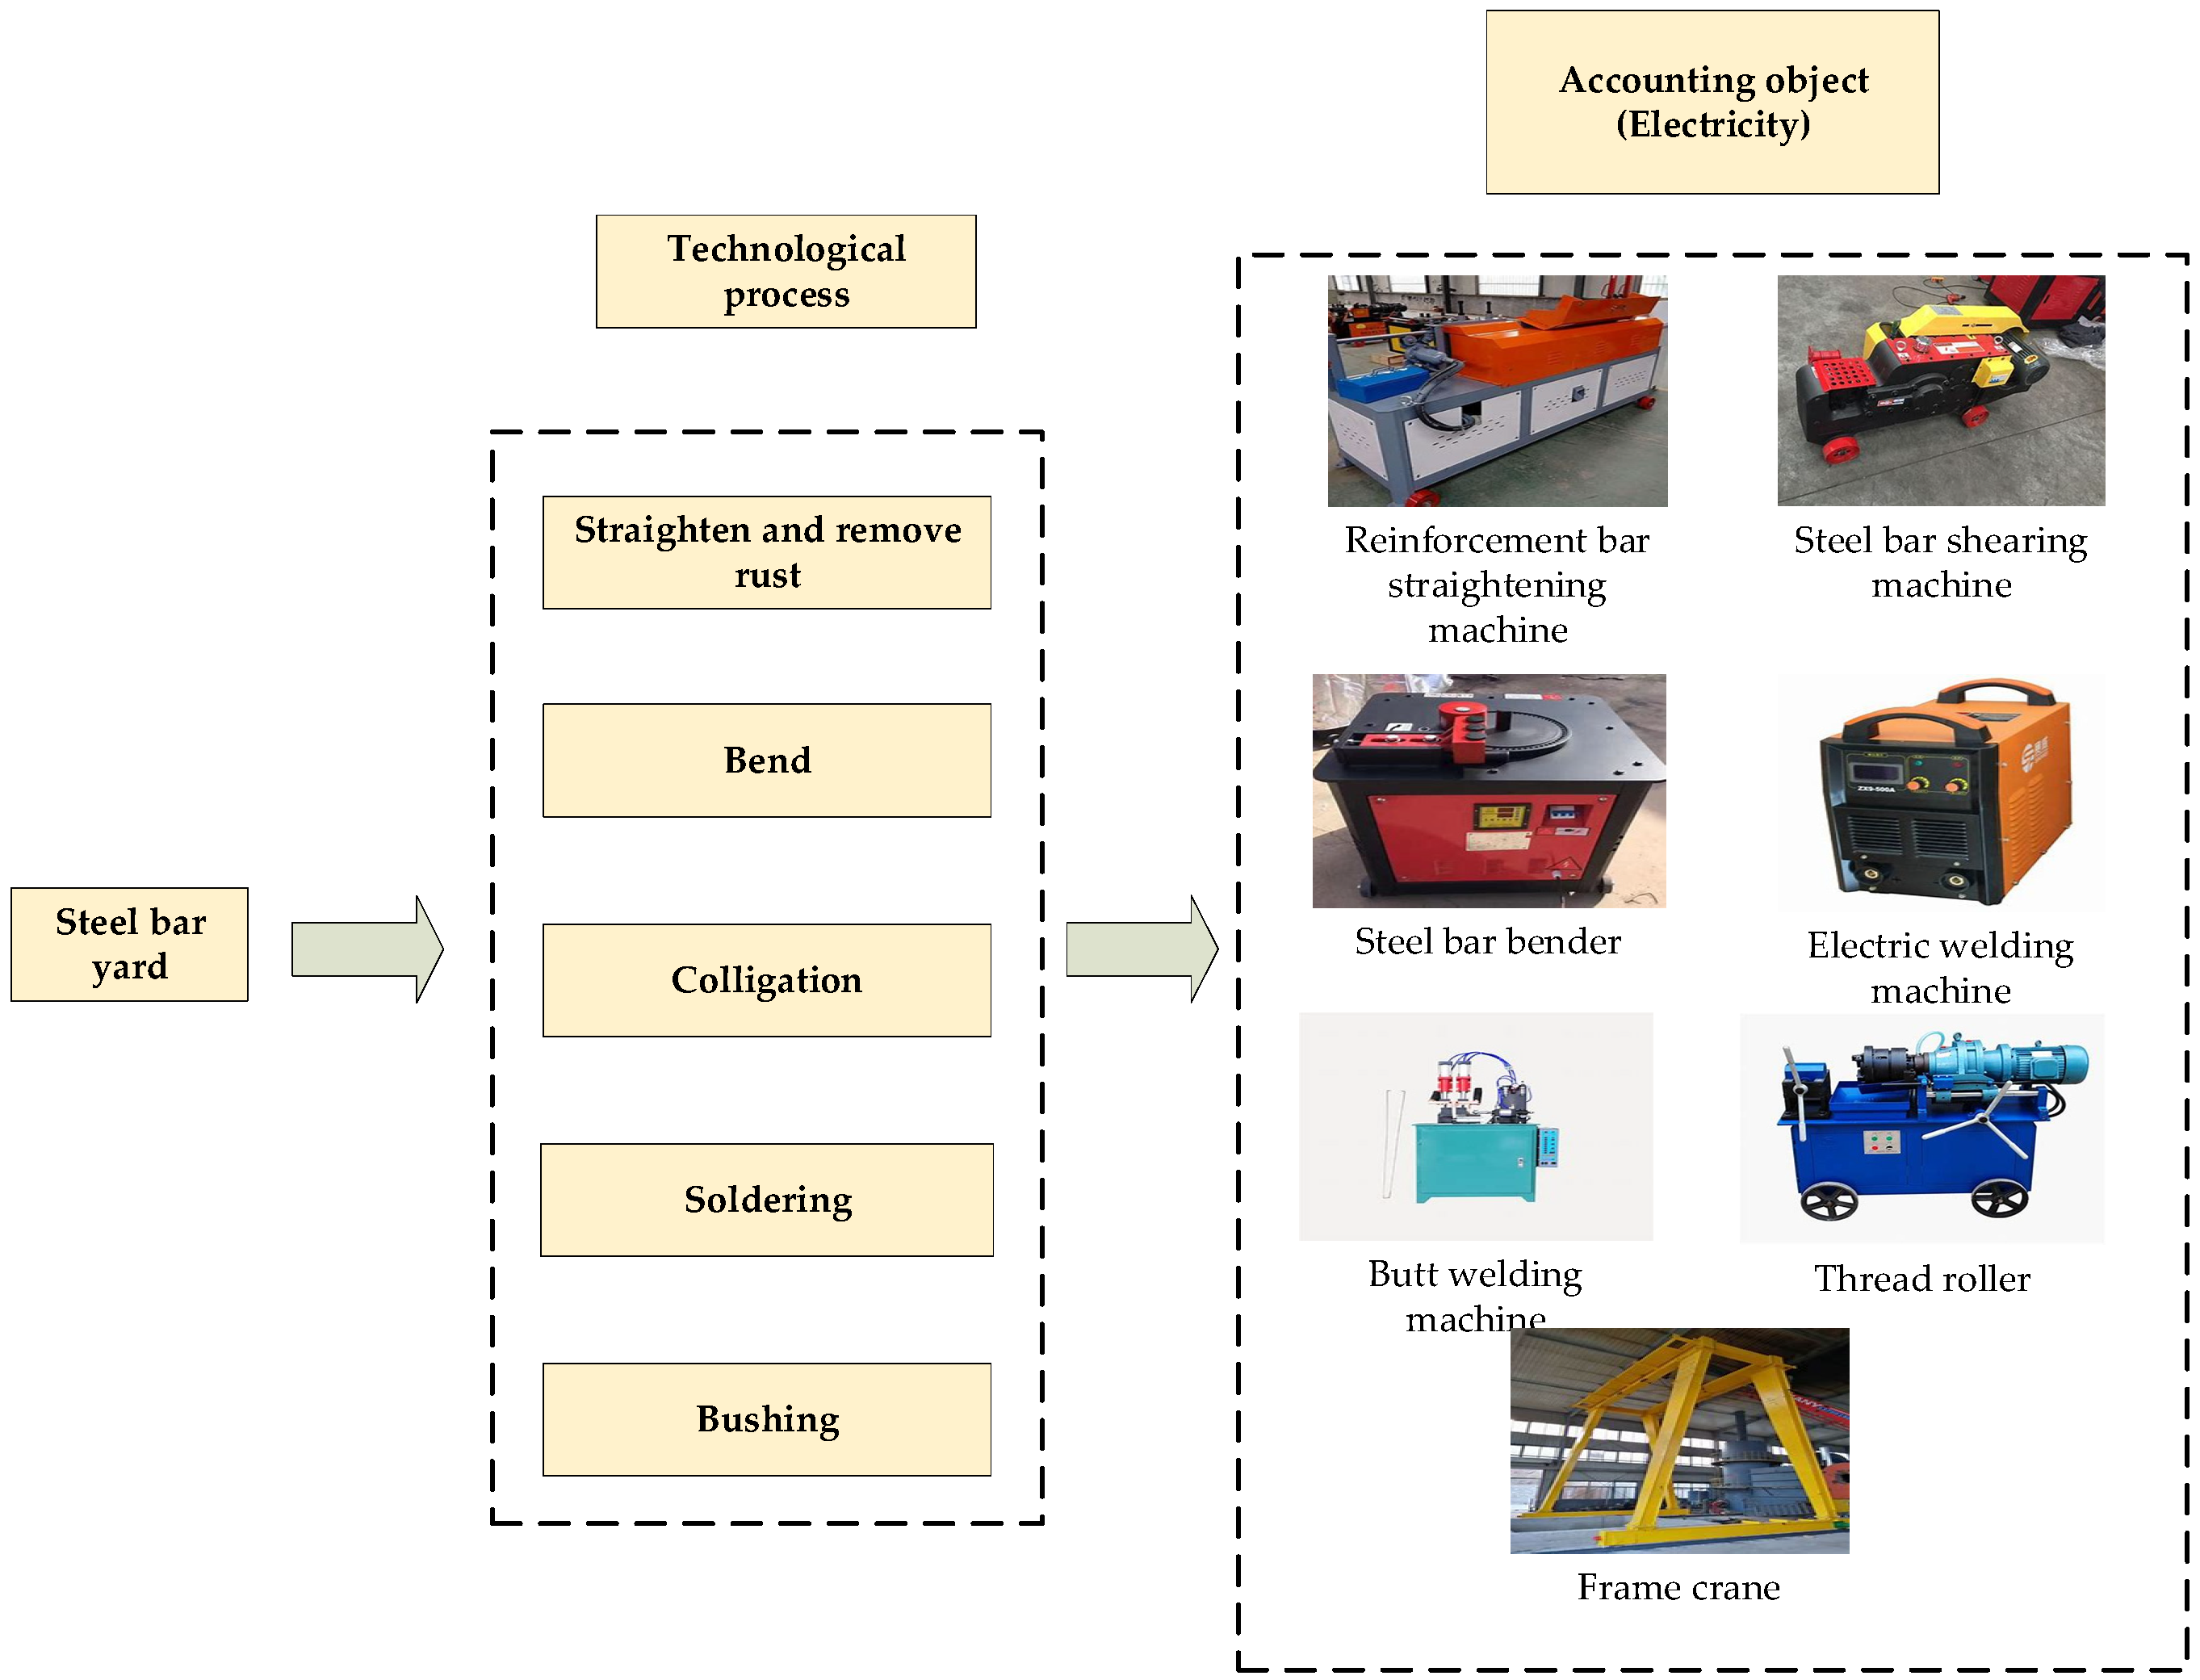
3.4.3. Steel Bar Yard
The steel bar yard undertakes the task of steel bar processing, and the steel bar is concentrated as much as possible at one location. The processed steel bar adopts the centralized distribution method, and the construction output is directly transported to reduce the amount of secondary handling. According to the production process of straightening, rusting, bending, lashing, and welding at the steel bar yard, combined with the equipment configuration table of the standardized steel bar processing plant as shown below, by summarizing the electricity consumption of each equipment (power and working time), the carbon emissions of each process and the steel bar field during the entire working cycle are calculated.
where, is the average working efficiency of the electric equipment i, KW; is the average working time of electric equipment i during the unit working week, h; is the electricity per unit working cycle of the gantry crane, KWh. The carbon emissions accounting diagram of the steel bar yard is shown in Figure 3.
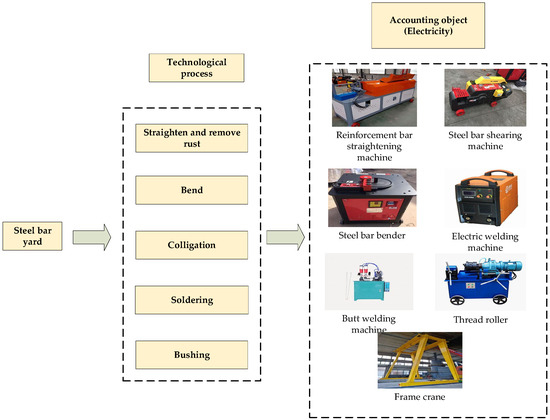
Figure 3.
Carbon emissions accounting diagram of steel bar yard.
3.5. Artificial Carbon Emission Model
The artificial carbon emission model is derived from established research. It calculates carbon emissions primarily by assessing the average energy consumption of individuals for daily activities, including food, clothing, housing, and transportation. By converting energy usage into carbon emissions, the model provides a daily carbon emission coefficient. However, it is essential to note that carbon emission factors vary significantly across different industries. For this model, the artificial carbon emission factor for the construction phase of the integrated construction station is set to an intermediate level, as suggested by the relevant literature [26].This factor will be adjusted and updated according to data from the intelligent dynamic monitoring system during the actual construction process. The artificial carbon emissions for the integrated construction station can be calculated using the following formula:
where, is the artificial carbon emissions of the integrated construction station, kg; is the labor per day; is the artificial carbon emission factor, /person·labor day, 0.460.
3.6. Chemical Reaction Carbon Emissions of the Construction Process
Chemical reactions occurring on-site during the construction process also contribute to the station’s carbon emissions. This model specifically accounts for the emissions generated during the mixing of asphalt mixtures. The chemical reaction carbon emissions during construction can be calculated using the following formula:
where, is the number of projects in project i; is the rated asphalt mixture consumption in Item i of the project, calculated in asphalt, kg/project quantity listed units; is the carbon emission factor of the chemical reactions of the mixing process of the asphalt mixture, kgCO2/kg asphalt, empirical data should be preferred and, in the absence of empirical data, 1.2 × 10⁻⁵ kg CO2/kg of asphalt can be calculated; i indicates the project number.
3.7. Construction Conditions Affect Carbon Emission Model
Construction conditions can significantly influence carbon emissions. The increase in emissions due to these conditions should be calculated as follows:
where, is the construction personnel’s living energy consumption carbon emissions, kgCO2; is the energy consumption carbon emissions of the construction machinery, kgCO2; is the calculated coefficient of increasing carbon emission affected by the construction conditions of item q, %.
4. Data Statistics and Carbon Emissions Accounting
Based on the carbon emission factor database established for the SG-2 bid section of the Fengqiu to Xiuwu section of the Changxiu Expressway, the carbon emissions of each station during the operational period of the SG-2 integrated construction station were calculated and compared with the data from the carbon emission intelligent monitoring system of the station. A quantitative evaluation was performed to assess the gap between the actual carbon emissions monitored by the intelligent system and the theoretical carbon emission data.
At present, due to the absence of asphalt production and favorable climatic conditions, carbon emissions related to chemical reactions during construction and the impact of construction conditions on carbon emissions were not considered. Instead, the study focused on calculating and analyzing carbon emissions from residential areas, transportation, various stations, and labor. The SG-2 integrated construction station of the Changxiu Expressway’s Fengqiu to Xiuwu section primarily produces beams and concrete. Since energy consumption varies across different production stages within the production cycle, the energy consumption monitored over a one-month period was calculated to provide scientifically valid data, eliminating random variations.
4.1. Carbon Emissions Accounting for Residential Areas
The power and duration of electricity consumption in each part of the residential area are calculated, as shown in Table 2.
Table 2.
Electricity consumption parameters of each area in the station.
The statistical parameters of different regions can be calculated by using Formula (3), and the monitored carbon emission values of different regions can be obtained by monitoring the power consumption of different regions of the site.
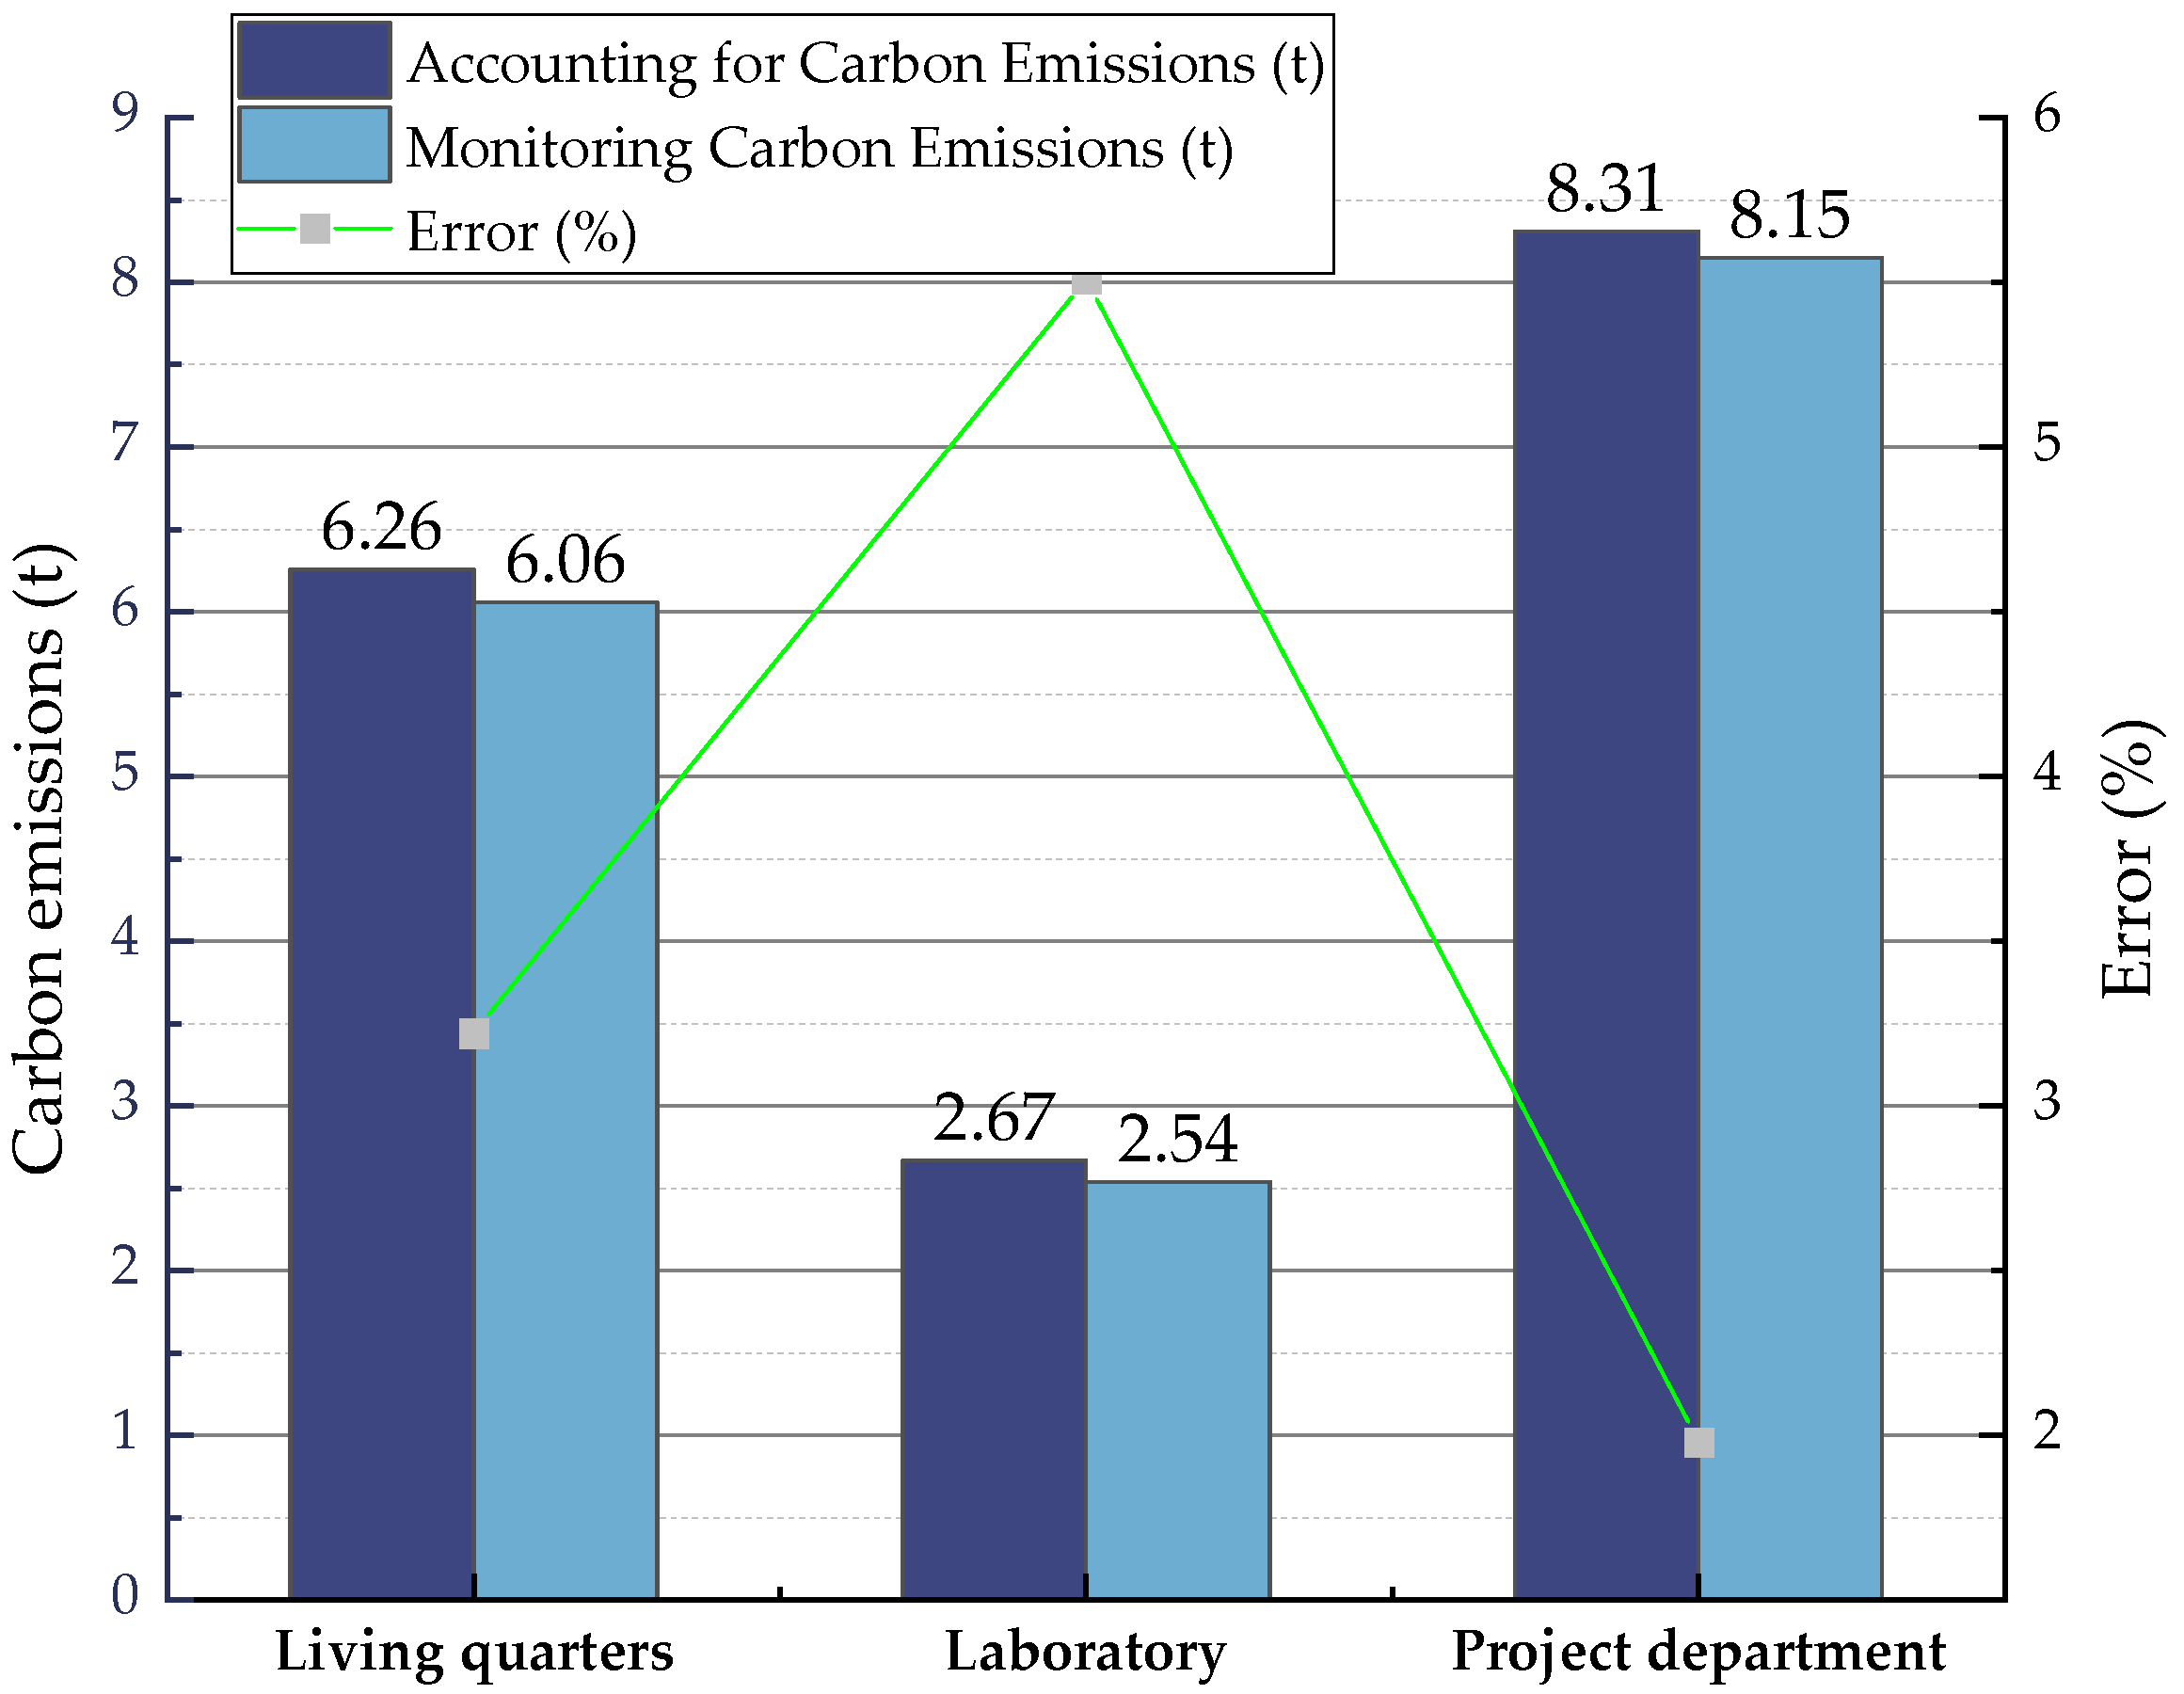
As shown in Figure 4, the living area had the highest carbon emissions, followed by the laboratory and project department. The abundance of electrical equipment in the living area contributed to higher carbon emissions. Due to the complexity of electrical equipment and varying usage times in the living areas and laboratories, the relative error between the calculated results and actual monitoring was significant.
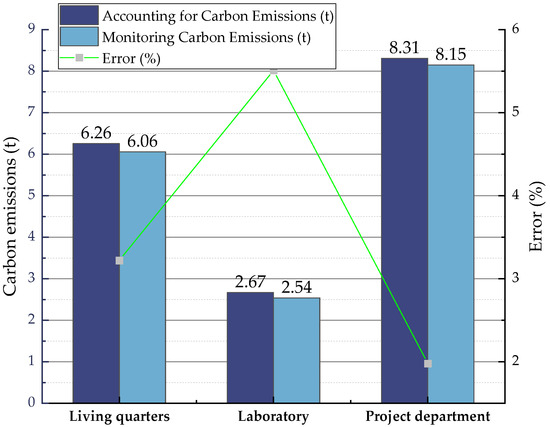
Figure 4.
Accounting for and monitoring of carbon emissions in each residential area.
4.2. Carbon Emissions Accounting for Transportation at Stations
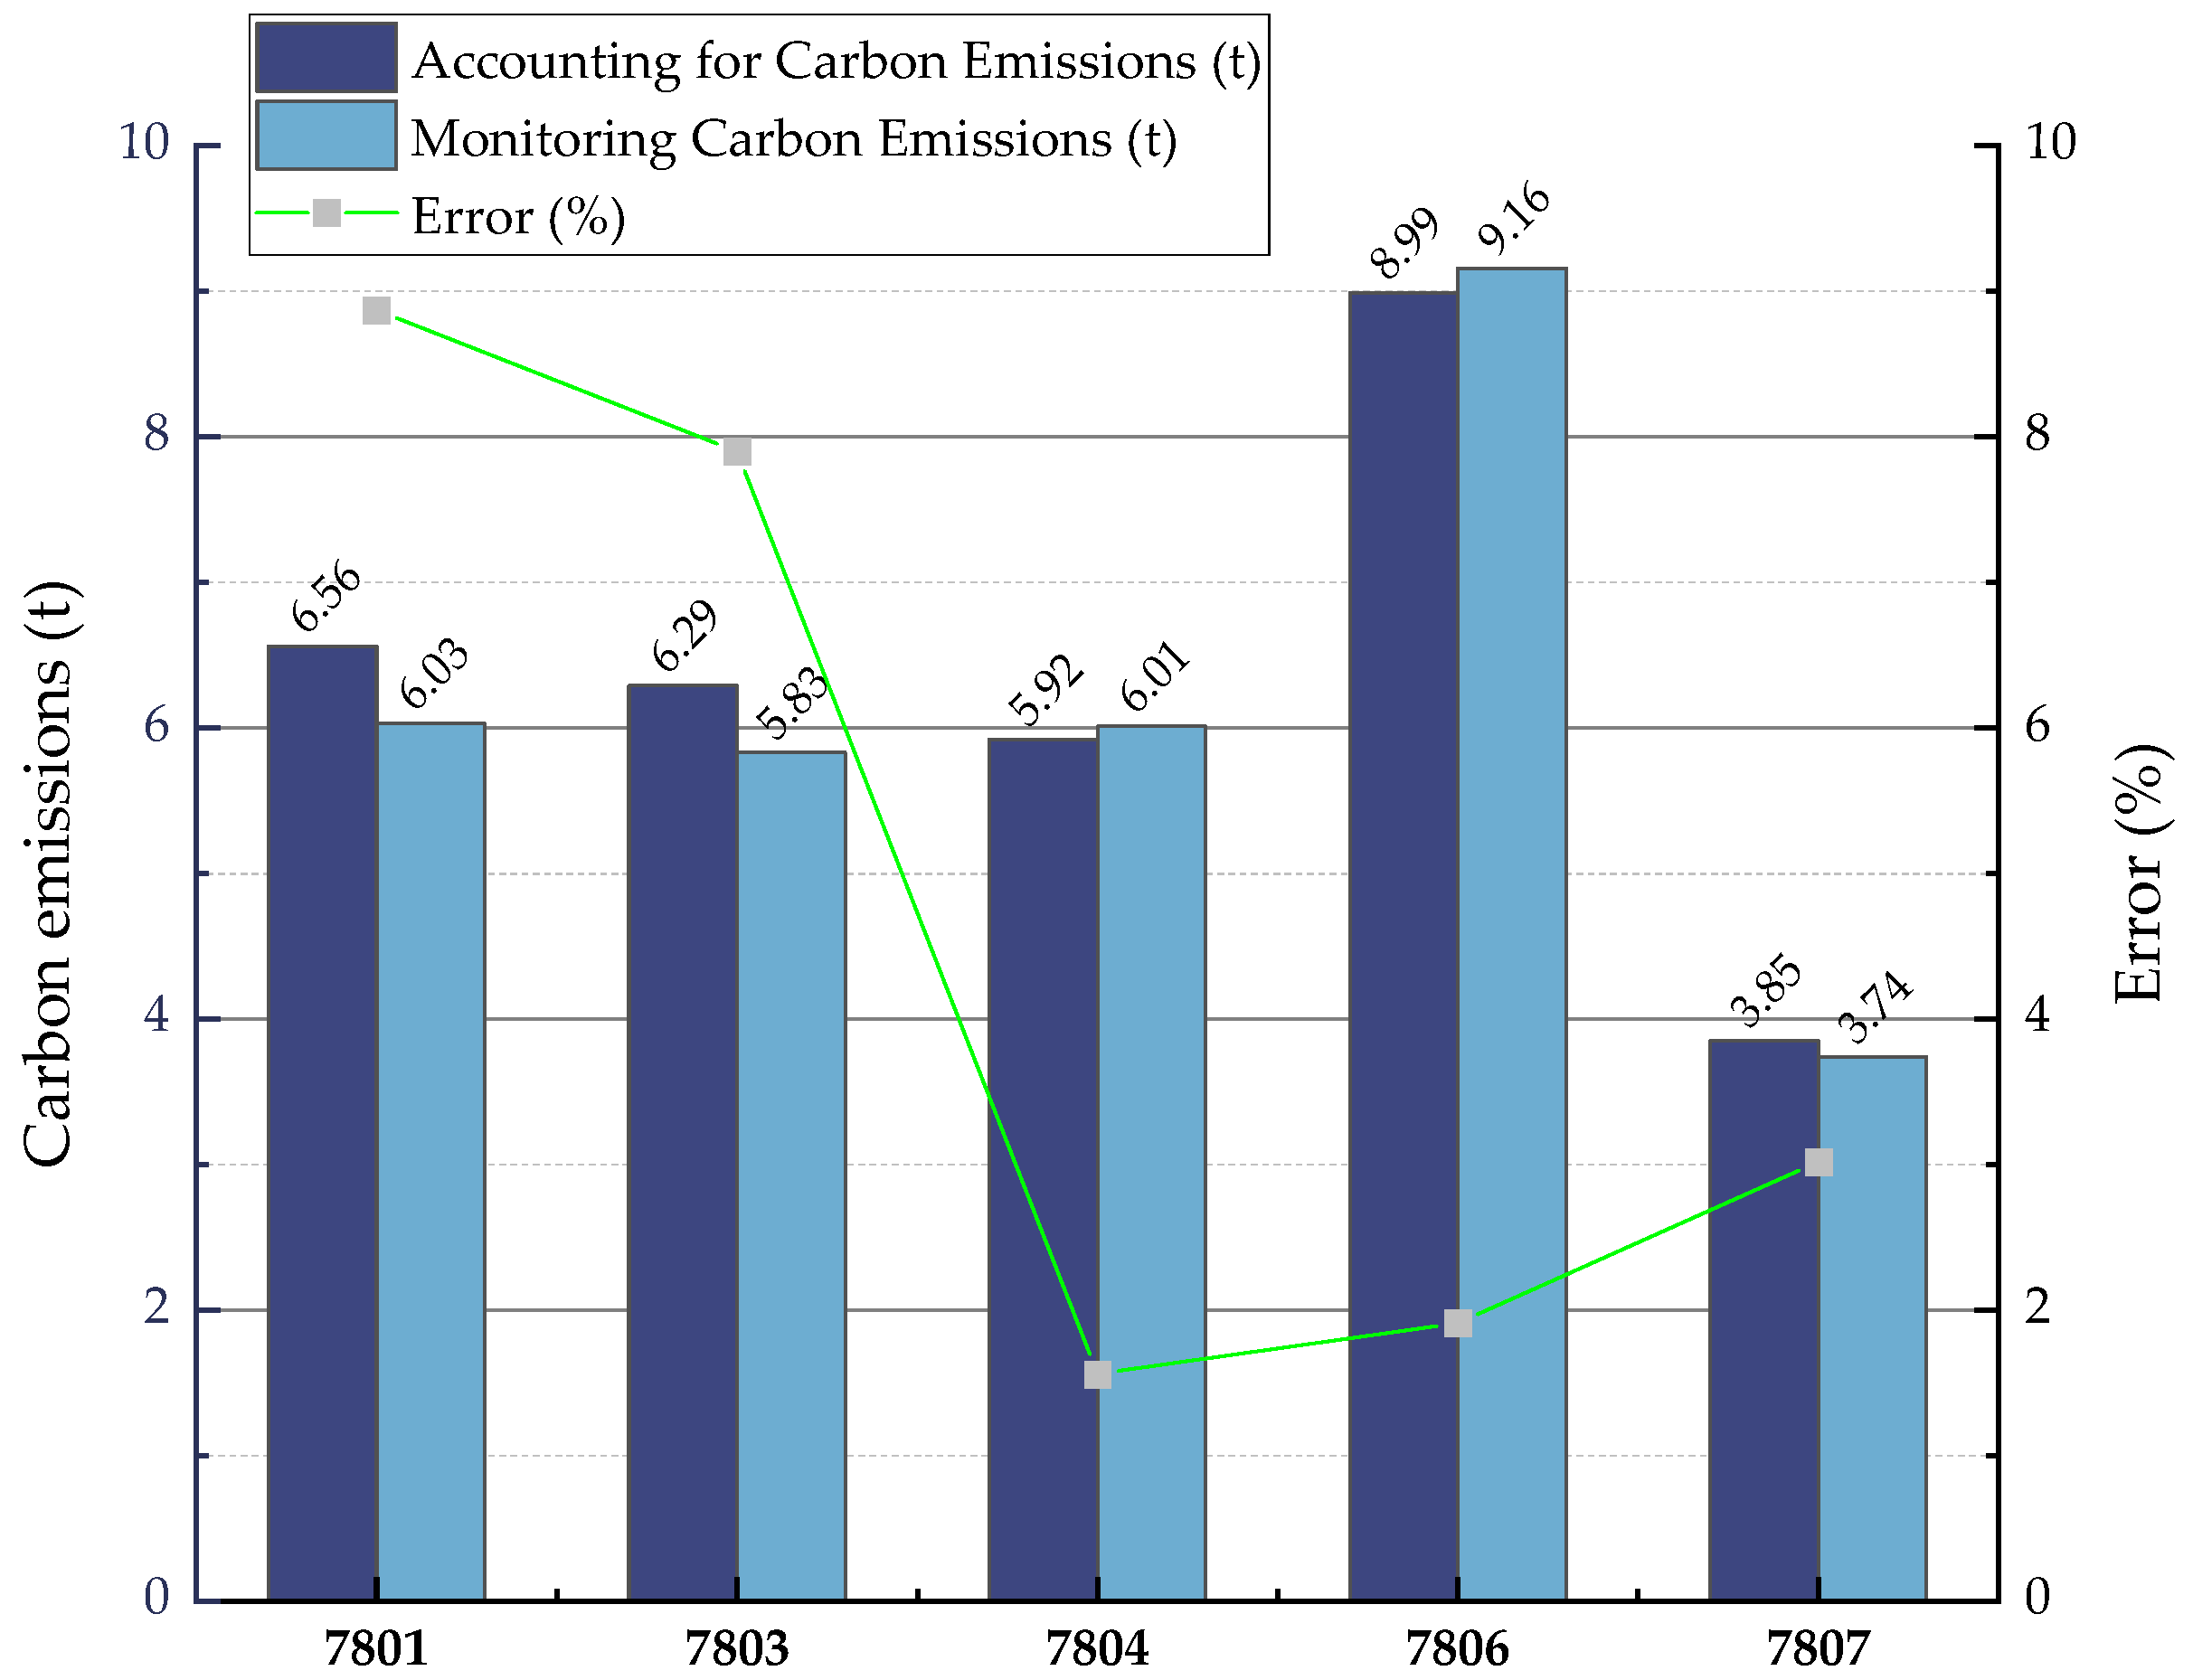
The parameters of each transport vehicle used by the station are calculated, as shown in Table 3.
Table 3.
Parameters of each transported vehicle used by the station.
Carbon emissions were calculated using Formula (4) for the statistical parameters of different vehicles. Fuel monitoring recorders installed on various vehicles enabled the monitoring of fuel consumption at the station. The monitored carbon emission values for the vehicles were obtained by multiplying the fuel consumption by the corresponding fossil fuel carbon emission factors.
As illustrated in Figure 5, the carbon emissions for each vehicle used for transportation at the station showed minimal fluctuation. Since the time difference in vehicle parameters was small, the relative error between the calculated results and the actual monitoring results was low, resulting in more accurate calculations.

Figure 5.
Calculation and monitoring of carbon emissions for each transport vehicle used by the station.
4.3. Carbon Emissions Accounting of Each Station
Electric meters were installed on each piece of equipment at the mixing station, steel bar yard, and precast beam plant to monitor power consumption. The monitored carbon emissions for each piece of equipment were obtained by multiplying the power usage by the power emission factor.
4.3.1. Carbon Emissions Accounting of Mixing Station
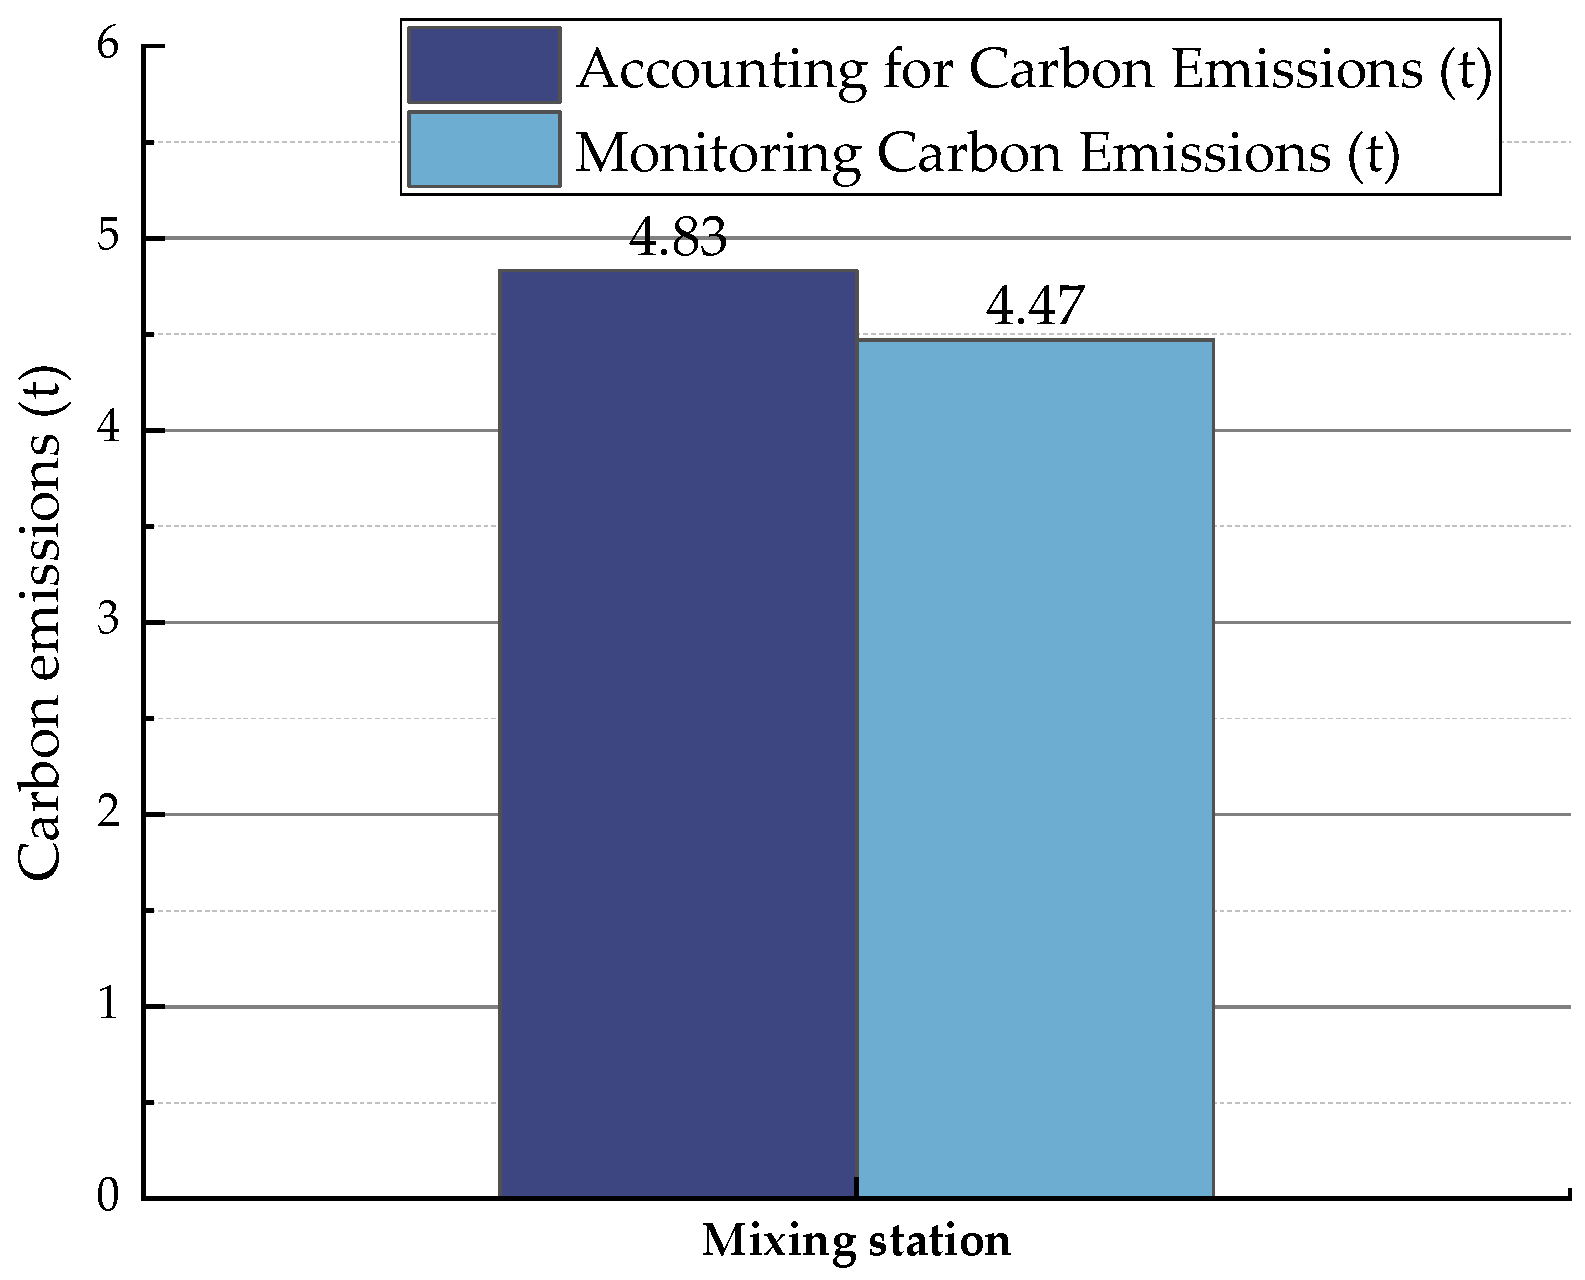
The power and duration of the mixing station are shown in Table 4.
Table 4.
Power consumption parameters of each region of the mixing station.
The parameters of the mixing station can be calculated by using Formula (5), and the monitored carbon emission value of the mixing station can be obtained by monitoring the power consumption of the mixing station.
As indicated in Figure 6, the gap between the accounting results and actual monitoring was small.

Figure 6.
Calculation and monitoring of carbon emissions in each region of the mixing station.
4.3.2. Carbon Emissions Accounting of Precast Beam Plant
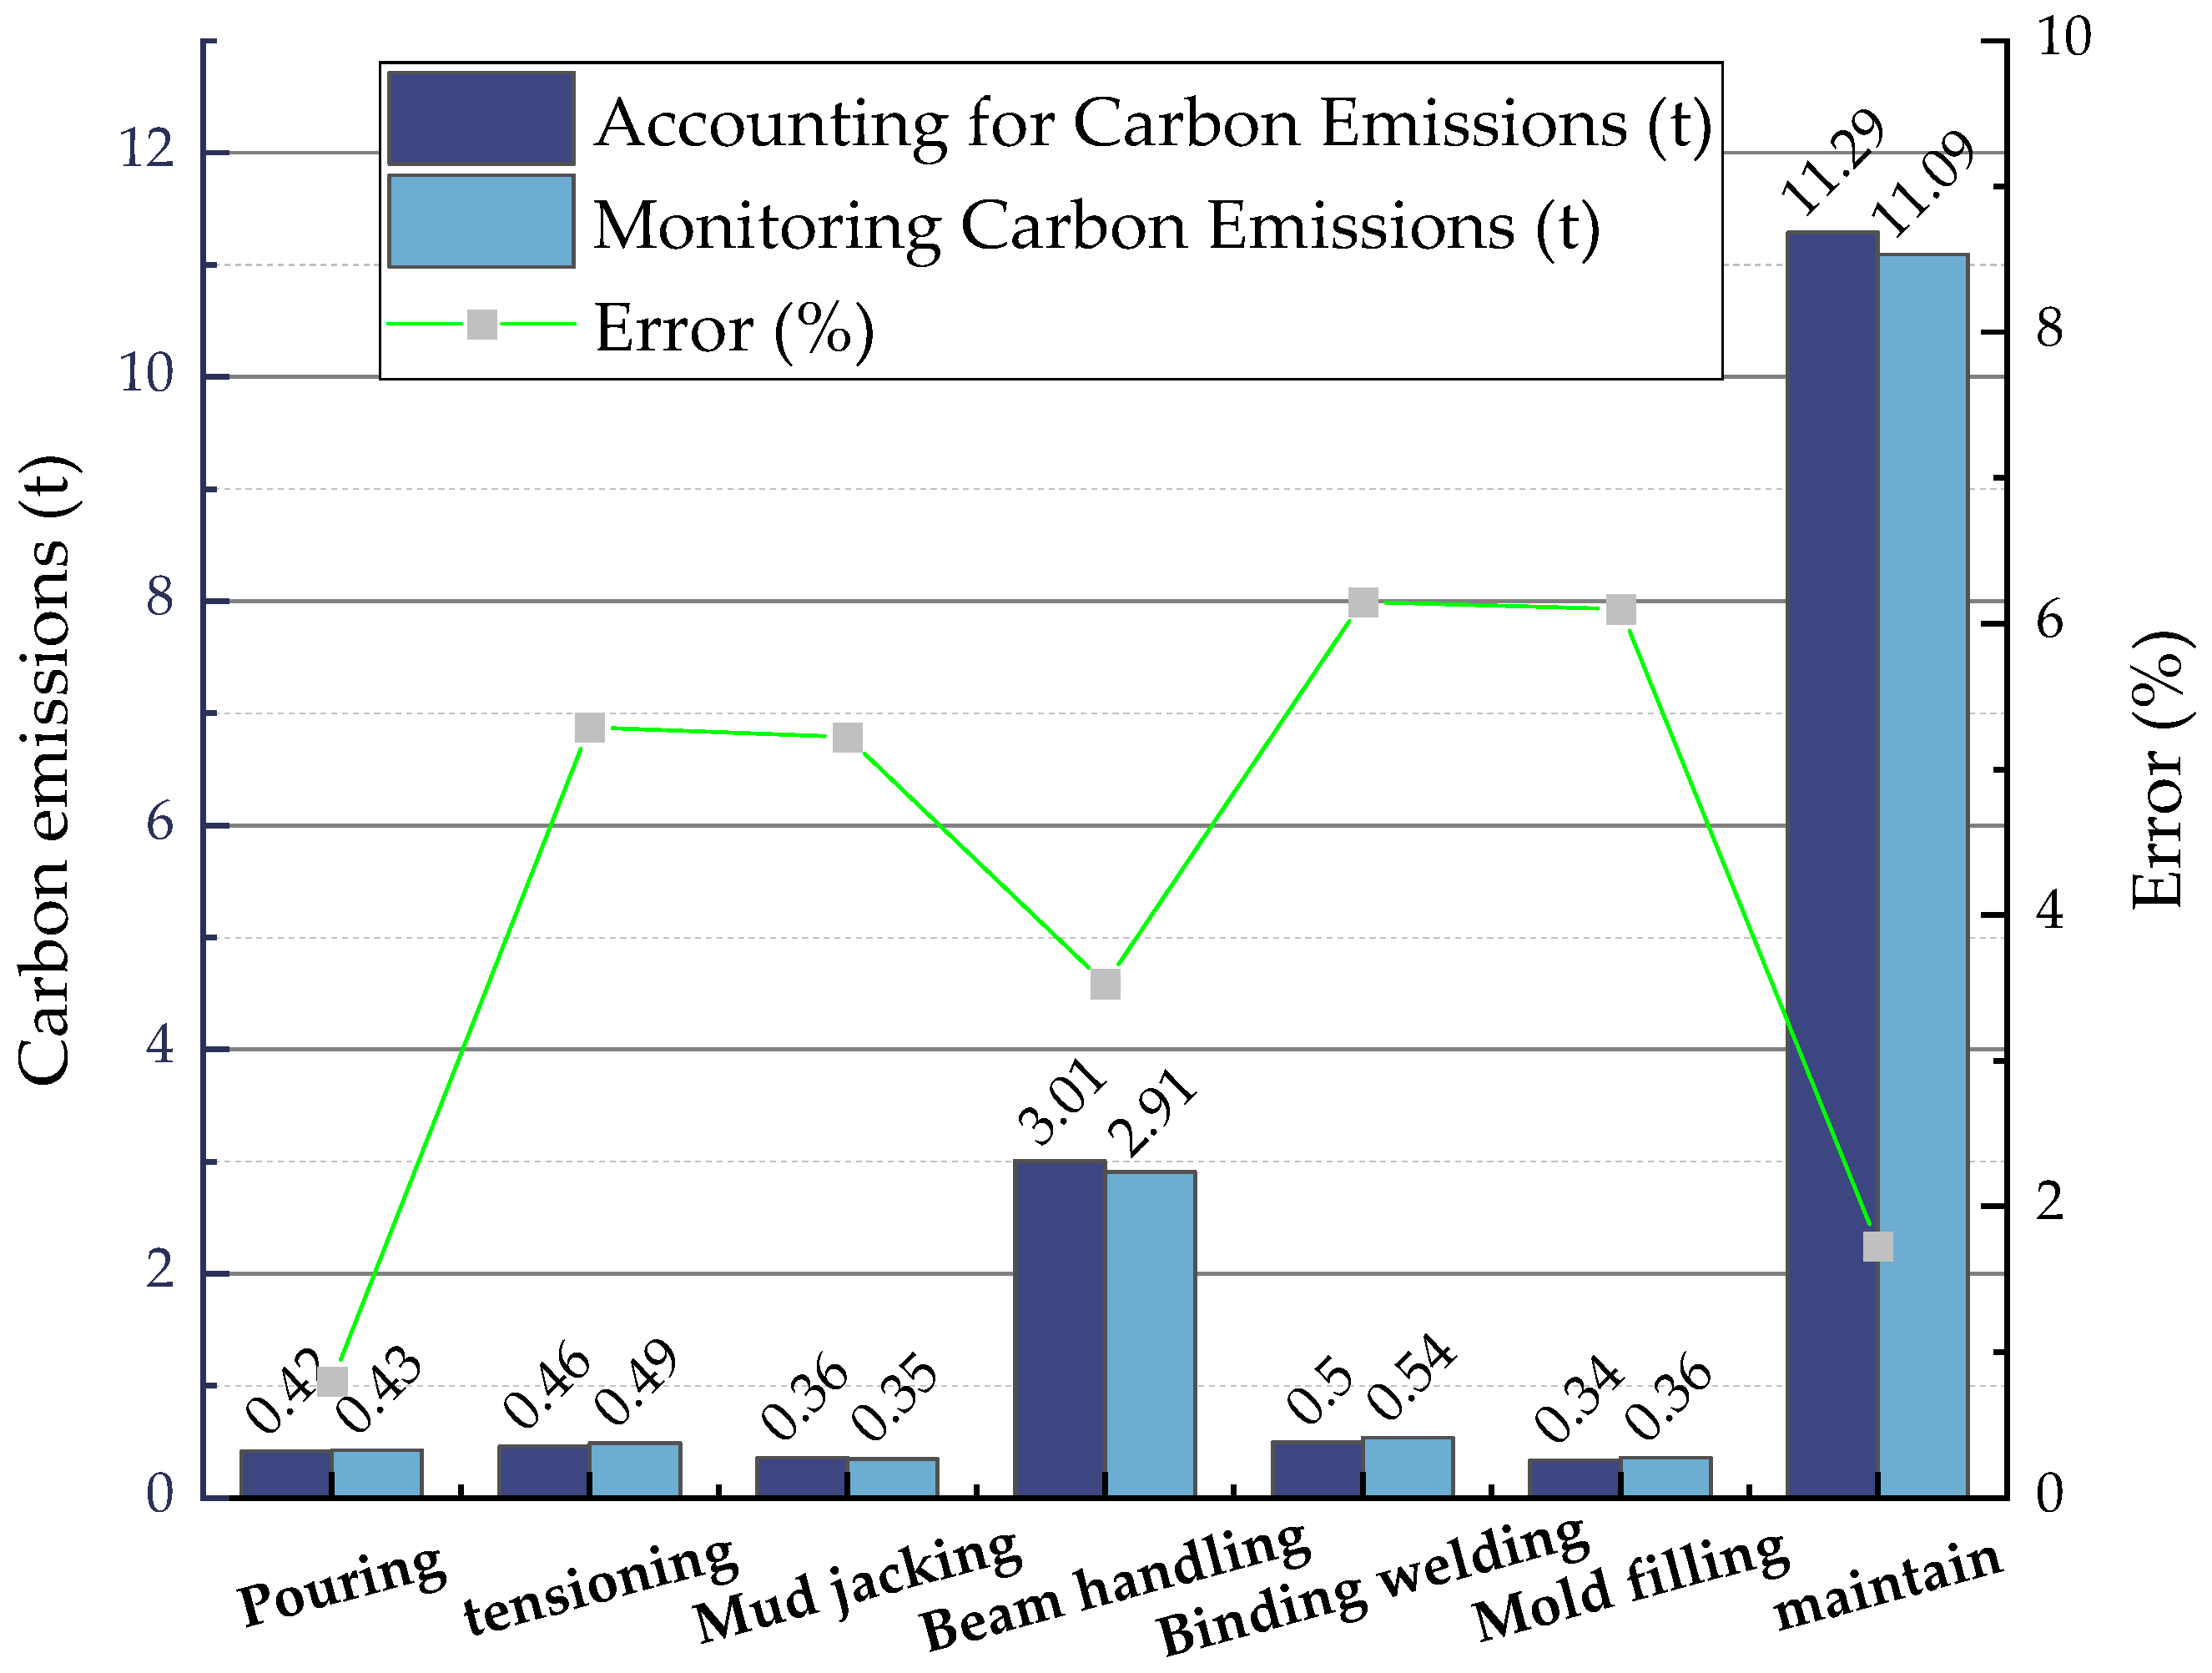
The carbon emissions accounting for precast beams was primarily calculated based on the use of processing equipment in the beam framing, beam transportation, and maintenance stages. The electricity consumption parameters for each process and piece of equipment in the standardized beam field were calculated, as shown in Table 5.
Table 5.
Electricity parameters of each process and equipment in precast beam plant.
Based on the statistical parameters of different equipment, carbon emissions were calculated using Formula (6). The monitored carbon emission value for each process was obtained by monitoring the power consumption of different equipment under various processes in the precast beam.
Figure 7 shows that the maintenance stage had the highest carbon emissions. The steam shed used in the maintenance stage had high power usage and long operation times, resulting in significant carbon emissions. Because the equipment statistics for the precast beam plant were comprehensive, the relative error between the calculated results and actual monitoring results was small, with a maximum error of only 6.15%.

Figure 7.
Calculation and monitoring of carbon emissions of each process in the precast beam plant.
4.3.3. Carbon Emissions Accounting of Steel Bar Yard
The power and duration of each item of processing equipment in the steel bar yard are calculated, as shown in Table 6.
Table 6.
Power parameters of each process and equipment in the steel bar yard.
Carbon emissions for each piece of process equipment were calculated using Formula (7). The monitored carbon emission values for each process in the steel bar yard were obtained by monitoring the power consumption of each piece of equipment.
As seen in Figure 8, the welding stage had the highest carbon emissions. Because the equipment statistics for the steel bar yard were comprehensive, the relative error between the calculated results and actual monitoring results was small, with a maximum error of only 5.41%.
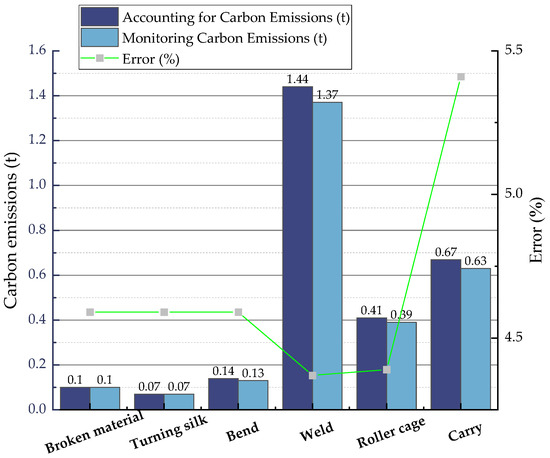
Figure 8.
Calculation and monitoring of carbon emissions of each process in the steel bar yard.
4.4. Artificial Carbon Emissions Accounting
As seen in Figure 8, the welding stage had the highest carbon emissions. Because the equipment statistics for the steel bar yard were comprehensive, the relative error between the calculated results and actual monitoring results was small, with a maximum error of only 5.41% (Table 7):
Table 7.
Estimates of artificial carbon emissions.
5. Result Analysis
5.1. Comparison Analysis between Model Calculation and Actual Monitoring
During the operational period of the integrated construction station of the SG-2 bid-section of the Changxiu Expressway, Fengqiu to the Xiuwu section, one month’s worth of data was collected from each station to ensure the data were reliable. The analysis revealed that during operation of the integrated construction station, monthly carbon emissions could reach 72.15 tons.
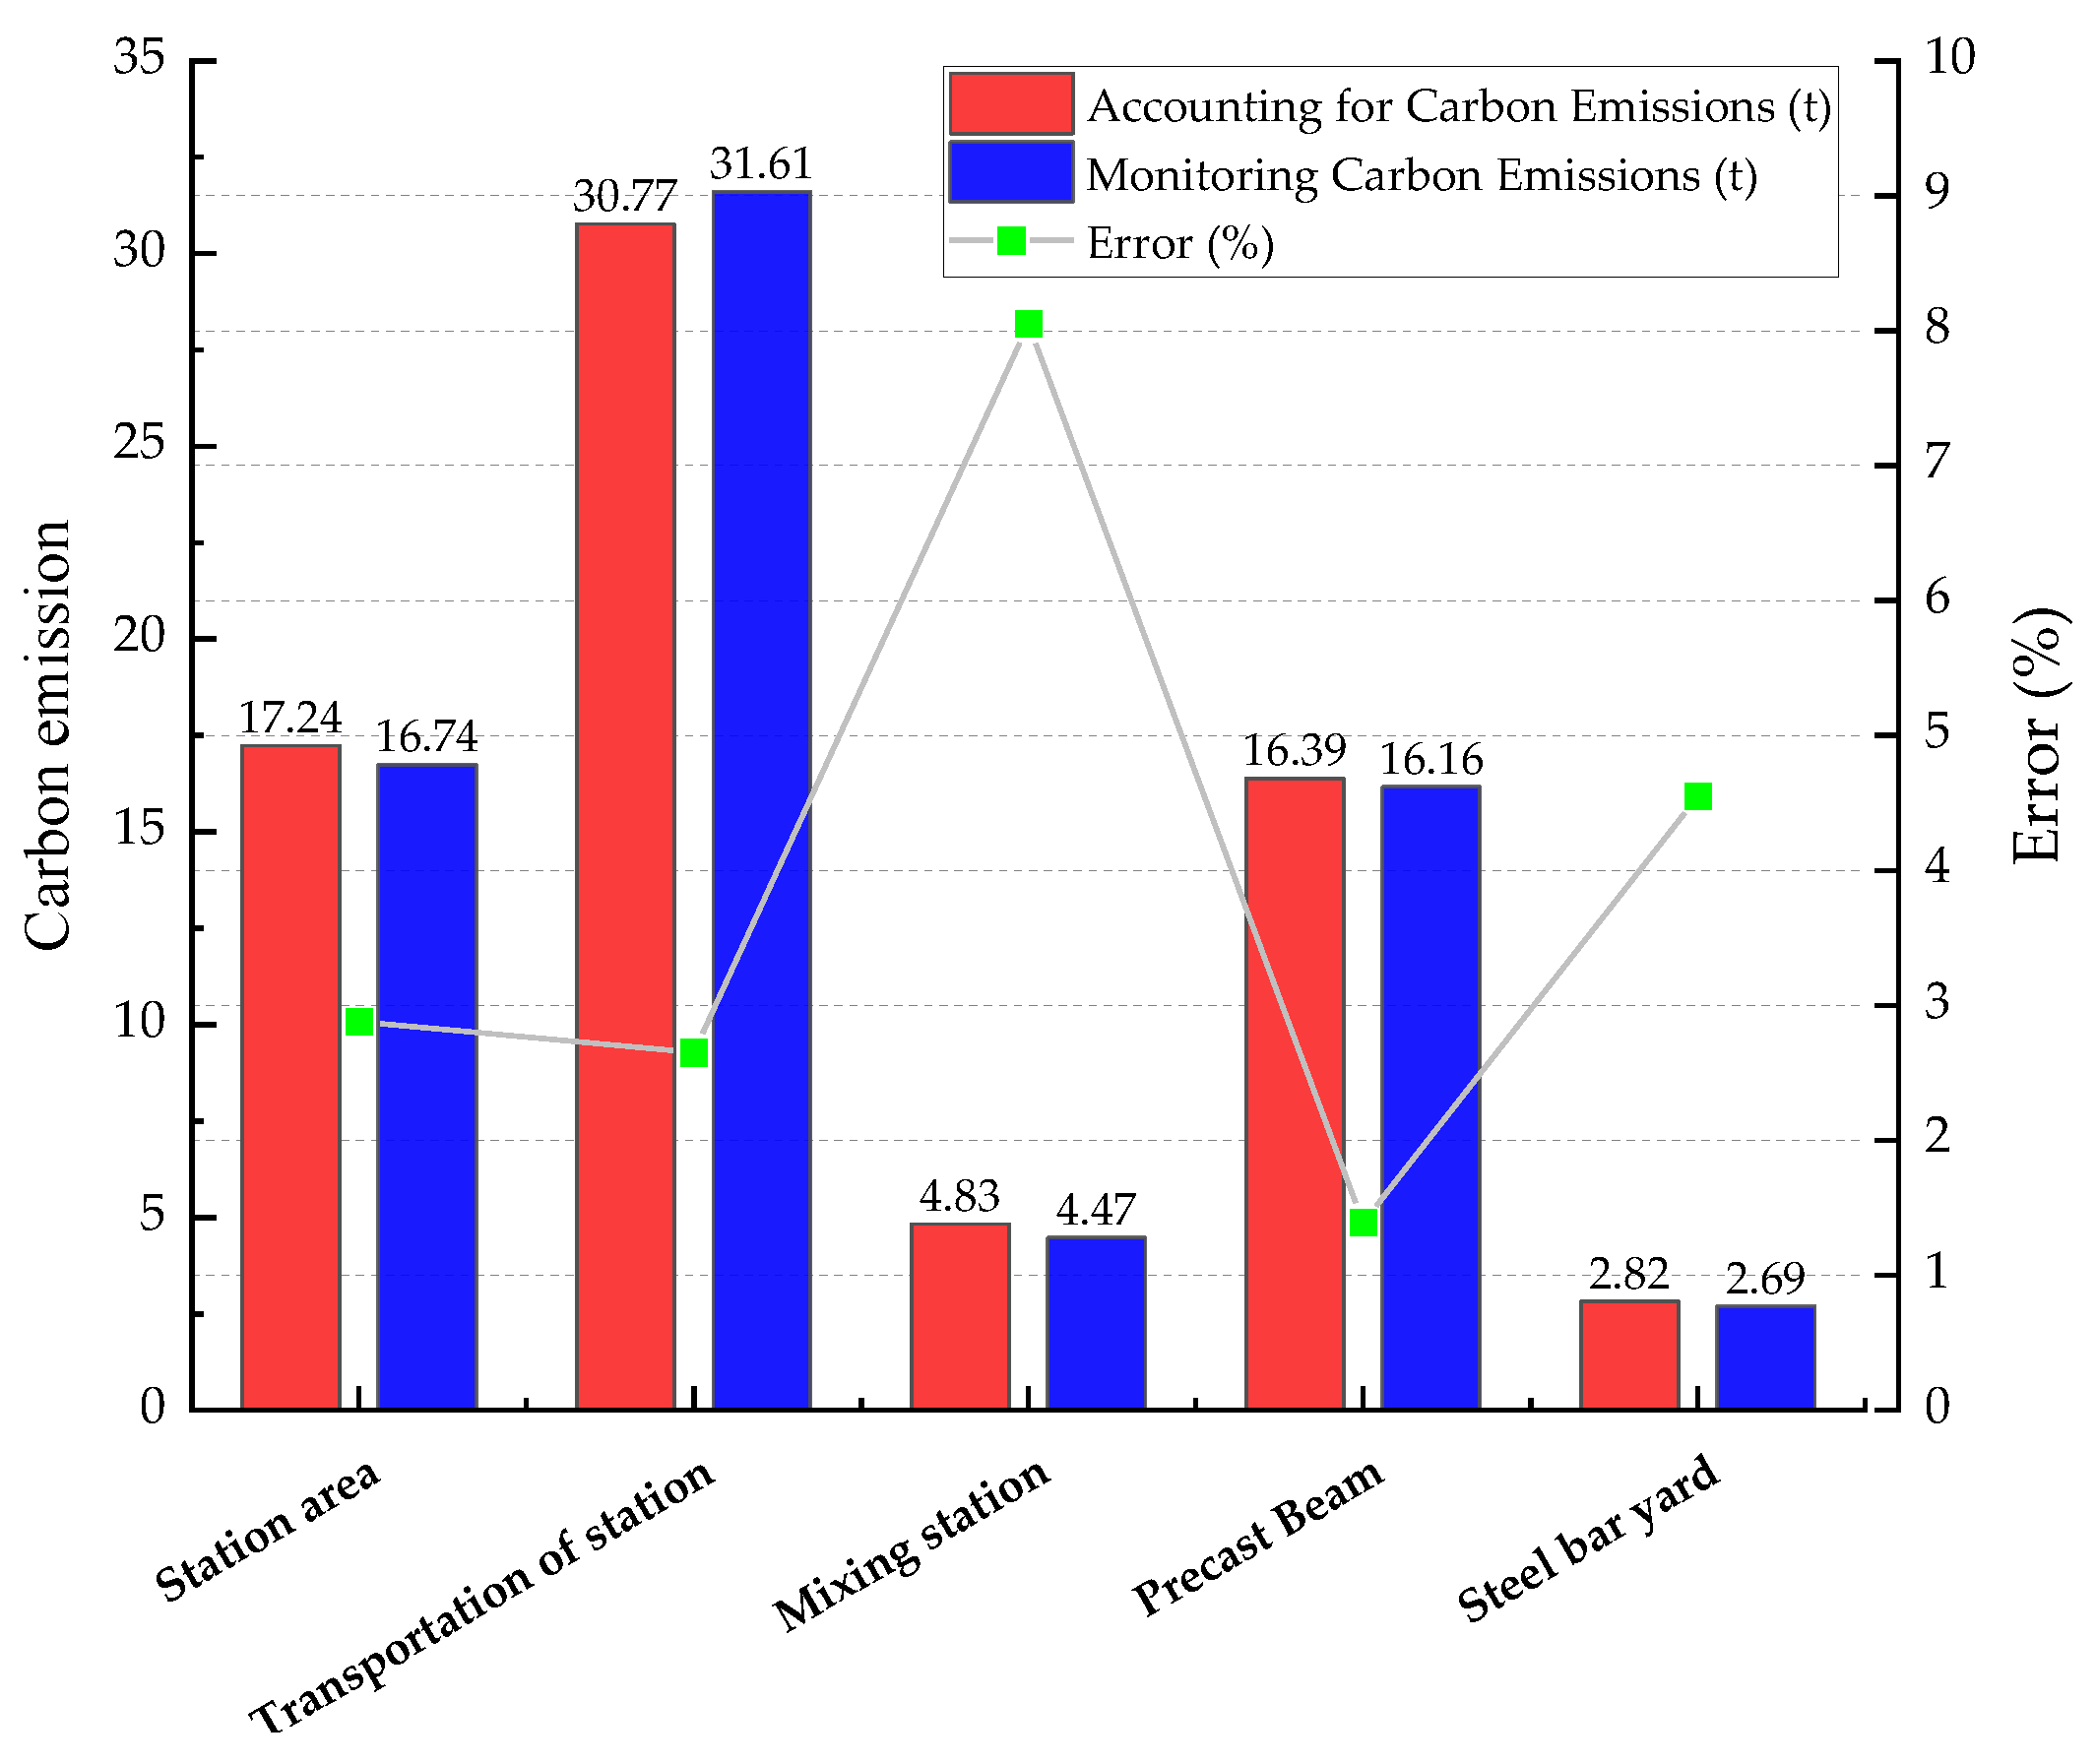
The reliability of the carbon emission model was verified by comparing the calculated carbon emissions with the monitored carbon emissions, as shown in Figure 9. The analysis indicated that the relative error between the overall calculation result of the model and the actual monitoring results was 3.6%. For the residential area, the theoretical calculation of the model was 0.50 tons higher than the average weekly monitored consumption, resulting in a relative error of 2.88%. For station transportation, the power consumption calculated by the model was 0.84 tons lower than the average weekly monitored consumption, with a relative error of 2.65%. For the mixing station, the power consumption calculated by the model was 0.36 tons higher than the monitored average weekly consumption, leading to a relative error of 8.05%. For the precast beam plant, the power consumption calculated by the model was 0.23 tons higher than the average weekly monitored consumption, with a relative error of 1.39%. For the steel bar yard, the power consumption calculated by the model was 0.13 tons higher than the average weekly monitored consumption, resulting in a relative error of 4.55%. There was a significant discrepancy between the calculated results and the actual monitoring results for the mixing station. The possible reason for this discrepancy is that the frequency of equipment use in the mixing station is not fixed, leading to variable electricity consumption for each piece of equipment, while the working time for each piece of equipment in the calculation model is fixed. This inconsistency resulted in a relatively high error in the calculation results for the precast beam. The relative error for carbon emissions at other stations was less than 5%, which preliminarily proves the accuracy of the model and confirms its effectiveness in estimating and calculating carbon emissions during the operation of the integrated construction station.
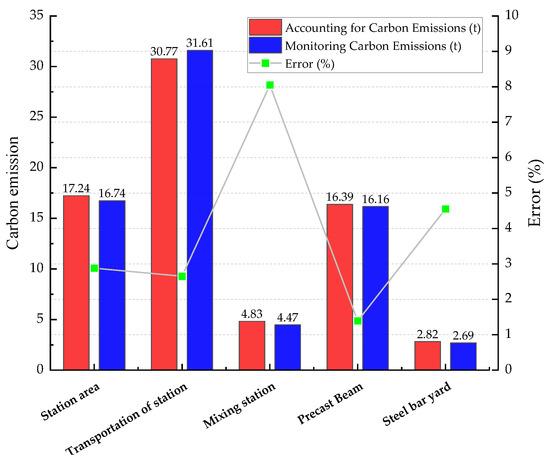
Figure 9.
Comparison analysis diagram between model calculation and actual monitoring.
5.2. Differential Analysis of Carbon Emissions from Different Processes
As shown in Figure 10, the largest carbon emissions were recorded in the transportation and residential areas of the station, accounting for 43.4% and 23.7%, respectively. This was followed by emissions from the precast beam plant, the mixing station, the steel bar yard, and labor, which accounted for 22.4%, 6.6%, and 3.9%, respectively. Within each station, transportation accounted for the largest proportion of emissions, at 43.4%, followed by maintenance and living areas, at 15.5% and 11.4%, respectively.
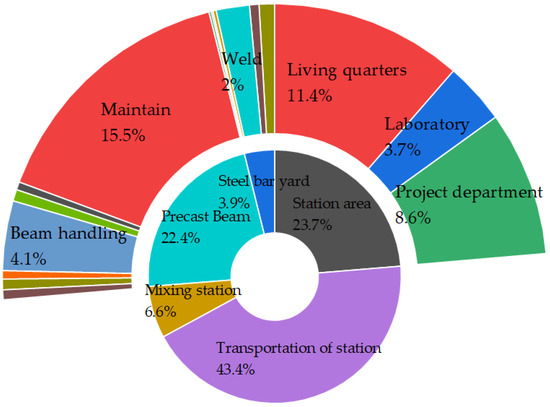
Figure 10.
Carbon emissions from different processes.
Therefore, for the integrated construction station, carbon emissions were mainly concentrated in station transportation and the precast beam stage. The electrification of transportation equipment and the adoption of electric drive modes can significantly reduce the overall carbon emissions of the integrated construction station.
6. Conclusions
This paper employs a quantitative method to calculate the carbon emissions of a comprehensive highway station during its operational period, yielding the following conclusions:
- The overall calculation results of the model have a relative error of 3.6% compared to actual monitoring data.
- By verifying the carbon emission data of each process based on actual monitoring, preliminary calculations of carbon emissions and carbon costs were achieved, with monthly carbon emissions reaching up to 72.15 tons.
- There are significant differences in carbon emissions between different processes, with station transportation and residence accounting for 43.4% and 23.7% of total emissions, respectively.
This paper provides an effective method for calculating carbon emissions for comprehensive highway stations. The analysis mainly focuses on various carbon emission points during the highway’s operational period, identifying boundaries for carbon emission calculations influenced by residence, station transportation, various stations, labor, chemical reactions during construction, and construction conditions. The paper proposes a carbon emission calculation model for each process.
By verifying the accuracy of the carbon emission calculation model using actual energy consumption data from residences, station transportation, and various stations, the model’s accuracy was preliminarily confirmed. It also demonstrated promotional value in being able to calculate emissions at integrated construction stations with similar processes. Through these calculations, it was found that the integrated construction station of the SG-2 section from Fengqiu to Xiuwu on the Changxiu Highway has a monthly carbon emission value. Electrification of equipment for station transportation can significantly reduce the overall carbon emissions of such stations.
Author Contributions
All authors contributed to the study concept and design. G.R. and C.Z. guided the topic selection and writing ideas for the article; C.W. and X.Y. collected and proofread the actual field data utilized in the article; K.M., S.D. and M.F. proposed the prediction model and wrote the article; W.L. completed the text editing; Y.Z. and C.P. completed the analysis of selected cases. All authors commented on previous versions of the manuscript. All authors have read and agreed to the published version of the manuscript.
Funding
This work was supported by the study on collaborative perception and precise carbon reduction path of cloud end of carbon emission of expressway integrated station, grant number 20231h0325 and the Department of Science and Technology of Hubei Province, grant number 2022BEC040.
Institutional Review Board Statement
This study did not require ethics approval, thus this declaration is not applicable.
Informed Consent Statement
Not applicable.
Data Availability Statement
All data and materials used in this work have been permitted by all participants and published in the article.
Conflicts of Interest
Authors Chao Wang, Xuechun Yao, Yiliu Zheng and Chao Pan were employed by the company CCCC Construction Group Co., Ltd. and CCCC Construction Group Southeast Construction Co., Ltd. The remaining authors declare that the research was conducted in the absence of any commercial or financial relationships that could be construed as a potential conflict of interest.
References
- Meng, F.Q.; Yan, R.Z.; Ke, K.J.; Jia, K.R.; Zhou, M.L.; Yang, X.K. Experimental study of the application of dolomite powder to 3D printing concrete. J. Taiyuan Univ. Technol. 2024, 1–12. [Google Scholar]
- Zhang, N.; Chang, D. Problems and Suggestions for the Sustainable Development of Expressways the New stage. China Transp. Rev. 2022, 44, 23–29. [Google Scholar]
- Zhang, H.X. Research on CO2, Emissions and Reduction Potential in China’s Transport Sector; North China Electric Power University: Beijing, China, 2018. [Google Scholar]
- Yang, J. Research on Carbon Emission Measurement and Emission Reduction Path of China’s Transportation Industry; Jiangxi University of Finance and Economics: Nanchang, China, 2023. [Google Scholar]
- Chester, M.V.; Horvath, A. Environmental Assessment of Passenger Transportation Should Include Infrastructure and Supply Chains. Environ. Res. Lett. 2009, 4, 024008. [Google Scholar] [CrossRef]
- Araújo, J.P.C.; Oliveira, J.R.M.; Silva, H.M.R.D. The Importance of the Use Phase on the LCA of Environmentally Friendly Solutions for Asphalt Road Pavements. Transp. Res. Part D Transp. Environ. 2014, 32, 97–110. [Google Scholar] [CrossRef]
- Chen, Y.D.; Luo, Y. Carbon Emission Calculation and Influencing Factors During Highway Construction Period. Traffic Transp. 2023, 39, 95–98. [Google Scholar]
- Dai, H.N.; Zeng, Y.L.; Shi, Q.L.; Sun, T. The Refined Carbon Emission Measurement Method of Provincial Highway Network in the Context of Carbon Peaking and Carbon Neutrality. J. South China Norm. Univ. (Nat. Sci. Ed.) 2023, 55, 1–13. [Google Scholar] [CrossRef]
- He, J.; Zhu, X.D.; Zhang, X.Y.; Chen, Y.H. Research on Carbon Emission Reduction Calculation and Characteristic Law of Tianjin. Urban Road Bridge Flood Control. 2024, 1, 30–34. [Google Scholar]
- Song, X.D.; Fu, Y.B.; Liu, H.B. Carbon dioxide emission reduction of high-speed railway. J. Cent. South Univ. (Sci. Technol.) 2014, 45, 3301–3307. [Google Scholar]
- Wu, Q.; Chen, Y.; Li, C.; Shi, X. Carbon Emission Scenario Prediction for Highway Construction Projects. Front. Environ. Sci. 2024, 11, 1302220. [Google Scholar] [CrossRef]
- Han, Y.; Li, H.; Liu, J.; Xie, N.; Jia, M.; Sun, Y.; Wang, S. Life Cycle Carbon Emissions from Road Infrastructure in China: A Region-Level Analysis. Transp. Res. Part D Transp. Environ. 2023, 115, 103581. [Google Scholar] [CrossRef]
- Barandica, J.M.; Fernández-Sánchez, G.; Berzosa, Á.; Delgado, J.A.; Acosta, F.J. Applying Life Cycle Thinking to Reduce Greenhouse Gas Emissions from Road Projects. J. Clean. Prod. 2013, 57, 79–91. [Google Scholar] [CrossRef]
- Hasan, U. Life Cycle Assessment of Roadworks in United Arab Emirates: Recycled Construction Waste, Reclaimed Asphalt Pavement, Warm-Mix Asphalt and Blast Furnace Slag Use against Traditional Approach. J. Clean. Prod. 2020, 257, 120531. [Google Scholar] [CrossRef]
- Zhang, X.Y.; Sun, K. Study on Carbon Emission Calculation of Expressway Greening Project in Construction Stage. Transp. Energy Conserv. Environ. Prot. 2024, 1–7. [Google Scholar]
- Cheng, H.; Shen, T.J. Carbon emission source analysis of a highway project during construction period based on carbon emission calculation model. Transp. Sci. Manag. 2023, 4, 168–170. [Google Scholar]
- Zhang, X.H.; Xiang, Y.M. Carbon emission evaluation of expressway operation period based on inventory analysis. Highw. Transp. Sci. Technol. (Appl. Technol. Ed.) 2018, 14, 325–327. [Google Scholar]
- Shang, C.J.; Zhang, Z.H.; Li, X.D. Research on Energy Consumption and Emission of Life Cycle of Expressway. J. Highw. Transp. Res. Dev. 2010, 27, 149–154. [Google Scholar] [CrossRef]
- Wu, Z.H.; Weng, H.; Huang, S.Q.; Liu, Y.X.; Wang, X.J. Characteristics and Regular Analysis of Carbon Emission from Highway T-beam Bridges Construction. Highw. Eng. 2024, 49, 22–30, 53. [Google Scholar] [CrossRef]
- Wang, L.; Yang, M.Y.; Gao, Y.Q. Calculation and Analysis of Carbon Emission in Construction Stage of Loss Tunnel. Environ. Eng. 2023, 41, 99–107, 172. [Google Scholar] [CrossRef]
- Jing, Z.K. Research on Carbon Emission Calculation and Multiscenario Simulation Prediction for the Life Cycle Assessment of Urban Road Engineering; Shijiazhuang Tiedao University: Shijiazhuang, China, 2024. [Google Scholar]
- Tang, Y.L.; Zeng, Q. Carbon Emission Measurement Method and Low Carbon Strategy for Expressway Reconstruction and Expansion. Guangdong Highw. Commun. 2023, 49, 73–78. [Google Scholar]
- Qiao, L.; Deng, N.F.; Li, Q.; Wang, X.; Zhang, Q.; Wang, Y. Intelligent assessment method of life-cyele carbon emission during the highway construction phase. Chin. J. Eng. 2023, 45, 2173–2186. [Google Scholar]
- Pei, R.R. Carbon Emission Calculation and Carbon Peaking Prediction of Qin-tang Expressway Based on LCA; Hebei University of Science and Technology: Shijiazhuang, China, 2023. [Google Scholar]
- He, J.L.; Chen, Y.Q.; Dong, X.; Huang, F.H.; Liu, B.; Wang, Y.Q. Analysis of Lifetime Carbon Emission Characteristics of Extremely Large Bridges Based on LCA. Transp. Energy Conserv. Environ. Prot. 2022, 18, 25–30+37. [Google Scholar]
- He, X.T. Research on the Calculation Methods and Major Parameters on CO2, Emission during the Construction of Urban Mass Transit Open-Cut Station; Beijing Jiaotong University: Beijing, China, 2015. [Google Scholar]


Disclaimer/Publisher’s Note: The statements, opinions and data contained in all publications are solely those of the individual author(s) and contributor(s) and not of MDPI and/or the editor(s). MDPI and/or the editor(s) disclaim responsibility for any injury to people or property resulting from any ideas, methods, instructions or products referred to in the content. |
© 2024 by the authors. Licensee MDPI, Basel, Switzerland. This article is an open access article distributed under the terms and conditions of the Creative Commons Attribution (CC BY) license (https://creativecommons.org/licenses/by/4.0/).