Abstract
This manuscript highlights the mechanical, economical, ecological, and thermal investigations performed on paving quality geopolymer concrete (PQGC) incorporating processed steel slag (PSS) as a substitute for river sand (RSa). The replacement of RSa with PSS ranged from 0 to 100% in the PQGC mix. The mix with 100% PSS content exhibited enhanced geopolymerization, resulting in a denser and more amorphous matrix. This improved the mechanical properties, increasing compressive strength by 10.9%, flexural strength by 23.5%, and splitting tensile strength by 8.3%. The replacement of RSa with PSS in PQGC led to a marginal reduction in (embodied energy) EE and CO2 emissions. However, compared to conventional Pavement Quality Concrete (PQC) and Fly Ash PQC (FPQC), the reduction in EE for PQGC was 44% and 34%, while the CO2 emissions of PQGC were reduced by 1.22 and 1.49 times. Despite these benefits, PQGC with 100% PSS was 19% and 30% more expensive than PQC and FPQC, respectively. The Global Warming Potential (GWP) of PQGC was approximately one-third that of PQC and FPQC at all levels of replacement of RSa in PQGC when compared to PQC and FPQC. Additionally, thermal conductivity decreased from k = 0.67 W/m °C to k = 0.51 W/m °C with 100% replacement of RSa, keeping the concrete cooler. Therefore, PQGC with 100% PSS, when practically implemented, may help reduce surrounding temperatures. This study concludes that PSS is a feasible and reliable alternative to RSa, enhancing the sustainability of PQGC.
1. Introduction
Ordinary Portland Cement (OPC) concrete plays a pivotal role as an indispensable material, exerting a substantial impact on the development of the built environment [1]. However, the widespread use of OPC concrete has raised environmental concerns, particularly in the context of greenhouse gas (GHG) emissions. OPC, a key component of traditional concrete, is associated with substantial carbon dioxide (CO2) emissions throughout its life cycle, contributing to the overall carbon footprint of the construction industry. OPC production is energy-intensive, notably due to the calcination of limestone and the high-temperature (900 to 1500 °C) clinker production, resulting in a substantial release of CO2 into the atmosphere, ranging from 0.8 to 1.0 metric tons for every 1.0 metric tons of cement production [2,3]. These emissions have far-reaching implications, as OPC is estimated to be responsible for approximately 5% of global anthropogenic CO2 emissions [4,5] and constitutes a notable share of the total energy consumption within the industrial sector. In pursuing sustainable development and reducing the construction carbon footprint, the researcher’s interest has gradually turned toward investigating blended cement and other novel alternatives. Blended cement [6,7] is one in which OPC is partially replaced with secondary cementitious materials (SCM), such as fly ash, slag, and silica fume, reducing CO2 emissions by approximately 12–22% [2]. Alternatively, geopolymer concrete (GPC) or alkali-activated concrete (AAC) is emerging as a pivotal innovative construction material that can significantly shift towards a circular economy. These cements are eco-friendly, as the reduction in CO2 emissions compared to OPC is estimated at 80% [2,5].
Joseph Davidovits first proposed the term “geopolymer” in 1978 [8]. Geopolymers are a subset of alkali-activated cement or inorganic polymer cement. The production technology of GPC has focused on utilizing readily available aluminosilicate materials, optimizing chemical reactions under various conditions, and exploring the mechanical, ecological, and economic benefits of GPC over conventional concrete. The aluminosilicate materials are typically industrial by-products such as fly ash and ground granulated blast furnace slag [9], sourced for thermal power plants and steel manufacturing industries. These materials are alkali-activated by chemicals such as sodium or potassium hydroxide (NaOH or KOH) and sodium or potassium silicate (Na2SiO3 or K2SiO3) to form a hard mass through the polymerization process [10]. This reaction produces a dense, amorphous structure similar to that found in zeolite materials but without the crystalline form, contributing to its strength and durability. More than a decade of studies based on GPC’s reaction chemistry, its microstructure, and mechanical and thermal analysis have established it as a futuristic concrete for various structural applications. Unlike OPC concrete, whose strength development mainly relies on Calcium-Silicate-Hydrate (CSH) gel, GPC develops its strength due to the formation of Calcium-Alumino-Silicate-Hydrate (CASH), Sodium/Potassium-Alumino-Silicate-Hydrate (K/NASH), and CSH gels as reaction products [11,12,13,14,15]. These geopolymer gels (GG) may exist solely or in combined form, depending on the precursor and alkaline liquid (AKL) used in the production of GPC [16]. Clay-based GPC, such as kaolin or metakaolin-based, contains CSH and NASH as primary reaction products [17,18,19]. Fly ash-slag GPC has a refined microstructure [20,21,22] and possesses comparable mechanical properties [20,21,22,23,24] and durability [25,26]. Currently, fly ash and slag are widely employed in GPC due to their large-scale availability [9,27,28]. Fly ash-slag blended GPC have distinct advantages as they are ambiently cured [15,29] and have an easy mix design procedure [30,31].
Reduction in CO2 emissions and waste utilization are other significant environmental benefits of fly ash-slag-based GPC. GPC relies on the polycondensation of alumino-silicate materials at much lower temperatures, substantially lowering CO2 emissions [2]. Promoting GPC as a sustainable alternative would lead to a 70–80% reduction in CO2 emissions into nature compared to OPC concrete [32,33]. The lower CO2 emissions into the atmosphere keep the environment less warm due to reduced global warming potential (GWP). GPC, because of its low CO2 emission potential due to the constituent materials, has a relatively modest GWP compared to OPC concrete [3,34,35]. GPC releases only 169 kg of equivalent CO2 per m3 against 306 kg of equivalent CO2 per m3, resulting in a 45% savings in GWP [34]. The production of GPC offers an effective utilization of fly ash and slag, which are the chief components of its composition. This reduces the disposal issues of fly ash and slag and the reliance on virgin materials that involve high carbon emissions in their processing. Furthermore, incorporating these alumino-silicate materials improves the hardened properties of GPC, making it a compelling choice for ecological and economic reasons in modern construction. Economic analysis of GPC compared to OPC concrete reveals that the initial material costs for GPC are generally higher [32,36,37]. For instance, the cost of M25 -grade GPC containing 50% fly ash and 50% slag blend is nearly 27% higher than OPC concrete. Despite the higher initial costs, GPC offers significant benefits in the long run. Studies have shown that for higher grades of concrete, the cost of production of GPC is lower than that of OPC. For example, the cost of production of M50 -grade GPC is 11% less than the production cost of OPC concrete of similar grade [4,36,38].
Urbanization is the primary cause of substantial increases in in-built infrastructure. Transport infrastructure, such as roads, nearly occupies 30% of the total urban built infrastructure and caters to mobility demands. In contrast to facilitating traffic mobility, road infrastructure, depending on the pavement types and their thermal properties, significantly contributes to increasing atmospheric temperature in urban regions, a phenomenon known as the urban heat island (UHI) effect. Reducing pavement surface temperature can effectively mitigate the UHI [39]. Reflective pavements, pervious pavements, and high -thermal conductivity pavements are some preferred strategies used for alleviating the UHI effect [40]. The surface temperature of pavement subjected to solar radiation is usually higher than the surrounding temperature due to the heat observed by the radiation. Reflective pavement uses a layer of reflective coating that possesses high solar reflectance, or the pavement itself is light-colored so that it reflects more solar radiation, thus keeping the surface cool and radiating less heat to the surroundings [41,42]. However, high reflectance may cause discomfort to pedestrians and road users. Pervious asphalt or concrete pavement has high airvoids that allow water to percolate through the voids and get stored near the surface [41,43]. Evaporation of stored water keeps pervious pavements cooler and causes less dissipation of heat into the surroundings. Highly thermally conductive pavement contains materials with high thermal conductivity, such as quartz aggregate or steel fibers, which improve the thermal inertia of the pavement [44,45]. Therefore, these pavements effectively transfer accumulated heat and keep the near surface cool, thus emitting less heat into the atmosphere. Highly thermally conductive pavements are suitable for regions with high daytime temperatures. However, pavements with low thermal conductivity are suited for high nocturnal temperatures [44].
Motivation, Objective, and Scope of the Study
Research, by and large, has focused mainly on developing GPC, meeting the requirements of residential and industrial infrastructure, and giving a broad scope to explore the potentials of GPC for other infrastructure elements such as paving applications. In its tech brief, Federal Highway stressed the need for GPC for pavement application [46]. Following this, in 2014, in Brisbane, Australia, the first GPC pavement was constructed [47]. Recently, a few studies have focused on developing GPC for pavement applications such as slip-form paving [48] and quick-fixing damaged pavement [49]. Further research on GPC meant for paving applications [9,50,51,52,53,54,55,56] has highlighted the urgent necessity of exploring alternative materials for natural aggregate, mainly river sand, in light of the progressive depletion of its virgin sources and the intensifying global demand-supply crisis. Mithun B et al. (2015) [53] used copper slag in ACC as a 100% replacement for river sand and found that copper slag slightly improved fatigue performance and mechanical strength. Guihua Hou proposed carbonation, which turns steel slag into a cementitious material [57]. They also suggested that carbonation can improve the mechanical strength of such concrete [58].
Meanwhile, studies by Palankar N et al. (2018) [52] revealed that steel slag as coarse aggregate in AAC reduced fatigue performance. Talkeri et al. (2019) [59] and (2022) [51] suggested that the PS ball as a replacement for river sand improved AAC’s mechanical and fatigue properties. Girish (2023) et al. [7] study on steel slag as a replacement for river sand in GPC proved enhancement in fatigue life cycle due to steel slag. These studies advocate for the utilization of industrial by-products as a viable replacement for natural aggregate in rigid pavement, suggesting a strategic shift towards more sustainable construction practices. Nevertheless, there is a shortage of studies on the economic, environmental, and thermo-mechanical impact of GPC containing industrial waste, such as steel slag, as a substitute for river sand, which is the motivation for this study.
The primary object of this manuscript is to present the ecological and economic analysis performed on Paving Quality Geopolymer Concrete (PQGC) containing river sand and processed slag sand. Additionally, the mechanical properties and thermal conductivity of PQGC were also investigated. The environmental and economic parameters such as embodied energy, CO2 emissions, eco-efficiency, impact assessment, and cost of the developed PQGC were computed and compared with conventional pavement quality concrete (PQC) and fly ash blended pavement quality concrete (FPQC). The parameters mentioned above are usually benchmarked for the 28-day mechanical strengths of concrete. Therefore, only the 28-day mechanical strengths and corresponding micrographs are included in the technical studies. A thermal conductivity study was performed to understand the heat flow at surface level and draw conclusions accordingly. Cost estimation for PQGC included estimating the cost of mixes based on the unit cost of raw material costs.
2. Materials and Methods
2.1. Physical Characteristics and Mixture Proportion
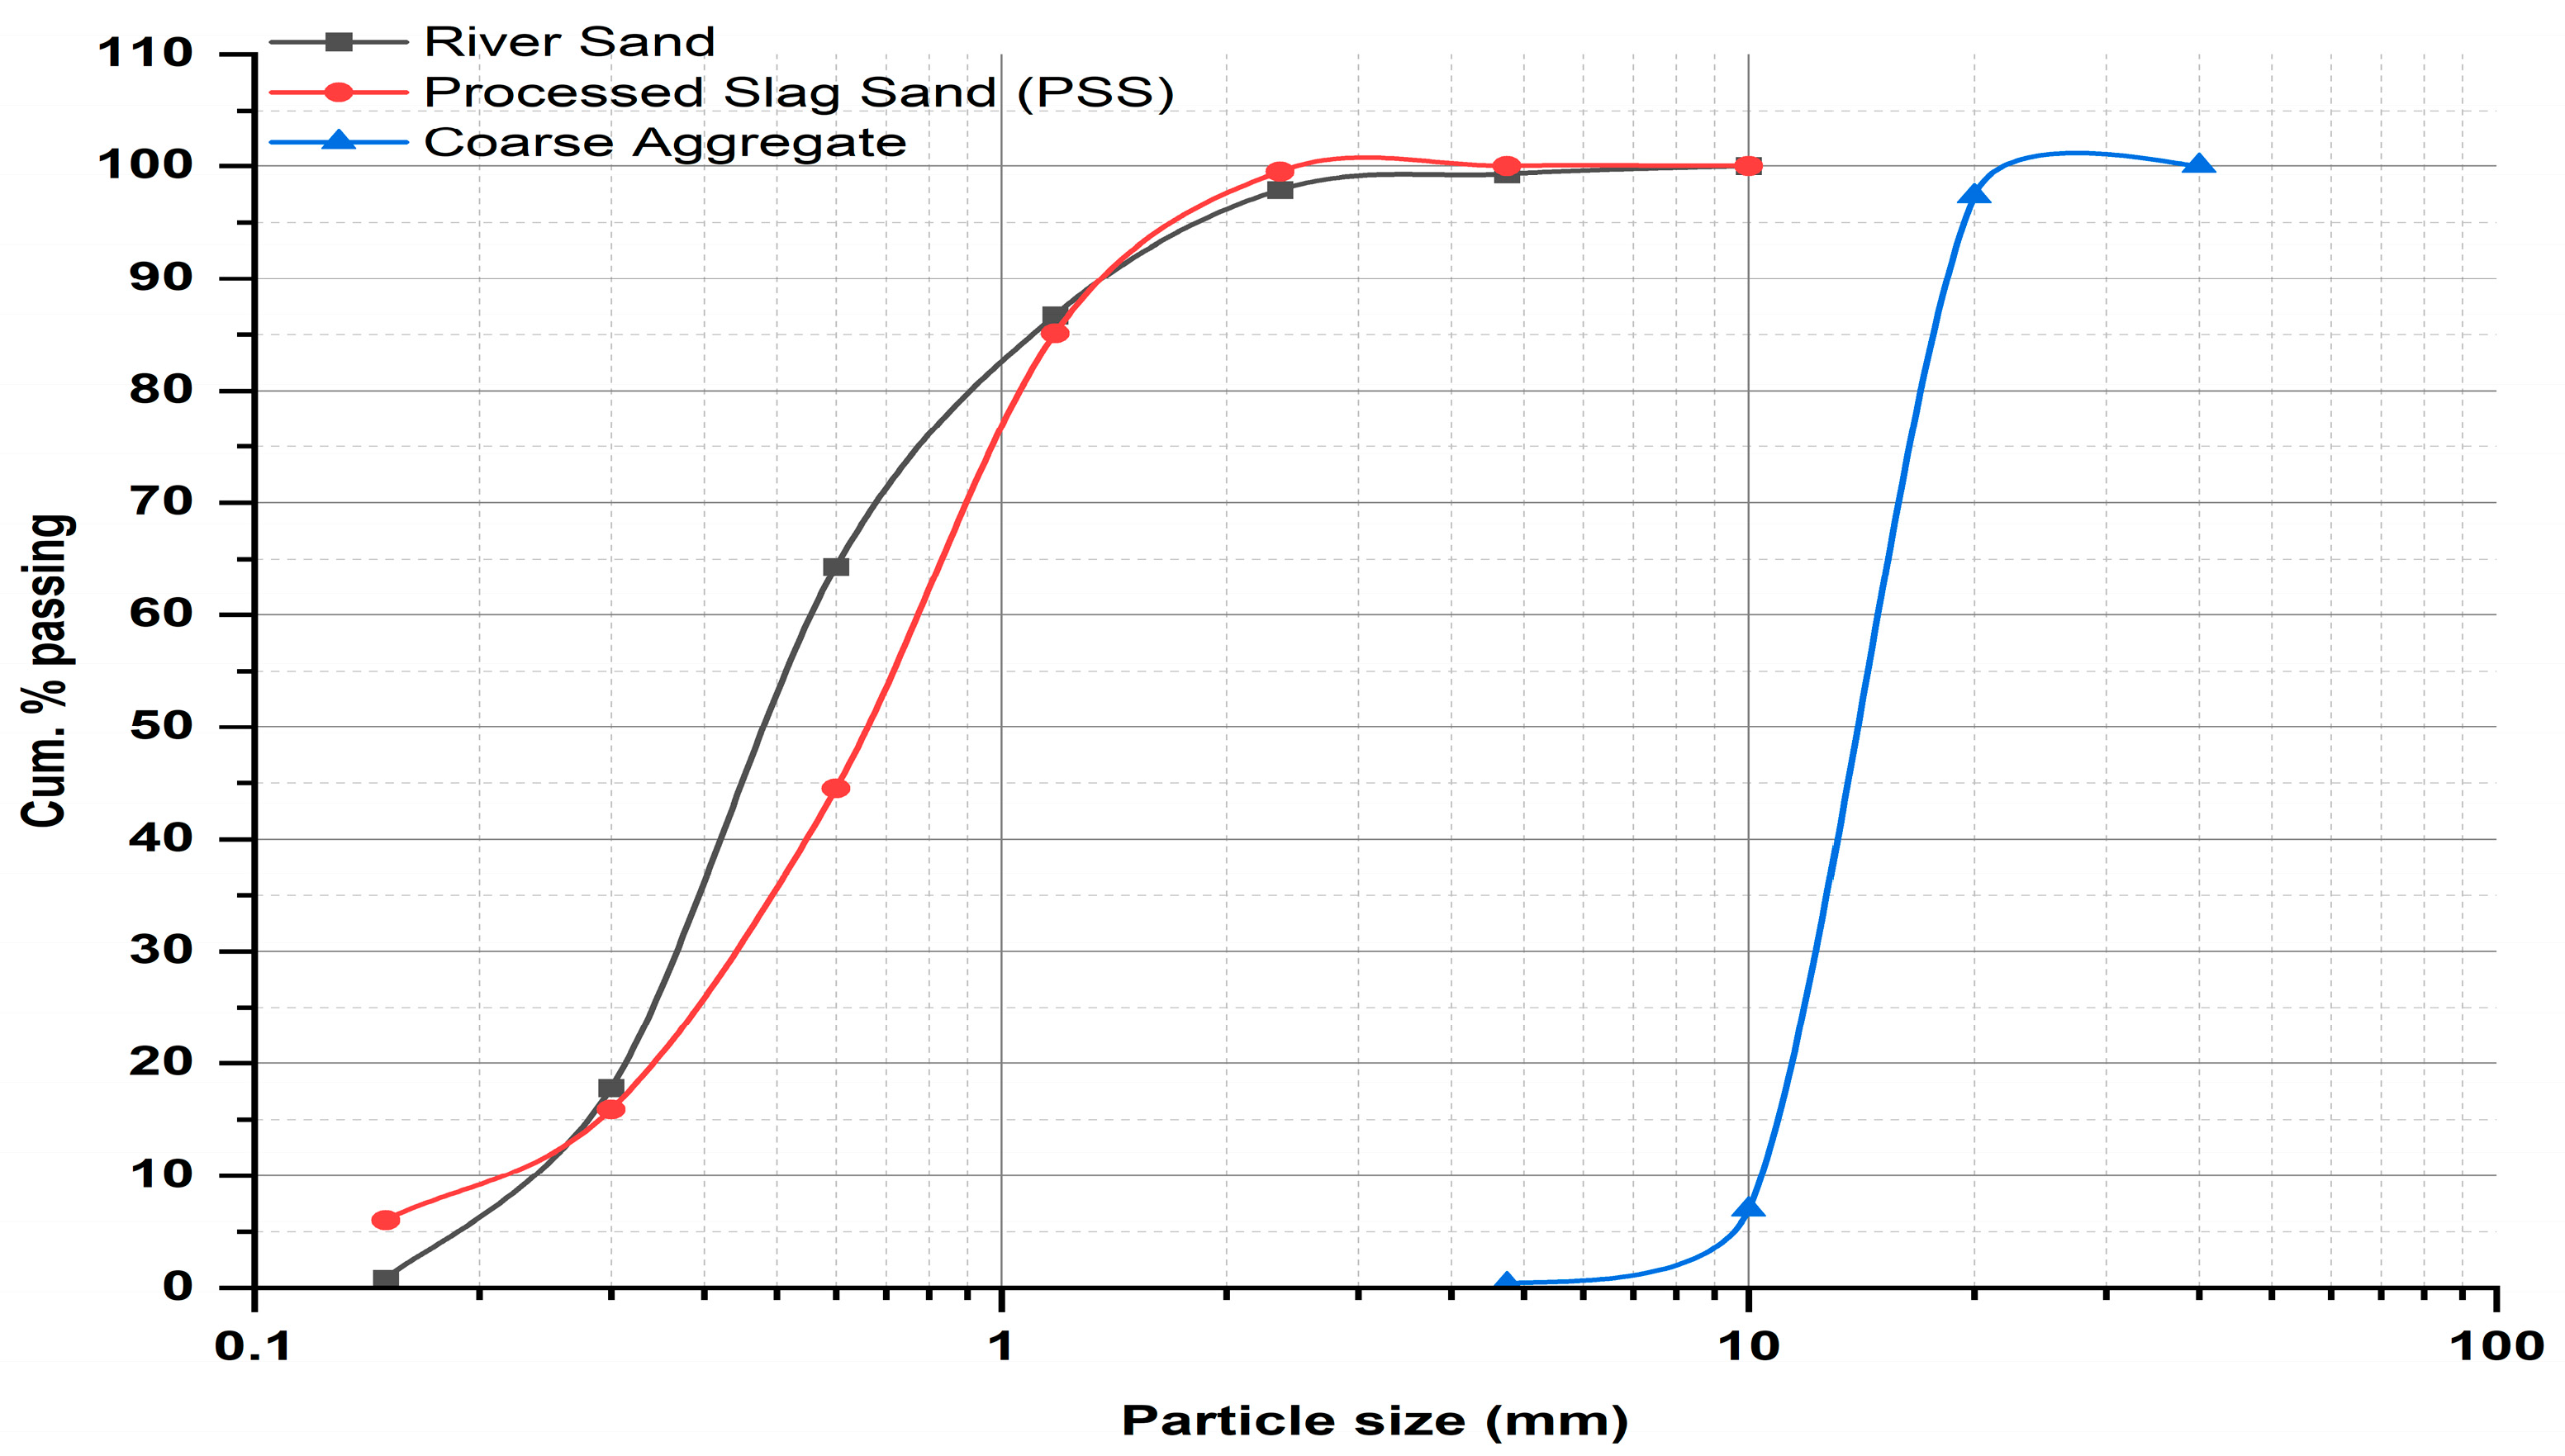
This research investigation was employed. Ultrafine class F fly ash (FA), ground granulated blast furnace slag (GGBS), 10 molar sodium hydroxide solution (SHS), sodium silicate solution (SSS), river sand (RSa), processed slag sand (PSS), coarse aggregate (CAg), and water are the constituents used to prepare the PQGC. These materials were locally sourced to reduce the cost of production. FA with a ceno-spherical particle shape in its morphology (Figure 1a) was obtained from the Udupi Thermal Power Plant. GGBS was procured from Mangalore. NaOH pellets and Na2SiO3 solutions were also purchased from a supplier in Mangalore. CAg, RSa, and PSS were obtained from local traders. All these materials were tested for their physical properties per the relevant codes to meet the requirements of paving materials, as presented in Table 1 [9]. Figure 1a–c depicts the physical appearance of FA, GGBS, and PSS, along with their microimages. It was found that the particles of GGBS (Figure 1b) and PSS (Figure 1c) were primarily irregular and blunt in shape. Figure 2 [9] shows the resemblance in the particle size distribution curve of PSS and RS. Table 2 [9] presents the composition of various oxides in FA, GGBS, and PSS.
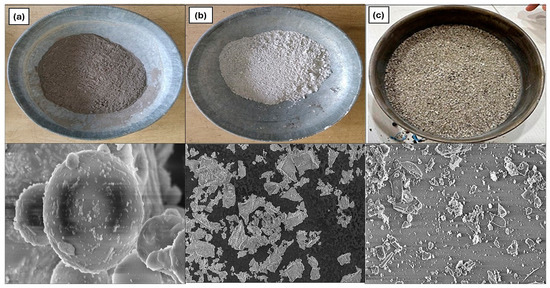
Figure 1.
(a) FA, (b) GGBS, and (c) PSS.

Table 1.
Physical properties of FA, GGBS, CAg, RSa, and PSS.
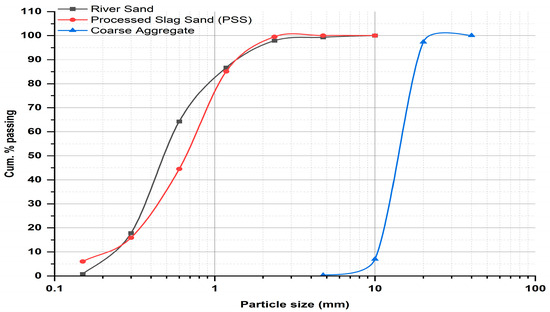
Figure 2.
Particle size distribution curve of Rsa, PSS and CAg.
Table 2.
Oxides composition of FA, GGBS and PSS.
M40 grade PQGC was developed with a targeted slump of 25 ± 15 mm based on the specification of IRC 44 [64]. Two PQGC mixes were developed: PQGRS (control) and PQGSx (where x = 1, 2, 3, and 4). PQGRS contained 100% RSa as a fine aggregate. Meanwhile, PQGSx contained PSS in varying proportions (25%, 50%, 75%, and 100%) as a replacement for RSa. All PQGC mixes were developed based on Rangan’s geopolymer concrete mix design guidelines by adhering to IRC code requirements. Accordingly, the quantities of constituent materials used for the production of the PQGC mix were obtained. Table 3 [4] gives the mix annotations and their composition.
Table 3.
Composition of PQGRS and PQGS mix.
2.2. Mixing, Placing and Curing of Specimens
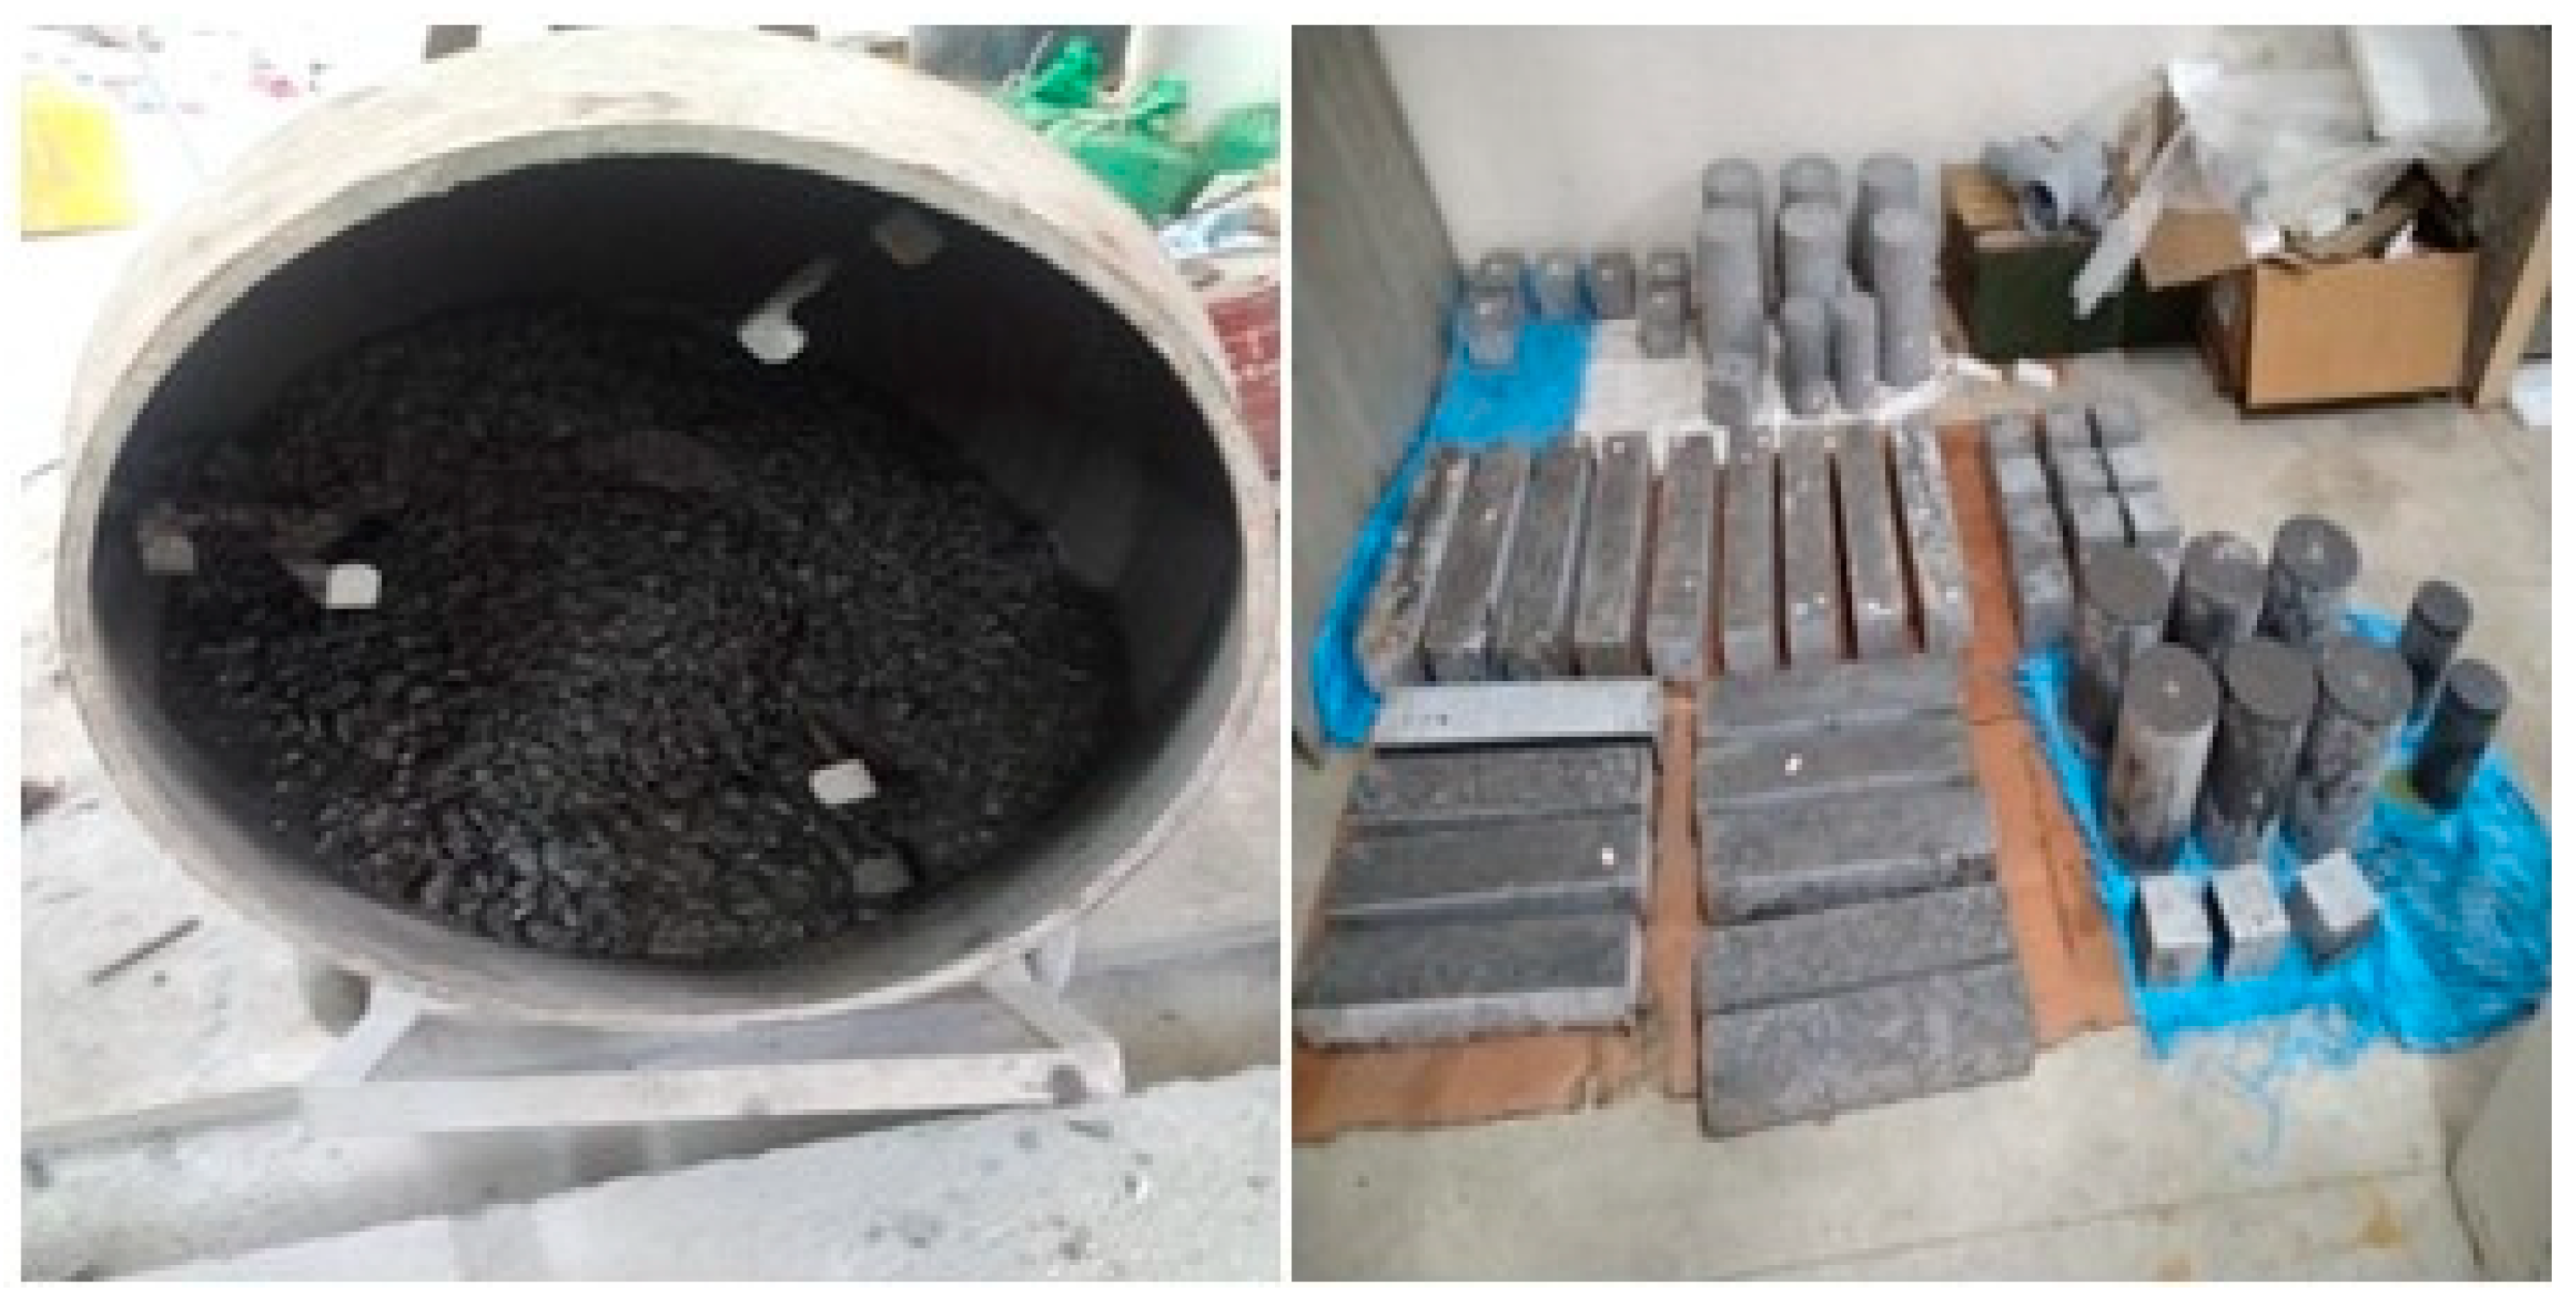
The mixing of raw materials was performed in a drum mixer (Figure 3). The fly ash and GGBS were first added to the mixer and thoroughly mixed to begin the blending process. To this, RSa and/or PSS, along with the CAg, were added, and the mixing continued for 5 mins. An adequate quantity of water was added at this stage, and mixing continued for 2 min. Lastly, the NaOH and Na2SiO3 solutions, which were kept combined before 2 h of the mixing process, were added to the mixer. The mixing continued for another 3 min until a homogeneous mixture was obtained. The 10 -molar SHS was prepared one day before the day of mixing by dissolving 420 gm of NaOH pellets in 1000 mL of water. The prepared homogenous mixture in its fresh state was then transferred to molds of the designated shape, and the fresh concrete in the molds was allowed to set for 24 h. After the concrete sets, it is removed for the molds and allowed for ambient curing for 28 days, as depicted in Figure 3.
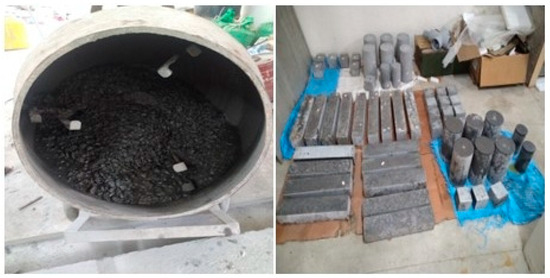
Figure 3.
Mixing, placing and ambient curing.
2.3. Tests on Hardened Concrete
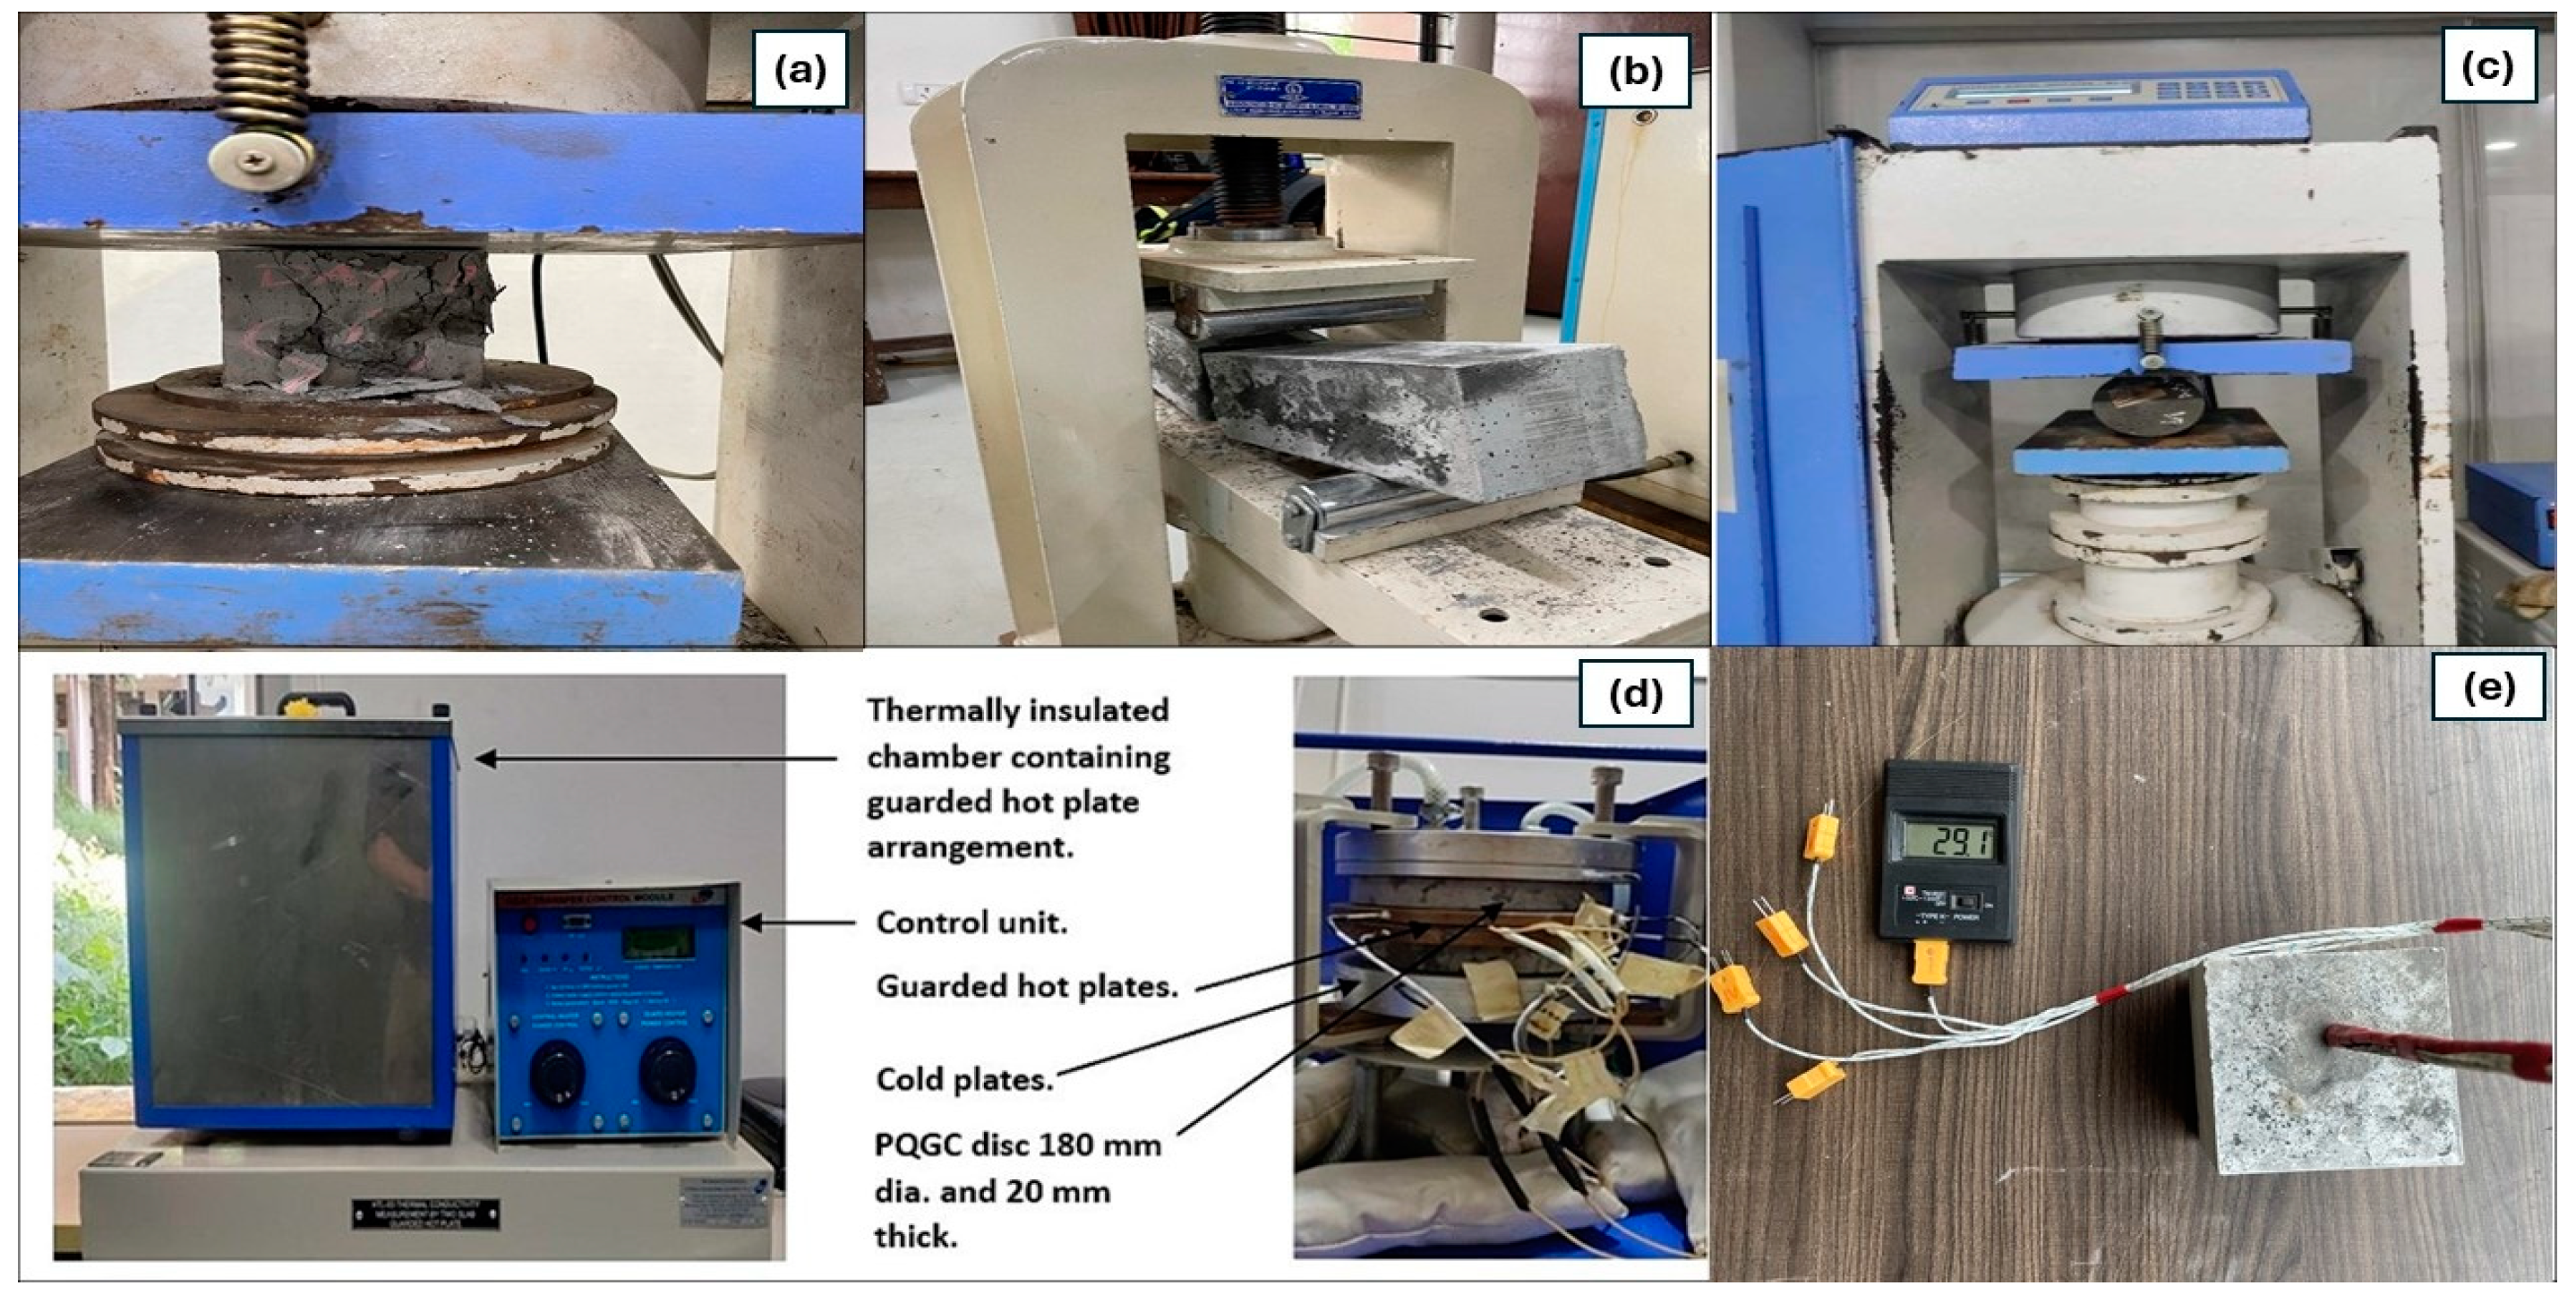
The hardened PQGC specimens, once set and cured for the stipulated period, were investigated for their mechanical and thermal properties. The various tests were conducted on PQGC specimens of different sizes according to the relevant codes and standards mentioned in Table 4. The instrumental setup used for the conduct of tests is presented in Figure 4. The results of the tests were analyzed to draw inferences.
Table 4.
Test on hardened concrete.

Figure 4.
Instrumental setup: (a) compression testing, (b) flexural testing, (c) split tensile testing, (d) thermal conductivity and (e) surface temperature measurement.
Mechanical strength tests: The compression test was conducted on a cube specimen by subjecting it to a compression load in a compression testing machine, as shown in Figure 4a. The load was applied at a constant rate of 14 N/mm2/min until the specimen failed. The compressive strength was determined by taking the ratio of the failure load/contact area of the specimen. For the determination of flexural strength, a beam specimen was subjected to two-point bending loading, as shown in Figure 4b. A load at a constant rate of 0.7 N/mm2/min was applied until the specimen broke. All the specimens were observed to fail at the middle 1/3rd length of the specimen. Then the flexural strength was determined using the equation mentioned below. A cylindrical specimen was subjected to circumferential loading, as shown in Figure 4c, at a rate of 1.2 N/mm2/min to 2.4 N/mm2/min until the specimen was split into two halves. Then the split tensile strength was obtained using the equation as mentioned below.
where;
P = failure load in N
B = width of the beam
D = depth of the beam
L = length of the beam
l = length of the cylinder
d = diameter of the cylinder
Measurement of thermal conductivity and surface temperature: The thermal conductivity of the PQGC specimens was measured using a guarded hot plate (GHP) instrument, as shown in Figure 4d. The instrument consists of a hot plate with a central heater, surrounded by a guard heater, and a cold plate. The PQGC circular disc is positioned between the hot and cold plates. Conduction sends heat through the PQGC disc from the hot plate to the cold plate. The thermal conductivity values are determined by adjusting the power supplied to the central and guard heaters while varying the temperature. The instrument automatically calculates and displays thermal conductivity based on the power supplied and the temperature.
K -type thermocouples were embedded inside the PQGC cubes in order to measure the temperature variations at the near -top surface w.r.t. fluctuations in the ambient temperature, as shown in Figure 4e. The cubes were kept outside to receive sufficient sunlight during the day. The free end of the thermocouple wire, which contains pins, was connected to a hand -held data logger that converts electrical signals received from the thermocouple to temperature and displays them. The temperature was recorded manually at regular intervals for 7 days. The observed temperature data was analyzed to understand the temperature distribution pattern in PQGC cubes.
3. Results and Discussion
3.1. Micrographs of PQGRS and PQGSx
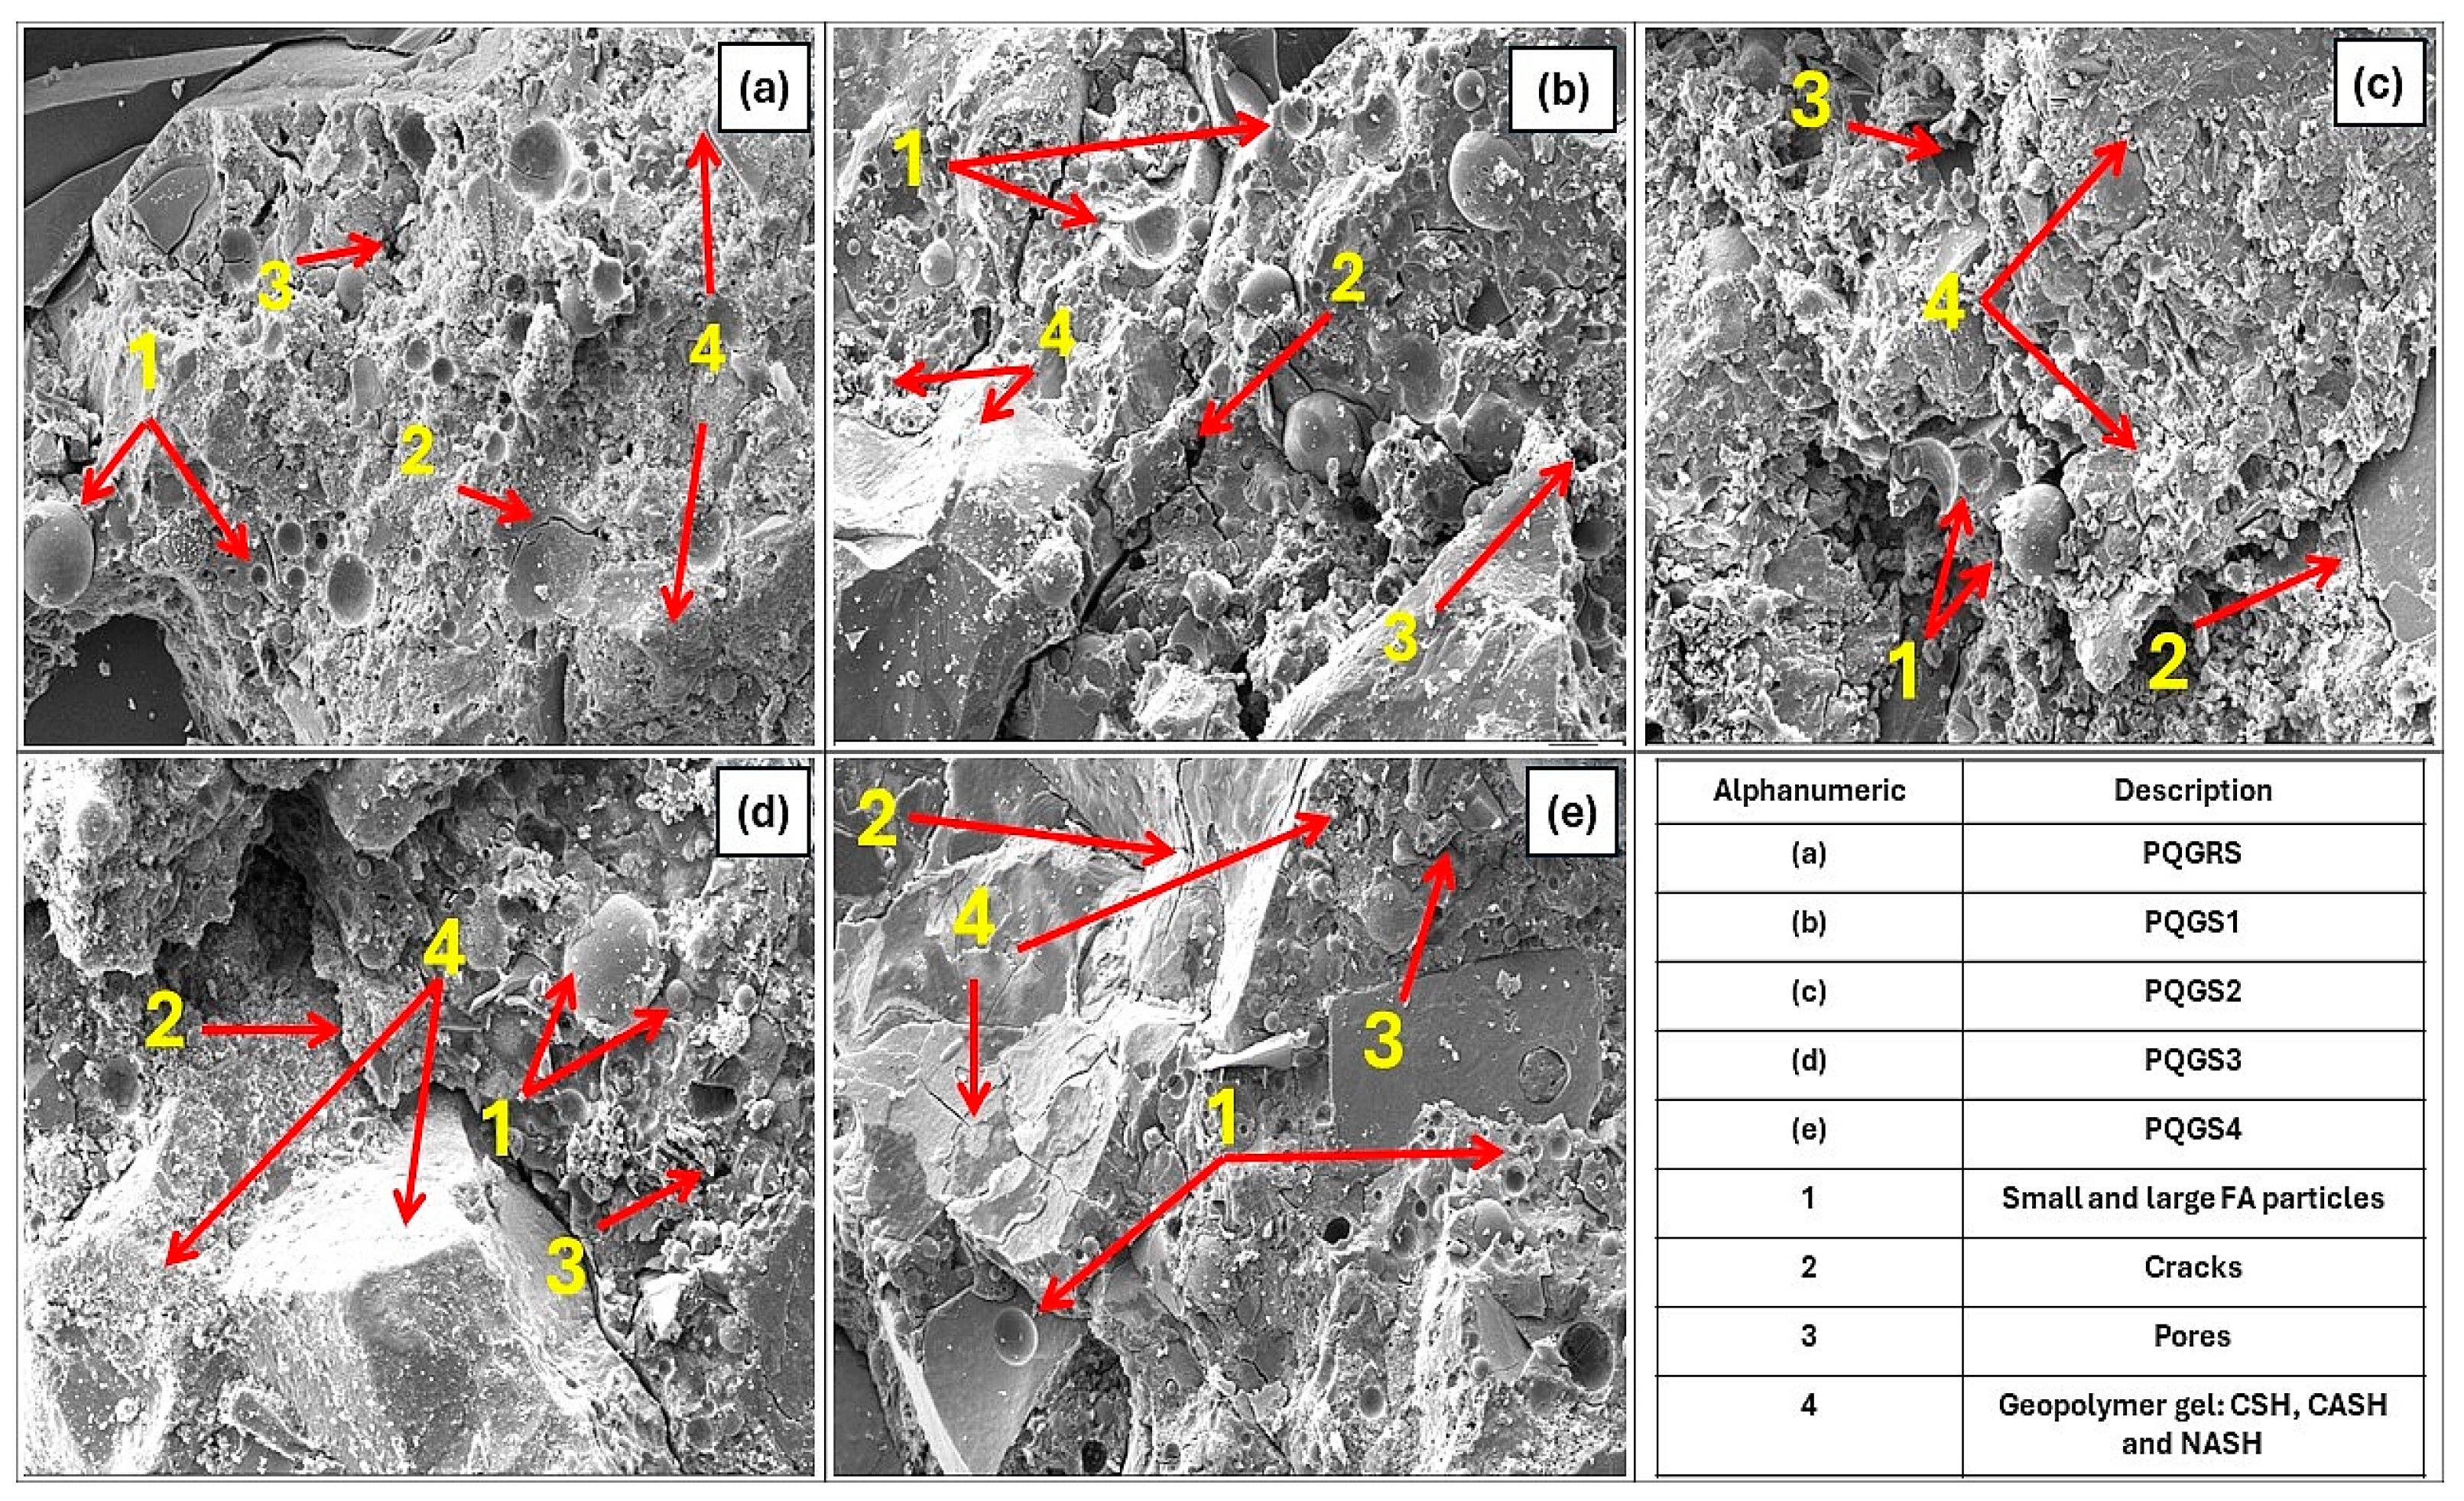
The effect of RSa replacement by PSS on microstructure properties was performed by analyzing the SEM images at a magnification of 1000×. The pore refinement and geopolymer gel formation improved as PSS replaced RSa from 25% to 100%. The increase in PSS content provides additional Ca2+ ions during the geopolymerization reaction, as reported in [9]. Therefore, it improves the synthesis of unreacted FA and GGBS particles. Figure 5 depicts the micrographs of PQGRS and PQGSx mixes. Figure 5a is for the PQGRS mix containing only RSa. It contained many large and small, non-synthesised FA particles. The cracks are evident in large FA non-synthesised particles. The geopolymer compounds have significant pores. All these reasons led to reduced strength in the PQGRS mix.
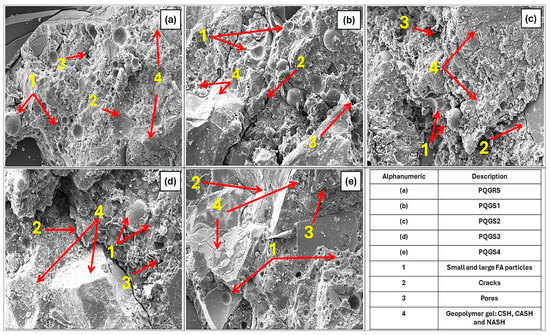
Figure 5.
Micrographs of PQGC mixes: (a) PGQRS, (b) PQGS1, (c) PQGS2, (d) PQGS3, and (e) PQGS4.
As the PPS content increased to 25%, the amount of non-synthesised FA particles and pores decreased, causing a relatively denser matrix, as seen in Figure 5b. Therefore, the strength also increased. However, the cracks were evident, but not in FA particles. A further increase of up to 75% of PSS content produced a much denser matrix with fewer non-synthesised FA particles and pronounced geopolymer compounds, as seen in Figure 5c,d. Consequently, strength was gained, although the cracks were evident in the concrete. At 100% PSS content, Figure 5e, it promoted better synthesis of FA particles, leading to a much denser and amorphous matrix with an enhanced geopolymer compound, resulting in a significant gain in strength.
3.2. Mechanical Strengths of PQGRS and PQGSx Mixes
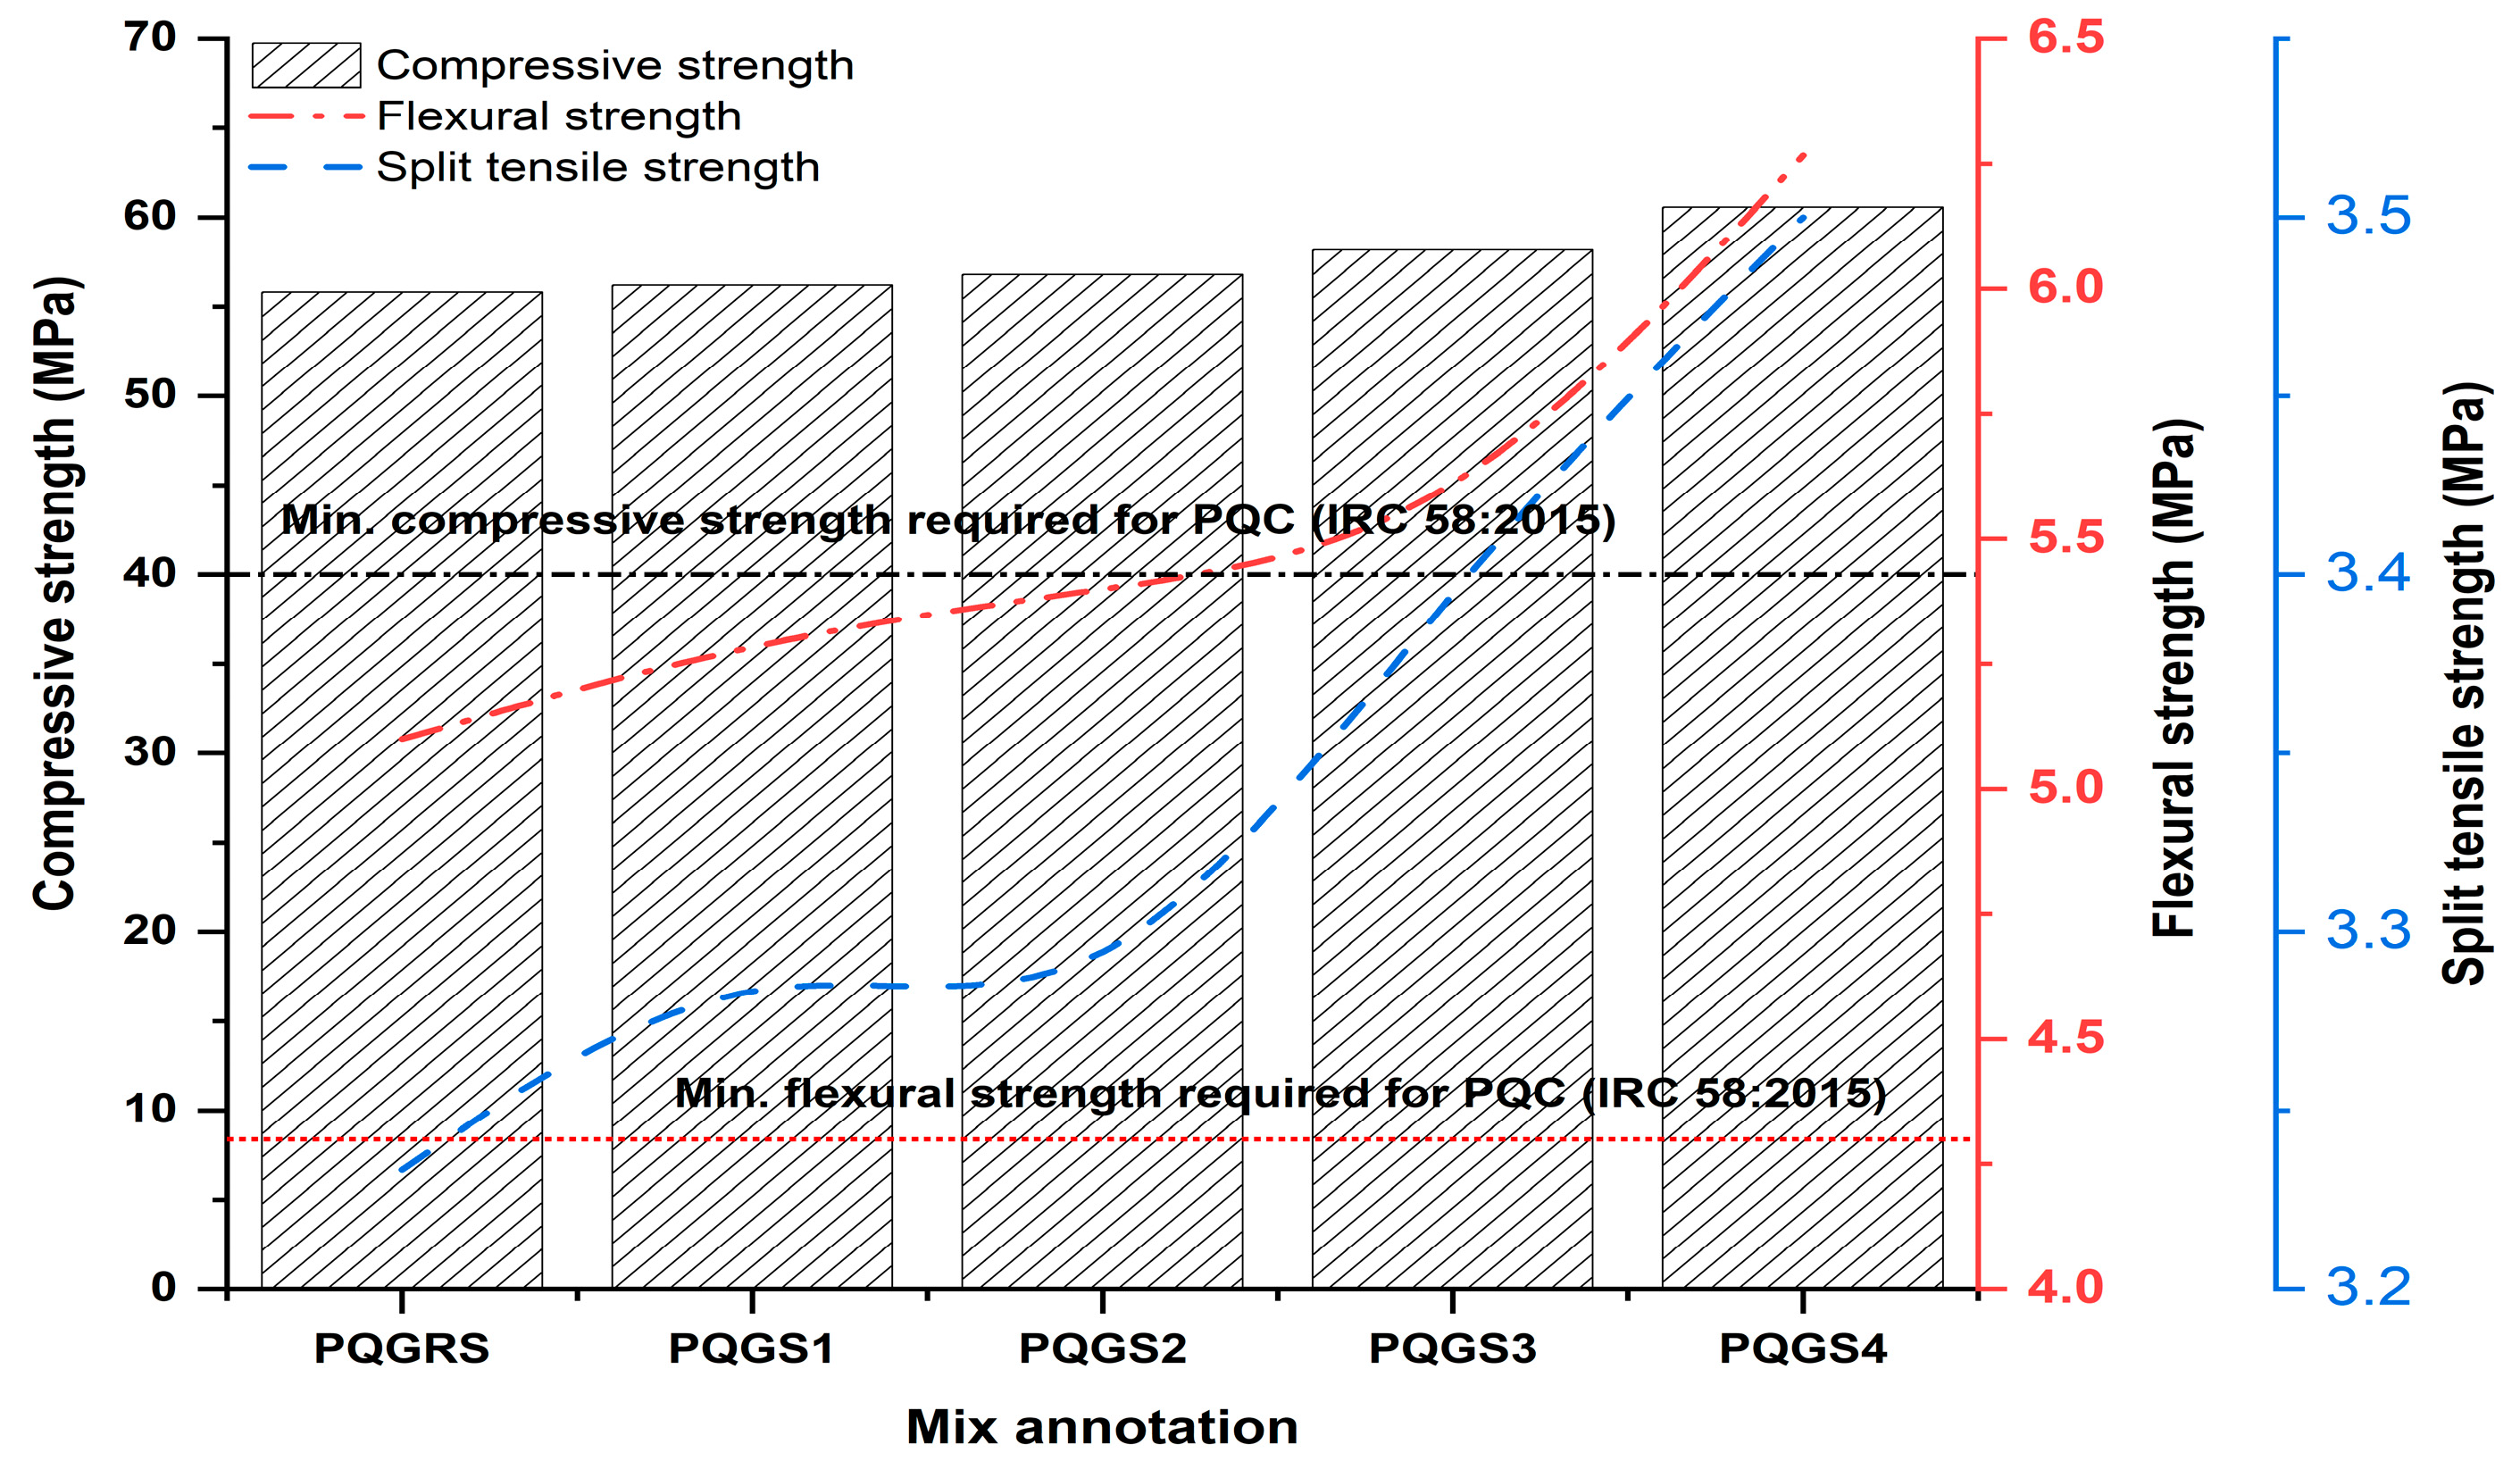
Figure 6 illustrates the mechanical strengths of the PQGRS and PQGSx mixes after 28 days of ambient curing. It is observed that the mechanical strengths increased steadily as the replacement level of RSa by PSS increased from 25% to 100%. The compressive strength test represents a fundamental and widely used examination method for concrete. This test holds significant utility, as many crucial properties of concrete are intricately linked to its compressive strength (Neville, 1995). Compressive strength (Cst) is a metric for measuring paving concrete performance and quality. For rigid pavement applications, the concrete mix should satisfy the minimum compressive strength (MCst) requirement of 40 MPa as per IRC58: 2015 [67].
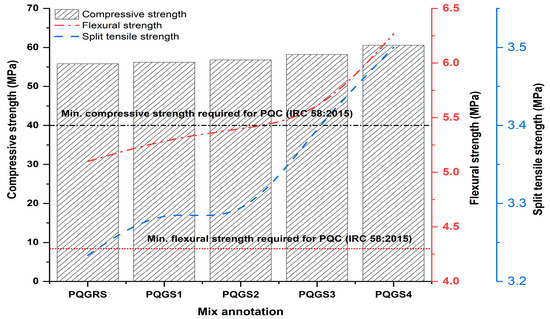
Figure 6.
28-day mechanical (compression, flexure and split tensile) strength of PQGC mixes.
At 28 days of curing, PQGRS achieved a Cst of 55 MPa, which is 37.5% more than the MCst required for rigid pavement. Meanwhile, the Cst registered by PQGSx mixes ranged between 56 MPa and 61 MPa when the replacement of RSa by PSS varied from 25% to 100%. PQGSx mixes’ strength exceeds 40 MPa by 40% to 52.5%. The Cst of PQGRS and PQGS1(56 MPa) was the same. The Cst of PQGS2 (57 MPa) was 3.63% higher than PQGRS. Meanwhile, between PQGRS and PQGS3 (58 MPa), the Cst was only enhanced by 5.45%.
PQGS4 (61 MPa) registered an increment of 10.9% in its Cst w.r.t PQGRS. The increase in PSS content aided the geopolymer reaction, resulting in the maximum synthesis of FA particles, as seen through the micrograph in Figure 5e. As a result, the microstructure also improved. The increase in PSS content provides additional calcium, as reported in [9,66,67,68,69,70], during the geopolymerization process, thus improving the CSH and CASH products, which result in strength gain. Enhanced PSS content increased the fine’s volume [71,72] refining the PQGSx pore structure. All these factors increased the Cst.
The flexural strength (Fst) increment exhibited a similar trend to the compressive strength improvement. IRC 58: 2015 [5] guidelines insist that the concrete must possess a minimum flexural strength (MFst) of 4.3 MPa for pavement applications. From Figure 4, it is evident that both PQGRS and PQGSx meet the MFst by a decent margin. PQGRS registered an Fst of 5.1 MPa, which is 18.6% higher than the MFst. The improvement in Fst of PQGSx mixes w.r.t MFst was 23% to 44%. The FSt increase between PQGRS (5.1 MPa) and PQGS1 (5.3 MPa), PQGS2 (5.4 MPa), and PQGS3 (5.5 MPa), respectively, was 3.9%, 5.8%, and 7.8%. PQGS4 (6.3 MPa) recorded the highest Fst among all mixes, and the enhancement w.r.t. PQGRS was 23.5%. A higher concentration of PSS in PQGS4 enhanced geopolymer reaction products and improved microstructure (Figure 5e), resulting in better Fst. Further, the rough texture and blunt shape of PSS particles may have led to the development of the physical bond between the binder and PSS particles that improved the Fst of PQGS4 [9,68,69,70,71,72]. Concrete with a better Fst has increased fatigue resistance and a longer lifespan.
At 28 days of curing, the variation in splitting tensile strength between PQGS1, PQGS2, PQGS3, and PQGRS was marginal, whereas the PQGS4 mix registered an improved splitting strength of 8.3% w.r.t PQGRS. The rough texture of the PSS particles may have caused the development of a strong bond between the binder and PSS particle, therefore improving the tensile behavior of PQGS4 [69].
3.3. Ecological and Cost Analysis of PQGRS and PQGSx Mixes
3.3.1. Operational Unit and System Boundaries
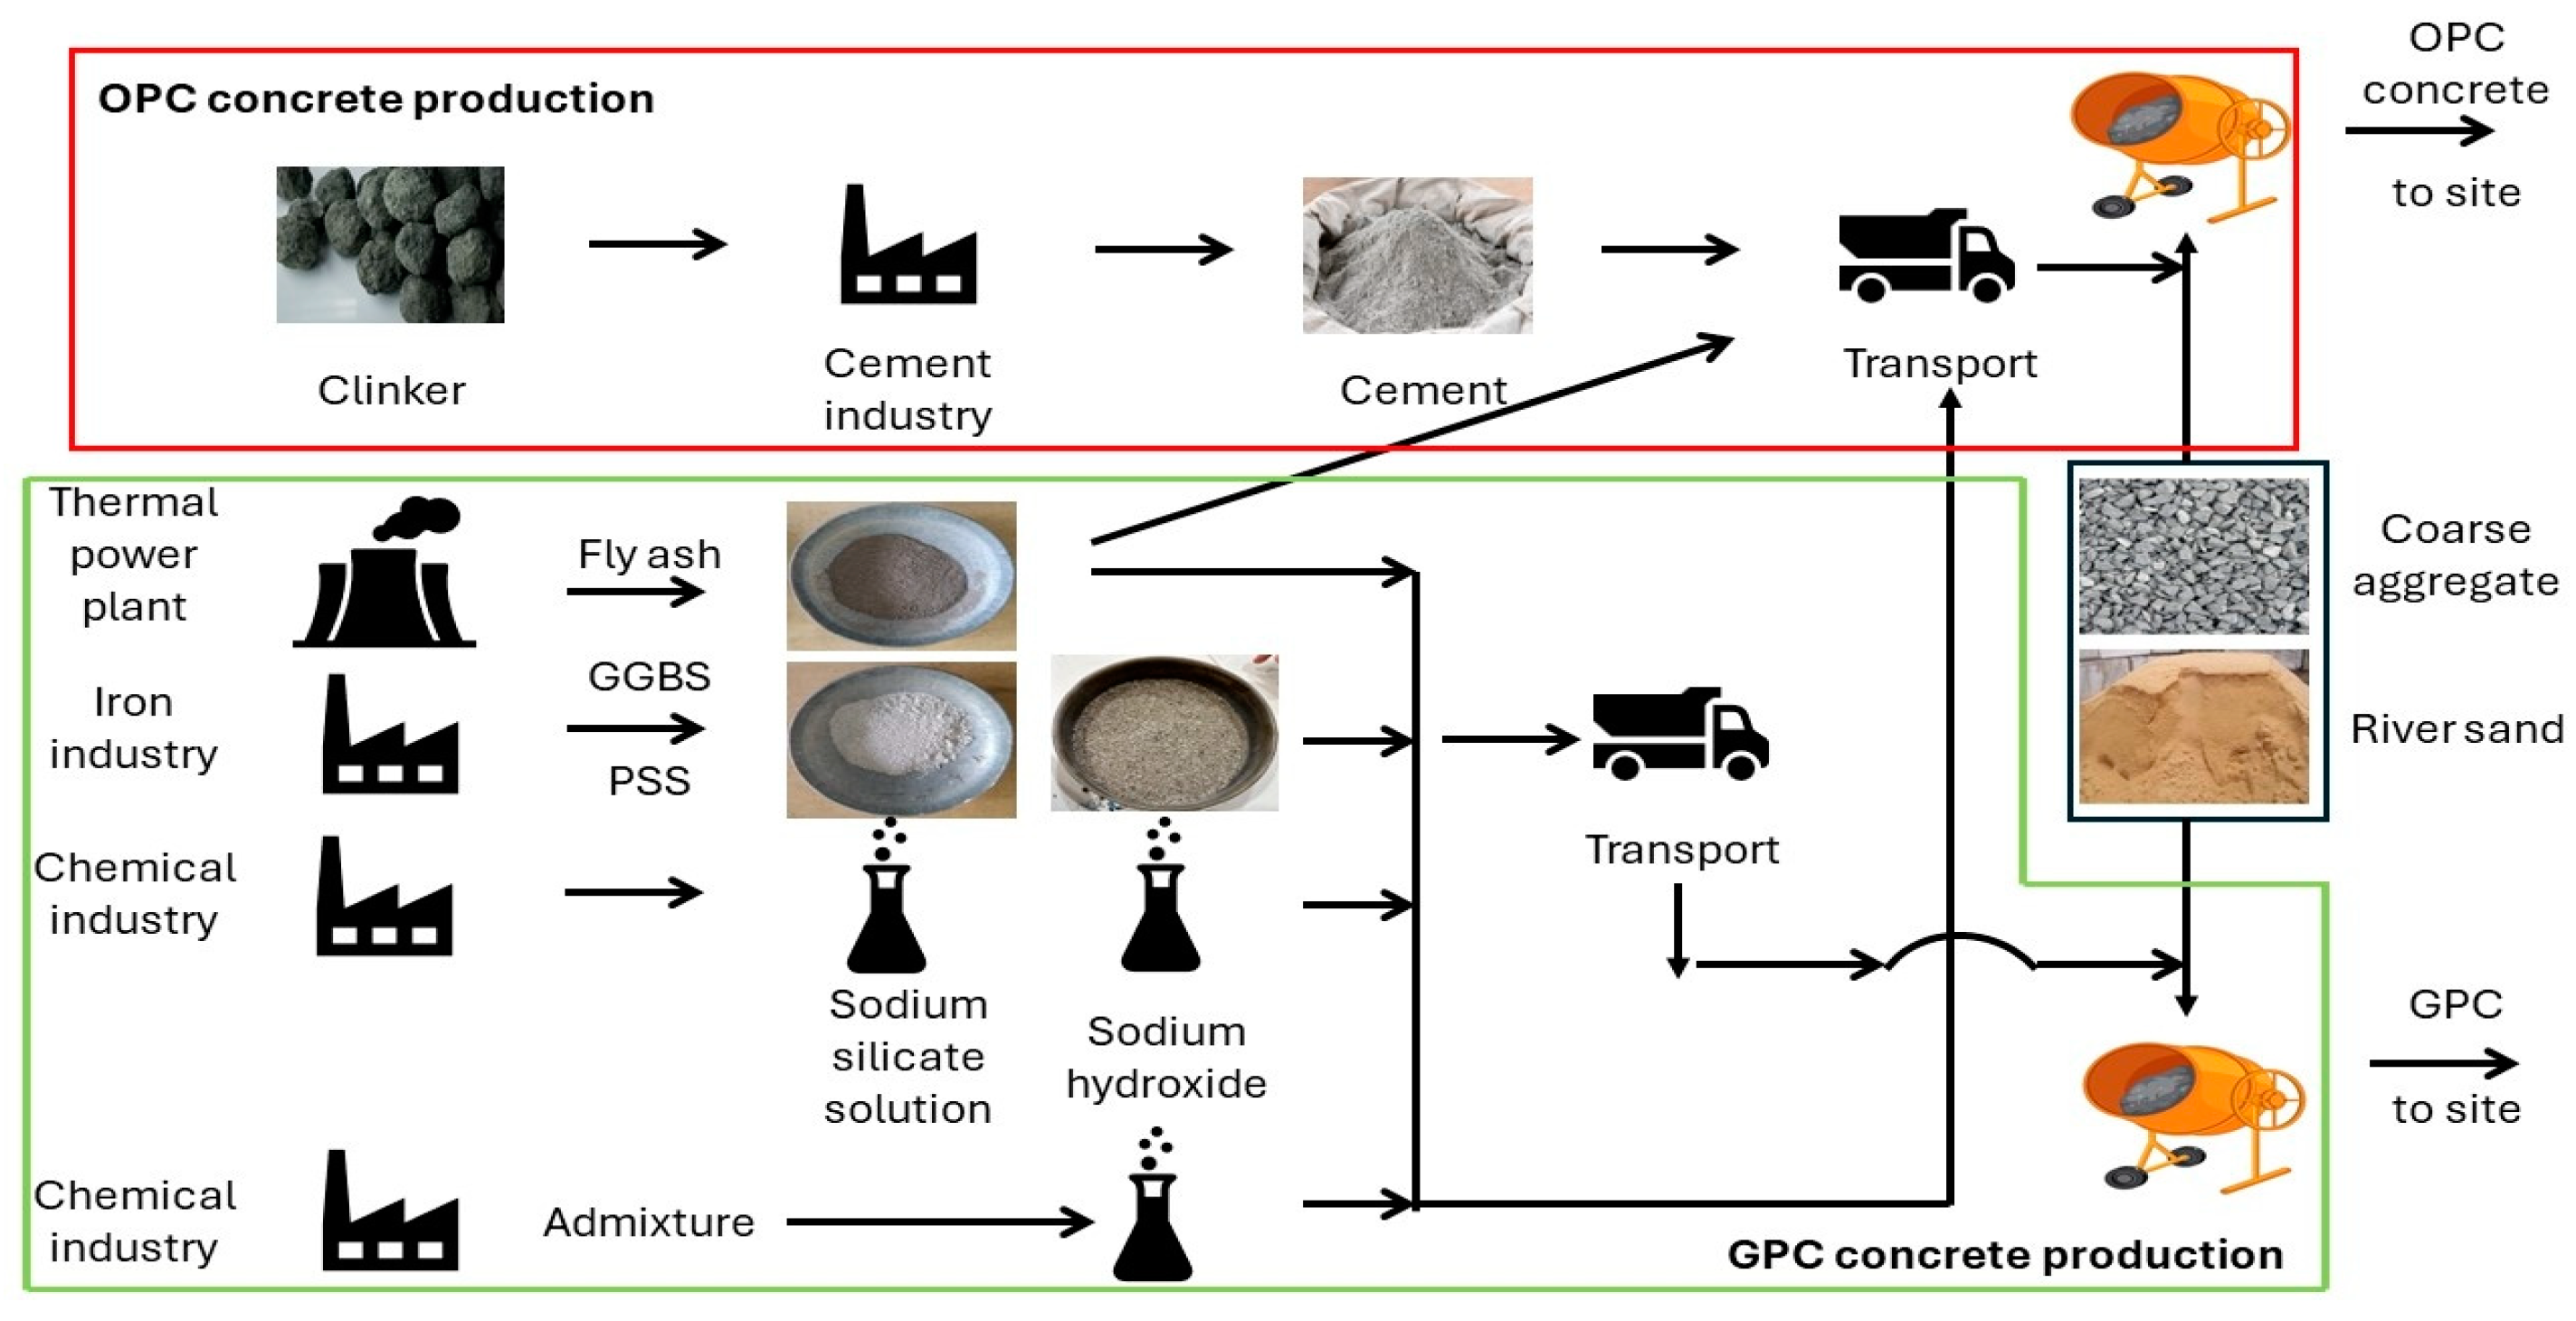
The life cycle assessment (LCA) process comprises three primary stages: defining the operational unit and system boundaries, conducting an inventory of materials, and performing an impact assessment [34]. In this study, the operational unit for the quantity of concrete is defined as a cubic meter of concrete, while the operational unit for embodied energy is MJ/kg. CO2 emissions are measured in kg CO2/kg. The production costs of PQGC, PQC, and FPQC were calculated in Indian rupees (INR) per kg of the constituent materials. The quantities of constituent materials in PQGC are based on the specified mix design as already described in an earlier session of this manuscript, whereas for PQC and FPQC, the material quantities were adopted for IRC 44: 2017 [64]. The system boundary, illustrated in Figure 7, delineates the stages of the product’s life cycle. Impact coefficients are sourced from relevant literature, and the study estimates indices such as the embodied energy index, CO2 emission index, cost index, and global warming potentials as impact assessments.
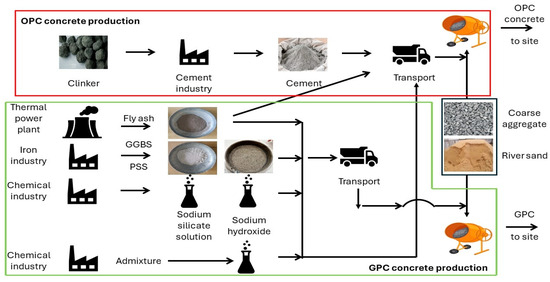
Figure 7.
System boundaries for PQGC, PQC, and FPQC mixes.
3.3.2. Estimation of Embodied Energy (EE) of PQGRS and PQGSx Mixes
The parameters that are considered for the assessment of energy consumption in the production of one cubic meter of PQGC and PQC mixes encompass various system variables, namely OPC, FA, GGBS, alkali solution, aggregates, PSS, admixture, and water. OPC, produced through the heat treatment of clinker in kilns, demands approximately 4.2 MJ to 4.8 MJ per kilogram of its production [2,10,73]. FA, a by-product of coal combustion in thermal power plants, has almost negligible energy consumption. However, it undergoes processing before integration into construction, warranting a conservative EE estimate of 0.04 MJ/kg. GGBS, derived from the grinding of slag, a by-product of the iron manufacturing industry, possesses an embodied energy of 0.31 MJ/kg. Alkaline solutions, constituting a substantial portion of the energy in GPC, incur energy of 20.5 MJ/kg for NaOH [10] and 5.37 MJ/kg for Na2SiO3 [10,73,74]. Aggregates constitute 70% to 75% of concrete volume, with CAg and RSa having energy values of 0.22 MJ/kg and 0.02 MJ/kg, respectively [10]. PSS, another by-product of iron manufacturing derived from slag processing, incurs an energy consumption of 0.15 MJ/kg (assumed to be 50% of the energy consumption of GGBS as the information on energy consumption for the production of PSS was unavailable in the database). The values of embodied energy of constituent materials of all the concrete types considered in this study are presented in Table 5. The estimated embodied energy values for one cubic meter of PQGRS, PQGSx, PQC, and PQC with fly ash (FPQC) are compared in Figure 8.
Table 5.
Embodied energy of constituent materials of concrete.
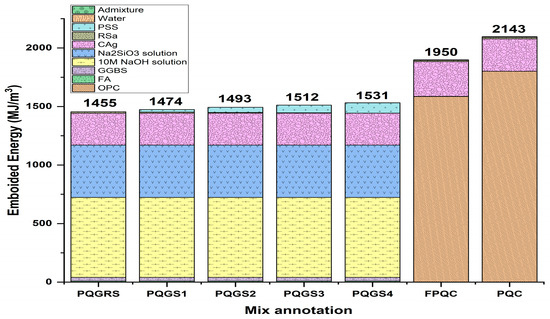
Figure 8.
Estimated embodied energy of PQGRS, PQGSx, FPQC, and PQC mixes.
Figure 8 signifies lower levels of EE for PQGRS and PQGSx than those of FPQC and PQC. SHS and SSS significantly contribute to the EE of PQGRS and PQGSx mixes. In PQC and FPQC, the significant contribution to EE comes from OPC itself. The share of the other ingredients in PQGC, PQC, and FPQC mixes in EE remained the same. The EE of PQGRS and PQGSx mixes was 40% to 44% lower when compared to PQC and 27% to 34% lower w.r.t FPQC. The EE increased in the order of 1, 3, 4, and 5 percent, respectively, between PQGRS and PQGS1, PQGS2, PQGS3, and PQGS4, as the replacement levels of RSa by PSS in all four increased from 0 to 100%. EE of PSS (0.15 MJ/m3) is more than RSa (0.02 MJ/m3); therefore, the total EE in PQGSx also increased.
3.3.3. Estimation of Carbon Dioxide Emissions from PQGRS and PQGSx Mixes
The predominant factor influencing CO2 estimation in a concrete mix is the binder and its composition. In PQC, the binder may consist of OPC and pozzolanic OPC, while PQGC incorporates FA, GGBS, and alkaline solutions as binder components. OPC production is associated with an emission factor of approximately 0.84 kg CO2/kg [36,75]. Notably, studies report emission factor values ranging from zero to 0.004 kg CO2/kg for FA [76,77,78,79,80], 0.05 to 0.052 kg CO2/kg for GGBS [81,82], 1.6 to 1.88 kg CO2/kg for admixtures [81,82,83], and 0.68 kg CO2/kg for Na2SiO3 [76,77,80,83]. The emission variable coefficients presented in Table 6 were employed for the analysis in this study.
Table 6.
CO2 emission coefficients of constituent materials of concrete.
Figure 9 illustrates the calculated CO2 emission per cubic meter (m3) of PQGC, PQC, and FPQC. Figure 9 shows that the OPC is the major contributor to CO2 emissions in PQC and FPQC. While SHS and SSS majorly contribute to maximizing CO2 emissions in PQGRS and PQGSx, marginal variation in CO2 emission among PQGRS and PQGSx mixes was also produced by PSS since the CO2 emission of PSS (0.026 Kg-CO2/kg) was slightly higher than that of RSa (0.0048 Kg-CO2/kg). The CO2 emission values of PQGC mixes were 1.22 and 1.49 times lesser w.r.t PQC and FPQC, respectively. Within the PQGC mixes, there is an increase in CO2 emissions for every 25% replacement of RSa with PSS. For instance, a minimal increase of 1.7% in CO2 emissions was noted in PQGS1 for a 25% replacement of RSa, while an increment of 6.9% in CO2 emissions was observed in PQGS4 when the RSa was 100% replaced by PSS.
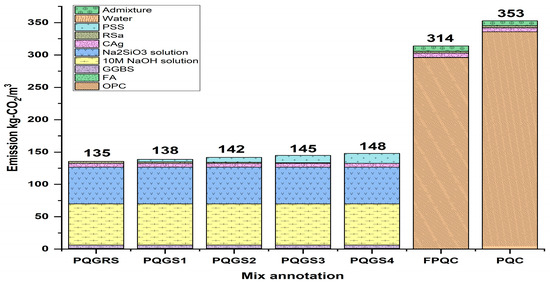
Figure 9.
Estimated CO2 emissions of PQGRS, PQGSx, FPQC, and PQC mixes.
3.3.4. Cost Analysis of PQGRS and PQGSx Mixes
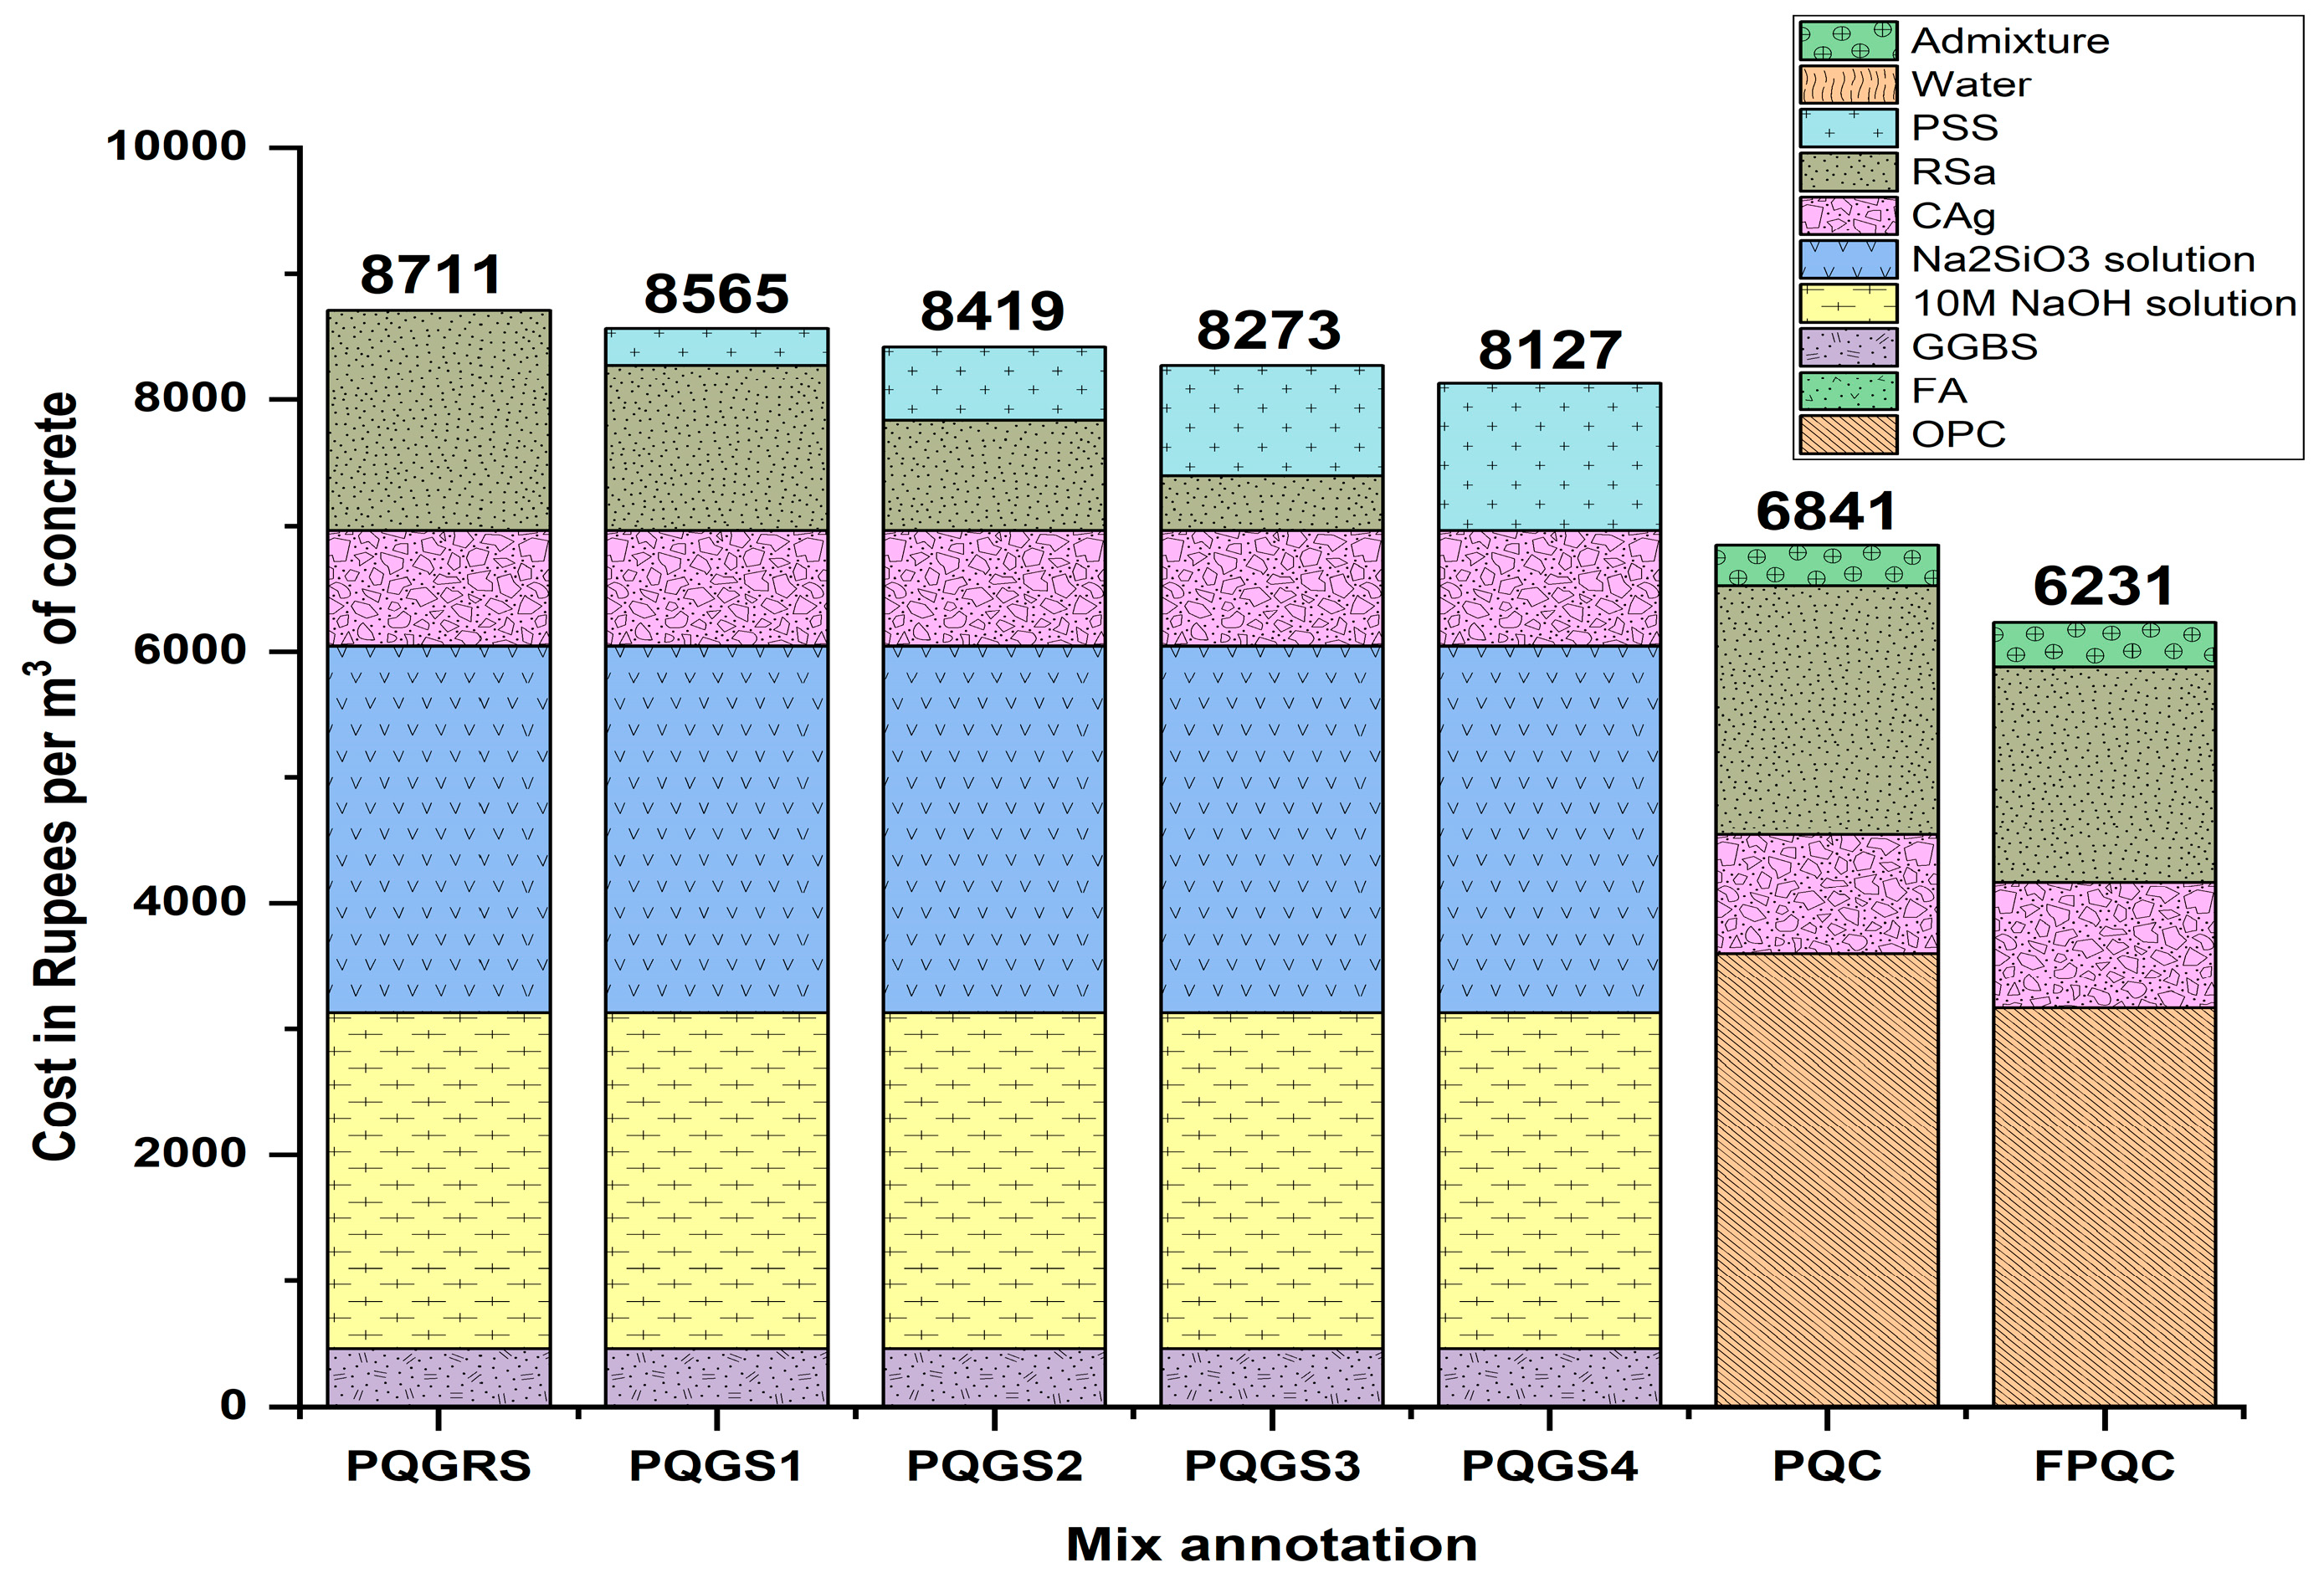
The unit costs of the constituent materials of PQGC, PQC, and FPQC are given in Table 7, while the estimated costs per cubic meter (m3) of PQGC, PQC, and FPQC are shown in Figure 10. The cost associated with PQGC may exhibit variability contingent upon the retail pricing of NaOH and Na2SiO3 solutions utilized in preparing the alkaline solution for PQGC production [81]. Since FA and GGBS are readily available industrial by-products, their costs are reasonable, depending on proximity to the source of availability. Meanwhile, the cost distribution related to aggregates remains consistent.
Table 7.
Unit cost of materials used in concrete mixes.

Figure 10.
Estimated cost in INR (₹) of PQGRS, PQGSx, FPQC, and PQC mixes.
The cost of PQGC was marginally reduced as the replacement levels of RSa by PSS increased from nil to 100%. The PQGS4 (₹ 8127) was 7.2% less than the PQGRS (₹ 8711) mixes. The cost difference between PQGRS and PQGS1 (₹ 8565), PQGS2 (₹ 8419), and PQGS3 (₹ 8273) was respectively 1.7%, 3.5%, and 5.3%. Geopolymer concrete is relatively expensive compared to OPC concrete owing to SHS and SSS’s costly nature. Considering the average cost of PQGC mixes and comparing it with the costs of PQC (Rs 6841) and FPQC (Rs 6231), it is found that the average cost of PQGC mixes is 23% higher than PQC and 35% higher than FPQC. In this study, fly ash was procured free of charge for research purposes. However, a conservative price of Rs 3 per kg of FA would increase the above cost difference to 33% between PQGC mixes and PQC and 40% between PQGC and FPQC.
3.3.5. Eco-Efficiency (EcoE) of PQGRS and PQGSx Mixes
Eco-efficiency relates the 28-day mechanical strength of concrete to the energy consumption and corresponding emissions associated with the production of geopolymer concrete. This measure is used exclusively for comparative analysis of concrete. Figure 11 illustrates the eco-efficiency plot developed by taking the ratio of the compressive, flexural, and split tensile strengths of all mixes to their CO2 emissions.
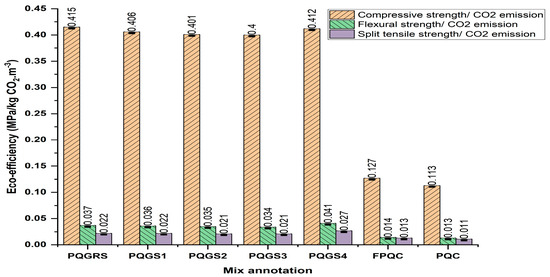
Figure 11.
Estimated ecoefficiency of PQGRS, PQGSx, FPQC, and PQC mixes.
Compressive strength/CO2 emission: Figure 11 indicates that the highest eco efficiency measured w.r.t Cst is observed for PQGS4 (0.412 MPa/KgCO2 m3), followed closely by PQGRS, PQGS1, and PQGS2, all around 0.40–0.41 MPa/KgCO2 m3. FPQC (0.127 MPa/KgCO2 m3) and PQC (0.113 MPa/KgCO2 m3) had significantly lower eco-efficacy values when measured w.r.t compressive strength. The average eco-efficacy values in flexure of PQGSx are 3.18 and 3.57 times those of PQC and FPQC, respectively.
Flexural strength/CO2 emission: As per Figure 11, the PQGRS, PQGS1, PQGS2, and PQGS3 all have similar eco-efficacy values of 0.035–0.037 MPa/KgCO2 m3 when measured w.r.t. flexural strength. The eco-efficacy of PQGS4 in flexure is slightly higher at 0.041 MPa/KgCO2 m3. The eco-efficacy measured for flexural strength for FPQC and PQC is lower at 0.014 and 0.013 MPa/KgCO2 m3, respectively.
Split tensile strength/CO2 emission: Ecoefficiency, when measured w.r.t split tensile strength, depicts similar trends as that of ecoefficiency measured for flexural strength. The eco-efficacy measured with split tensile strength for PQGRS, PQGS1, and PQGS3 is around 0.021–0.022 MPa/KgCO2 m3. The eco-efficacy measured at split tensile strength for PQGS4 is again slightly higher at 0.027 MPa/KgCO2 m3. The spit tensile eco-efficacy values for FPQC and PQC are the lowest at 0.11–0.013 MPa/KgCO2 m3.
3.3.6. Impact Assessment of PQGRS and PQGSx Mixes
The assessment of the impact of embodied energy (Ei), carbon dioxide emissions (Ci) and cost (costi) of all the mixes was computed as per the equations given below. The indices thus obtained are compared pictorially, as presented in Figure 12.
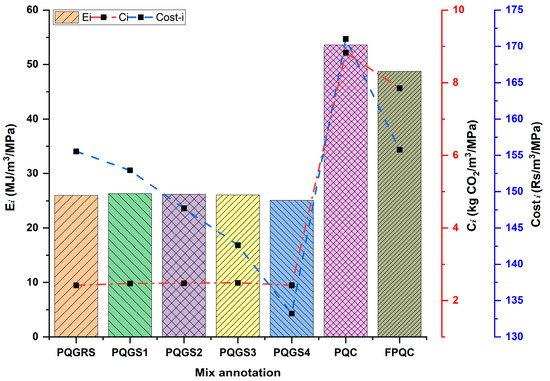
Figure 12.
Estimated ecological and economical indices of PQGRS, PQGSx, FPQC and PQC mixes.
Embodied energy index: Figure 12 shows that Ei values of PQGC mixes decreased from 25.98 MJ/m3/MPa to 25.10 MJ/m3/MPa as the replacement of RSa by PSS increased from 0 to 100%. PQGS4 (25.10 MJ/m3/MPa) had the lowest impact value among all the PQGC mixes. The Ei value (average of all PQGC mixes) of PQGC mixes was 106% and 88% lower than PQC and FPQC, respectively.
Carbon dioxide emission index: There is a major variation in Ci values of PQGC mixes due to the replacement of RSa by PSS. However, PQGS4 had the lowest Ci of 2.42 kgCO2/m3/MPa among all the mixes, including PQC and FPQC, indicating its minimal CO2 impact on the environment per unit strength of concrete.
Cost index: PQGS4 offers the lowest cost per unit strength, while PQC, despite its high energy and carbon intensity, also has very low-cost efficiency. The trend suggests lower costs do not always align with better environmental performance.
3.3.7. Global Warming Potential of PQGRS and PQGSx Mixes
Table 8 presents the GWP coefficients adopted for this study. The pie chart, Figure 13, compares the GWP of PQGC mixes with PQC and FPQC. It is evident that the mixes PQGRS and PQGSx have very similar GWP values, each contributing around 8.3% to the total GWP. These mixes have GWP values in the range of 104.7 to 105.3 kgCO2-eq/kg, indicating minimal variation among them. In contrast, PQC and FPQC exhibit significantly higher GWP values, with FPQC at 349.1 kgCO2-eq/kg (27.5%) and PQC at 393.9 kgCO2-eq/kg (27.5%) accounting for over half of the total GWP in comparison with PQGC mixes. The substantial difference in GWP between PQGC mixes and conventional PQC and blended FPQC mixes highlights the potential for significant environmental impact reduction by choosing PQGC mixes over FPQC and PQC.
Table 8.
GWP of materials used in concrete mixes.
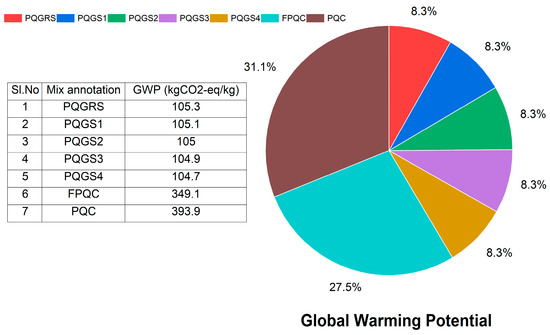
Figure 13.
Estimated GWP of PQGRS, PQGSx, FPQC and PQC mixes.
3.3.8. Effect of Reduced Thermal Conductivity (TC) and Surface Temperature on the Environment
The effect of the replacement of RSa by PSS on thermal conductivity (Radar plot) and the temperature variation (spline plot) at the top of the PQGRS and PQGSx cubes w.r.t ambient temperature is presented in Figure 14.
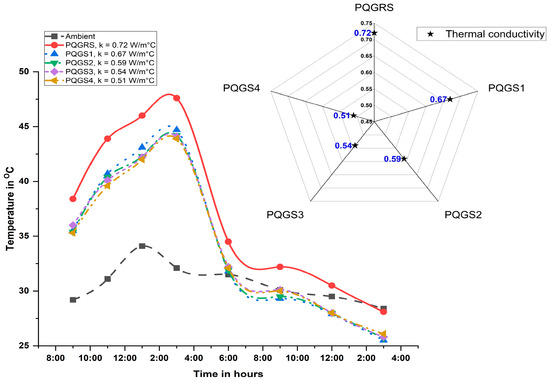
Figure 14.
Thermal conductivity and observed surface temperature.
PQGRS had the highest k value of 0.72 W/m °C among all mixes. As the replacement levels of RSa by PSS increased from 0 to 100%, the k value decreased in PQGSx mixes. The reduction in k value is due to intragranular surface pores (ISM) [9] in PSS. These ISM, when partially filled with geopolymer paste, would also contain entrapped air, which effectively reduces the thermal conductivity of PQGSx mixes due to the air’s thermally low conductivity. Consequently, the k value decreases as PSS content in PQGSx mixes increases. Additionally, GPC, by virtue, is a low -thermal -conductive material because of the presence of fly ash and GGBS, which are known for their low thermal conductivity. Subsequently, the TC values of PQGSx were: PQGS1 k = 0.67 W/m °C, PQGS2 k = 0.59 W/m °C, PQGS3 k = 0.54 W/m °C, and PQGS4 k = 0.51 W/m °C.
The temperature variation in PQGRS and PQGSx cubes was observed to be in unison with the ambient temperature fluctuations. PQGRS exhibits the highest temperature throughout the period, peaking at approximately 48 °C around 2:00 P.M. The higher TC facilitates faster heat absorption and retention. PQGS1 also showed a similar trend, but with a slightly lower peak temperature of around 44 °C. PQGS2, PQGS3, and PQGS4 demonstrated progressively lower peak temperatures, correlating with their decreasing thermal conductivities.
From 4:00 P.M. onwards, all mixes exhibit a temperature reduction trend. PQGRS cools down more rapidly initially but maintains a relatively higher temperature throughout the night. PQGS1 and PQGS2 follow similar cooling patterns, gradually approaching the ambient temperature by early morning. PQGS3 and PQGS4 cool down more effectively, with PQGS4 achieving the lowest temperature by 4:00 P.M.
The study confirms that PPS affects the TC, which plays a crucial role in the temperature regulation of the developed PQGC. Mixing with high TC (PQGRS) leads to higher peak temperatures and slower reduction rates, indicating excellent heat retention. Mixes with lower TC, particularly PQGS4, result in lower peak temperatures and faster cooling, demonstrating efficient heat dissipation [88].
4. Conclusions
This study investigated the mechanical, ecological, cost, and thermal properties of processed slag sand (PSS) as a sustainable alternative to river sand (RSa) in Pavement Quality Geopolymer Concrete (PQGC). Five PQGC mixes were analyzed, namely PQGRS, PQGS1, PQGS2, PQGS3, and PQGS4. The findings are summarized as follows:
- The mix with 100% PSS improved the microstructure due to the maximum synthesis of fly ash and slag particles, thus refining the pore structure and producing a denser matrix. PSS also enhanced the mechanical strength properties of PQGC mixes.
- The embodied energy and CO2 emission potential of all PQGC mixes remained substantially lower than PQC and FPQC, underscoring the environmental friendliness of PQGC.
- PQGC mixes were 23% to 35% more expensive than conventional PQC and FPQC due to the high cost of alkaline liquids used in PQGC production. However, the price could be reduced by subsidizing alkaline liquids. The 100% replacement of RSa by PSS marginally reduced the cost of PQGC by 6.4%.
- The global warming potential of all PQGC mixes was similar and nearly 50% lower than that of PQC and FPQC, indicating that PQGC, particularly with PSS, contributes less to environmental warming.
- PQGRS, which contained RSa, had the highest thermal conductivity, retaining more heat throughout the day and night. In contrast, the presence of PSS in PQGC reduced its thermal conductivity, resulting in lower heat conduction and faster cooling, thus remaining relatively cooler and mitigating the heat island effect. In summary, comparing the results of PQGS4 and PQGRS, it is evident that PSS is an economical, eco-friendly, and sustainable alternative to river sand.
Author Contributions
Conceptualization, methodology, investigation and writing—G.M.G.; supervision, project administration, review and editing—K.K.S., G.N. and K.K. All authors have read and agreed to the published version of the manuscript.
Funding
This research received no external funding, and the APC was funded by the Manipal Academy of Higher Education, Manipal 576104, Karnataka, India.
Institutional Review Board Statement
Not applicable.
Informed Consent Statement
Not applicable.
Data Availability Statement
The original contributions presented in the study are included in the article, further inquiries can be directed to the corresponding author.
Acknowledgments
The authors would like to acknowledge the support extended by all M.Tech and B.Tech students who directly helped during the execution of the research work partially presented in this manuscript. The authors also extend their sincere gratitude to the institute management for facilitating our ability to carry out this research work.
Conflicts of Interest
The authors declare no conflicts of interest.
References
- Manjunatha, M.; Preethi, S.; Malingaraya; Mounika, H.; Niveditha, K.; Ravi. Life cycle assessment (LCA) of concrete prepared with sustainable cement-based materials. Mater. Today Proc. 2021, 47, 3637–3644. [Google Scholar] [CrossRef]
- Alsalman, A.; Assi, L.N.; Kareem, R.S.; Carter, K.; Ziehl, P. Energy and CO2 emission assessments of alkali-activated concrete and Ordinary Portland Cement concrete: A comparative analysis of different grades of concrete. Clean. Environ. Syst. 2021, 3, 100047. [Google Scholar] [CrossRef]
- Oyebisi, S.; Olutoge, F.; Kathirvel, P.; Oyaotuderekumor, I.; Lawanson, D.; Nwani, J.; Ede, A.; Kaze, R. Sustainability assessment of geopolymer concrete synthesized by slag and corncob ash. Case Stud. Constr. Mater. 2022, 17, e01665. [Google Scholar] [CrossRef]
- Fernando, S.; Gunasekara, C.; Law, D.W.; Nasvi, M.C.M.; Setunge, S.; Dissanayake, R. Life cycle assessment and cost analysis of fly ash–rice husk ash blended alkali-activated concrete. J. Environ. Manag. 2021, 295, 113140. [Google Scholar] [CrossRef]
- Bianco, I.; Tomos, B.A.D.; Vinai, R. Analysis of the environmental impacts of alkali-activated concrete produced with waste glass-derived silicate activator—A LCA study. J. Clean. Prod. 2021, 316, 128383. [Google Scholar] [CrossRef]
- Das, B.B.; Sudhi, A.; Pandey, D. Pozzolanic Reactivity, Hydration and Microstructure Characteristics of Blended Cementitious Composites Comprising of Ultrafine Particles. Iran. J. Sci. Technol.—Trans. Civ. Eng. 2022, 46, 4187–4204. [Google Scholar] [CrossRef]
- Kudva, L.P.; Nayak, G.; Shetty, K.K.; Sugandhini, H.K. Mechanical Properties of Fiber-Reinforced High-Volume Fly-Ash-Based Cement Composite—A Long-Term Study. Sustainability 2023, 15, 13128. [Google Scholar] [CrossRef]
- Srividya, T.; Rajkumar, P.R.K.; Sivasakthi, M.; Sujitha, A.; Jeyalakshmi, R. A state-of-the-art on development of geopolymer concrete and its field applications. Case Stud. Constr. Mater. 2022, 16, e00812. [Google Scholar] [CrossRef]
- Girish, M.G.; Shetty, K.K.; Nayak, G. Effect of Slag Sand on Mechanical Strengths and Fatigue Performance of Paving Grade Geopolymer Concrete. Int. J. Pavement Res. Technol. 2023. [Google Scholar] [CrossRef]
- Verma, M.; Dev, N.; Rahman, I.; Nigam, M.; Ahmed, M.; Mallick, J. Geopolymer Concrete: A Material for Sustainable Development in Indian Construction Industries. Crystals 2022, 12, 514. [Google Scholar] [CrossRef]
- Siyal, A.A.; Mohamed, R.M.S.R.; Shamsuddin, R.; Ridzuan, M.B. A comprehensive review of synthesis kinetics and formation mechanism of geopolymers. RSC Adv. 2024, 14, 446–462. [Google Scholar] [CrossRef]
- Gebregziabiher, B.S.; Thomas, R.; Peethamparan, S. Very early-age reaction kinetics and microstructural development in alkali-activated slag. Cem. Concr. Compos. 2015, 55, 91–102. [Google Scholar] [CrossRef]
- Wang, H.; Zhao, X.; Wang, T.; Su, L.; Zhou, B.; Lin, Y. Determination of Gel Products in Alkali-Activated Fly Ash-Based Composites Incorporating Inorganic Calcium Additives. Adv. Mater. Sci. Eng. 2022, 2022, 7476671. [Google Scholar] [CrossRef]
- Qaidi, S.; Najm, H.M.; Abed, S.M.; Ahmed, H.U.; Al Dughaishi, H.; Al Lawati, J.; Sabri, M.M.; Alkhatib, F.; Milad, A. Fly Ash-Based Geopolymer Composites: A Review of the Compressive Strength and Microstructure Analysis. Materials 2022, 15, 7098. [Google Scholar] [CrossRef]
- Kamath, M.; Prashant, S.; Ralegaonkar, R. Microstructure Properties of Popular Alkali-Activated Pastes Cured in Ambient Temperature. Buildings 2023, 13, 858. [Google Scholar] [CrossRef]
- Garcia-Lodeiro, I.; Palomo, A.; Fernández-Jiménez, A.; MacPhee, D.E. Compatibility studies between N-A-S-H and C-A-S-H gels. Study in the ternary diagram Na2O-CaO-Al2O3-SiO2-H2O. Cem. Concr. Res. 2011, 41, 923–931. [Google Scholar] [CrossRef]
- Frasson, B.J.; Rocha, J.C. Reaction mechanism and mechanical properties of geopolymer based on kaolinitic coal tailings. Appl. Clay Sci. 2023, 233, 106826. [Google Scholar] [CrossRef]
- Wan, Q.; Rao, F.; Song, S.; García, R.E.; Estrella, R.M.; Patiño, C.L.; Zhang, Y. Geopolymerization reaction, microstructure and simulation of metakaolin-based geopolymers at extended Si/Al ratios. Cem. Concr. Compos. 2017, 79, 45–52. [Google Scholar] [CrossRef]
- Saif, M.S.; El-Hariri, M.O.R.; Sarie-Eldin, A.I.; Tayeh, B.A.; Farag, M.F. Impact of Ca+ content and curing condition on durability performance of metakaolin-based geopolymer mortars. Case Stud. Constr. Mater. 2022, 16, e00922. [Google Scholar] [CrossRef]
- Mehta, A.; Siddique, R.; Ozbakkaloglu, T.; Shaikh, F.U.A.; Belarbi, R. Fly ash and ground granulated blast furnace slag-based alkali-activated concrete: Mechanical, transport and microstructural properties. Constr. Build. Mater. 2020, 257, 119548. [Google Scholar] [CrossRef]
- Vázquez-Rodríguez, F.; Elizondo, N.; Montes-González, M.; Gómez-Rodríguez, C.; González-Carranza, Y.; Guzmán, A.M.; Rodríguez, E.A. Microstructural and Mechanical Characteristics of Alkali-Activated Binders Composed of Milled Fly Ash and Granulated Blast Furnace Slag with µ-Limestone Addition. Materials 2023, 16, 3818. [Google Scholar] [CrossRef]
- Prasanna, K.M.; Sharath, B.P.; Choukade, H.; Shivaprasad, K.N.; Das, B.B.; Mahesh, G. Research on Setting Time, Compressive Strength and Microstructure of Fly Ash-Based Geopolymer Mixture Containing Slag. Iran. J. Sci. Technol.—Trans. Civ. Eng. 2023, 47, 1503–1517. [Google Scholar] [CrossRef]
- Yu, G.; Jia, Y. Microstructure and Mechanical Properties of Fly Ash-Based Geopolymer Cementitious Composites. Minerals 2022, 12, 853. [Google Scholar] [CrossRef]
- Mohammed, A.A.; Ahmed, H.U.; Mosavi, A. Survey of mechanical properties of geopolymer concrete: A comprehensive review and data analysis. Materials 2021, 14, 4690. [Google Scholar] [CrossRef]
- Abhishek, H.S.; Prashant, S.; Kamath, M.V.; Kumar, M. Fresh mechanical and durability properties of alkali-activated fly ash-slag concrete: A review. Innov. Infrastruct. Solut. 2021, 7, 116. [Google Scholar] [CrossRef]
- Tayeh, B.A.; Hamada, H.M.; Almeshal, I.; Bakar, B.H.A. Durability and mechanical properties of cement concrete comprising pozzolanic materials with alkali-activated binder: A comprehensive review. Case Stud. Constr. Mater. 2022, 17, e01429. [Google Scholar] [CrossRef]
- Fang, G.; Zhang, M. Multiscale micromechanical analysis of alkali-activated fly ash-slag paste. Cem. Concr. Res. 2020, 135, 106141. [Google Scholar] [CrossRef]
- Girish, M.G.; Shetty, K.K.; Nayak, G. Synthesis of Fly-ash and Slag Based Geopolymer Concrete for Rigid Pavement. Mater. Today Proc. 2022, 60, 46–54. [Google Scholar] [CrossRef]
- Junaid, M.T.; Karzad, A.S.; Leblouba, M. Investigation on the properties of ambient cured alkali activated binder concrete. Int. J. Appl. Sci. Eng. 2021, 18, 2020339. [Google Scholar] [CrossRef]
- Li, N.; Shi, C.; Zhang, Z.; Wang, H.; Liu, Y. A review on mixture design methods for geopolymer concrete. Compos. B Eng. 2019, 178, 107490. [Google Scholar] [CrossRef]
- Li, N.; Shi, C.; Zhang, Z.; Zhu, D.; Hwang, H.-J.; Zhu, Y.; Sun, T. A mixture proportioning method for the development of performance-based alkali-activated slag-based concrete. Cem. Concr. Compos. 2018, 93, 163–174. [Google Scholar] [CrossRef]
- Beskopylny, A.N.; Stel’makh, S.A.; Shcherban’, E.M.; Mailyan, L.R.; Meskhi, B.; El’shaeva, D.; Varavka, V. Developing environmentally sustainable and cost-effective geopolymer concrete with improved characteristics. Sustainability 2021, 13, 13607. [Google Scholar] [CrossRef]
- Davidovits, J. Global warming impact on the cement and aggregates industries. World Resour. Rev. 1994, 6, 263–278. [Google Scholar]
- Habert, G.; De Lacaillerie, J.B.D.; Roussel, N. An environmental evaluation of geopolymer based concrete production: Reviewing current research trends. J. Clean. Prod. 2011, 19, 1229–1238. [Google Scholar] [CrossRef]
- Witzleben, S. Minimizing the Global Warming Potential with Geopolymer-Based Insulation Material with Miscanthus Fiber. Polymers 2022, 14, 3191. [Google Scholar] [CrossRef]
- Firdous, R.; Nikravan, M.; Mancke, R.; Vöge, M.; Stephan, D. Assessment of environmental, economic and technical performance of geopolymer concrete: A case study. J. Mater. Sci. 2022, 57, 18711–18725. [Google Scholar] [CrossRef]
- Amari, S.; Darestani, M.; Millar, G.J.; Samali, B.; Strounina, E. Engineering and Life Cycle Assessment (LCA) of Sustainable Zeolite-Based Geopolymer Incorporating Blast Furnace Slag. Sustainability 2024, 16, 440. [Google Scholar] [CrossRef]
- Li, Y.; Shen, J.; Lin, H.; Li, Y. Optimization design for alkali-activated slag-fly ash geopolymer concrete based on artificial intelligence considering compressive strength, cost, and carbon emission. J. Build. Eng. 2023, 75, 106929. [Google Scholar] [CrossRef]
- Anand, J.; Sailor, D.J. Role of pavement radiative and thermal properties in reducing excess heat in cities. Sol. Energy 2022, 242, 413–423. [Google Scholar] [CrossRef]
- Al-Humairi, S.; Alias, A.; Haron, N.; Hassim, S.; Jakarni, F.M. Sustainable pavement: A review on the usage of pavement as a mitigation strategy for UHI. IOP Conf. Ser. Mater. Sci. Eng. 2021, 1075, 012010. [Google Scholar] [CrossRef]
- Vujovic, S.; Haddad, B.; Karaky, H.; Sebaibi, N.; Boutouil, M. Urban Heat Island: Causes, Consequences, and Mitigation Measures with Emphasis on Reflective and Permeable Pavements. CivilEng 2021, 2, 459–484. [Google Scholar] [CrossRef]
- Li, H.; Harvey, J.T.; Holland, T.J.; Kayhanian, M. Erratum: The use of reflective and permeable pavements as a potential practice for heat island mitigation and stormwater management. Environ. Res. Lett. 2013, 8, 049501. [Google Scholar] [CrossRef]
- Lu, Y.; Qin, Y.; Huang, C.; Pang, X. Albedo of Pervious Concrete and Its Implications for Mitigating Urban Heat Island. Sustainability 2023, 15, 8222. [Google Scholar] [CrossRef]
- Pan, F.; Pei, J.; Zhang, G.; Wen, Y.; Zhang, J.; Li, R. Building the cooling roads with high thermal conductivity pavements to relieve urban heat island effect. Constr. Build. Mater. 2022, 346, 128276. [Google Scholar] [CrossRef]
- Yang, J.; Wang, Z.H.; Kaloush, K.E.; Dylla, H. Effect of pavement thermal properties on mitigating urban heat islands: A multi-scale modeling case study in Phoenix. Build. Environ. 2016, 108, 110–121. [Google Scholar] [CrossRef]
- Fhwa. TechBrief: Geopolymer Concrete. 2004. Available online: http://www.geopolymer.org/science/introduction (accessed on 7 June 2024).
- Glasby, T.; Day, J.; Genrich, R.; Aldred, J.; Manager, E. EFC Geopolymer Concrete Aircraft Pavements at Brisbane West Wellcamp Airport. In Proceedings of the Concrete 2015 Conference, Melbourne, Australia, 30 August–2 September 2015. [Google Scholar]
- Girish, M.G.; Shetty, K.K.; Raja, A.R. Self-Consolidating Paving Grade Geopolymer Concrete. IOP Conf. Ser. Mater. Sci. Eng. 2018, 431, 092006. [Google Scholar] [CrossRef]
- Dave, N.; Sahu, V.; Misra, A.K. Development of geopolymer cement concrete for highway infrastructure applications. J. Eng. Des. Technol. 2020, 18, 1321–1333. [Google Scholar] [CrossRef]
- Palankar, N.; Shankar, A.U.R.; Mithun, B.M. Investigations on Alkali-Activated Slag/Fly Ash Concrete with steel slag coarse aggregate for pavement structures. Int. J. Pavement Eng. 2017, 18, 500–512. [Google Scholar] [CrossRef]
- Talkeri, A.; Shankar, A.U.R. Alkali activated slag-fly ash concrete incorporating precious slag as fine aggregate for rigid pavements. J. Traffic Transp. Eng. (Engl. Ed.) 2022, 9, 78–92. [Google Scholar] [CrossRef]
- Palankar, N.; Mithun, B.M.; Ravishankar, A.U. Alkali activated concrete with steel slag aggregate for concrete pavements. Int. J. Eng. Technol. 2018, 7, 818–822. [Google Scholar]
- Mithun, B.M.; Narasimhan, M.C.; Nitendra, P.; Ravishankar, A.U. Flexural Fatigue performance of Alkali Activated Slag Concrete mixes incorporating Copper Slag as Fine Aggregate. Sel. Sci. Pap.—J. Civil. Eng. 2015, 10, 7–18. [Google Scholar] [CrossRef]
- Palankar, N.; Shankar, A.U.R.; Mithun, B.M. Durability studies on eco-friendly concrete mixes incorporating steel slag as coarse aggregates. J. Clean. Prod. 2016, 129, 437–448. [Google Scholar] [CrossRef]
- Palankar, N.; Shankar, A.U.R.; Mithun, B.M. Studies on eco-friendly concrete incorporating industrial waste as aggregates. Int. J. Sustain. Built Environ. 2015, 4, 378–390. [Google Scholar] [CrossRef]
- Palankar, N.; Shankar, A.U.R.; Mithun, B.M. Air-cured Alkali activated binders for concrete pavements. Int. J. Pavement Res. Technol. 2015, 8, 289–294. [Google Scholar] [CrossRef]
- Hou, G.; Yan, Z.; Sun, J.; Naguib, H.M.; Lu, B.; Zhang, Z. Microstructure and mechanical properties of CO2-cured steel slag brick in pilot-scale. Constr. Build. Mater. 2021, 271, 121581. [Google Scholar] [CrossRef]
- Xu, Z.; Yu, L.; Lu, B.; Sun, J.; Liu, Z.; Naguib, H.M.; Hou, G. Aragonite formation induced by triethylene glycol and its enhancement to flexural strength in carbonated rankinite cement. Constr. Build. Mater. 2023, 408, 133514. [Google Scholar] [CrossRef]
- Talkeri, A.H.; Shankar, A.U.R. A study on initial setting time and the mechanical properties of AASC using the PS ball as fine aggregate. Int. J. Pavement Res. Technol. 2019, 12, 659–663. [Google Scholar] [CrossRef]
- IS:1727; Method of Test for Pozzolanic Materials. Bureau of Indian Standards: New Delhi, India, 2018.
- IS 2386; Part I. Method of Test for Aggregate for Concrete. Part I—Particle size and shape. Bureau of Indian Standards: New Delhi, India, 1963.
- IS 2386; Part III. Method of Test for Aggregate for Concrete. Part III—Specific Gravity, Density, Voids, Absorption and Bulking. Bureau of Indian Standards: New Delhi, India, 1963.
- IS 2386; Part IV. Methods of Test for Aggregates for Concrete, Part 4: Mechanical Properties. Bureau of Indian Standards: New Delhi, India, 1963.
- IRC 44; Guidelines for Cement Concrete Mix Design for Pavements. Indian Road Congress: New Delhi, India, 2017.
- IS:516; Part-1/Sec-1. Hardened Concrete—Methods of Test. Bureau of Indian Standards: New Delhi, India, 2021. Available online: www.standardsbis.in (accessed on 7 June 2024).
- IS:3346-1980; Method of the Determination of Thermal Conductivity of Thermal Insulation Materials (Two Slab Guarded Hot Plate Method). Bureau of Indian Standards: New Delhi, India, 1980. Available online: https://ia601000.us.archive.org/35/items/gov.in.is.3346.1980/is.3346.1980.pdf (accessed on 7 June 2024).
- IRC:58-2015; Guidelince for the Design of Plane Jointed Rigid Pavements for Highways, fourth rivision. Indian Road Congress: New Delhi, India, 2015.
- Venkataramu, V.; Reddy, B.V.V. Characteristics of Mortars and Masonry Using Granulated Blast Furnace Slag as Fine Aggregate. J. Mater. Civ. Eng. 2022, 34, 04022060. [Google Scholar] [CrossRef]
- Vibha, V.; Reddy, B.V.V. A Study on Properties of Concrete Made with Processed Granulated Blast Furnace Slag as Fine Aggregate. IOP Conf. Ser. Mater. Sci. Eng. 2020, 829, 012008. [Google Scholar] [CrossRef]
- Salihi, A.; Arpitha, D.; Rajasekaran, C. Suitability study of processed granulated blast furnace slag (PGBS) as fine aggregate replacement in mortar exposed to the marine environment. Mater. Today Proc. 2023, 88, 1–5. [Google Scholar] [CrossRef]
- Sudarshan, V.J.; Arpitha, D.; Kumar, Y.T.T.; Rajasekaran, C.; Puttaswamy, N. Assessment on performance of steel slag and processed granulated blast furnace slag as an alternative for fine aggregate—An assertive review. In Trends in Civil Engineering and Challenges for Sustainability; Springer Science and Business Media Deutschland GmbH: Singapore, 2021; pp. 273–282. [Google Scholar] [CrossRef]
- Arpitha, D.; Rajasekaran, C.; Kappadi, P. Study on Processed Granulated Blast Furnace Slag as a Replacement for Fine Aggregates for the Greener Global Construction. In Lecture Notes in Civil Engineering; Springer Science and Business Media Deutschland GmbH: Singapore, 2023; pp. 809–824. [Google Scholar] [CrossRef]
- Mithun, B.M.; Narasimhan, M.C. Performance of alkali activated slag concrete mixes incorporating copper slag as fine aggregate. J. Clean. Prod. 2016, 112, 837–844. [Google Scholar] [CrossRef]
- Gergely, J.; Ogunro, V.O. Compressive Strength and Embodied Energy Optimization of Fly Ash Based Geopolymer Concrete. 2009. Available online: http://www.flyash.info/ (accessed on 7 June 2024).
- Rajamane, N.P.; Nataraja, M.C.; Jeyalakshmi, R. SPECIAL ISSUE-Future Cements Pozzolanic industrial waste based geopolymer concretes with low carbon footprint. Indian Concr. J. 2014, 88, 49–68. [Google Scholar]
- Hafez, H.; Kurda, R.; Al-Ayish, N.; Garcia-Segura, T.; Cheung, W.M.; Nagaratnam, B. A whole life cycle performance-based ECOnomic and ECOlogical assessment framework (ECO2) for concrete sustainability. J. Clean. Prod. 2021, 292, 126060. [Google Scholar] [CrossRef]
- Turner, L.K.; Collins, F.G. Carbon dioxide equivalent (CO2-e) emissions: A comparison between geopolymer and OPC cement concrete. Constr. Build. Mater. 2013, 43, 125–130. [Google Scholar] [CrossRef]
- Setiawan, A.A.; Hardjasaputra, H.; Soegiarso, R. Embodied carbon dioxide of fly ash based geopolymer concrete. IOP Conf. Ser. Earth Environ. Sci. 2023, 1195, 012031. [Google Scholar] [CrossRef]
- Pratap, B.; Mondal, S.; Rao, B.H. Development of geopolymer concrete using fly ash and phosphogypsum as a pavement composite material. Mater. Today Proc. 2023, 93, 35–40. [Google Scholar] [CrossRef]
- Sandanayake, M.; Gunasekara, C.; Law, D.; Zhang, G.; Setunge, S. Greenhouse gas emissions of different fly ash based geopolymer concretes in building construction. J. Clean. Prod. 2018, 204, 399–408. [Google Scholar] [CrossRef]
- Wudil, Y.S.; Al-Fakih, A.; Al-Osta, M.A.; Gondal, M.A. Intelligent optimization for modeling carbon dioxide footprint in fly ash geopolymer concrete: A novel approach for minimizing CO2 emissions. J. Environ. Chem. Eng. 2023, 12, 111835. [Google Scholar] [CrossRef]
- Tahir, M.F.M.; Abdullah, M.M.A.B.; Rahim, S.Z.A.; Hasan, M.R.M.; Saafi, M.; Jaya, R.P.; Mohamed, R. Potential of industrial By-Products based geopolymer for rigid concrete pavement application. Constr. Build. Mater. 2022, 344, 128190. [Google Scholar] [CrossRef]
- Lima, V.M.E.; Basto, P.A.; Henrique, M.A.; Almeida, Y.M.B.; de Melo Neto, A.A. Optimizing the concentration of Na2O in alkaline activators to improve mechanical properties and reduce costs and CO2 emissions in alkali-activated mixtures. Constr. Build. Mater. 2022, 344, 128185. [Google Scholar] [CrossRef]
- Das, S.; Saha, P.; Jena, S.P.; Panda, P. Geopolymer concrete: Sustainable green concrete for reduced greenhouse gas emission—A review. Mater. Today Proc. 2022, 60, 62–71. [Google Scholar] [CrossRef]
- McLellan, B.C.; Williams, R.P.; Lay, J.; Van Riessen, A.; Corder, G.D. Costs and carbon emissions for geopolymer pastes in comparison to ordinary portland cement. J. Clean. Prod. 2011, 19, 1080–1090. [Google Scholar] [CrossRef]
- Heath, A.; Paine, K.; McManus, M. Minimising the global warming potential of clay based geopolymers. J. Clean. Prod. 2014, 78, 75–83. [Google Scholar] [CrossRef]
- Kumar, M.; Prashant, S.; Kamath, M.V. Enhancing the sustainability of high strength concrete in terms of embodied energy and carbon emission by incorporating sewage sludge and fly ash. Innov. Infrastruct. Solut. 2022, 7, 240. [Google Scholar] [CrossRef]
- Ikotun, J.O.; Aderinto, G.E.; Madirisha, M.M.; Katte, V.Y. Geopolymer Cement in Pavement Applications: Bridging Sustainability and Performance. Sustainability 2024, 16, 5417. [Google Scholar] [CrossRef]


Disclaimer/Publisher’s Note: The statements, opinions and data contained in all publications are solely those of the individual author(s) and contributor(s) and not of MDPI and/or the editor(s). MDPI and/or the editor(s) disclaim responsibility for any injury to people or property resulting from any ideas, methods, instructions or products referred to in the content. |
© 2024 by the authors. Licensee MDPI, Basel, Switzerland. This article is an open access article distributed under the terms and conditions of the Creative Commons Attribution (CC BY) license (https://creativecommons.org/licenses/by/4.0/).