Abstract
Green development has recently become the theme of global economic development. Focusing on green development, this paper uses China’s interprovincial panel data from 2003–2022 to construct a spatial Durbin model to study the impact of the allocation of financial resources between the virtual economy and the real economy on green development. The findings are as follows: (1) The “virtual and real” allocation of financial resources has a significant effect on the green development of the economy; on the whole, the increase in financial resources in the virtual economy reduces the quality of green economic development. (2) The “virtual and real” allocation of financial resources has an obvious spatial spillover effect on green economic development; the increase in financial resources flowing into the virtual economy in one province (city) reduces the proportion of financial resources flowing into the virtual economy in neighboring provinces, which is conducive to the green economic development of the neighboring provinces. (3) Due to the differences in economic structure, industrial structure, and financial development level among provinces and regions, the “virtual and real” allocation of financial resources has a significant effect on the green economic development of central, eastern, and western China.
1. Introduction
In recent years, extreme weather events such as storms, heat waves, floods, and droughts have become increasingly frequent, seriously threatening global ecosystems and posing increasing challenges to human survival and development. The latest bulletin from the Germany-based Copernicus Climate Change Service says that 2023 was the warmest year on record globally [1]. Climate change not only poses a direct threat to human health but also profoundly affects people’s way of life and production. Green development has become an inevitable choice for all countries, and developing a green economy is also an inevitable choice for achieving global sustainable development. In 2024, China began to promote comprehensive green development.
Green development is an economic growth model that focuses on the long term. Since industrial discharge is the main source of environmental pollution [2], industrial production is the main area of carbon emissions; thus, surface green development needs to solve the problems of the real sector. However, the virtual sector, which mainly includes the financial and real estate sectors, is also an important part of achieving green development. Although the financial sector does not directly create economic value and needs to realize value appreciation through the real sector, the aggregation of finance can promote the optimization and upgrading of industrial structures [3] and reduce not only the total consumption of regional resources but also the total emission of pollutants. Real estate is an important pillar of the national economy; however, cement, building materials, and other industries directly related to real estate involve high levels of energy consumption and heavy pollution. From the perspective of achieving green development, it is also necessary to balance the development of the physical sector and the virtual sector. Therefore, the purpose of this study is to analyze the impact of the allocation of financial resources between the virtual economy sector and the real economy sector on green development. The reason for choosing China as the sample is that the scale of financial resources and the degree of green development vary across different regions of China. Analyzing China as a whole and by region can provide a reference for countries with different levels of development.
The research related to this paper is divided into three aspects, namely, financial resource allocation and green development, financialization and green development, and real estate investment and green development. First, the allocation of financial resources is important for green development. Using the panel data of 30 provinces and cities in China from 1995–2016, Zongyi Hu and Yi Li built a panel threshold regression model to explore the impact of financial resource mismatch on environmental pollution, arguing that the mismatch of financial resources is not conducive to reducing pollutant emission levels; with improvements in the development level of the financial industry, the mismatch level of financial resources will decline, which will have a significant inhibitory effect on pollutant discharge [4]. Shuyang Wen and Xiliang Liu tested the relationships between three major pollutants and the allocation of financial resources with provincial panel data from China and concluded that the severe tilt of financial resources to polluting enterprises in China has a significant adverse effect on the environment [2]. Tianrui Sun and Xiangrong Zhang built a spatial panel data model based on China’s provincial panel data from 2000 to 2019 to study the impact of the mismatching of financial resources on environmental pollution levels and concluded that financial resource misallocation aggravates environmental pollution levels to a certain extent [5].
Second, there is a relationship between financialization and green development. However, research in this area is very different. According to the theory of financial repression, insufficient financialization inhibits the potential of industrial green transformation [6]. However, some scholars believe that financialization that is too fast or considered to be “shifting from real to virtual” hinders green development. Flammer showed that financialization that is too fast will lead to industry bubbles and low-quality investment; thus, enterprises tend to engage in “greenwashing” to obtain low-cost financing rather than actually investing in green technology transformation, thereby reducing the efficiency and returns of green investment [7]. Yuchao Peng suggested that financial “shifting from real to virtual” is not conducive to the investment and scale growth of the green real economy; rather, it stimulates the overall demand and consumption of energy in the economy and society [8]. On the basis of the data of A-share listed enterprises, Xiaoping Tian showed that with the improvement in the level of corporate financialization, enterprises are more likely to disclose more green information because of the motivation of “reputation management”, and the actual green governance performance is poor, which will distort corporate investment behavior and reduce the real productivity of enterprises [9]. On the basis of the above discussion, scholars are increasingly inclined toward the appropriateness of financialization and sustainable development. Using the spatial Durbin model, Wei Dou et al. took the national data of 175 countries from 2003 to 2019 as samples with which to study the impact of financial development on carbon emissions and reported that financial development has a U-shaped nonlinear effect on carbon emission intensity [10].
Finally, real estate investment and sustainable development are needed. Jianshuang Fan and Lin Zhou analyzed the change in carbon emissions in Chinese provinces on the basis of the Kaya identity and LMDI decomposition methods and reported that the carbon emission coefficient of real estate investment is the most important factor in promoting carbon emission reduction and that the change in urban real estate investment intensity has a promoting effect on carbon emissions, with the effect increasing annually [11]. In their empirical study on measuring the quality of economic growth on the basis of the “new development concept”, Hongbing Zhou et al. reported that real estate investment has a negative effect on the quality of economic growth containing “green” elements [12]. Ze Cao and Xing Liu analyzed the spatial effect of real estate investment on total factor productivity by using the spatial Durbin model and reported that both the direct and indirect effects of real estate investment on urban green total factor productivity are significantly negative at the national level; however, the direct effect of real estate investment on green total factor productivity is the greatest in eastern China and the smallest in western China, and the indirect effect is the greatest in central China and the smallest in western China [13].
In summary, existing studies have discussed the “virtual and real” allocation of financial resources and some aspects of green development and have reached a consensus on the following aspects: First, the misallocation of financial resources aggravates environmental pollution. Second, the “virtual and real” allocation of financial resources affects the green and sustainable development of the economy. Third, real estate investment has a negative effect on green development. However, several shortcomings remain. First, most relevant discussions focus on certain aspects of the environment, such as environmental pollution and carbon emissions, whereas green development refers to the coordinated and unified social development of nature, the economy, and society, which requires comprehensive consideration of environmental friendliness and economic growth. Second, the above-mentioned studies have used the scale of the virtual economy to represent the amount of financial resources occupied by the virtual economy rather than directly giving the amount of financial resources occupied by the virtual economy. Although the scale of the virtual economy is related to the amount of financial resources it occupies and can be indirectly represented, there are still some gaps between indirect and direct representations. Third, the extant research on the “virtual and real” allocation of financial resources and green development is mostly based on the enterprise level, while overall macrolevel research is relatively lacking. Moreover, the macrolevel studies that exist are mostly based on multicountry samples, which are difficult to use because they are not consistent with the actual situation of each country.
Further material is divided into several parts. Thus, in Section 2, a theoretical analysis is conducted on the relationship between the “virtual real” allocation of financial resources and green development, and research hypotheses are proposed on this basis. Section 3 presents the research design. In Section 4, the Durbin model is used to examine the impact and spatial spillover effects of the “virtual real” allocation of financial resources on green development, and the empirical results are discussed. Section 5 presents the conclusion and suggestions and discusses the limitations and further research on this topic.
2. Theoretical Analysis and Hypotheses
2.1. The Influence Mechanism of the “Virtual and Real” Allocation of Financial Resources on Green Development
The United Nations Development Program first put forward the term “green development” in 2002. Although academic circles have not formed a unified definition of the concept of green development, they have gradually reached a consensus. Huajun Liu and Qianmin Wu summarized the relevant consensus and noted that green development is a development mode that pursues the unity of economic growth and ecological environmental protection under the consideration of resource and environmental constraints [14]. Green development has two meanings, namely, the “green” meaning of the economy and the “economic” meaning of green development. Therefore, the analysis of the “virtual and real” allocation of financial resources and green development should focus on two aspects, namely, the environmental effect and the economic growth effect. If the overall economy is divided into the virtual economy and the real economy through dichotomization, due to the scarcity of resources, the limited financial resources in a certain period are allocated to either the real economy or the virtual economy.
2.1.1. The Effect of the “Virtual and Real” Allocation of Financial Resources on Economic Growth
Owing to the special attributes of financial resources and the differences in the operation modes of the two aspects, under normal circumstances, financial resources need to be allocated to the real economy through the virtual economy and then through the production or service links of the real economy to achieve value appreciation and ultimately create GDP. Thus, the relationship between the “virtual and real” allocation of financial resources and economic growth is determined by the superposition of the wealth effect, the resource transfer effect, and the investment effect. The increasing proportion of financial resources occupied by the virtual economy is an example (See Figure 1). The wealth effect refers to the increase in wealth scale caused by the increase in virtual asset prices, and the expansion of the wealth scale drives economic growth by promoting consumption [15]. The wealth effect caused by the increase in financial resources occupied by the virtual economy is positive. The resource transfer effect refers to the “crowding out” of real investment caused by an increase in virtual asset prices; the resource transfer effect caused by an increase in financial resources occupied by the virtual economy is negative. The investment effect refers to the combined effect of rising virtual asset prices driving the growth of real investment [16] and rising interest rate costs restraining real investment. If a positive investment effect and a wealth effect are superimposed more than a resource transfer effect and a negative investment effect are, then the increase in financial resources in the virtual economy will promote economic growth. If the positive investment effect and wealth effect are smaller than the resource transfer effect and negative investment effect, then an increase in the proportion of financial resources in the virtual economy will inhibit economic growth. Therefore, due to the varying degrees of changes in economic and financial structures and resources, the impact of the “virtual and real” allocation of financial resources on economic growth differs. On the whole, when the virtual economy occupies financial resources at a low level, an increase in the virtual economy occupies financial resources, which has a wealth effect and a positive investment effect. When the virtual economy occupies financial resources at a high level, an increase in the virtual economy occupies financial resources, which has a resource transfer effect and a negative investment effect. The effect of the “virtual and real” allocation of financial resources on economic growth is nonlinear and has optimal appropriateness.
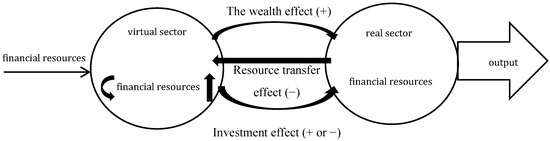
Figure 1.
The economic effect of “virtual and real” allocation of financial resources. Note: Arrows represent the direction of financial resource movement.
2.1.2. The Environmental Effect of the “Virtual and Real” Allocation of Financial Resources
Similarly, the increase in the proportion of financial resources occupied by the virtual economy is taken as an example. From the perspective of the virtual sector, an increase in the financial resources allocated to the real estate sector, that is, an increase in real estate investment, will inevitably drive the development of cement, building materials, and other industries directly related to real estate. On the one hand, the production of cement and building materials is mostly a high-pollution and high-energy consumption industry [2]. On the other hand, the development of high-pollution and high-energy consumption industries in the real sector has a “crowding out” effect on other industries, which is bound to have negative environmental effects. When the resource allocation of the financial sector is insufficient, if the financial resources allocated to the financial sector increase, then, on the one hand, the inhibition of green transformation due to insufficient financial development will improve [6], resulting in positive environmental effects; on the other hand, financial development can significantly reduce the level of industrial structure [17], and improvement in the industrial structure can effectively reduce the level of pollutant emissions [18]. The environmental effect of the “virtual and real” allocation of financial resources depends on the sum of the positive effects of the financial sector and the negative effects of the real estate sector. If the positive effect of the financial sector is greater than the negative effect of the real estate sector, then the green development effect is positive; if the positive effect of the financial sector is smaller than the negative effect of the real estate sector, then the green development effect is negative (See Table 1).

Table 1.
Analysis of the green effect of the virtual economy occupying financial resources.
2.1.3. The Green Development Effect of the “Virtual and Real” Allocation of Financial Resources
Green development is characterized mainly by the organic integration of low energy consumption, low emissions, and low pollution with economic growth, and the core goal is to improve the production efficiency of resources and the environment [19]. Green development requires both green development and development; green development should be measured by combining environmental effects and economic growth effects. Combined with the abovementioned analysis, the impact of the “virtual and real” allocation of financial resources on green development is as follows: when the economic and environmental effects caused by the “virtual and real” allocation of financial resources are positive, the inflow of financial resources increases to promote green development. When the “virtual and real” allocation of financial resources has negative economic and environmental effects, the virtual increase in financial resource inflow hinders green development. When the “virtual and real” allocation of financial resources has a positive economic effect and a negative environmental effect, the impact on green development depends on the relative size of the two effects.
During the sample period selected in this paper, the financial resources occupied by China’s virtual economy went from low to high and have gradually fallen back in recent years after a certain degree of going “from real to virtual”. Moreover, with the rapid development of real estate, the effects of real estate investment on green total factor productivity, the green progress technology rate, and green technology efficiency are significantly negative [13]. Moreover, green financial innovation began gradually after 2014, and the positive environmental effect of green financial innovation has gradually emerged in recent years. Therefore, during the entire sample period, the negative environmental effect of real estate development is inevitably greater than the positive environmental effect of green financial innovation. On the basis of the above analysis, the following research hypotheses are proposed for this research during the sample period:
Hypothesis 1.
The “virtual and real” allocation of financial resources affects green development, and the excessive flow of China’s financial resources into the virtual economy reduces the quality of green economic development.
Hypothesis 2.
The impact of the “virtual and real” allocation of financial resources on green development varies regionally according to different levels of economic development.
2.2. The Spatial Spillover Effect of the “Virtual and Real” Allocation of Financial Resources on Green Development
Because of the spatial correlation between financial activities and environmental pollution, the spatial spillover effect is inevitable when related issues are considered. For example, Juanjuan Yu and Tong Gong, Amidi and Majidi, and Wei Dou discussed and confirmed that financial development or capital flow has a spatial spillover effect on air pollution and carbon emissions [10,20,21]. Specific to the impact of the “virtual and real” allocation of financial resources on green development, first, financial resources are characterized by high liquidity, especially the flow of financial resources between neighboring regions, which is very convenient. Second, the development of the virtual sector has a “siphon effect” on attracting financial resources [22]. This “siphon effect” is reflected in the interregional area, which will cause the financial resources of the surrounding areas to gather in the region. If the purchase restriction policy is not considered, then the development of the real estate market in a region will often attract the investment of the surrounding areas in the real estate market of the city. Finally, the successful practice of green development in one region may be learned and borrowed by the surrounding region or other regions to accelerate the green development of the whole region [23]. In summary, both the “virtual and real” allocation of financial resources and green development have spillover effects, and it is particularly necessary to incorporate this spatial spillover effect into the theoretical framework that considers the impact of the “virtual and real” allocation of financial resources on green development. Therefore, Hypothesis 3 is proposed as follows:
Hypothesis 3.
The “virtual and real” allocation of financial resources has a spatial spillover effect on green development.
3. Research Design
3.1. Variable Declaration
3.1.1. Explained Variable
With reference to the calculation methods of Hao Sun et al. and the Green Development Indicator System of the National Development and Reform Commission, and four other departments, the entropy method is used to synthesize the green development index (GG) of each province [24]. The calculation steps are as follows: The first step is to select indicators that can distinguish the green development status of different regions as much as possible and to dimensionalize the indicators. This article selects three indicators to evaluate the quality of green economic development: energy consumption elasticity coefficient (energy consumption growth rate/GDP growth rate), unit output of wastewater (wastewater discharge/GDP), and unit output of exhaust gas (sulfur dioxide emissions/GDP). The second step is to determine the weights of the indicators. Based on the equal importance of the three selected indicators, this article chooses to use the equal weight method for weighting. The third step is to use the linear weighting method to calculate the index. The green development index (GG) of each province is synthesized via the entropy method. The lower the green development index is, the higher the quality of green economic development; the higher the green development index is, the lower the green development quality of the enrolled economy.
3.1.2. Explanatory Variable
This paper constructs the “virtual and real” allocation index of financial resources (k) to reflect the allocation of financial resources in the virtual economy and the real economy. The calculation method of the “virtual and real” allocation index of financial resources is shown in Equation (1).
With comprehensive reference to the practice of the accounting system of the Federal Reserve, the OECD, and MPS, considering the feasibility of the research, the financial sector and real estate sector are collectively defined as the virtual economic sector, and the sectors other than finance and real estate are collectively defined as the real economic sector. At any point in time, the total amount of financial resources available for distribution in the whole society is composed mainly of the stock of social financing scale and the financial resources occupied by the financial sector.
Among them, the financial resources occupied by the real sector are the stock of social financing scale, excluding the financial resources occupied by the real estate sector. The real estate industry uses its occupied financial resources for development investment, and the development investment of the real estate industry is roughly equal to the scale of its occupied financial resources. Therefore, the financial resources occupied by the real estate sector should be replaced by real estate development investment in fixed asset investment. In summary, the financial resources occupied by the real sector can be roughly estimated.
The financial resources occupied by the virtual sector are the sum of the financial resources occupied by the real estate sector and the financial sector. Financial resources occupied by the financial sector are included in total financial sector assets, excluding financial resources invested by the financial sector in the real sector and the real estate sector (including loans and bonds).
3.1.3. Control Variables
This paper also sets the following control variables to reduce the endogenous bias caused by missing variables: (1) Urbanization level (urban). On the one hand, urbanization affects economic growth by improving population quality and labor productivity; on the other hand, urbanization increases energy consumption, demand, and resource use, which affects environmental changes [10]. This paper uses the ratio of the urban population to the total population to measure the level of urbanization (source: https://data.stats.gov.cn/easyquery.htm?cn=E0103, accessed on 1 January 2024). (2) Industrial structure (indus). The resource demand and pollutant discharge of secondary and tertiary industries are different, and the energy demand and pollutant discharge of industrial production are significantly higher than those of service industries. In this paper, the output value ratio of secondary and tertiary industries is used to measure the industrial structure (source: https://data.stats.gov.cn/easyquery.htm?cn=E0103, accessed on 1 January 2024). (3) Scientific and technological innovation investment (rd). Scientific and technological innovation investment can not only improve productivity but also promote technological progress and economic transformation and upgrading and promoting more green and intensive production and life. In this paper, the year-to-year growth rate of research and experimental development (R&D) funds is used to represent the investment in scientific and technological innovation (Sources: https://www.stats.gov.cn/sj/tjgb/rdpcgb/, accessed on 1 January 2024).
3.2. Data Source
In this paper, the panel data of the remaining 30 provinces, municipalities, autonomous regions and municipalities in China from 2003 to 2022 are selected for analysis, after excluding Hong Kong, Macao, Taiwan and Tibet. The data are drawn from the Wind database and the statistical yearbooks of 30 provinces/municipalities/autonomous regions from 2003 to 2022, the Statistical Bulletin of National Science and Technology Funding Input, and the “China National Balance Sheet 2020” compiled by Yang Li et al. [25]. For the individual missing values of some provinces, the original data calculation method is used to estimate or supplement them via the interpolation method. The descriptive statistics of the relevant variables are shown in Table 2.
Table 2.
Descriptive statistics of variables.
In Table 2, the second and fourth indicators fluctuate significantly. The maximum value of the second indicator is for Beijing in 2016, which means that the virtual economy occupies 2.19 times more financial resources than the real economy. In 2016, the contribution rate of Beijing’s financial industry to economic growth reached 23.8%, making it the largest pillar industry. At that time, China’s shadow banking was expanding rapidly, and a large amount of financial resources flowed into the financial industry. In addition, the period from 2014 to 2017 was a period of rapid rise in housing prices in Beijing, and the real estate market also attracted a large influx of financial resources. The virtual economy occupies far more financial resources than the real economy. The minimum value of the second indicator is for Guizhou Province in 2022, which means that the financial resources occupied by the virtual economy are only 0.43 times that of the real economy. The contribution rate of Guizhou’s financial industry to economic growth in 2022 was only 5.92%, which was not an expenditure industry, and the performance of the real estate market was sluggish. The financial resources occupied by the virtual economy were far lower than those occupied by the real economy. The main reason for the difference in the fourth indicator is that different provinces in China have different key industries for development. For example, Beijing focuses on the development of the tertiary industry, while the financial industry is the primary expenditure industry. For example, Shanxi focuses on the development of the secondary industry, with coal being the primary pillar industry. So, there are significant differences in the output value ratio of the secondary and tertiary industries among provinces.
3.3. Empirical Model Design
The accumulation of financial resources in a region has an impact not only on the region but also on the surrounding area, along with the flow of resources. The presence of environmental pollution or environmental improvement in a region will also have an impact on the region itself and the surrounding area. Therefore, this paper uses the spatial econometric model in the empirical analysis. There are three types of spatial measurement models: the spatial Durbin model (SDM), the spatial error model (SEM), and the spatial lag model (SLM). Considering the existence of spatial lag effects and error effects [26], this paper uses a more general spatial Durbin model, which is set as follows:
where GG stands for green development, k stands for “virtual and real” allocation of financial resources, X stands for the control variable, rho stands for the correlation coefficient of the spatial lag factor (if greater than 0, positive spatial correlation; if less than 0, negative spatial correlation), stands for individual effects, stands for the random disturbance term, and W represents the spatial weight matrix. Considering that the spatial spillover and diffusion of environmental problems are related mainly to distance, the setting of the spatial weight matrix W is based mainly on the spatial geographical distance matrix, which is based on latitude and longitude.
4. Empirical Analysis and Their Discussion
4.1. Spatial Correlation Analysis and Rationality Test of Spatial Model
The premise of the spatial Durbin model is the existence of spatial autocorrelation. First, this paper tests the existence of spatial autocorrelation via Moran’s index. Table 3 shows the Moran index of the model residuals from 2003 to 2022. The Moran index of all years is between 0 and 1, and all values are significant at the 0.05% significance level, which passes the threshold test; this indicates the existence of spatial autocorrelation. Thus, it is reasonable to use the spatial Durbin model to fit the influence of the “virtual and real” allocation of financial resources on green development.
Table 3.
Moran’s index of model residuals.
On this basis, the research uses the LM test and Hausmann test to further test the rationality of model selection. Table 4 reports the relevant test results. The test results indicate that the LM test statistics are significant, indicating that the choice of spatial measurement model is more reasonable. The Hausman test reveals the existence of time–region dual fixed effects in the model. On the basis of the above analysis, selecting the spatial Durbin model to analyze the time–region double fixed effect is both reasonable and effective.
Table 4.
Correlation test of the applicability of spatial econometric models.
4.2. Regression Analysis Based on the Full Sample
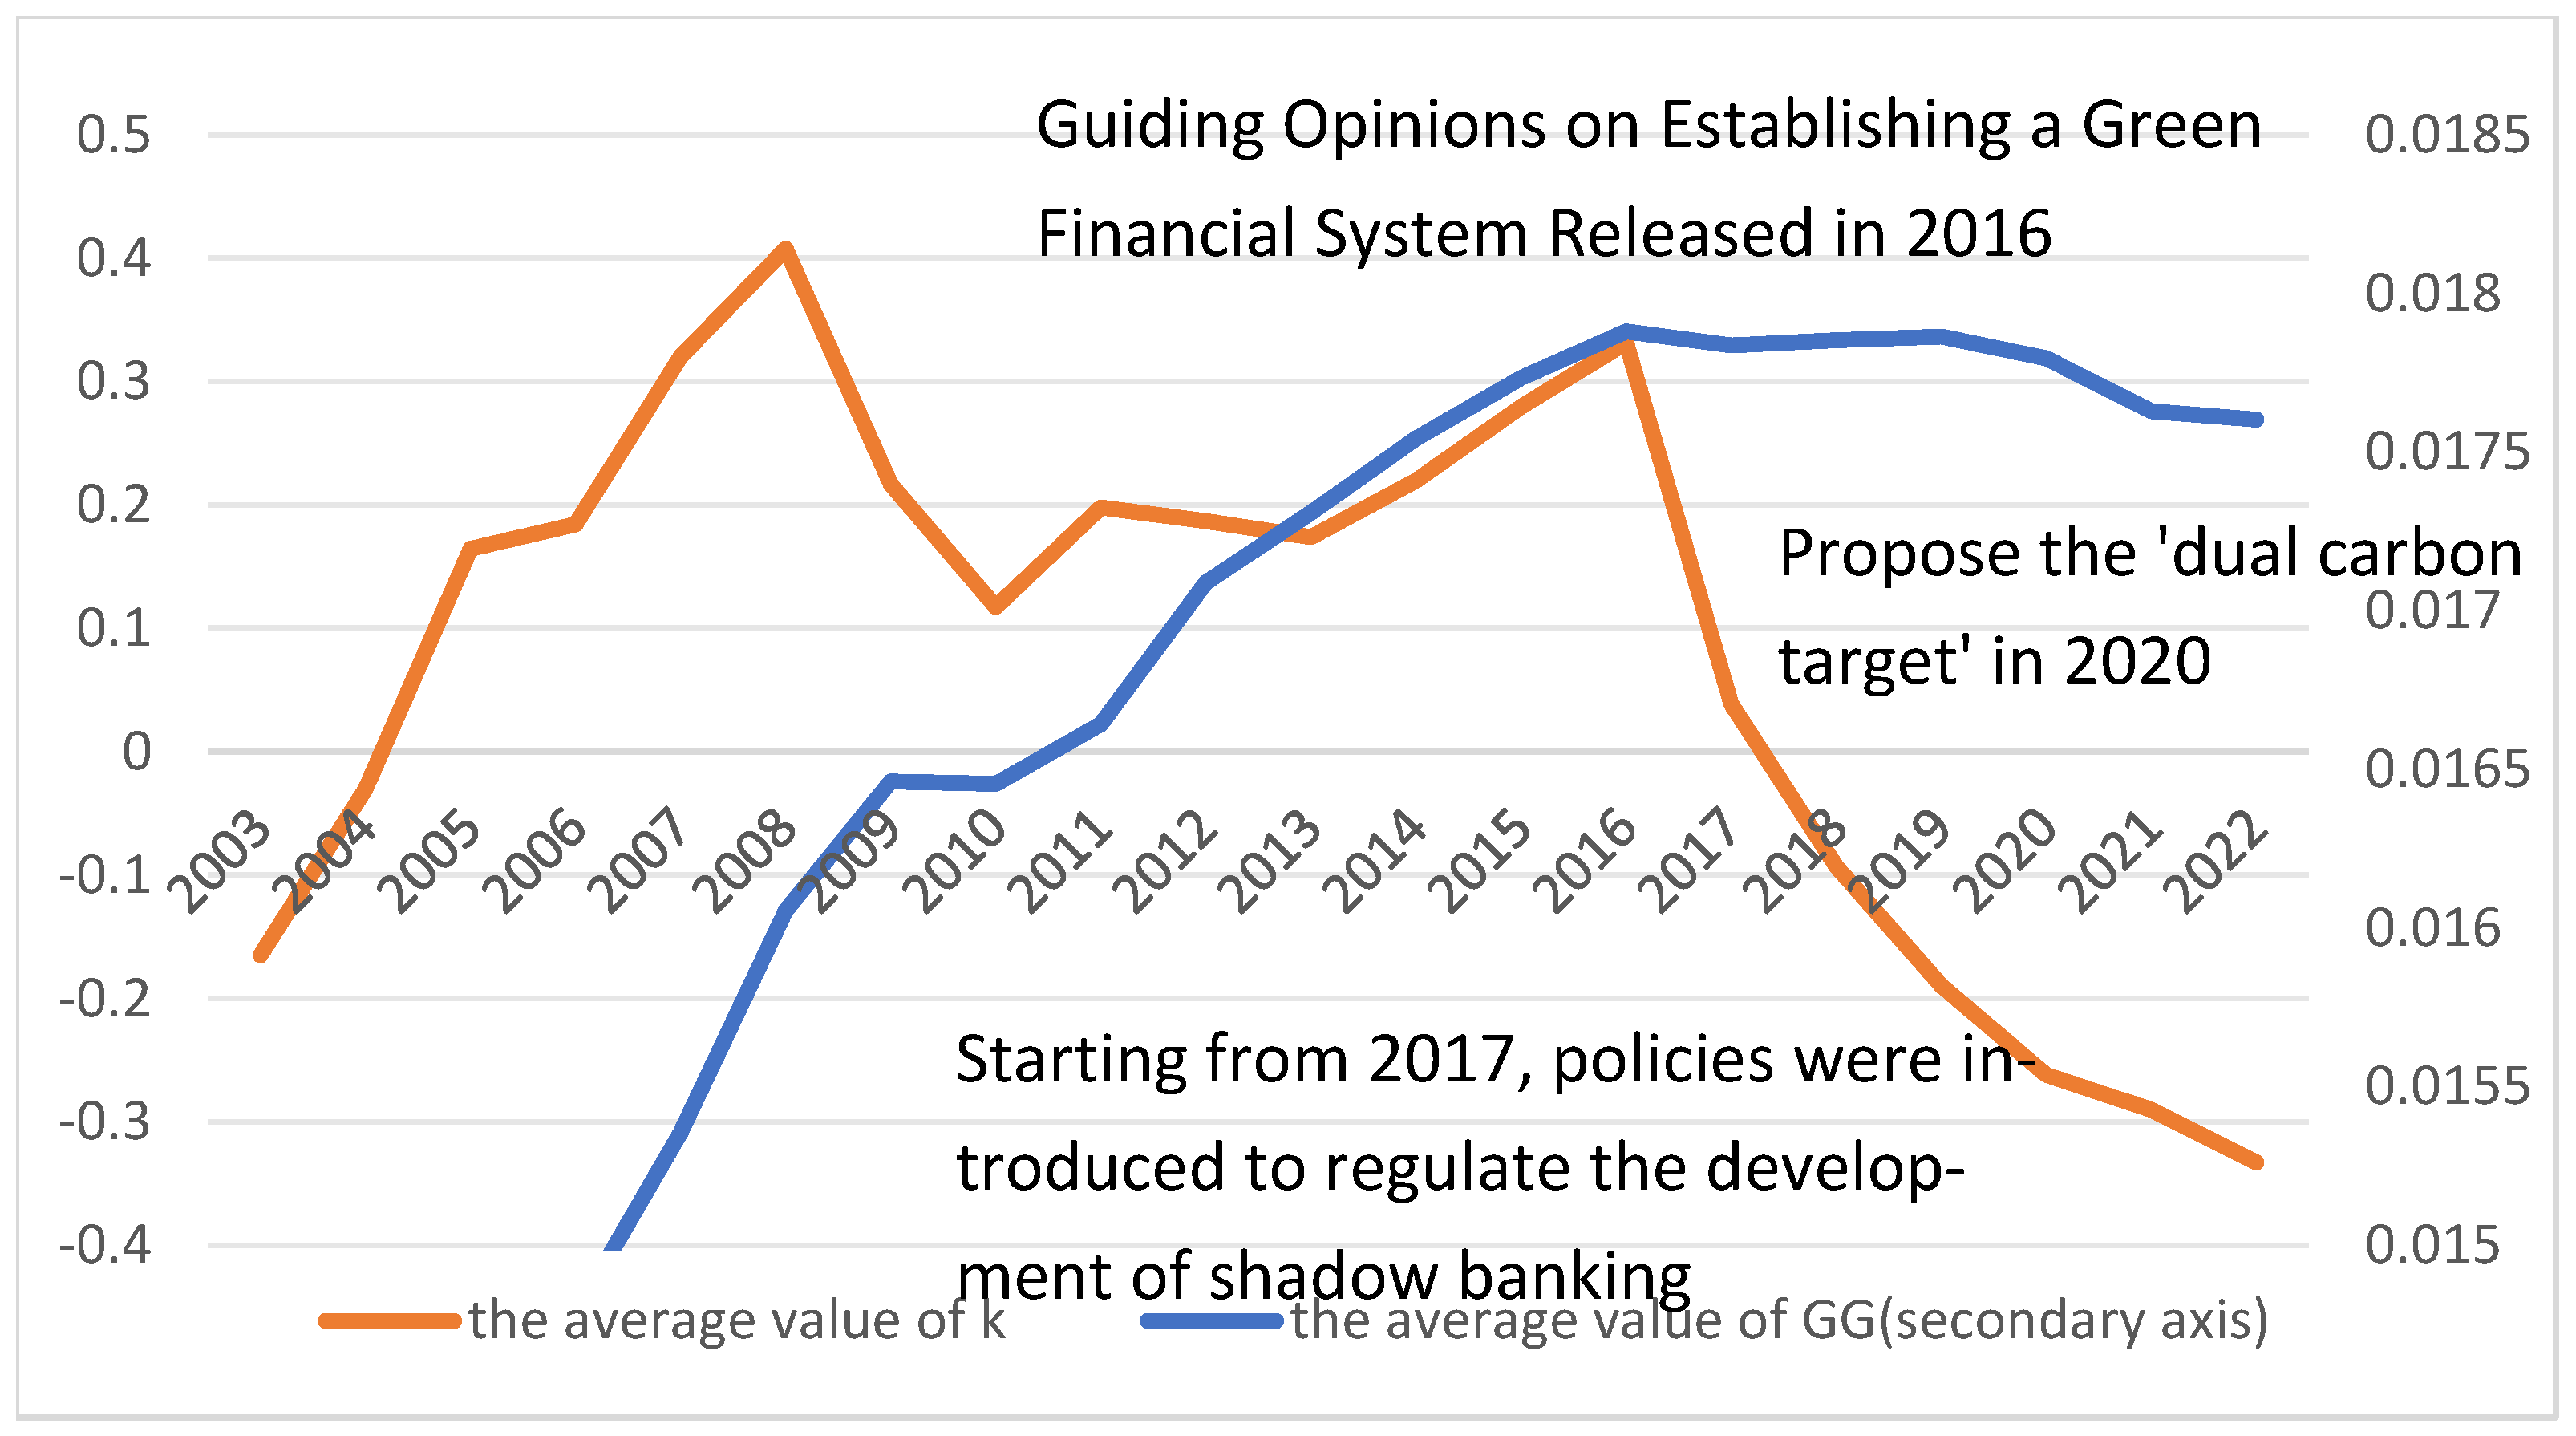
To reject hypotheses proposed in this study, the fixed effect Durbin model is used herein to estimate the parameters of the whole sample, and the regression results are reported in Table 5. The results show that the “virtual and real” allocation index coefficient of financial resources is significantly positive at the 1% level, indicating that the greater the “virtual and real” allocation index of financial resources is, the greater the green development index value is; that is, an increase in financial resources flowing into the virtual economy will reduce the quality of green economic development. Thus, Hypothesis 1 fails to be rejected. Figure 2 also shows the same trend. Before 2008, the inflow of financial resources into the virtual economy increased, and GG also grew larger, leading to an increase in energy consumption and pollution caused by economic development. Due to the impact of the financial crisis in 2008, the trend changes were somewhat affected. Starting from 2021, GG and K have started to increase synchronously again. Until 2016, with the gradual introduction of China’s green finance policies and the implementation of the “de real to virtual” policy for financial resources, the inflow of financial resources into the virtual economy decreased, the green development index decreased, and the energy consumption and pollution caused by economic development decreased.
Table 5.
Full sample return results.
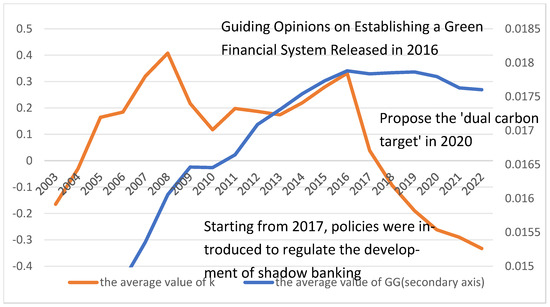
Figure 2.
The average value of k, GG, and the specific policies.
Moreover, the spatial autocorrelation coefficient rho is positive at the significance level of 5%, indicating that the green development of a province (city) and its geographical neighbors (cities) shows spatial correlation characteristics; that is, the green development of neighboring provinces (cities) is defined as a situation in which “both prosper and lose”. The spatial lag term of the “virtual and real” allocation index of financial resources is significantly negative, indicating that the economic green development index of the neighboring province (city) decreases with the increase in the “virtual and real” allocation index of financial resources of the province (city); that is, as more financial resources of a province (city) flow into the virtual economy, the improvement in the quality of economic green development of the neighboring province is promoted (city). This outcome is related mainly to the “siphon effect” of virtual sector development on financial resources. The attraction of the virtual economy to financial resources is due mainly to profit-seeking. When the inflow of financial resources into the virtual economy of a province increases, the income of the virtual economy of the province is generally higher than that of neighboring provinces; thus, the inflow of financial resources into the virtual economy of neighboring provinces, such as the typical real estate market, decreases. The quality of green economic development in neighboring provinces is thus relatively improved. In summary, Hypothesis 3 also fails to be rejected.
On the basis of the previous analysis, this study uses the partial differential method to distinguish the different sources of the influence of explanatory variables on the explained variables. The decomposition results are shown in Table 6. The coefficient of the direct effect of the “virtual and real” allocation index of financial resources is significantly positive, indicating that the excessive flow of financial resources into the virtual economy of a province reduces its quality of green economic development. The indirect effect coefficient of the “virtual and real” allocation index of financial resources is significantly positive, indicating that the excessive inflow of financial resources in a province into the virtual economy improves the quality of green economic development in neighboring provinces; this further indicates that Hypotheses 1 and 3 cannot be rejected.
Table 6.
Decomposition result of spatial spillover effect.
4.3. Robustness Test
Considering the reliability of the research results, this paper further tests the robustness of the model.
- (1)
- Eliminating the sample. As shown in columns 1, 2, and 3 of Table 7, after the samples of the first year are eliminated, the Durbin model is still used to estimate the new sample data; the estimation results are shown in Table 7. The “virtual and real” allocation index of financial resources is still significantly positive, and the spatial lag term (W × k) is significantly negative. The spatial autocorrelation coefficient roh is significantly positive, which is consistent with the estimated results of the original model, indicating that the regression model results of the impact of the “virtual and real” allocation of financial resources on green development are robust.
Table 7. Robustness test estimate results.
- (2)
- Using alternative methodology. DIF-GMM is one of the main methods used for robustness testing in similar studies. This article uses DIF-GMM for regression analysis. The regression results are shown in (2) columns 4 5 6 of Table 7, where the p-value of AR(1) is less than 1, the p-value of AR(2) is greater than 1, and the p-value of Hansen’s test is greater than 0.1, demonstrating the effectiveness of the DIF-GMM method. In addition, there was no significant difference in the regression results of DIF-GMM and SDM for the core explanatory variables. This confirms the robustness of the regression and further eliminates bias caused by potential endogeneity issues.
4.4. Regional Heterogeneity Analysis
China is a vast country, with significant differences in the degree of economic development, level of financial development, and industrial structure between the central-eastern and western regions. To verify Hypothesis 2, this paper further groups the samples by region. To consider the differences in economic structure and financial development across regions and ensure that the sample size meets the empirical requirements, the samples are further analyzed by region. The 30 provinces (municipalities) and autonomous regions included in the sample are divided into two groups, namely, the central-eastern region and the western region, and spatial regression analysis is carried out for the two groups. The regression results are shown in Table 8.
Table 8.
Results of regional regression.
The results show that the “virtual and real” allocation of financial resources has a certain effect on the impact of green development between the central-eastern region and the western region. The “virtual and real” allocation index of financial resources in the western region is significantly positive, indicating that the inflow of financial resources into the virtual economy increases, the green development index increases, and the quality of green development decreases. The “virtual and real” allocation index of financial resources in the central-eastern region is significantly negative, indicating that the inflow of financial resources into the virtual economy increases, the green development index decreases, and the quality of green development improves. There are several possible reasons for the above differences. First, with the transfer of the industrial structure in recent years, some “high-pollution and energy-consuming” industries in the eastern region have been transferred to the western region; thus, the level of green development between the eastern and western regions significantly differs. Taking the carbon emissions per unit of GDP as an example, those in the eastern region, central region and western region are approximately 100 million CNY/ton, 122 million CNY/ton and 161 million CNY/ton, respectively. The pollution that flows from the eastern region into the virtual economy, such as cement driven by the real estate sector, is credited to the western region. Second, the development level of green finance is different between the regions. In comparison, the eastern region has a more complete financial market system, better financial resources, and more active financial innovation; additionally, the financial resources flowing into the financial sector of the eastern region are better able to promote and drive the upgrading of the industrial structure, and the upgrading of the industrial structure can effectively reduce pollutant emission levels.
5. Conclusions and Suggestions
5.1. Conclusions
There are many studies that focus on the allocation of financial resources and green development; however, less attention has been given to the impact of the allocation of financial resources on the quality of economic green development in the virtual economy and real economy. Using interprovincial panel data from China from 2003 to 2022, this paper constructs a spatial Durbin model to study the impact of the “virtual and real” allocation of financial resources on green economic development. The findings are as follows: First, the “virtual and real” allocation of financial resources has a significant effect on the green development of the economy, and the excessive flow of financial resources into the virtual economy reduces the quality of the green development of the economy. Second, the “virtual and real” allocation of financial resources has an obvious spatial spillover effect on green economic development. The increase in financial resources flowing into the virtual economy in one province (city) reduces the proportion of financial resources flowing into the virtual economy in neighboring provinces, which is conducive to the green economic development of neighboring provinces. Finally, owing to the different economic structures and financial development levels in different regions, the direct and indirect effects of the “virtual and real” allocation of financial resources on the impact of economic green development are significantly different.
5.2. Suggestions
The results of the research performed present grounds for formulating the following suggestions:
First, attention should be given to the “virtual and real” allocation of financial resources, and the common development of the environmental economy should be coordinated. To explore and try a benign development model in which finance, real estate, and the real economy promote each other, financial resources should be allocated appropriately in the financial and real estate fields, and more financial resources should be guided to serve environmentally friendly and resource-saving industries on the basis of ensuring an adequate financial supply and the stable development of the real estate market. The innovation of green financial products should be promoted, financing channels for green industries should be expanded, engaging in green finance should be encouraged, and green and high-quality economic development should be promoted.
Second, inter-regional financial and green cooperation should be explored to promote overall green development in the region. Since the “virtual and real” allocation of financial resources has a spatial spillover effect on green economic development, neighboring provinces should strengthen cooperation in the fields of finance and greenness, integrate high-quality financial resources, and realize the sharing of green technologies. Through the rational allocation of financial resources in a region, the effective flow of financial resources in the region can be mobilized, and the overall green development goals can be supported.
Third, the central government designates an overall policy framework, and each region adopts differentiated measures within the policy framework based on local conditions. The empirical results show that the “virtual and real” allocation of financial resources has different effects on green development in different regions. All regions should formulate financial policies and economic green development policies on the basis of comprehensive consideration of their own economic structure and financial development level differences, and ensure that the allocation of financial resources supports the overall green development goals. For example, regions where the virtual economy occupies more financial resources should increase innovation in green financial products, while regions where the real economy occupies more financial resources should increase green technology transformation in the real economy.
5.3. Limitation and Further Research
First, the unique characteristics of China’s financial system and its rapid industrialization process could limit the applicability of these results to other regions or economies, but the methods provided in this study are universally applicable. Future research can use other economies or multiple economies as samples to apply the methods of this study.
Second, the study classifies the financial and real estate sectors of the virtual economy and the real economy but does not further classify the sectors in the real economy. Future research can classify the sectors in the real economy, such as manufacturing or agriculture.
Third, due to data availability limitations, this study did not use some variables, such as public policy initiatives, cultural attitudes toward sustainability, the share of energy from renewable sources, the amount of investment in energy-saving measures, etc. Future research can classify the sectors in the real economy, such as manufacturing or agriculture. Future research could consider incorporating these variables.
Finally, future research could investigate the long-term sustainability of the observed trends, particularly in the context of evolving global environmental challenges.
Author Contributions
L.L.: writing—original draft, software, Writing—review & editing and investigation. Y.T.: methodology, conceptualization, and data curation. X.L.: supervision. All authors commented on previous versions of the manuscript. All authors have read and agreed to the published version of the manuscript.
Funding
This research received no external funding.
Institutional Review Board Statement
Not applicable.
Informed Consent Statement
Not applicable.
Data Availability Statement
The original contributions presented in the study are included in the article. Further inquiries can be directed to the corresponding authors.
Conflicts of Interest
Author Xiaowei Luo was employed by the company Shaanxi Branch of the People’s Bank of China. The authors declare no competing interests.
References
- The Copernicus Climate Change Service Said 2023 Was the Hottest Year on Record. Available online: https://tv.cctv.com/2024/01/12/VIDEPo6rZSbhRvooFP2P0xuF240112.shtml (accessed on 12 January 2024).
- Wen, S.; Liu, X. Financial mismatch, the pollution of the environment and the sustainable growth. J. Econ. Manag. Res. 2019, 40, 3–20. [Google Scholar]
- Wurgler, J. Financial Markets and the Allocation of Capital. J. Financ. Econ. 2000, 58, 187–214. [Google Scholar] [CrossRef]
- Hu, Z.; Li, Y. Dual effects and threshold characteristics of financial development on environmental pollution. China Soft Sci. 2019, 7, 68–80. [Google Scholar]
- Sun, T.; Zhang, X. Financial resource misallocation, industrial structure and environmental pollution: A test based on local data in China. Ind. Tech. Econ. 2021, 40, 99–106. [Google Scholar]
- Wang, X.; Johansson, A. Financial repression and economic structural transformation. Econ. Res. 2013, 1, 54–67. [Google Scholar]
- Flammer, C. Corporate Green Bonds. J. Financ. Econ. 2021, 142, 499–516. [Google Scholar] [CrossRef]
- Peng, Y.; Han, X.; Li, J. Economic policy uncertainty and corporate financialization. China Ind. Econ. 2018, 1, 137–155. [Google Scholar]
- Tian, X. Corporate financialization and green development in the context of dual carbon: An evaluation of governance effects based on financial reform policies. Res. Financ. Econ. 2024, 39, 93–109. [Google Scholar]
- Dou, W.; Li, T.; Zhang, W. Financial development and carbon emission intensity: A test based on the perspective of moderate level. Res. Environ. Econ. 2023, 8, 132–155. [Google Scholar]
- Fan, J.; Zhou, L. Study on mechanism and effect of urbanization and real estate investment on carbon emission in China. Sci. Geogr. Sin. 2019, 39, 644–653. [Google Scholar]
- Zhou, H.; Fan, Z.; Wang, C.; Liu, Z. Research on the qualitative effect of China’s real estate Investment on economic growth under the new development Concept. Investig. Res. 2020, 39, 37–51. [Google Scholar]
- Cao, Z.; Liu, X. The impact of real estate investment on green total factor productivity: An empirical study based on Durbin Model. Oper. Res. Manag. 2023, 32, 220–225. [Google Scholar]
- Liu, H.; Wu, Q. China’s green Development in the New Era, China Population. Resour. Environ. 2024, 34, 102–111. [Google Scholar]
- Hu, X. The impact of virtual economy development on real economy: Growth or structural adjustment. Sci. Financ. Econ. 2015, 2, 52–62. [Google Scholar]
- Wu, C. Research on Virtual Economy and Real Economy: An Analysis based on money circulation flow model. Financ. Res. 2004, 8, 95–105. [Google Scholar]
- Liu, Y.; Zheng, Y.; Liao, G. An empirical study on the impact of financial resource allocation on industrial structure. China Soft Sci. 2016, 8, 149–158. [Google Scholar]
- Li, K.; Wang, J. Financial agglomeration, industrial structure and environmental pollution: Based on provincial spatial econometric analysis in China. Ind. Tech. Econ. 2017, 36, 3–12. [Google Scholar]
- Zhu, B.; Zhang, M. Construction and demonstration of green development evaluation index system. Stat. Decis. 2019, 35, 36–39. [Google Scholar]
- Yu, J.; Gong, T. Analysis of global carbon transfer network and its influencing factors. China Popul. Resour. Environ. 2020, 30, 21–30. [Google Scholar]
- Amidi, S.; Fagheh Majidi, A. Geographic proximity, trade and economic growth: A spatial econometrics approach. Ann. GIS 2020, 26, 49–63. [Google Scholar] [CrossRef]
- Luo, F.; Luo, N.; Hou, Z. Divergence between money supply and inflation: An explanation based on the siphon effect of virtual economy. J. Econ. 2019, 5, 57–72. [Google Scholar]
- Li, Y.; Chen, Y.; Liu, L.; Li, R.; Xia, Y. Study on the influence mechanism and spatial correlation between green finance and regional economic resilience: An empirical analysis based on spatial Durbin model. For. Econ. 2023, 45, 39–58. [Google Scholar]
- Sun, H.; Gui, H.; Yang, D. Measurement and evaluation of high-quality development of provincial economy in China. Zhejiang Soc. Sci. 2020, 8, 4–14. [Google Scholar]
- Li, Y.; Zhang, X. China’s National Balance Sheet 2020; China Social Sciences Press: Beijing, China, 2021; pp. 188–207. [Google Scholar]
- Qiang, Y.; Tang, Y.; Wang, C. Can Green Finance Reduce Urban Haze Pollution? EmpiricalEvidence Based on 283 Cities in China. Sustainability 2024, 16, 4455. [Google Scholar] [CrossRef]

Disclaimer/Publisher’s Note: The statements, opinions and data contained in all publications are solely those of the individual author(s) and contributor(s) and not of MDPI and/or the editor(s). MDPI and/or the editor(s) disclaim responsibility for any injury to people or property resulting from any ideas, methods, instructions or products referred to in the content. |
© 2024 by the authors. Licensee MDPI, Basel, Switzerland. This article is an open access article distributed under the terms and conditions of the Creative Commons Attribution (CC BY) license (https://creativecommons.org/licenses/by/4.0/).