Article

Research on the Inhibitory Effect of the EU’s Carbon Border Adjustment Mechanism on Carbon Leakage

School of Economics, Yunnan University of Finance and Economics, Kunming 650221, China
*
Author to whom correspondence should be addressed.
Sustainability 2024, 16(17), 7429; https://doi.org/10.3390/su16177429
Submission received: 4 July 2024 / Revised: 11 August 2024 / Accepted: 24 August 2024 / Published: 28 August 2024

Abstract

:
Associated with more ambitious targets for reducing emissions, the European Union (EU) plans to implement the Carbon Border Adjustment Mechanism (CBAM) fully in 2026, aiming to reduce carbon leakage and competitiveness concerns by imposing tariffs on carbon-intensive imports, which is expected to significantly impact its trade partners. Existing research has focused on CBAM’s impact on macroeconomic indicators but has insufficiently addressed its effects on global and regional carbon leakage, especially in non-EU countries like China. This research offers a detailed analysis of industry-specific leakage rates and integrates both global and regional impacts by employing the dynamic recursive GTAP-E general equilibrium model to numerically simulate CBAM’s inhibitory effect on carbon leakage under different carbon tariff scenarios, while also exploring the synergistic effects of anti-leakage policies in non-EU countries. Our simulations indicate the following: (1) CBAM effectively inhibits carbon leakage, with greater inhibition observed at higher tax rates and with the expansion of covered industries. (2) Establishing China’s domestic carbon market pricing can further reduce regional carbon leakage rates. Implementing global export carbon tax policies will significantly diminish the risk of global carbon leakage. (3) The implementation of CBAM is projected to reduce China’s total exports to the EU, though this loss will be partly offset by trade diversion effects. Carbon-intensive industries are more adversely affected in the short term, while all industries except fossil fuels face inevitable long-term negative impacts.

1. Introduction

Climate change is a global issue, and the benefits of a cleaner atmosphere represent a global public good that requires collective international action. In December 2015, the Paris Agreement was finalized during the 21st Conference of the Parties (COP21) of the United Nations Framework Convention on Climate Change (UNFCCC). At that time, 59 countries, accounting for 54% of global carbon emissions, committed to achieving net-zero carbon emissions by mid-century. The common goal is to limit the global temperature increase to no more than two degrees Celsius above pre-industrial levels. According to UNFCCC [1], as of November 2023, 168 countries, representing 195 Parties to the Paris Agreement, have submitted Nationally Determined Contributions (NDCs), covering 94.9% of total global emissions (excluding land use, land use change, and forestry) in 2019. Additionally, a report by the World Bank [2] indicates that, as of April 2023, 73 carbon pricing initiatives, including emissions trading schemes and carbon taxes, are being implemented globally.
However, the NDCs under the Paris Agreement are voluntary and not legally binding, resulting in varying levels of commitment. Many countries lack strong incentives to reduce emissions, often relying on others to make significant cuts while doing little themselves. Even if all NDCs were fully implemented, the scale and speed of emissions reductions would still fall far short of the necessary targets [3]. For many countries submitting Category 2 commitments (business as usual scenario), reducing carbon emissions may be a lower priority compared with other critical goals, such as economic growth and development. On the other hand, the fluctuating participation of major emitters, such as the United States, which withdrew from the Paris Agreement in 2020 and rejoined in 2021, can further undermine the collective effort. Countries might be less inclined to meet their targets if a major emitter withdraws, jeopardizing opportunities for economic growth. Companies producing carbon-intensive goods in countries with stringent regulations face higher production costs and lose competitiveness against companies importing from countries with lax climate policies. This situation is exacerbated by uncoordinated, unilateral climate policies that lead to carbon price differentials and limited geographic coverage due to varying levels of national development. This competitive disadvantage results in higher costs for firms and increases greenhouse gas emissions in countries with less stringent policies through carbon leakage, thereby diminishing the effectiveness of mitigation efforts. Category 2, 3 (emission intensity and peaking), and 4 (no emission reduction targets) commitments are particularly vulnerable to carbon leakage, as they might inadvertently stimulate further GDP growth through increased exports and investment, making it difficult for some countries to resist the allure of such growth.
Carbon Border Adjustment (CBA) is recognized as a policy tool to mitigate carbon leakage [4,5,6]. Introduced as part of the EU’s ‘Fit for 55’ Green Deal, the Carbon Border Adjustment Mechanism (CBAM) is the first carbon levy applied at an international border, aiming to bridge the carbon price gap between domestic and imported goods in the EU and promote carbon pricing in countries facing CBAM. As shown in Figure 1, given China’s status as one of the EU’s top three export trading partners, the imposition of a CBAM carbon levy by the EU will undoubtedly have a far-reaching impact on China’s export industry. This policy could trigger several chain reactions, including increased export costs for affected industries, a loss of competitiveness, and potential international trade frictions. Foreign trade has been pivotal in driving China’s rapid economic development, yet the energy consumption and carbon emissions associated with export production have raised significant concerns about environmental sustainability. A key challenge for China’s long-term sustainable economic development will be balancing economic growth with environmental protection. Ensuring sustained growth in export trade while effectively controlling carbon emissions is critical for achieving this balance.
This study presents several theoretical contributions and implications in the field of international climate policy and trade dynamics. First, we investigate the complex dynamics of carbon leakage under the specific provisions of CBAM, offering a more detailed analysis of its global and regional impacts. This examination is important for understanding the effectiveness of CBAM in mitigating leakage risks, an area that has received less attention in prior research. Second, we explore the economic impacts of CBAM on China and its trading partners, focusing on potential trade diversion effects and long-term industry-specific outcomes. This analysis may assist in formulating strategic policy responses to ensure that the transition to lower carbon emissions does not disproportionately affect certain sectors. Finally, by utilizing the dynamic recursive GTAP-E general equilibrium model, we conduct empirical simulations that enhance the reliability of our findings, offering a robust methodological approach that enhances the accuracy of our findings, providing insights that can support policymakers in navigating the complexities of international trade and environmental regulation.

2. Literature Review

Carbon leakage, as defined by the IPCC [7], occurs when stringent climate policies in some countries lead to increased emissions in others with less stringent or no policies. The ‘pollution haven effect’ supports this phenomenon, where industries relocate to countries with lower environmental standards to avoid higher costs led by stringent climate policies [8]. Carbon leakage could be classified into weak demand-related leakage and strong policy-related leakage, which are differentiated by distinct carbon emission accounting standards based on production and consumption [9]. The multi-region input–output (MRIO) method highlights differences in carbon flows in international trade but lacks specificity in leakage channels [10,11,12]. More scholars have used general equilibrium models (CGE) to predict strong carbon leakage rates ex ante, which is the change in emissions in non-abatement areas divided by the change in emissions in abatement areas [13]. Under the CGE framework, key carbon leakage channels can be decomposed into multiple channels, such as competitiveness, demand, and energy prices. The competitiveness channel, particularly international trade leakage, is the main source of risk, with leakage rates ranging from around 4% to 20%. The energy channel has a more volatile leakage risk, ranging from −2.1% to 42%, while the demand channel has the lowest leakage rate [14,15,16]. In addition to these three main leakage channels, technology spillover has also been identified as a mitigating factor for carbon leakage, suggesting the importance of R&D investment and technology subsidies [17,18]. Furthermore, tighter emission reduction targets and higher Armington elasticity imply greater carbon leakage, and climate policies can help reduce carbon leakage if they cover more countries and sectors [19]. The Paris Agreement currently suffers from the same significant carbon leakage effects as the Kyoto Protocol, demonstrating its fragility in its current form [20].
Research on mitigating carbon leakage has increasingly focused on Carbon Border Adjustment (CBA) as an effective policy tool. CBA aims to reduce leakage risks, particularly in competitive sectors, by imposing carbon costs on imported goods to level the playing field [21,22,23]. Implementing CBA, however, involves complex considerations, including the coverage of commodities, the scope of emissions taxed, policy mechanisms adopted, and tax calculation adjustments [24]. The CBAM was introduced as part of the EU’s broader Green Deal, aiming to align international trade with climate goals and prevent carbon leakage. CBAM is designed to hold foreign producers accountable for their carbon emissions, thereby incentivizing them to adopt cleaner production practices. CBAM calculates the carbon content of imported goods by primarily considering emissions from the primary production process. Exporters are encouraged to declare actual carbon emissions, which are prioritized over default values. If actual emissions cannot be determined, a default emission intensity is applied, adjusted with an “amplification coefficient” to account for uncertainty [25,26]. Additionally, CBAM regulations require importers to purchase certificates equivalent to the carbon emissions of their imported goods, with each certificate representing one ton of CO2. Imports valued under EUR 150 are exempt from this requirement. The cost of carbon import certificates is determined by referencing the EU Emissions Trading System (EU ETS), with prices set based on the average closing price from the previous week’s auctions. In weeks without auctions, the prior week’s average price applies. Furthermore, importers must hold at least 80% of the default number of certificates by the end of each quarter to avoid concentrated purchasing [27].
Empirical studies on CBAM have primarily focused on assessing its impact on various economies and industries. The direct purpose of CBAM is to reduce the competitiveness loss and carbon leakage caused by unilateral climate policies [28], while the indirect impact will lead to the affected countries adopting their own emission control measures [29]. Studies using computable general equilibrium (CGE) models have found that CBAM could lead to a reduction in exports from countries with less stringent environmental regulations, while potentially incentivizing these countries to adopt greener technologies [30]. Countries such as Russia, China, Turkey, and Ukraine are key trade partners for the EU concerning CBAM products, making them particularly vulnerable in both external and socio-economic contexts [31]. Region-specific analyses suggest that CBAM triggers a waterbed effect on the emissions of countries within the EU and has a limited effect on reducing the leakage rate across member states [32]. At the industry level, the implementation of EU carbon tariffs negatively impacts trade values, resulting in decreased export revenues for China as well as reduced exports from the EU itself, with the electricity sector being particularly impacted [33,34]. And CBAM may have a significant impact on export competitiveness, particularly in carbon-intensive sectors like steel and cement [35]. However, CBAM could provide some incentive for emissions reductions, but it might conflict with General Agreement on Tariffs and Trade (GATT) consistency and other international trade laws. The international community could perceive CBAM as a new trade barrier under the guise of preventing global warming [36]. It is almost impossible for the affected countries to do nothing; major countries, including China, the US, and Russia, might join forces to boycott the EU’s CBAM scheme, especially those imposing higher tariffs on imports [29]. If the EU’s import tariff rates are not set appropriately, CBAM could be seen as a unilateral trade barrier, triggering international conflict and affecting global stability. This viewpoint highlights the potential for CBAM to create tensions and resistance, particularly among developing nations and major economies that might view the policy as discriminatory or protectionist [37].
Existing literature indicates that current research on the Carbon Border Adjustment Mechanism (CBAM) primarily addresses conflicts and issues at the legal and international levels. Most quantitative studies have focused on the impact of CBAM on macroeconomic indicators such as welfare and GDP in various countries, while research on industries has focused on Emission-Intensive Trade Exposed (EITE) industries and has not been expanded. Hence, there is a notable lack of in-depth studies on the policy’s main objective: the mitigation of carbon leakage risks, particularly the integration of global and regional leakage rates. Furthermore, there is limited information on how industry-specific leakage rates will be affected. To address these gaps, this study conducted empirical simulations using the dynamic recursive GTAP-E general equilibrium model. We examined the effectiveness of CBAM in mitigating carbon leakage risks and explored the synergistic effects of anti-leakage policies in non-EU countries under five carbon tariff scenarios. Additionally, we assessed the potential negative impacts of CBAM on China and its trading partners, focusing on exports, macroeconomics, and production. We also provide an in-depth discussion of coping strategies and alternative arrangements. This article is organized as follows: Section 2 reviews the literature on carbon leakage risk and CBAM. Section 3 introduces the modeling framework, data sources, and scenario settings used for the simulation analysis. Section 4 discusses the effectiveness of CBAM by applying the methodology and presenting the analysis results. Based on these findings, the final section explores the institutional design and policy implications of CBAM.

3. Conceptual Framework

This section describes in detail the analytical framework constructed on the basis of the GTAP-E model, which fully takes into account the impact of the heterogeneity of the elasticity of substitution on the simulation results. In order to ensure the accuracy and relevance of the simulation results, this section also provides a careful classification and setup of the regional countries and industries in the GTAP 11 database. Finally, to assess the impact of different carbon tax policies and their corresponding policies, five representative simulation scenarios are set up in this paper to analyze in depth the potential impact of each policy on carbon leakage rates and trade.

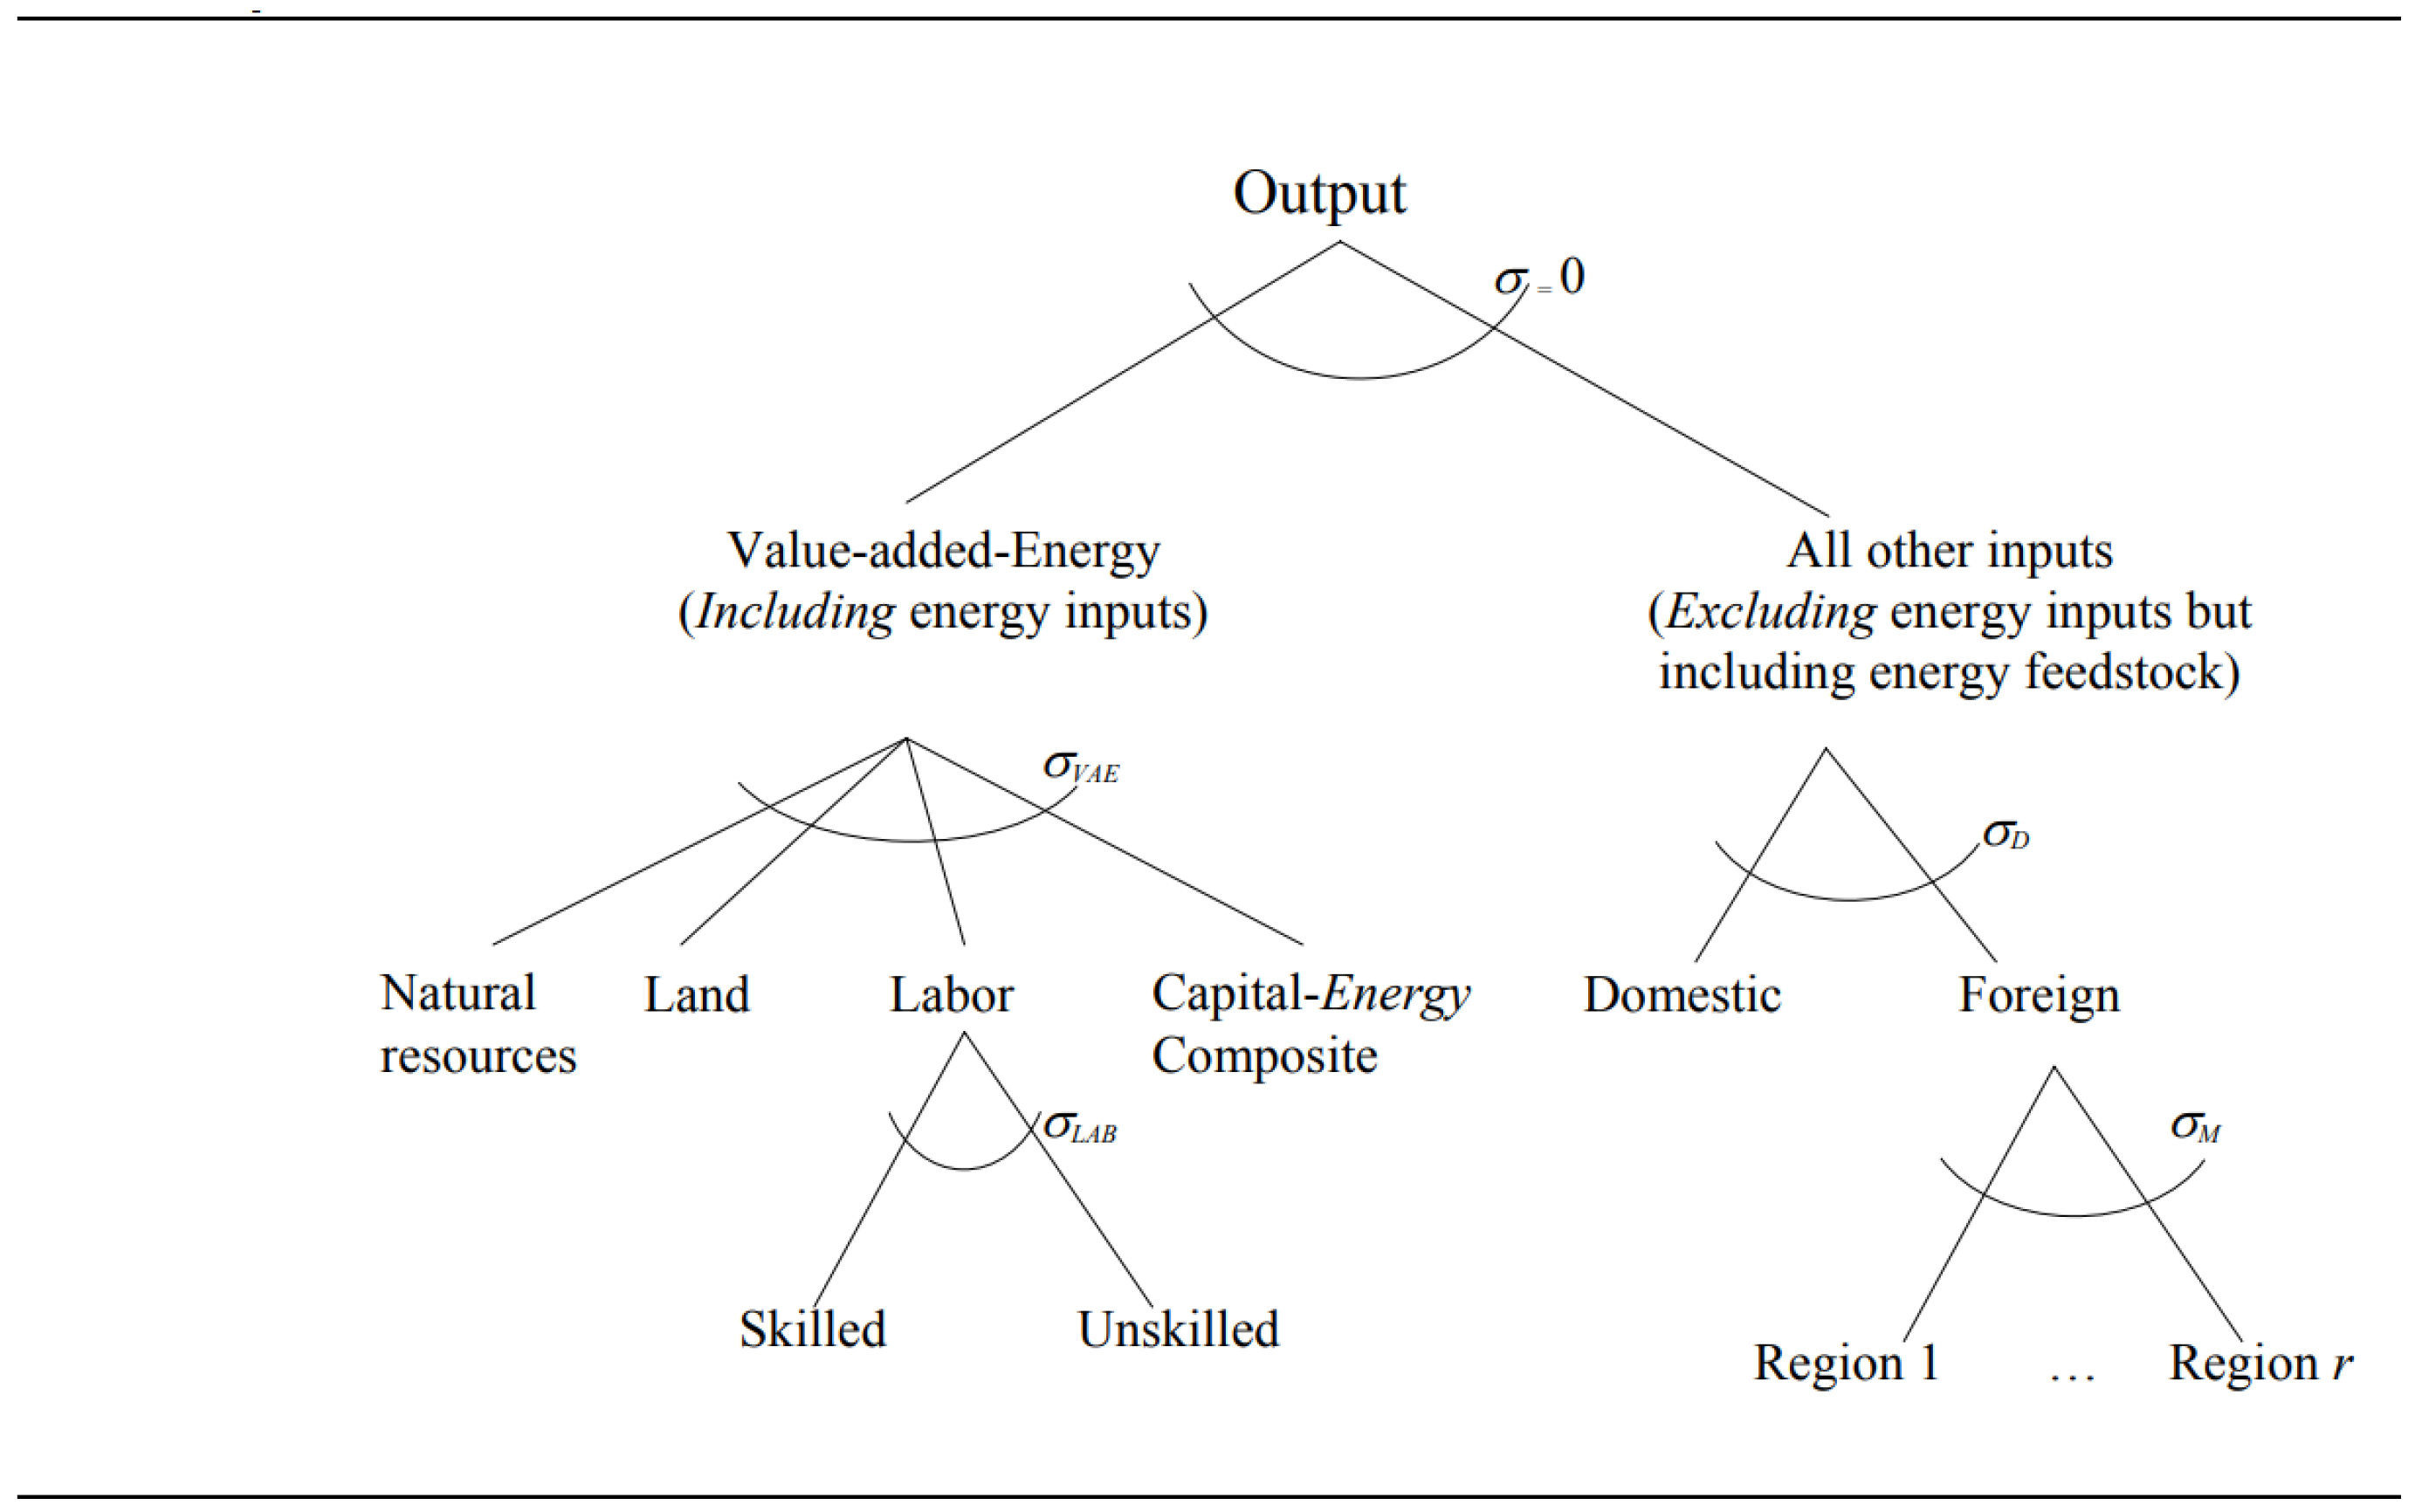
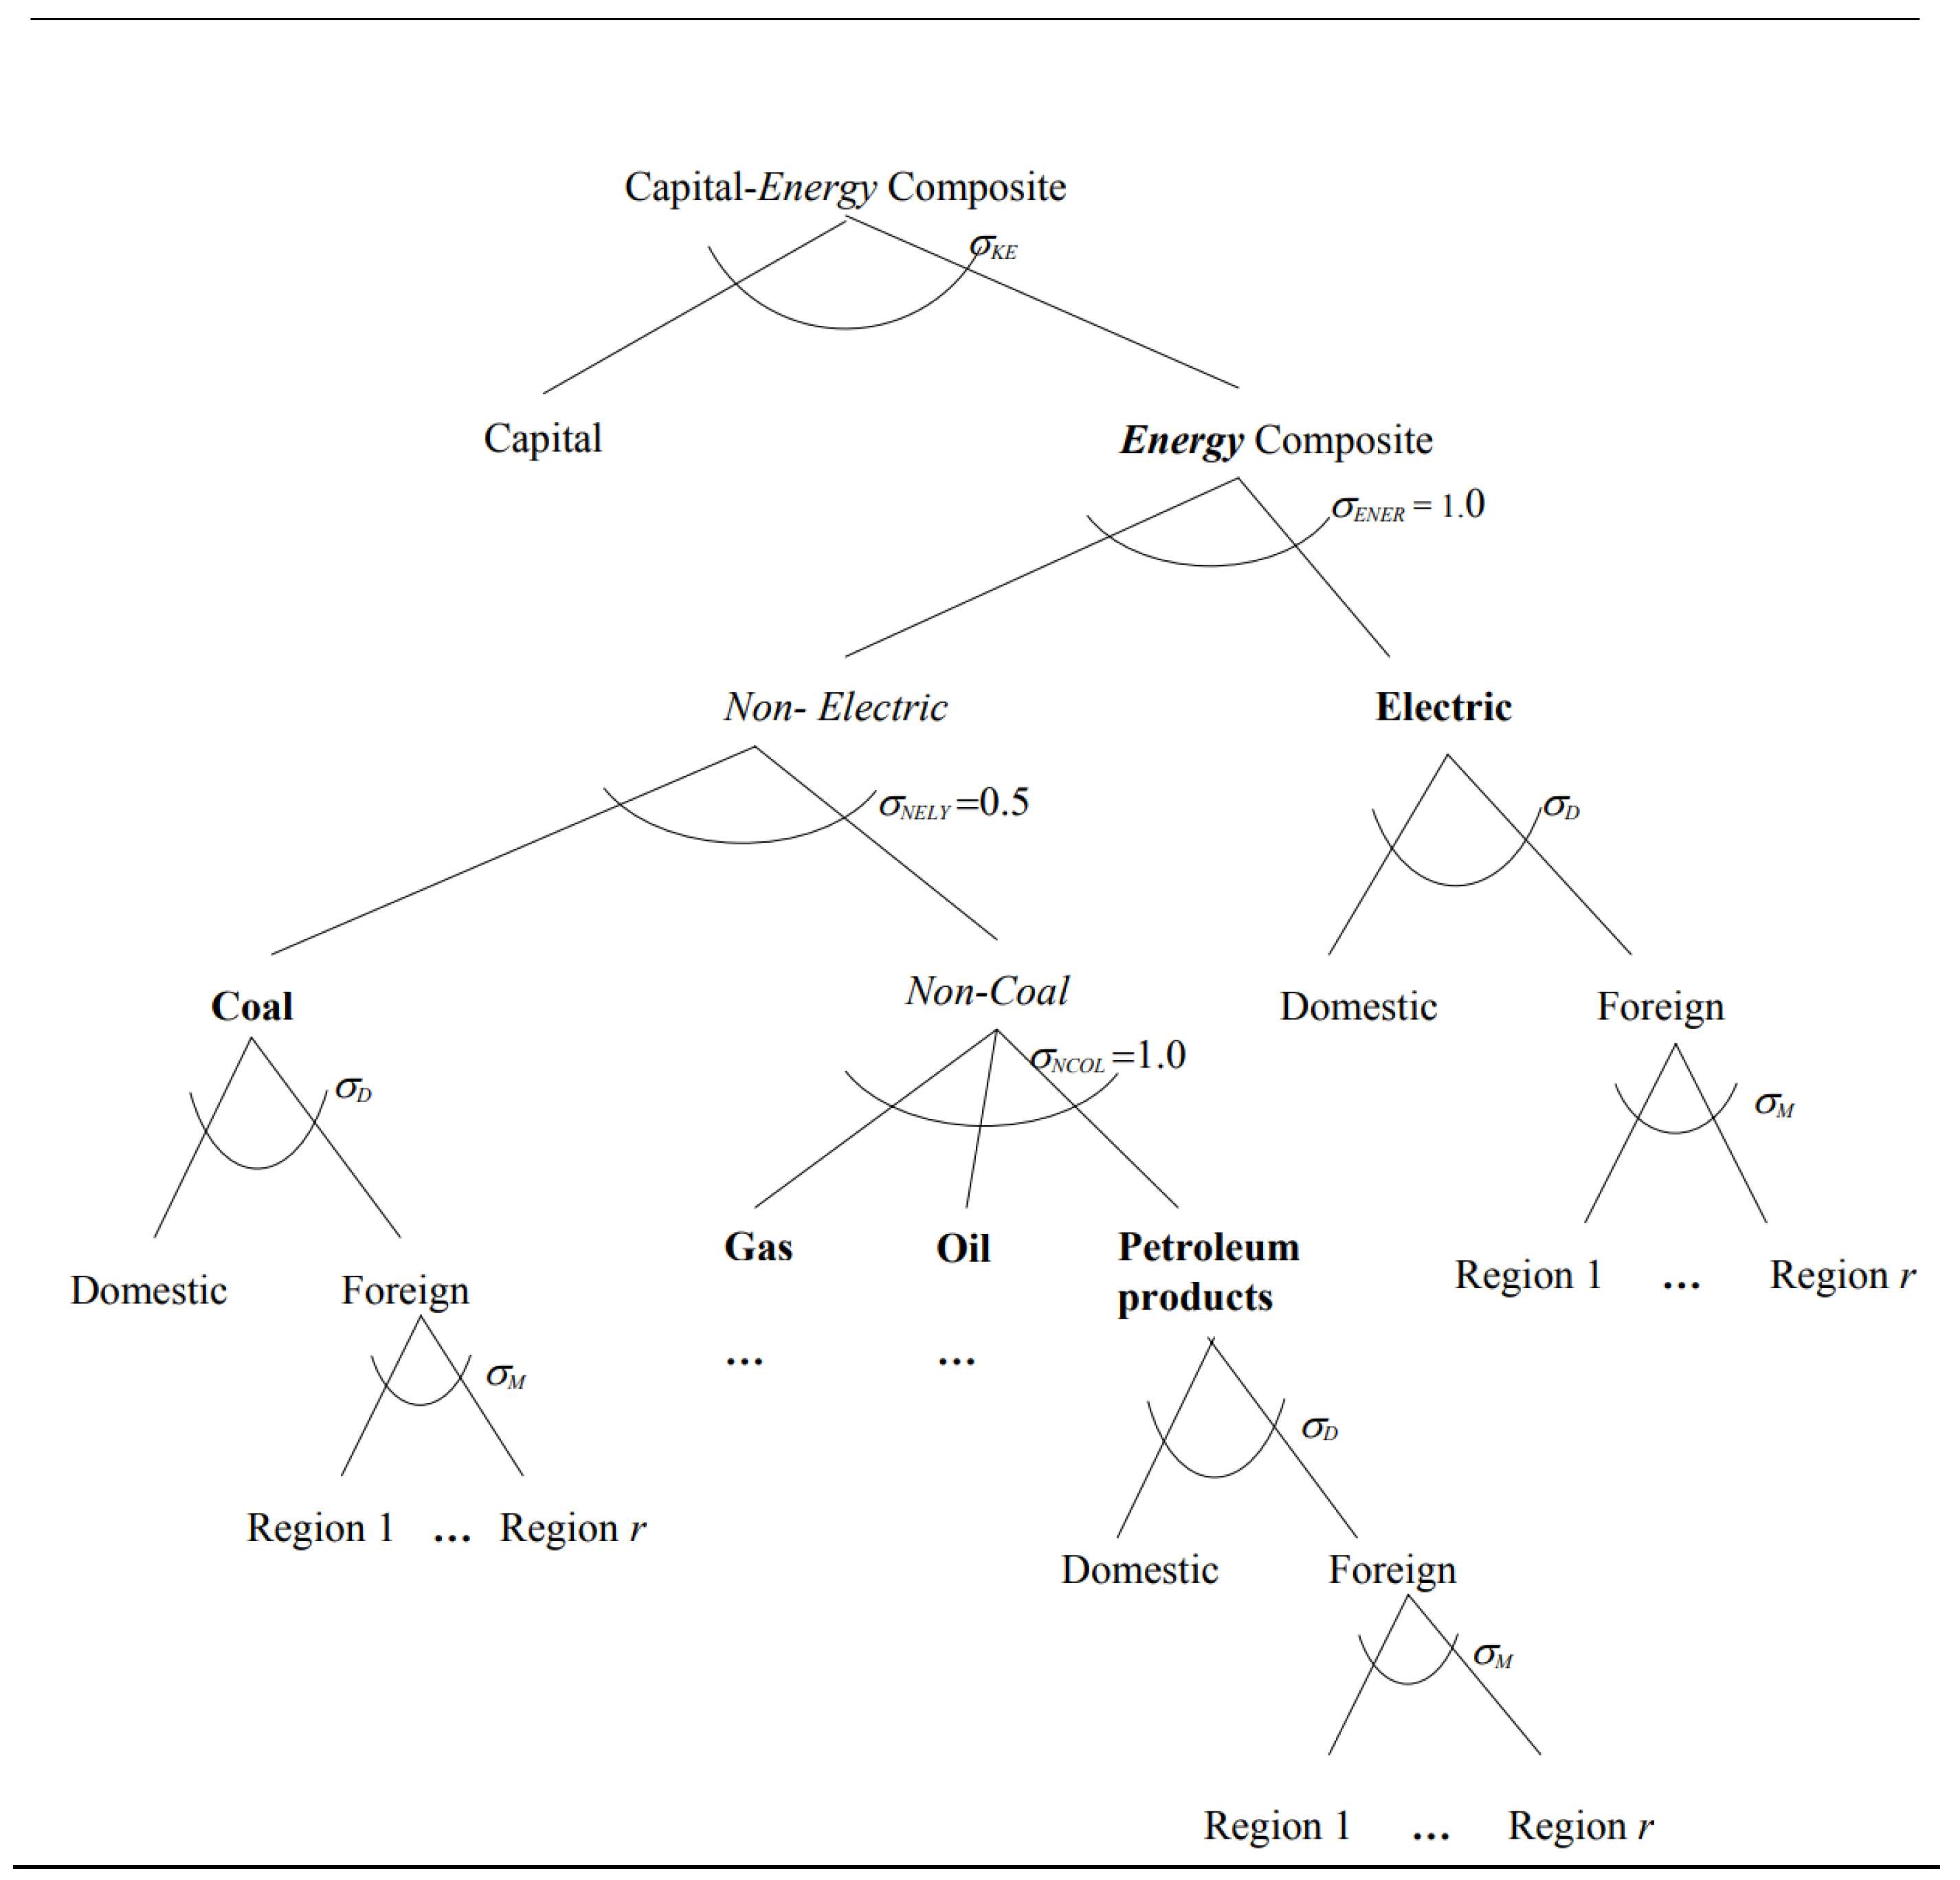
3.1. Modeling Framework

The GTAP-E model is a multi-regional, multi-sector, global comparative static Computable General Equilibrium (CGE) model specifically designed to assess the economic and trade impacts of carbon dioxide emission policies across single or multiple geographic regions worldwide. In this study, the GTAP-E model is used to construct a dynamic analytical framework that accounts for heterogeneous elasticities of substitution between fossil energy sources and between energy and non-energy sources. The model’s factors of production include capital-energy, which is a new factor of production in addition to the four basic factors: land, capital, labor (both skilled and unskilled), and natural resources. Three international markets—goods, capital, and international transport services—link the sub-models for each region throughout the model. Production requires intermediate inputs from other sectors, and there are separate sectors for the production of oil, coal, gas, and electricity, whose use is a source of carbon emissions. Capital is determined by the equilibrium of aggregate savings and returns across regions, and the main inputs other than capital are exogenous. Trade is modeled using an Armington structure, where domestic and foreign goods are considered imperfect substitutes. In the model, the production function, consumer preferences, and demand for imports are based on a nested constant elasticity of substitution (CES) function c ( p i ) = c ¯ i θ i p i p ¯ i 1 σ 1 1 σ , where c ¯ and p ¯ i are benchmark costs and prices, θ i is the benchmark cost share of input i, and σ is the elasticity of substitution between factors. Appendix A illustrates the detailed structure, which allows for a more nuanced analysis of how different sectors and regions respond to changes in carbon pricing and trade policies.
On the consumption side, GTAP’s existing structural assumptions separate private consumption from government consumption (household consumption of public goods) and private saving. According to Appendix B, government consumption expenditure on all goods is assumed to be a Cobb–Douglas function, energy and non-energy goods are separated by a nested CES structure, and private consumption utility functions are aggregated using a nested combination of constant differences of elasticities (CDEs), with a representative consumer in each region seeking to maximize welfare subject to a budget constraint (returns to factors of production). Energy and non-energy products compete in the top nested set, with different elasticities of substitution within and between the two goods. These are set in the model as σ G E N = 1 and σ G E N N E = 0.5 .
In the model, the total emissions Er of country r can be expressed as follows:
E r = j i E m i d i j r x d i j r + j i E m i i i j r x i m i j r
where Emidijr denotes the coefficient of CO2 emission per unit of domestic consumption, xdijr is the demand for domestic goods, Emiiijr is the coefficient of CO2 emission reduction per unit of imported consumption, and ximijr is the demand for imported goods, which is provided in the GTAP database for each unit of domestic and imported goods. The total emissions can be decomposed into the consumption of the three sectors in the database: firm (F), government (G), and private (P), so Er can be written as follows:
E r = j i E m i I F i j r x i f i j r + j i E m i D F i j r x d f i j r + j i E m i I G i j r x i g i j r + j i E m i D G i j r x d g i j r + j i E m i I P i j r x i p i j r + j i E m i D P i j r x d p i j r
The level of carbon intensity per unit of output in industry j can be expressed as follows:
C j r = i E m i d i j r x d i j r + i E m i i i j r x i m i j r i x d i j r + i x i m i j r
The input–output tables in the GTAP 11 database can be used to calculate the implied carbon intensity of an industry:
C j = C j r ( I A ) 1
where A is the direct consumption coefficient matrix and (IA)−1 is the Leontief inverse matrix.
When applying the CBA to imported products, the carbon intensity varies depending on the product in question, and the tariff rate is adjusted from the original rate of the product based on the different energy intensities of the products produced in each country relative to the border value of the imported product. Equation (5) represents the government’s revenue from import tariffs before the CBA, Equation (6) represents the government’s revenue from imported goods after the CBA, and Equation (7) is the calculation of the border value of imported product j from country s to country r. From equations (5) to (7), the new total import tariff rate can be obtained in Equation (8):
Y i r = s j i m p t x i s r p m c i f j s r x w j s r
C B A i r = s j b c a x r C j s x w j s r
p m c i f j s r = V C I F j s r V P M j s r
N E W i m p t x j s r = i m p t x j s r + b c a x r C j s p m c i f j s r = i m p t x j s r + b c a x r V C I F j s r C j s V P M j s r
where Yir is the import tax revenue received by the government, imptxisr is the import tax rate on goods imported from country s to country r, pmcifisr is the border value of imports of good j from country s to country r, and xwjsr is the bilateral demand for imports from country s to country r; CBAir is the revenue received by the government of country r from the implementation of CBA on imports of good j; VCIFjs is the CIF value of good j exported from country s to country r, and VPMjsr is the market value (including import duties) of good j exported from country s to country r; Cjs is the carbon intensity of good j in country s, and NEWimptxjsr is the new ad valorem import tariff of the CBA adjusted to the requirements of the GTAP model. VCIFjsr and VCIFjsr are available directly from the GTAP 11 database.
The leakage rate (LR) is calculated according to Equation (9). A leakage rate of 50% means that a reduction of 100 million tons of carbon dioxide emissions in the emission reduction areas will lead to an increase of 50 million tons of carbon dioxide emissions in the non-emission reduction areas.
L R = n o n ( E m i 1 , n o n E m i 0 , n o n ) a b a ( E m i 0 , a b a E m i 1 , a b a ) 100
where the subscripts non and aba denote non-mitigated and mitigated areas, respectively, and Emi denotes CO2 emissions in each scenario. Similarly, industry-specific carbon leakage can be calculated in the same way, i.e., emissions from a given sector in a non-mitigated region increase as emissions from the same sector in a mitigated region decrease.

3.2. Data and Aggregation

The GTAP 11 database, utilized in this study, was published in August 2023 and includes macroeconomic statistics for 141 countries or regions, covering 92% of the world’s population and 99.1% of global GDP, with 65 sectoral classifications for each country or region. The most recent year available for database analysis is 2017. Additionally, we employed the EconMap 3.1-ssp3 database from the Center for Prospective Studies and International Information (CEPII) to calculate the growth rates of various factors for selected countries or regions, updating the base year to 2030 using dynamic recursion. For our analysis, we selected two types of regional aggregations. The first aggregation classifies countries into four types based on their NDCs, reflecting different levels of emission reduction commitments corresponding to different levels of development. This classification aims to examine the main flow of carbon leakage globally, taking into account the NDC commitments in categories 1–4, i.e., the different emission reduction commitments made by countries with different levels of development. The second aggregation focuses on China and its main trading partners over the last decade, aiming to examine the impact of the Paris Agreement and CBAM on various economic indicators in China. King and van den Bergh [20] standardized the NDCs of each country and projected emission changes globally under the assumption that all conditions are met and NDCs are fully realized. The Appendix C and Appendix D detail the selected countries and regions for each type of aggregation and provide the results of the projected emission changes aggregated to 2030.
The initial phase of the Carbon Border Adjustment Mechanism (CBAM) encompasses six industries: steel, cement, aluminum, fertilizers, electricity, and hydrogen. However, the European Union (EU) has indicated plans to expand the scope of its levy both horizontally (to include more countries) and vertically (to cover additional commodities). The proliferation of sectors subject to the levy is likely, as price changes in policy-covered commodities will lead to corresponding changes in demand, impacting the sectors that produce these commodities and their input suppliers, as well as the entire supply chain, including upstream and downstream sectors. Given the potential for multi-sectoral shocks, it is crucial to assess in advance the combined impact of the policy on the development of these sectors. Such an assessment will provide a broader and deeper understanding of the potential risks and opportunities, helping to mitigate the negative impact of trade barriers. Building on the study by Tarr, Kuznetsov, Overland, and Vakulchuk [3], this paper extends the time dimension to 2030. It includes industries that may be subject to the next phase of CBAM and several key industries with the highest export volumes in China within the scope of the analysis. In the GTAP 11 database, the five energy sectors—coal, crude oil, natural gas, petroleum products, and electricity—were set up separately, and no changes were made to these sectors. The specific industry classifications are detailed in Appendix E.

3.3. Scenario Settings

This paper conducts five simulations in the model to measure the risk of carbon leakage due to the Paris Agreement and whether the EU CBAM will mitigate the risk of carbon leakage (see Table 1): Scenario 1 simulates a scenario in which NDC I countries achieve net emission reductions by 2030, while the climate policies of the remaining countries do not. Scenarios 2–5 examine whether the CBAM will have the desired effect, assuming that Scenario 1 is achieved. The tax rate for the CBAM is first considered to be the global price of carbon needed to keep global warming below two degrees Celsius, and in the actual policy, exporters are allowed a In practice, exporters can deduct the cost of carbon paid domestically, so three different tax rates of USD 35 Mt/CO2, USD 55 Mt/CO2, and USD 75 Mt/CO2 are set based on the average carbon price between the EU and the world in 2023. Scenario 2 simulates the taxation of the first CBAM target industries (mining and mineral products, chemicals and their products, metal smelting and their products, and electricity in the industry classification). As electricity is an important channel for the generation of carbon emissions, this paper assumes that China will export electricity to the EU in order to study the impact of the CBAM on China’s major trading partners, even though China does not export electricity to the EU; Scenario 3 considers the case where the scope of the policy is broadened, i.e., all industries are taxed at the appropriate rate according to their carbon intensity; Scenarios 4 and 5 simulate the effects on leakage rates of a unilateral abatement policy, where China introduces an export carbon tax (ECT) and where all countries introduce an ECT. The export carbon tax should be high enough to be considered an abatement behavior that is comparable to the CBA. Referring to the studies of Dong, Ishikawa, and Hagiwara [38], Wu, Zhou, and Qian [39], and the global report on the status of emissions trading published by the International Carbon Action Partnership (ICAP) [40], in this paper, China’s export carbon tax is set to USD 20 Mt/CO2, and all countries implement the export carbon tax set to USD 40 Mt/CO2.

4. Simulation Results and Discussion

This section measures and compares the carbon leakage rates of different regions under various carbon tax scenarios based on model simulation results. Additionally, it focuses on the potential negative impacts of the policy on China and its trading partners in key areas such as exports, macroeconomics, and production. A detailed exploration of coping strategies and alternative regimes is also provided.

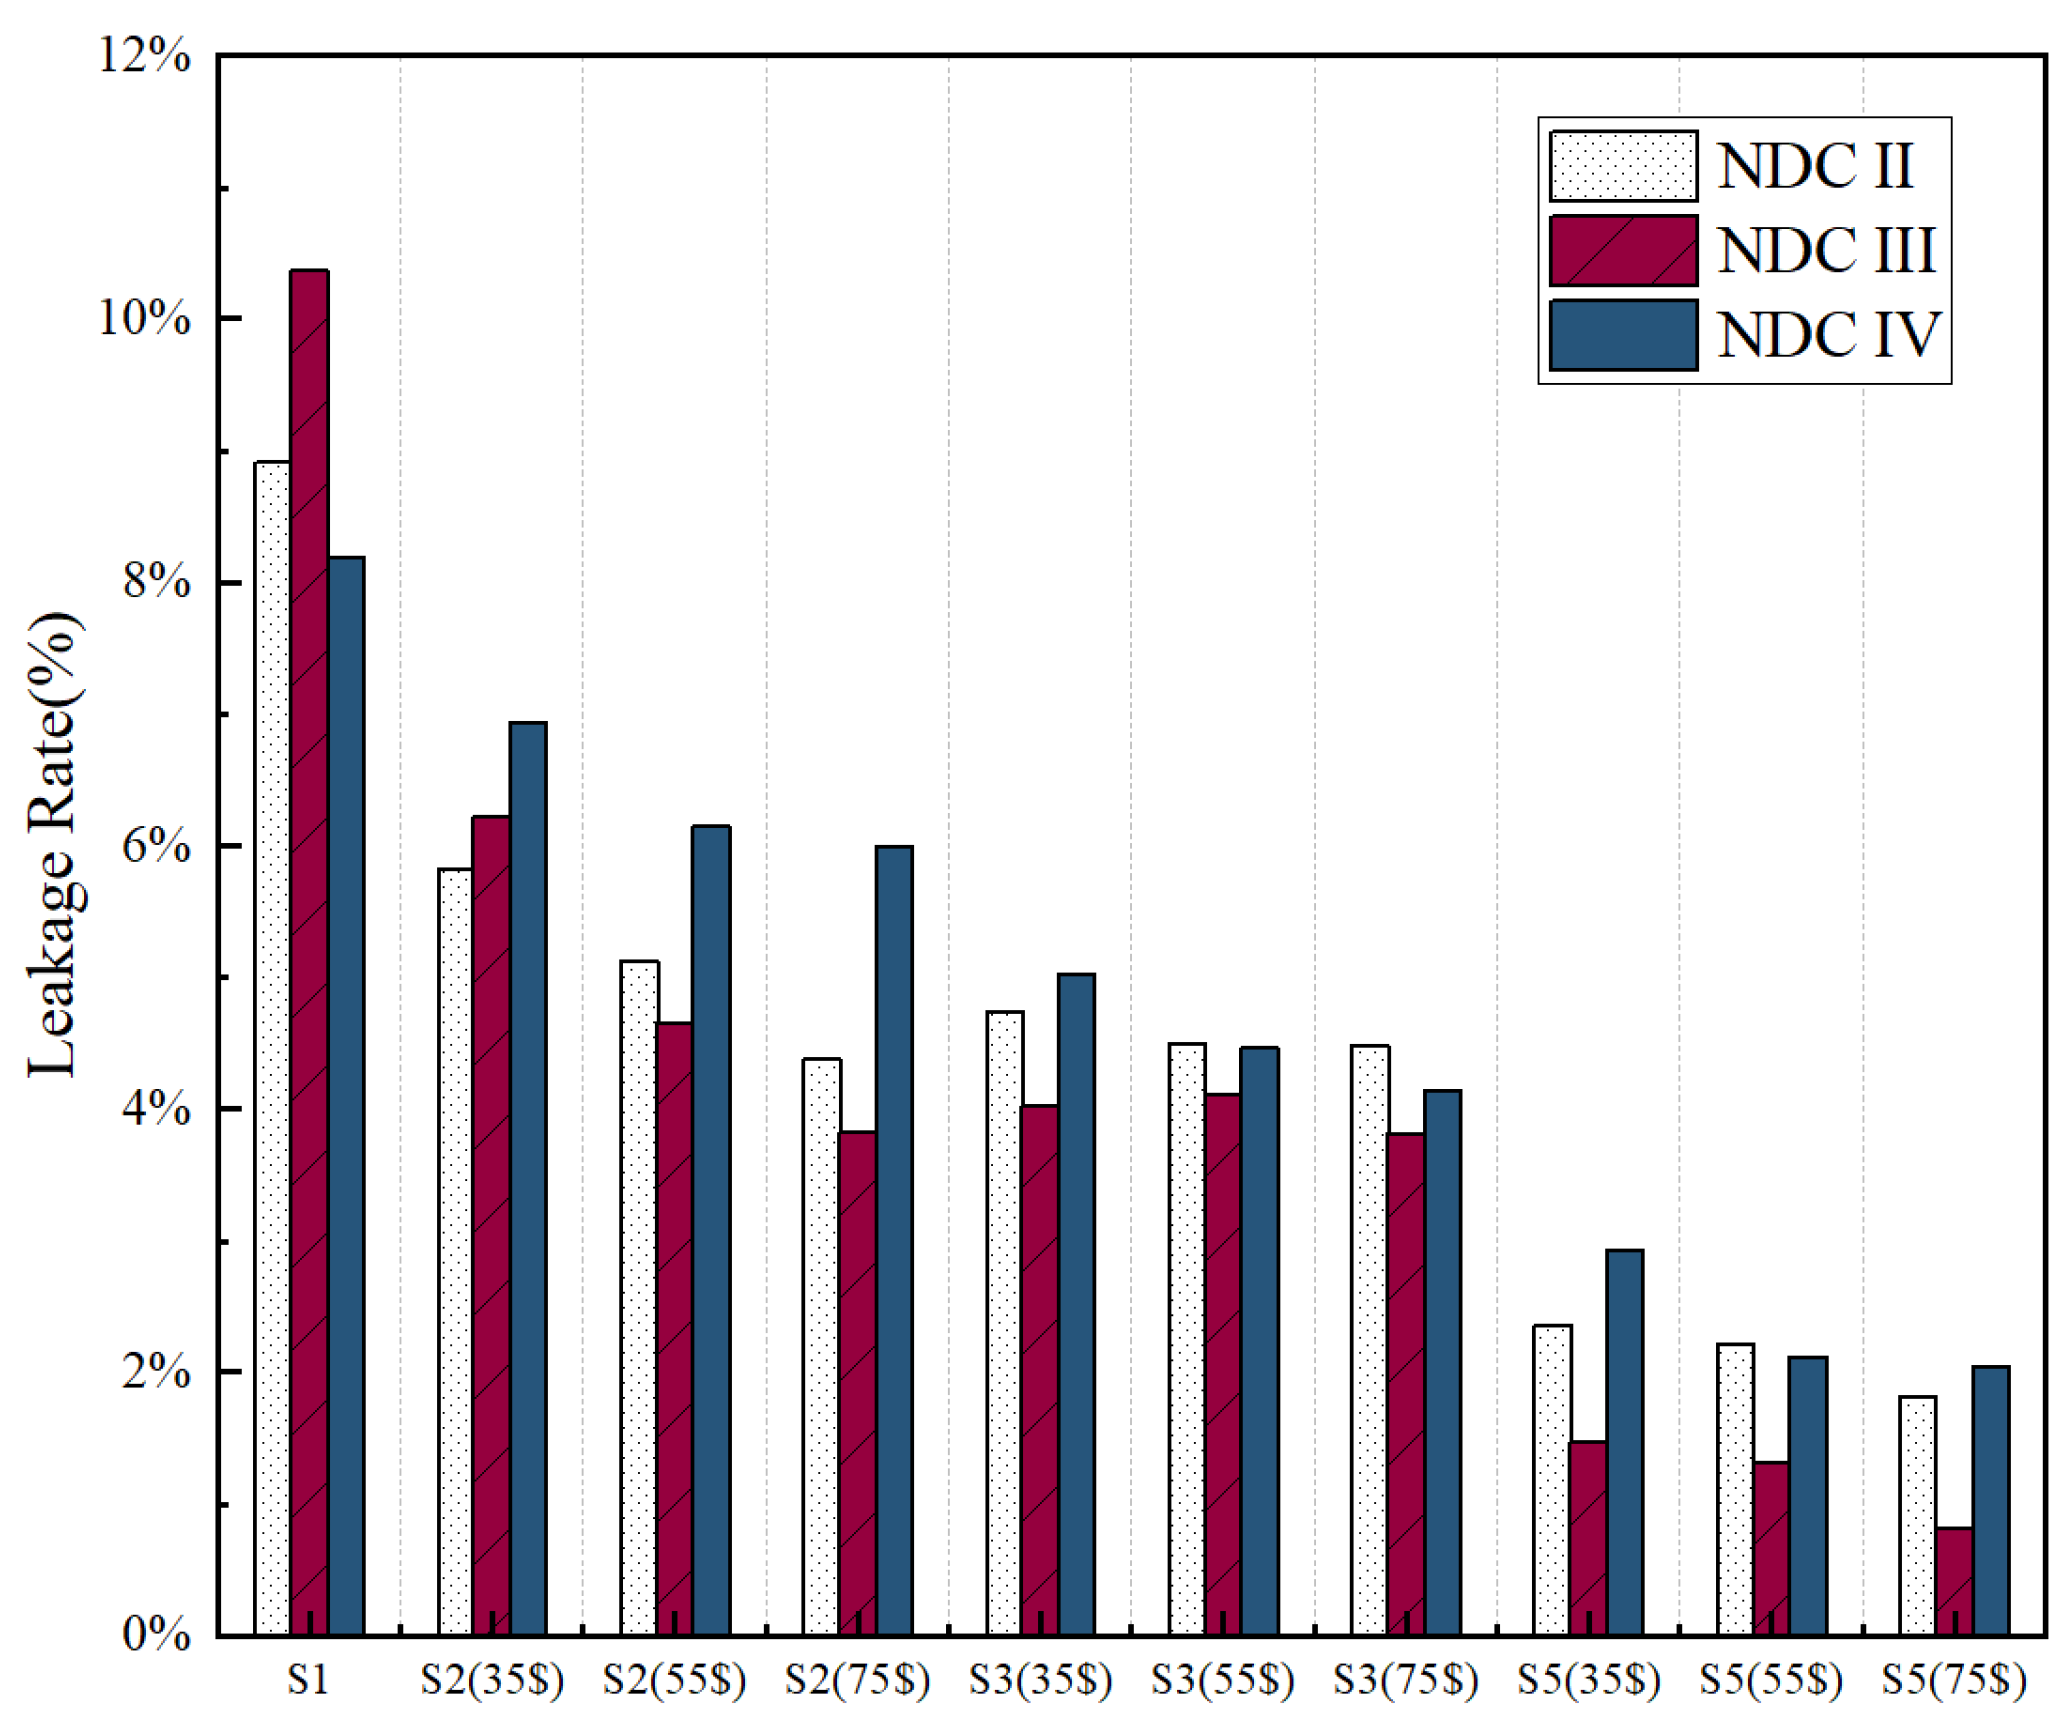
4.1. The Inhibitory Effect of CBAM on Carbon Leakage

The simulation results align with expectations, demonstrating carbon leakage across all scenarios examined, where up to 11.6% of mitigation efforts could be lost, indicating a shortfall in the effectiveness of the Paris Agreement. As depicted in Figure 2, globally, if all NDC I countries achieve their emission reduction targets under the Paris Agreement, emissions reductions in these countries could lead to increased emissions elsewhere, with leakage rates ranging from 8.19% to 10.36%. Notably, NDC III countries, including major emitters like China and India approaching or at their emission peaks by 2030, experience the highest leakage rates. Implementing CBAM based on NDC commitments could mitigate carbon leakage. For a given import tax rate, broader coverage across sectors results in lower leakage rates. For instance, with a USD 35 Mt/CO2 import tax, leakage rates decrease from 5.83% to 6.94% with broader sector coverage, and further to 4.75% to 5.01% when all industries are taxed uniformly at USD 35 Mt/CO2. Higher tax rates, such as USD 55 Mt/CO2 or USD 75 Mt/CO2, reduce leakage rates even more significantly, highlighting the tax rate’s stronger impact on leakage reduction compared with expanding industry coverage. CBAM supports the competitiveness of energy- and trade-intensive industries in emission-reducing countries, yet theoretical and simulation findings indicate that it cannot completely eliminate carbon leakage. Comparing scenarios, leakage rates show a minimal difference between taxing only energy-intensive industries (S2) and all industries (S3), consistent with sector-specific leakage rate observations. However, globally harmonized and uniformly applied export carbon taxes (S5) notably decrease carbon leakage rates.
The national-level leakage rates are illustrated in Figure 3, revealing that after achieving the emission reduction targets set by the Paris Agreement, China’s carbon leakage rate stands at 11.6%. Introducing a single-phase CBAM import tax by the EU reduces China’s leakage rate to 10.77% (USD 35 Mt/CO2), 9.29% (USD 55 Mt/CO2), and 7.97% (USD 75 Mt/CO2), respectively. Broadening the tax’s scope has a limited impact on reducing China’s leakage rate, only lowering it minimally to 6.42%. Implementing a global export carbon tax could further reduce China’s leakage rate to as low as 3.96%. Hong Kong achieves negative leakage under these conditions, while other developing countries experience reduced leakage rates under the single-phase CBAM and further reductions under the industry-wide tax. On the other hand, China’s imposition of a unilateral export carbon tax increases leakage rates for these countries. Countries like the U.S., Japan, and South Korea, committed to NDC I and part of the Emissions Reduction Coalition, achieve negative leakage rates across all scenarios, dropping as low as −7.92%. This suggests that coalition legislation effectively reduces emissions within participating countries when carbon tariffs are applied internationally. However, the U.S.’s withdrawal from the Paris Agreement underscores the vulnerability of the current mitigation framework. Simulations by King and van den Bergh [20] indicate that leakage rates could double following U.S. withdrawal, potentially weakening other countries’ commitment to NDC targets due to reduced global cooperation.
At the industry level, as depicted in Figure 4, CBAM demonstrates effectiveness in mitigating leakage rates through the competitive channel. Simulation results indicate that implementing an import tariff of USD 35 Mt/CO2 for industries covered by CBAM Phase I reduces their average leakage rate significantly, from 13.61% to 5.17%. Extending this tariff to cover all sectors in Phase I further lowers the leakage rate for the four energy-intensive industries by an additional 2.16%. Industries covered by the EU ETS, particularly those with high carbon intensity, show sensitivity to mitigation policies, with initial import tariffs decreasing their leakage rates from an average of 8.51% to 6.76% under Phase I. This figure drops further to 3.15% after implementing a sector-wide tariff. In contrast, leakage rates in low-carbon industries remain consistently lower and less affected by the policy. This is attributed to their lower energy intensity, which minimizes the impact of increased emission costs on their competitiveness compared with energy-intensive sectors.

4.2. CBAM’s Impact on China’s Trade and Output of Different Industries

Table 2 shows the percentage change in the share of China’s exports to each trading partner under the specific CBAM import tax scenario. The imposition of a USD 55 Mt/CO2 of CO2 one-stage CBAM import carbon tax is projected to reduce China’s real exports to the EU by approximately USD 4.388 billion by 2030. However, this negative impact on China’s exports to the EU would be partially offset by trade diversion effects, resulting in an increase in total exports to other trading partners of about USD 2.514 billion. Taking these factors into account, the net decrease in China’s total exports would amount to USD 1.874 billion, which represents about 0.04 percent of total exports in the simulated years. As the industries covered by CBAM expand and import tariffs rise, the negative impact of CBAM on China’s exports is expected to intensify. In the long run, the implementation of an industry-wide CBAM would lead to a more significant decline in China’s total exports, approximately twice as large as the initial impact. In a scenario where China implements an active carbon tax while the rest of the world continues with business as usual, exports to both the EU and other trading partners could decrease by about USD 121.76 billion, equivalent to 0.26 percent of total exports in the simulated year. Under a scenario where all countries implement active carbon taxes on exports, China’s exports to the EU would improve relative to the former scenario but would still experience a net negative impact.
The impact of CBAM on China’s total exports may appear relatively modest, yet detailed data from Table 3 reveals significant declines in exports of carbon-intensive products and those covered by the first phase of CBAM: chemicals and their products (14.1–32.39%), mining and mineral products (5.24–18.49%), electricity (38.05–57.33%), and metal smelting and products (11.73–33.98%). These effects stem from shifts in industrial competitiveness and changes in domestic demand. In the absence of CBAM, non-EU countries might benefit from higher EU carbon prices, increasing their exports by ramping up production of carbon-intensive goods. However, CBAM raises the cost of importing such goods into low-carbon countries, thereby enhancing the competitiveness and production of these goods domestically. This levels the playing field against imports, redirecting exports of CBAM-covered goods away from low-carbon countries to markets without carbon taxation. The power industry, closely tied to fossil fuel exports, faces direct cost impacts from CBAM on electricity imports, leading to reduced electricity exports to the EU. To balance electricity demand, the EU may increase imports and domestic production, driving up demand for fossil fuel imports from other countries and boosting coal and other energy exports. After the first phase of CBAM implementation, exports and production in various manufacturing sectors increased. Improved social welfare in the EU spurred demand for other industrial goods from China, boosting Chinese exports in these sectors to the EU. As the EU’s CBAM extends to all non-EU countries participating in the carbon market, it triggers global realignments in production factors driven by market dynamics. Some of China’s competitive industries are expected to strengthen their positions further, scaling up production and output levels. Scenario 4 shows negative exports across all sectors except energy, with the smallest decline rate among scenarios. Any proposed export-initiated carbon tax should undergo careful consideration, weighing factors such as export impacts, tariff revenues, welfare considerations, and competitiveness losses in carbon-intensive sectors.

4.3. Regional Macroeconomic Impacts

The model also evaluates the macroeconomic impact of CBAM on each region, as depicted in Figure 5. CBAM shows a relatively minor effect on the GDP of each region, primarily because affected industries in non-emission-reducing regions redirect some exports to unregulated markets in other regions. Following the implementation of carbon taxation policies, emission reductions exert a more pronounced negative impact on the GDP of countries with higher carbon intensity. By 2030, China’s GDP is projected to change by −0.02% under a USD 55 Mt/CO2 CBAM Phase I import carbon tax, while changes for other trading partners range from −0.06% to −0.02%. This figure decreases to −0.04% with an industry-wide USD 55 Mt/CO2 CBAM import carbon tax. In terms of international trade flows, Hong Kong, with its significant import volumes and highly import-dependent economy, experiences minimal negative economic impact from the carbon tax policy. Conversely, despite its relatively low carbon intensity, the United States faces a comparatively larger negative GDP impact from the carbon tax due to its less import-dependent economy, where domestically produced goods hold a substantial market share. From the perspective of abatement versus non-abatement coalitions, CBAM enhances the GDP of abatement regions while reducing that of non-abatement regions. This aligns with the average findings from twelve Armington modeling studies, as statistically estimated by Tarr, Kuznetsov, Overland, and Vakulchuk [3]. Climate policies implemented by abatement countries indirectly influence non-abatement countries through shifts in international fossil fuel markets and terms of trade.

4.4. Sensitivity Analysis

The results of a CGE model are inherently dependent on the parameters that underpin it, as the model is an imperfect representation of the global economy. Therefore, conducting sensitivity analyses around key parameters is essential to understanding how variations in these parameters influence outcomes. Previous studies by scholars such as Paltsev [41] and B. Yu, Q. Zhao, and Y.-M. Wei [12] have highlighted the importance of Armington elasticity in determining the level of carbon leakage. Armington elasticity measures the degree of substitution between domestic and foreign commodities, and the calculated leakage rate can vary significantly depending on the specific elasticity value applied. In this study, four scenarios with NDC III and China at a CBAM price of USD 55 Mt/CO2 were selected for simulation. The Armington elasticity parameter (denoted as ESBD in the model) was adjusted to 50% and 200% of the default elasticity values, respectively. As illustrated in Figure 6, the sensitivity analysis results indicate that the carbon leakage rate is highly sensitive to changes in the Armington elasticity and the elasticity of substitution. Using the 50% default elasticity parameter results in a leakage rate approximately half of the initial results, while using the 200% default elasticity parameter leads to a leakage rate about twice as high. Consequently, the final leakage rate can be expected to lie within this range.

4.5. Further Discussion of Carbon Border Adjustment

In the absence of emissions pricing policies, Carbon Border Adjustments (CBAs) can partially shift the cost of carbon pricing to trading partners through trade flows, effectively reducing carbon price differentials between mitigating and non-mitigating regions. This improves global cost-effectiveness and mitigates the efficiency loss caused by uneven carbon pricing. According to the economic theory of optimal tariffs, import tax adjustments have a strong transfer effect, causing exporting countries subject to CBAs to suffer a loss of export revenue while importing countries benefit from improvements in their terms of trade. Implicit carbon import adjustments by wealthier industrialized nations can shift part of the burden of emissions pricing to poorer developing countries, thus limiting the efficiency of emissions reductions that CBAs can achieve alone. Additionally, only a small fraction of emissions, specifically those from imports of carbon- and energy-intensive goods covered by the policy, can currently be targeted. While it may be possible to expand the covered industries in the long run, affected industries in non-emissions-reducing regions will also shift some of their exports to other, unregulated markets. This might reduce the problem of free-riding, but it will not completely eliminate it, as the damage from emissions on the consumption side will accumulate outside the country.
Regulation of CBAs presents another significant challenge. For instance, the EU CBAM requires applicants to provide detailed product carbon emissions data, which may be limited by companies within the industry and complicated by inconsistencies in data collection methods between industries, resulting in compromised data accuracy and comparability. Even within an industry, emissions intensity varies widely, further limiting its global validity. Companies must invest significant resources to establish and improve their carbon emissions data collection, accounting, and reporting systems to meet the regulatory requirements of CBAM. Additionally, many products have value chains involving multiple countries and companies, making it difficult to track the carbon footprint of products. Products involving multinational companies or supply chains need to ensure that emissions data from the entire value chain are adequately considered. From a legal perspective, Keen, Parry, and Roaf [28] argue that import charges under carbon border regulation may not be sufficient to bring many polluting countries into the carbon pricing coalition if they are to be compatible with WTO rules. Böhringer, Fischer, Rosendahl, and Rutherford [42] suggest that while this may align with the principle of carbon pricing as articulated in the UNFCCC and reaffirmed in Article 4(3) of the Paris Agreement, it may violate the principle of common but differentiated responsibilities if CBAM is seen as a country-specific constraint rather than a tool to mitigate leakage. In the context of international climate negotiations, CBAM may even lead countries to reduce their voluntary commitments under the Paris Agreement, undermining the value of CBAM as a tool to curb carbon leakage. From a WTO perspective, the motivation and design of CBAM legislation should be based on environmental considerations rather than protectionist or revenue-raising intentions. In the context of globalization, the impact of CBAM will be broader and more far-reaching. Although the policy currently covers only imports from some high-carbon sectors, it may eventually cover other imports and, in the future, the entire trading system. While the impact of CBAM on GDP and trade volume is relatively small, some high-carbon-intensity countries affected by CBAM and large non-OECD countries, such as China, India, Indonesia, and Thailand, will view CBAM as a trade protectionist and discriminatory policy measure. Such a policy could seriously undermine the international community’s efforts to combat global warming and will likely be met with strong opposition.
To meet global emissions targets, it is essential that non-emission-reducing regions also reduce emissions. Cramton [43] argues that carbon pricing, whether in the form of cap-and-trade or a carbon tax, is the most cost-effective method for reducing carbon emissions at a certain rate and scale. Carbon pricing encourages the private sector to explore a range of emission reduction options and stimulates innovation that can lead to environmental protection at the lowest cost. The EU CBAM may incentivize its trading partners to price their domestic CO2 emissions. A non-emission-reducing country faces a trade-off between the net cost of its abatement efforts and the cost of CBAM and will choose to undertake abatement if the cost of abatement (net of mitigated damages) is lower than the cost of the CBAM tax penalties. However, the modeling results of Bekkers [44] suggest that for countries not regulating carbon emissions, CBAMs have very limited potential to induce them to adopt climate change measures. Böhringer, Carbone, and Rutherford [29] find that in a Nash equilibrium, European CBAMs would induce carbon pricing only in China and Russia, while other countries would retaliate against Europe with countervailing duties. Even countries like the United States, Japan, and other Annex I countries of the convention might impose countervailing duties on the European CBAM, effectively riding on Europe’s mitigation efforts.
A proposed solution to the problem of carbon leakage in climate policy is the Climate Club, as suggested by Nordhaus [45]. Countries willing to make significant reductions in GHG emissions would form a climate club, creating a “coalition for emissions reductions” that would achieve reductions through a carbon tax, a cap-and-trade system, or a combination of these measures. Non-member countries would face a uniform import tariff surcharge on all goods imported into member countries. Unlike CBAM, the Climate Club’s proposal aligns with the requirements of the UNFCCC, but punitive tariffs would violate the WTO’s Most Favored Nation (MFN) principle. Another important way to reduce carbon leakage is through the technology spillover channel [18]. By fostering innovation and the diffusion of green technologies, countries can enhance their competitiveness while simultaneously lowering emissions. Collaborative efforts among nations can accelerate the development and dissemination of advanced clean technologies, which may help mitigate the negative effects of carbon leakage [46]. Investments in research and development, coupled with policies that incentivize technology transfer, can empower both developed and developing countries to adopt sustainable practices, further contributing to global emissions reductions. Additionally, strengthening international cooperation on climate initiatives, such as joint research programs and funding for clean energy projects, can facilitate the exchange of knowledge and resources. This collaborative approach could create a more resilient global framework for tackling carbon leakage, ensuring that countries share both the burdens and benefits of climate action.

5. Conclusions and Policy Implications

This paper employs a dynamic recursive model based on GTAP-E to explore the effectiveness of the Carbon Border Adjustment Mechanism (CBAM) in mitigating the risk of carbon leakage through empirical simulation. It also examines the impact of non-EU countries’ responses through tariff policies and evaluates the potential negative effects of this mechanism on China and its trading partners in terms of exports, macroeconomics, and production. The paper draws the following conclusions: First, CBAM has a certain inhibiting effect on carbon leakage, and this effect strengthens with an increase in the policy rate and the expansion of covered industries. The tax rate has a more significant impact on the leakage rate compared with the breadth of covered industries. Second, to further strengthen the suppression of carbon leakage and promote the construction of China’s domestic carbon market, setting an active carbon tax can reduce the regional carbon leakage rate to a lower level. If all countries adopted similar measures and established a global active carbon tax, the risk of global carbon leakage would be greatly reduced. Finally, the implementation of CBAM is expected to reduce China’s total exports to the EU. However, this loss will be partially offset by trade diversion effects. The impact of the policy on different industries varies at different stages. Carbon-intensive industries covered by the policy will be harder hit in the short term, while all industries except fossil fuels will be negatively affected in the long term. For China, if trade and economic disincentives are considered the price of the EU’s unilateral climate policy, the negative impact on the economy in the long run will be much greater than the disincentives to reduce CO2 emissions.
A globally coordinated and harmonized emission reduction policy represents the long-term strategy. In the short term, China needs to respond flexibly to the EU’s border carbon regulation policy, balancing economic growth and emission reduction. In the long term, China should adopt a global perspective, actively participating in international climate governance and promoting the development of an equitable and effective global climate governance system. The policy insights derived from this analysis are as follows: First, China should adjust its trade structure with the EU, gradually reducing the proportion of exports composed of high-carbon emission products. Simultaneously, there should be an increase in the export of low-carbon, green products, as well as high value-added manufacturing and light industry goods. Enterprises should be encouraged to actively seek market expansion and diversification, thereby mitigating excessive dependence on the EU market. This strategy aims to achieve a balance of low-carbon, environmentally friendly, and profitable development. Second, promoting a profound adjustment of the domestic industrial structure is essential. Building an industrial system with green development at its core, improving energy efficiency, and achieving the low-carbon transformation of industry and energy sectors are critical steps. This involves enhancing support for research and development in green and low-carbon technologies, fostering deep integration between industry, academia, and research institutions, and accelerating the application of technological advancements. Enterprises should be encouraged to increase investment in environmental protection R&D, enhance their capacity for independent innovation, and develop new products and technologies that meet international environmental standards. The goal is to cultivate green technology enterprises with core competitiveness and to actively participate in international green technology cooperation and exchange, collectively advancing global green development. Third, improving the construction of the national carbon trading market is also crucial. This includes expanding market coverage, diversifying trading varieties and methods, and guiding enterprises to reduce carbon emission intensity through market-based mechanisms. Encouraging active participation in the global carbon governance reform process is vital. Strengthening connections with international carbon markets and exploring cross-border carbon trading cooperation mechanisms will be essential. Additionally, improving the carbon emission reporting system and establishing robust monitoring, reporting, and verification mechanisms for carbon emission data are necessary. This ensures accurate recording of the carbon footprint throughout the entire product life cycle, forming an integrated management model system that includes carbon verification, accounting, disclosure, and trading. And finally, on the premise of adhering to the principle of “common but differentiated responsibilities,” further academic exchanges and policy discussions with the EU are essential to reaching consensus on key areas. This includes mutually recognized implicit carbon accounting and pricing mechanisms, incentives and tariff exemptions for exceeding emission reduction targets, and internationalized emission standards. Such coordination will promote policy alignment and implementation among countries, improve the global environmental governance system through unified carbon pricing, reduce carbon leakage, encourage more countries to actively engage in emission reduction measures, foster healthy competition and cooperation, and collectively advance the global climate governance agenda.
Despite the valuable insights provided by this research, certain limitations must be acknowledged. First, the study primarily relies on simulations from the GTAP-E model, a computable general equilibrium (CGE) model, which inherently focuses on predictive scenarios rather than validating real-world outcomes. Additionally, while the analysis considers industry-specific leakage rates, it may overlook the potential impacts of emerging sectors, such as renewable energy technologies or electric vehicle manufacturing, which could also experience significant effects from the Carbon Border Adjustment Mechanism (CBAM). Future research should aim to incorporate a broader range of sectors and possibly integrate additional data sources to enhance the robustness of the findings. Furthermore, exploring the potential interactions between CBAM and other international climate agreements or regional trade policies, as well as the possibility of retaliatory measures by affected countries, could provide a more comprehensive understanding of its implications. Lastly, conducting empirical studies in real-world contexts would strengthen the validity of the conclusions and better inform policymakers on effective strategies to mitigate carbon leakage.

Author Contributions

Conceptualization, T.L. and R.T.; methodology, T.L. and R.T.; formal analysis, R.T.; data curation, R.T.; writing—original draft preparation, R.T.; writing—review and editing, T.L. and R.T. All authors have read and agreed to the published version of the manuscript.

Funding

This research is supported by the National Natural Science Foundation project (71563061), a later-stage funding project of China.

Institutional Review Board Statement

Not applicable.

Informed Consent Statement

Not applicable.

Data Availability Statement

Data are contained within the article.

Conflicts of Interest

The authors declare no conflicts of interest.

Appendix A

Figure A1. Production structure of the GTAP-E model with embedded capital-energy composite factors. Source: Burniaux and Truong [47].
Sustainability 16 07429 g0a1

Appendix B

Figure A2. Consumption structure of the GTAP-E model. Source: Burniaux and Truong [47].
Sustainability 16 07429 g0a2

Appendix C

Table A1. Countries and regions aggregation.
Aggregation NameCountries and Regions in GTAP-11 Database
Aggregation I
NDC IAustralia, New Zealand, Japan, Vietnam, Canada, United States, Brazil, Venezuela, Costa Rica, Dominica, France, Germany, Italy, Netherlands, Belgium, Luxembourg, United Kingdom, Denmark, Ireland, Greece, Portugal, Spain, Austria, Sweden, Finland, Malta, Cyprus, Poland, Hungary, Czech Republic, Slovakia, Slovenia, Estonia, Latvia, Lithuania, Romania, Bulgaria, United Kingdom, Norway, Switzerland, Serbia, Belarus, Russia, Ukraine, Kazakhstan, Tajikistan, Azerbaijan, Guinea, Equatorial Guinea, Zambia, Botswana.
NDC IIKorea, Mongolia, Cambodia, Indonesia, Thailand, Afghanistan, Bangladesh, Pakistan, Mexico, Argentina, Colombia, Paraguay, Peru, Guatemala, Honduras, Haiti, Trinidad and Tobago, Albania, Kyrgyzstan, Armenia, Georgia, Iran, Iraq, Israel, Jordan, Lebanon, Oman, Turkey, Morocco, Benin, Burkina Faso, Cameroon, Ghana, Mali, Niger, Nigeria, Senegal, Togo, Central African Republic, Chad, Congo, Gabon, Comoros, Ethiopia, Kenya, Madagascar, Mauritius, Uganda, Namibia, South Africa.
NDC IIIChina, Malaysia, Singapore, India, Chile, Uruguay, Uzbekistan, Tunisia
NDC IVBrunei Darussalam, Laos, Philippines, Nepal, Sri Lanka, Bolivia, Ecuador, Panama, El Salvador, Jamaica, Bahrain, Kuwait, Qatar, Saudi Arabia, United Arab Emirates, Algeria, Egypt, Malawi, Rwanda, Sudan, Zimbabwe.
Aggregation II
ChinaChina
EU (27)France, Germany, Italy, Netherlands, Belgium, Luxembourg, Denmark, Ireland, Greece, Portugal, Spain, Austria, Sweden, Finland, Malta, Cyprus, Poland, Hungary, Czech Republic, Slovakia, Slovenia, Estonia, Latvia, Lithuania, Romania, Bulgaria
ASEANBrunei, Cambodia, Indonesia, Laos, Malaysia, Philippines, Singapore, Thailand, Myanmar, other parts of South-East Asia
USAUSA
Hong KongHong Kong
Latin AmericaArgentina, Bolivia, Brazil, Chile, Colombia, Ecuador, Paraguay, Peru, Uruguay, Venezuela, rest of South America, Costa Rica, Guatemala, Honduras, Nicaragua, Panama, El Salvador, rest of Central America, Dominica, Haiti, Jamaica, Puerto Rico, Trinidad and Tobago, Caribbean Sea
AfricaAlgeria, Egypt, Morocco, Tunisia, rest of North Africa, Benin, Burkina Faso, Cameroon, Côte d’Ivoire, Ghana, Guinea, Mali, Niger, Nigeria, Senegal, Togo, rest of West Africa, Central African Republic, Chad, Congo, Democratic Republic of the Congo, Equatorial Guinea, Gabon, Central and Southern Africa, Comoros, Ethiopia, Kenya, Madagascar, Malawi, Mauritius, Mozambique, Rwanda, Sudan, Tanzania, Uganda, Zambia, Zimbabwe, rest of East Africa, Botswana, Swaziland, Namibia, South Africa, rest of South Africa.
JapanJapan
KoreaKorea
IndiaIndia
RowCountries and territories in the database not listed above

Appendix D

Table A2. Emissions growth projections for selected aggregates from 2014–2030 (billion tons).
Aggregation NameEmissions in 2014Conditional Emissions in 2030Projected Change (%)
Aggregation I
NDC I18.92716.369−13.52%
NDC II10.50213.72930.73%
NDC III15.19423.16452.45%
NDC IV2.6453.48031.57%
Aggregation II
China12.00014.49420.80%
EU (27)4.1803.525−15.70%
ASEAN3.8134.91622.42%
USA6.5005.044−22.40%
Hong Kong---
Latin America3.2923.65910.04%
Africa3.5124.03913.05%
Japan1.3801.088−21.20%
Korea0.6680.562−15.80%
India2.6707.707188.60%
Row4.8415.81616.76%
Source: Aggregated calculations based on research by King and van den Bergh [20].

Appendix E

Table A3. Sector aggregation in GTAP-11 database.
Sector AggregationSectors Covered in GTAP-11 Database
AgriculturePaddy rice, wheat, cereal grains nec, vegetables, fruit, nuts, oil seeds, sugar cane, sugar beet, plant-based fibers, crops nec, bovine cattle, sheep and goats, animal products nec, raw milk, wool, silk-worm cocoons, forestry, fishing, processed rice
Food_pctsBovine meat products, meat products nec, vegetable oils and fats, dairy products, sugar, food products nec, beverages and tobacco products
CoalCoal mining
OilCrude oil
GasNatural gas extraction
Oil_pctsRefined oil products
ElectricityElectricity
TextilesTextiles, wearing apparel, leather products
Min_pctsMinerals nec, mineral products nec
Wood_pctsWood products, paper products, publishing
Chemical_pctsChemical products, basic pharmaceutical products, rubber and plastic products
Metl_pctsFerrous metals, metals nec, metal products
Electronic_pctsComputer, electronic and optic, electrical equipment
EquipmentMachinery and equipment nec
LightmnfcMotor vehicles and parts, transport equipment nec, manufactures nec
OthersSectors in the database not listed above

References

  1. UNFCCC. Nationally determined contributions under the Paris Agreement. In Proceedings of the UN Climate Change Conference. Available online: https://unfccc.int/process-and-meetings/the-paris-agreement/nationally-determined-contributions-ndcs (accessed on 2 June 2024).
  2. WorldBank. State and Trends of Carbon Pricing 2023; WorldBank: Washington, DC, USA, 2023. [Google Scholar]
  3. Tarr, D.G.; Kuznetsov, D.E.; Overland, I.; Vakulchuk, R. Why carbon border adjustment mechanisms will not save the planet but a climate club and subsidies for transformative green tech49nologies may. Energy Econ. 2023, 122, 106695. [Google Scholar] [CrossRef]
  4. Kuik, O.; Hofkes, M. Border adjustment for European emissions trading: Competitiveness and carbon leakage. Energy Policy 2010, 38, 1741–1748. [Google Scholar] [CrossRef]
  5. Kee, H.L.; Ma, H.; Mani, M. The Effects of Domestic Climate Change Measures on International Competitiveness. World Econ. 2010, 33, 820–829. [Google Scholar] [CrossRef]
  6. Qi, W. Review on border carbon adjustments under climate change. Master’s Thesis, Nankai University, Tianjin, China, 2011. [Google Scholar]
  7. IPCC. Climate Change 2014: Mitigation of Climate Change. Contribution of Working Group III to the Fifth Assessment Report of the Intergovernmental Panel on Climate Change; IPCC: London, UK; New York, NY, USA, 2014. [Google Scholar]
  8. Copeland, B.R.; Taylor, M.S. Free trade and global warming: A trade theory view of the Kyoto protocol. J. Environ. Econ. Manag. 2005, 49, 205–234. [Google Scholar] [CrossRef]
  9. Peters, G.P. From production-based to consumption-based national emission inventories. Ecol. Econ. 2008, 65, 13–23. [Google Scholar] [CrossRef]
  10. Franzen, A.; Mader, S. Consumption-based versus production-based accounting of CO2 emissions: Is there evidence for carbon leakage? Environ. Sci. Policy 2018, 84, 34–40. [Google Scholar] [CrossRef]
  11. Jiborn, M.; Kander, A.; Kulionis, V.; Nielsen, H.; Moran, D.D. Decoupling or delusion? Measuring emissions displacement in foreign trade. Glob. Environ. Chang. -Hum. Policy Dimens. 2018, 49, 27–34. [Google Scholar] [CrossRef]
  12. Yu, B.Y.; Zhao, Q.Y.; Wei, Y.M. Review of carbon leakage under regionally differentiated climate policies. Sci. Total Environ. 2021, 782, 146765. [Google Scholar] [CrossRef]
  13. Michalek, G.; Schwarze, R. Carbon leakage: Pollution, trade or politics? Environ. Dev. Sustain. 2015, 17, 1471–1492. [Google Scholar] [CrossRef]
  14. Tan, X.; Liu, Y.; Cui, J.; Su, B. Assessment of carbon leakage by channels: An approach combining CGE model and decomposition analysis. Energy Econ. 2018, 74, 535–545. [Google Scholar] [CrossRef]
  15. Weitzel, M.; Hübler, M.; Peterson, S. Fair, optimal or detrimental? Environmental vs. strategic use of border carbon adjustment. Energy Econ. 2012, 34, S198–S207. [Google Scholar] [CrossRef]
  16. Antimiani, A.; Costantini, V.; Martini, C.; Salvatici, L.; Tommasino, M.C. Assessing alternative solutions to carbon leakage. Energy Econ. 2013, 36, 299–311. [Google Scholar] [CrossRef]
  17. Gerlagh, R.; Kuik, O. Spill or leak? Carbon leakage with international technology spillovers: A CGE analysis. Energy Econ. 2014, 45, 381–388. [Google Scholar] [CrossRef]
  18. Fischer, C.; Greaker, M.; Rosendahl, K.E. Robust technology policy against emission leakage: The case of upstream subsidies. J. Environ. Econ. Manag. 2017, 84, 44–61. [Google Scholar] [CrossRef]
  19. Pan, W.; Kim, M.K.; Ning, Z.; Yang, H. Carbon leakage in energy/forest sectors and climate policy implications using meta-analysis. For. Policy Econ. 2020, 115, 102161. [Google Scholar] [CrossRef]
  20. King, L.C.; van den Bergh, J.C.J.M. Potential carbon leakage under the Paris Agreement. Clim. Chang. 2021, 165, 52. [Google Scholar] [CrossRef]
  21. Zhang, Y.Y. Climate change, trade policy and the wto rules: In case of border adjustments. Master’s Thesis, Nankai University, Tianjin, China, 2010. [Google Scholar]
  22. Monjon, S.; Quirion, P. A border adjustment for the EU ETS: Reconciling WTO rules and capacity to tackle carbon leakage. Clim. Policy 2011, 11, 1212–1225. [Google Scholar] [CrossRef]
  23. Winchester, N.; Paltsev, S.; Reilly, J.M. Will Border Carbon Adjustments Work? B.E. J. Econ. Anal. Policy 2011, 11. [Google Scholar] [CrossRef]
  24. Kortum, S.; Weisbach, D. The design of border adjustments for carbon prices. Natl. Tax J. 2017, 70, 421–446. [Google Scholar] [CrossRef]
  25. Mehling, M.A.; Van Asselt, H.; Das, K.; Droege, S.; Verkuijl, C. Designing Border Carbon Adjustments for Enhanced Climate Action. Am. J. Int. Law 2019, 113, 433–481. [Google Scholar] [CrossRef]
  26. Korpar, N.; Larch, M.; Stöllinger, R. The European carbon border adjustment mechanism: A small step in the right direction. Int. Econ. Econ. Policy 2022, 20, 95–138. [Google Scholar] [CrossRef]
  27. Evans, S.; Mehling, M.A.; Ritz, R.A.; Sammon, P. Border carbon adjustments and industrial competitiveness in a European Green Deal. Clim. Policy 2021, 21, 307–317. [Google Scholar] [CrossRef]
  28. Keen, M.; Parry, I.; Roaf, J. Border carbon adjustments: Rationale, design and impact. Fisc. Stud. 2022, 43, 209–234. [Google Scholar] [CrossRef]
  29. Böhringer, C.; Carbone, J.C.; Rutherford, T.F. The Strategic Value of Carbon Tariffs. Am. Econ. J. -Econ. Policy 2016, 8, 28–51. [Google Scholar] [CrossRef]
  30. Chen, G. Impact of carbon border adjustment mechanism on China’s manufacturing sector: A dynamic recursive CGE model based on an evolutionary game. J. Environ. Manag. 2023, 347, 119029. [Google Scholar] [CrossRef]
  31. Magacho, G.; Espagne, E.; Godin, A. Impacts of the CBAM on EU trade partners: Consequences for developing countries. Clim. Policy 2023, 241, 243–259. [Google Scholar] [CrossRef]
  32. Beck, U.R.; Kruse-Andersen, P.K.; Stewart, L.B. Carbon leakage in a small open economy: The importance of international climate policies. Energy Econ. 2023, 117, 106447. [Google Scholar] [CrossRef]
  33. Siy, A.L.; Wang, A.; Zheng, T.; Hu, X. Research on the Impact of the EU’s Carbon Border Adjustment Mechanism: Based on the GTAP Model. Sustainability 2023, 15, 4761. [Google Scholar] [CrossRef]
  34. Ambec, S.; Yang, Y. Climate policy with electricity trade. Resour. Energy Econ. 2024, 76, 101422. [Google Scholar] [CrossRef]
  35. Banerjee, S. Carbon adjustment in a consumption-based emission inventory accounting: A CGE analysis and implications for a developing country. Environ. Sci. Pollut. Res. 2021, 28, 19984–20001. [Google Scholar] [CrossRef]
  36. Clora, F.; Yu, W.; Corong, E. Alternative carbon border adjustment mechanisms in the European Union and international responses: Aggregate and within-coalition results. Energy Policy 2023, 174, 113454. [Google Scholar] [CrossRef]
  37. Zhong, J.; Pei, J. Carbon border adjustment mechanism: A systematic literature review of the latest developments. Clim. Policy 2024, 24, 228–242. [Google Scholar] [CrossRef]
  38. Dong, Y.; Ishikawa, M.; Hagiwara, T. Economic and environmental impact analysis of carbon tariffs on Chinese exports. Energy Econ. 2015, 50, 80–95. [Google Scholar] [CrossRef]
  39. Wu, L.; Zhou, Y.; Qian, H. Global actions under the Paris agreement: Tracing the carbon leakage flow and pursuing countermeasures. Energy Economics 2022, 106, 105804. [Google Scholar] [CrossRef]
  40. ICAP. Emissions Trading Worldwide: Status Report 2023; International Carbon Action Partnership: Berlin, Germany, 2023. [Google Scholar]
  41. Paltsev, S.V. The Kyoto Protocol: Regional and sectoral contributions to the carbon leakage. Energy J. 2001, 22, 53–79. [Google Scholar] [CrossRef]
  42. Böhringer, C.; Fischer, C.; Rosendahl, K.E.; Rutherford, T.F. Potential impacts and challenges of border carbon adjustments. Nat. Clim. Chang. 2022, 12, 22–29. [Google Scholar] [CrossRef]
  43. Cramton, P.; MacKay, D.J.; Ockenfels, A.; Stoft, S. Global Carbon Pricing: The Path to Climate Cooperation; MIT Press: Cambridge, MA, USA, 2017. [Google Scholar]
  44. WHO; Bekkers, E.; Gianmarco, C. Comparing different approaches to tackle the challenges of global carbon pricing. In World Trade Organization Working Paper ERSD-2022-10; WHO: Geneva, Switzerland, 2022. [Google Scholar]
  45. Nordhaus, W. Climate Clubs: Overcoming Free-riding in International Climate Policy. Am. Econ. Rev. 2015, 105, 1339–1370. [Google Scholar] [CrossRef]
  46. Grubb, M.; Jordan, N.D.; Hertwich, E.; Neuhoff, K.; Das, K.; Bandyopadhyay, K.R.; Oh, H. Carbon Leakage, Consumption, and Trade. Annu. Rev. Environ. Resour. 2022, 47, 753–795. [Google Scholar] [CrossRef]
  47. Burniaux, J.-M.; Truong, T.P. GTAP-E: An energy-environmental version of the GTAP model. GTAP Tech. Pap. 2002, 18. Available online: https://www.gtap.agecon.purdue.edu/resources/res_display.asp?RecordID=923 (accessed on 3 July 2024).
Figure 1. China’s foreign exports 2014–2023 (USD Trillion).
Sustainability 16 07429 g001
Figure 2. Carbon leakage rate results of different NDC aggregations under different scenarios.
Sustainability 16 07429 g002
Figure 3. Carbon leakage rate results of China and trading partners under different scenarios.
Sustainability 16 07429 g003
Figure 4. Industry leakage rate results when USD 35 Mt/CO2 tax rate is imposed under different scenarios.
Sustainability 16 07429 g004
Figure 5. Results of GDP change by region under CBAM Phase I with USD 55 Mt/CO2 tax rate.
Sustainability 16 07429 g005
Figure 6. Range of carbon leakage rates with different Armington elasticities.
Sustainability 16 07429 g006
Table 1. GTAP-E simulation scenario settings.
S1All countries meet their Paris Agreement emission reduction commitments by 2030.
S2CBAM imposes carbon tariffs on sectors covered by Phase I in accordance with the actual collection criteria.
S3CBAM imposes carbon tariffs on all sectors in accordance with actual collection criteria.
S4China sets an export carbon tax of USD 20 Mt/CO2 under the CBAM Phase I carbon tariff.
S5All countries set an export carbon tax of USD 40 Mt/CO2 under the CBAM Phase I carbon tariff.
Table 2. Changes of China’s exports to trading partners under different scenarios with a CBAM USD 55 Mt/CO2 tax rate (%).
Country AggregationsS2S3S4S5
EU (27)−1.4−2.54−4.34−1.08
ASEAN0.220.64−0.250.53
USA0.250.13−0.080.05
Hong Kong−0.02−0.05−0.06−0.01
Latin America0.170.27−0.250.04
Africa0.070.29−0.230.03
Japan−0.49−0.28−0.03−0.31
Korea2.740.84−2.110.64
India0.180.13−1.720.18
Change in total export−0.04−0.09−0.26−0.14
Change in total export
(billion of dollars)
−1.874−4.118−12.176−6.526
Table 3. Changes in China’s output by industry under the two phases of CBAM (%).
Sector AggregationsS2S3
USD 35USD 55USD 75USD 35USD 55USD 75
Agriculture0.010.030.04−0.02−0.05−0.09
Food_pcts0.010.020.03−0.03−0.03−0.10
Coal−0.08−0.21−0.24−0.06−0.14−0.52
Oil0.460.420.370.821.131.24
Gas0.000.000.000.000.000.00
Oil_pcts−0.02−0.07−0.170.040.080.20
Electricity−0.03−0.11−0.13−0.18−0.20−0.52
Textiles0.020.030.05−0.04−0.11−0.21
Min_pcts−0.04−0.13−0.14−0.13−0.13−0.14
Wood_pcts0.030.040.04−0.01−0.04−0.04
Chemical_pcts−0.04−0.07−0.12−0.15−0.55−0.68
Metl_pcts−0.03−0.05−0.14−0.08−0.54−0.91
Electronic_pcts0.040.090.100.150.330.43
Equipment0.040.050.070.090.240.77
Lightmnfc0.000.050.050.240.420.46
Disclaimer/Publisher’s Note: The statements, opinions and data contained in all publications are solely those of the individual author(s) and contributor(s) and not of MDPI and/or the editor(s). MDPI and/or the editor(s) disclaim responsibility for any injury to people or property resulting from any ideas, methods, instructions or products referred to in the content.

