Abstract
The scientific literature commonly states that walking to and from school can provide a regular source of physical activity for children and young people. Transport planners emphasise the importance of interventions in the road network to improve walking practices among this younger population. The Walking School Bus is an initiative that can have a positive impact on traffic management while simultaneously promoting physical health. It is a transportation service used by elementary school students to walk the home–school route accompanied by parent volunteers. It is a similar mode to the school bus in which there are several lines, each consisting of several stops, and each line is associated with a predetermined route that must go through all the stops and then arrive at the school. This paper aims to propose and implement a microsimulation traffic flow model leading to a local solution. The study has two primary purposes: (1) to evaluate the impact of Walking School Bus demands on traffic performance and (2) to examine the effect of different routes on traffic flow delay. Finally, after the implementation, the model will be applied to analyse the situation of an existing school, which will consider this mode of transport.
1. Introduction
There is a growing need to increase young people’s awareness of sustainable forms of mobility, but evidence suggests that transport provision is often inadequate to address the needs of students. This problem affects not only accessibility, understood as the usability of space, but also environmental, economic, and social sustainability [1].
The transformation of urban mobility through the promotion of sustainable transportation modes is a comprehensive strategy that yields positive outcomes for individual health, community well-being, and global environmental sustainability. This paradigm shift is indispensable for constructing cities that are not only efficient and economically vibrant but also resilient and environmentally conscious.
The school is an appropriate place to encourage reflection and experimentation on good practices for sustainable mobility, given its educational role and the transfer of information from children to families.
Facilitating access to school facilities and addressing congestion issues on adjacent roads are key aspects that can contribute greatly to the sustainability of urban areas in terms of environmental, economic, and social dimensions. At the same time, walking to school increases children’s awareness of their neighbourhoods and also has a positive influence on their health and well-being. A significant proportion of families rely on cars as the main form of mobility, leading to congestion around schools and consequently high levels of pollution. As a result, children who commute by car are more exposed to pollutants, noise, and risk of accidents [2]. This not only impedes traffic flow but also degrades air quality and needs urgent attention to encourage a more sustainable urban environment.
To reduce the effects of traffic and thus increase the quality of life in our cities, actions to govern the demand for mobility are indispensable, i.e., measures that act on the behaviour of individuals and support them in changing towards sustainability.
The range of possible actions are aimed at promoting cultural changes, attitudes, and behaviour that are sustainable and respectful of the environment. The participation of the entire population can encourage activities to reduce atmospheric pollutants to reduce the risk of pathologies caused by exposure to polluting factors, which is increasingly broad.
Among such interventions, active school commuting is a critical contributor to physical activity [3], involving mainly younger children. The “last mile” in the home-to-school commute near the school complex is an essential element of a mobility rebalancing model and an opportunity for redevelopment [4].
Often, such journeys are made by private car even though they could be better performed by collective transport. This leads to the determination of spatial segregation and inequalities in accessibility.
Mitra et al. [5] conducted a survey of a sample of students living at different distances from school and examined the relationship between the built-up environment and the likelihood of a child walking or being driven to school at different times of the day. They concluded that the environment plays a crucial role in the choice of route to/from school, more so than the distance to walk to school. Tridib Banerjee [6] also reached similar conclusions, emphasising how establishing school roads can provide an opportunity for the redevelopment of the area, improving the maintenance and cleanliness of the nearby environment.
In their study, Zubrick et al. [7] spoke of the opportunity to increase children’s daily physical activity that arises from daily walking to school, even when the distance is short.
Active transport can contribute to a more physically active profile, at least for children, and supporting walking-to-school initiatives using school streets can increase children’s physical activity.
There are many reasons for wanting to introduce school streets or specific initiatives such as the “Walking School Bus” (WSB) to enable safe and healthy journeys to school, including the following:
- To reduce congestion and the number of vehicles travelling through school streets;
- To reduce pollution and create a safer and cleaner environment around the school entrance;
- To encourage more walking and active journeys;
- To encourage independent mobility;
- To create space for community connection and sociability, generally improving walkability.
School streets are car-free areas outside schools that are closed to vehicles (or with restricted access), usually for short times at the start and end of the school day. It is a very low-cost solution that can be implemented very quickly. Also, it reverses the usual dominance of private vehicles on the roads.
The main users of school streets are Walking School Bus (WSB) users, where a group of children, accompanied by adults (usually at least two), walk a fixed route to or from school, picking up the children at several stops as they go. The WSB must go through all the stops and arrive at the school. It can operate thanks to the voluntary cooperation of parents with the organisational and logistical support of local authorities.
WSB lines are an effective tool for educating young generations on environmentally sustainable behaviour and decreasing traffic congestion and air pollution in urban areas.
The propensity to walk to school is influenced by several impact factors, including the built environment, socioeconomic status, and parental attitude.
2. Data and Methodology
The study aimed to develop a methodology for implementing WSB lines in a medium-sized urban context, designed using microsimulation tools, and to evaluate the impact of the interventions on road traffic. Each phase is described from a methodology and data perspective using a case study. Section 2 provides an overview of the study area and the current scenario. Section 3 describes the scenarios developed, and Section 4 presents the results after one year of implementation of a pedibus line. Section 5 addresses the weaknesses of the methodology and external factors that may influence the results. Lastly, Section 6 summarises the study’s conclusions.
2.1. Study Area and Unit of Analysis
The paper focuses on one specific strategy employed in a small city to increase the number of children walking to school by walking the school bus.
Carini is a medium-sized town with around 40,000 inhabitants, not far from the capital, Palermo. The accessibility of Laura Lanza School, located in a high-density residential neighbourhood, was examined as part of this research. The school serves much of the neighbourhood, and most students use private cars (as passengers) to travel to and from school.
The scene outside the school today often sees vehicles lined up on both sides of the nearby road, as close to the school gate as possible, using whatever means necessary to be closer to the gate, including double parking (Figure 1).
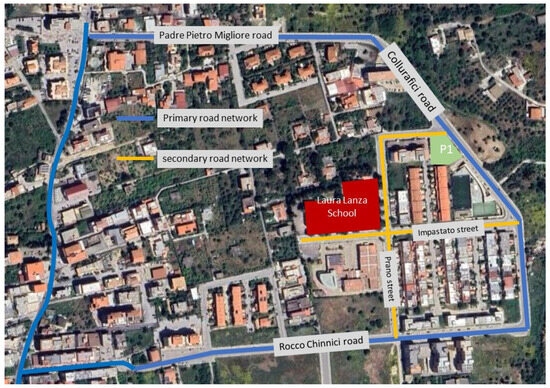
Figure 1.
Study area.
Students who walk to school are lost in the traffic and exhaust fumes, while those who are accompanied by cars are hurriedly escorted to and from the cars. Unfortunately, this situation is not limited to this school; it has become a common problem plaguing primary schools in many cities.
When selecting the school in which the study would be carried out, the following factors were taken into consideration:
- The presence of critical road safety issues;
- The volume of traffic during peak and off-peak hours (through vehicle counting campaigns);
- The existence of suitable short-term parking areas at the edge of the restricted area;
- The existence of alternative routes for transit vehicle flows;
- The possible presence of public transport;
- The number of residents in the area of restricted traffic;
- The consistency of the initiative with the objectives of promoting environmental sustainability initiatives.
The use of microsimulation tools for traffic flows allowed the comparison of scenarios for dedicated student Walking School Bus routes considering different origin nodes and destinations. It estimates each impact on traffic flow resulting from the implementation of Walking School Bus routes, mitigating the criticality of transport in a preventive manner.
For a comprehensive discussion on microsimulation, the scientific approach, and fields of application, please refer to [8,9].
The survey results were implemented and processed using the Dynasim 6.1 tool. It is a stochastic, event-based, dynamic traffic microsimulation software. It is based on car-following and acceptance gap models to evaluate moving vehicles and their interactions. The modelling of traffic systems allows the comparison of different scenarios and the use of O/D matrices and traffic compositions to simulate realistic flows and analyse the results of time loss functions.
2.2. Defining the Scenarios
For study purposes, four different scenarios were constructed and compared:
- Current Scenario 0, which corresponds to the current scenario in which all roads are usable by cars and there is time-limited traffic restriction (Figure 2).
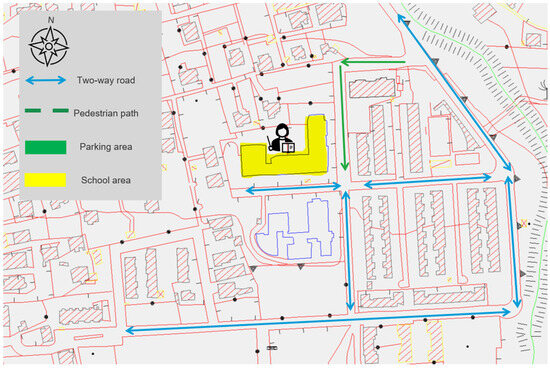 Figure 2. Current scenario model.
 - Scenario 1, in which the “green” line with traffic restriction in front of the school is proposed. For the first project scenario, a Walking School Bus route was designed with defined stops, schedules, and pick-up points (Figure 3).
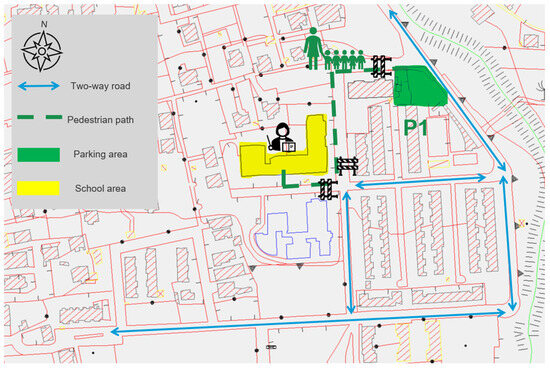 Figure 3. Project Scenario 1.
 - Scenario 2 implements a second “purple” line, for which the route, stops, and timetable are also defined (Figure 4).
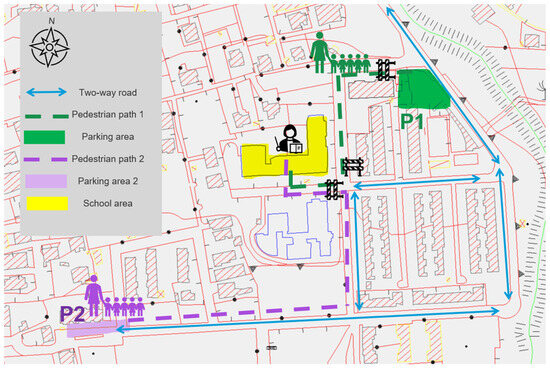 Figure 4. Project Scenario 2.
 - Scenario 3 adds a public transport line to the two existing pedibus lines. It is worth remembering that the district currently lacks a public transport service. The stops and service times for this new line are also defined.
The assumption was that this would be constant over a short-term period (8 months, equivalent to one school year) and that there would be no changes in the road network, only traffic organisation measures.
2.3. The Current Scenario
The Walking School Bus project identifies road routes and defines them as a “timed traffic restriction”, which is a restriction of access to only a particular time window.
The study was based on a real scenario where the Prano Street access to the Laura Lanza School is closed from 7:00 to 8:30 a.m. to prevent private vehicles from reaching the front of the school but to allow residents to leave the restricted mobility area.
The access from Impastato Street continues to be free, with two-way traffic and parking allowed on both sides. The model area is presented in Figure 2. In the current situation, access to the school is significantly limited due to the circulation of cars, which frequently ignore the traffic ban at the start of the school day (7:00–8:30). The figures show an overview of the location of the school (marked in red); the blue lines are the main roads where the traffic data were collected. In all scenarios software used a 1:2000 scale map for the network development. However, in the paper, the scale of the image was adjusted to fit the width of the text column
During school hours, double parking is very common, significantly compromising the walkability of the sidewalks and the capacity of the road, with frequent congestion spreading to a significant portion of the road network around the school.
To create the supply model required for the simulation, we defined an all-urban local road network with two-way traffic and a single lane per direction. We also identified specific arcs and nodes that were useful for assigning the O/D matrix. It is important to note that the area where the school is located is not served by urban public transportation.
The eye-level streetscape features, captured by street view image (SVI), have been extensively applied in evaluating pavement quality and walkability. SVIs are a form of open-source data and are easy to obtain. Compared to foot-based audits, using SVIs is time-saving while keeping audit quality [10]. Furthermore, SVIs show advantages in extracting eye-level streetscape features, which are considered to reflect the residents’ exposure to and perception of the built environment [11,12]. We sampled SVIs at intervals of 50 m along these Walking School Bus lines.
Motor vehicles and pedestrian volumes were gathered in 5 min time intervals for each direction separately. Values for traffic demand are available as OD matrices (Table 1, Table 2 and Table 3), but only for the peak hours 7.30–8.30.

Table 1.
O/D matrix per hour for current scenario (bike).
Table 2.
O/D matrix per hour for current scenario (car).
Table 3.
O/D matrix per hour for current scenario (car to school).
Field experiments were conducted during the morning peak (7:30–8:30 p.m.) in May 2022. This study used a passenger car equipped with a GPS data logger to record second-by-second speed, distance, and slope. Travel time and queue delay information used high-resolution vehicle trajectory data collected by GPS (1 point fixed every 1 s), providing continuous dynamics of trip measurement. The data collected by GPS are used to calibrate the model.
The Dynasim microsimulation package can evaluate traffic operations in a given context of traffic, pedestrian demands, directional split distributions, and intersection layout. It includes gap-acceptance rules that can reproduce the interactions between motorised and non-motorised modes.
Simulation experiments were performed for the analysis period between 7:30 a.m. and 8:30 a.m. with a 30 min “warm-up” period prior to 7:30 a.m. First, traffic and pedestrian volumes were assigned for each link according to the traffic flow survey. Second, GPS traces were matched to each link to implement reduced-speed areas and desired speed decisions as closely as possible and to avoid excessive acceleration values in the traffic model. The speed distributions for pedestrians ranged from 1.4 m/s to 2 m/s [13,14].
Traditional sources of traffic data are either limited to a limited number of typical conditions or may not be reliable enough. With the advent of new technologies, information is at the fingertips of users by means of GPS-equipped devices; the rapid rise in information technology has also resulted in innovative ways to obtain space- and time-sensitive information in real-time. This, in turn, has led to a massive amount of collected location data for various periods, also called “big data.” The availability of big data provided an opportunity to calibrate the traffic simulation model by integrating data collected via GPS.
2.4. Model Calibration
Different types of sensed data sources and big data were used in the calibration process to obtain more realistic results in terms of traffic parameters: traffic flow parameters were adjusted using field measurements such as manually collected traffic counts and dynamic data along the network using data collected from GPS and big data.
The methodology for calibrating the traffic model was carried out in four steps:
- Manual survey of traffic flows by type along all roads in the study area.
- GPS collection of speeds and waiting times at intersections during the start and end of school activities. The data were collected by the authors using a GPS placed in a private vehicle, and the surveys were carried out over two weeks from 7.30 a.m. to 8.30 a.m. and 12.00 a.m. to 2.00 p.m. along the road network of the study area, collecting 25 tracks and approximately 6000 GPS points [15].
- Use of big data to estimate speeds, queues, and travel times during an average work day along the entire road network in the study area.
- Use of the GEH parameter (Table 4) by FHWA’s Traffic Analysis Toolbox to evaluate a satisfactorily calibrated model [16].
Table 4. GEH.
For the calibration phase, 12 traffic simulations of the current scenario with different random seeds were used. The results were compared with speed values collected by GPS and those provided by big data. The root mean square error (RMSE) was used to measure the closeness of the speed with RMSE = ± 3.2 m/s.
3. The Project Scenarios
Scenario 1 aims to implement traffic-calming measures along Prano Street and provide additional pedestrian space along Impastato Street to break down barriers between the school and the community and maximise the potential for social connections.
The routes within 500 m of the school are generally walked, while those beyond require the use of different modes of transportation.
The route was marked with horizontal colouring, and vertical signage was installed. Vehicles accompanying children to school have a designated stop area near the end of the route where the child can be safely handed over to the caregiver. For more complex situations, route optimisation and stop location algorithms are also available to support the technician [17,18].
The analysed routes originated from multiple areas adjacent to the school facility (O) and to a single destination (D) corresponding to the Laura Lanza School. The evaluation of the routes took into account the availability of free parking stalls for private vehicles (Figure 3, P1, the green area, is the parking area, and the dashed green line corresponds to the path for the Walking School Bus in “Scenario 1”) and the locations of short-term parking areas (Figure 4, P2, the purple area, represents the new parking area, and the dashed purple line corresponds to the additional path for the Walking School Bus in “Scenario 2”.)
The changes to some streets in the road network near the Laura Lanza School to “school streets” include the following:
- Restrictions to access for motorised vehicles near the school during drop-off and pick-up times;
- Restrictions for approximately 15 to 90 min at the beginning and end of the school day;
- Only pedestrians and cyclists can enter the school road zone, plus exempted vehicles.
Safe speeds, such as 30 km/h limits and suitable crossing points, have been introduced on the rest of the affected road network.
Identifying school routes that provide car-free space outside schools to support clean air, active travel, social connections, and improved well-being puts children first on the scale of facilitated traffic components.
The walking bus should be well connected to school destinations, comfortable (in terms of footway width, walking surfaces, and planning for disabled people), convenient (easy, safe, and no-delay street crossing), convivial (interesting, clean and free from threat routes), and conspicuous (walking routes signposted).
The results of the different scenarios made it possible to investigate different configurations of school streets, change the traffic conditions, and compare the results of each of them with the current scenario. This is essential to understand the quantitative benefits of implementing some Walking School Bus routes.
4. Monitoring
During European Mobility Week, one of the planned Walking School Bus lines was launched. European Mobility Week is an annual event promoted by the EU involving mainly European cities (2989 cities in 2022) and taking place in 2022 from 16th September to 22nd September (https://mobilityweek.eu/home/). The European Mobility Week aims to promote behaviour changes in favour of public transport and other clean transportation solutions. Municipalities are encouraged to experiment with innovative planning measures during the week, involving parents and volunteers who will run the service for one year. The City of Carini implemented the P1 route service in September 2022, during the European Mobility Week, with its staff, and the service was maintained throughout the school year until May 2023.
Following the start-up phase, a monitoring phase was carried out to assess the initiative’s impact on mobility in the areas surrounding the school and the WSB terminal. The Traffic Stats tool, which is part of the MOVE portal provided by TomTom, was used for this purpose (Figure 5).
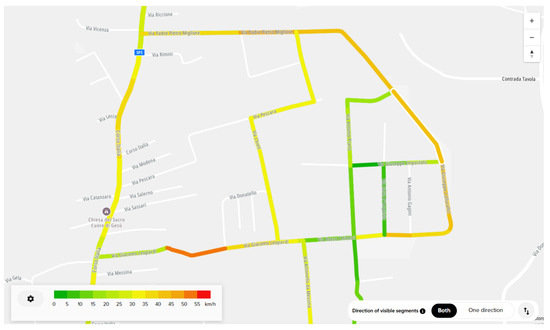
Figure 5.
TomTom Traffic Stats—median speed analysis.
Figure 6 shows the total number of GPS devices observed on each road segment during the selected date range and time set.
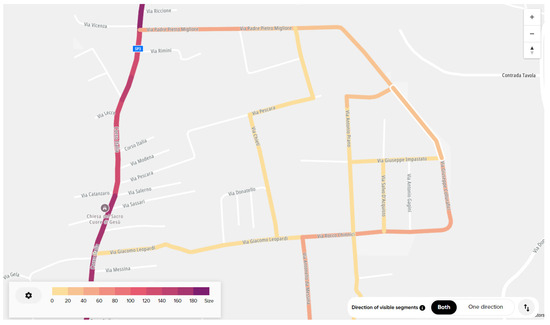
Figure 6.
TomTom Traffic Stats—sample size analysis.
Traffic Stats Tool Functions
Traffic Stats is a cloud-based solution accessible via the TomTom Move self-service portal (https://move.tomtom.com/ (accessed on 16 November 2023)). This tool allowed us to formulate customised queries by defining parameters such as the following:
- The network or route to be analysed.
- The time interval of interest (from the year 2008 up to three days before the current date).
- The granularity of the data (e.g., hourly or fortnightly intervals).
Traffic Stats offers three types of analysis:
- Area analysis, which calculates average speeds, average travel times, and sample sizes for each road segment.
- Traffic density, which focuses only on sample size, excluding speed and travel time parameters.
- Route analysis, which allows users to define a specific route and provides data on average speed, average travel time, and sample size.
The available formats for the results include Zip (GeoJson), Json, KMZ, ZIP file (Shape File), and XLSX. They provide detailed information such as the length of each segment, functional class, average travel time, average speed, speed standard deviation, sample size, road name, speed limit, and speed percentiles.
5. Result and Discussion
The proposed model considers the whole O/D matrix of vehicles (cars, motorbikes, bicycles, and parking) and aims to estimate the efficiency of the solutions in terms of travel time (Table 5) in order to assess the presence of congestion and the length of queues (Table 6). In the tables cited, the “car/bike to school” vehicle component represents the private vehicles that parents or guardians use to drop off their children at school. These vehicles enter the simulated road network, proceed to the school for the drop-off, and then exit the network.
Table 5.
Travel time in seconds (“car/bike to school”).
Table 6.
Waiting queues (m).
Table 6 indicates that, despite the closure of Via Prano to traffic, the length of queues decreases as new parking spaces and public transport services are introduced. Acceptable values remain present even when there is only one parking space. Peak values are observed during a 15 min period preceding the beginning of school activities, after which they decrease rapidly. The values demonstrate the potential for WSBs to be adopted in a gradual manner, thereby enhancing the overall performance of the system.
To evaluate the effectiveness of the proposed solutions, travel time through the network between an input and an output section of a specific data collector was used because it was particularly significant among the various parameters used for comparison (Table 7).
Table 7.
Travel time in seconds (bicycles and cars through the study area).
Scenario 0 (in the absence of the WSB scheme) illustrates the considerable travel times associated with accessing the school via the Chinnici–Collurafici route and the roads leading up to the school (Impastato–Prano). Conversely, the introduction of one or more WSB service has been observed to significantly reduce travel times, with these times becoming comparable to the crossing times observed in the study area (i.e., the travel times of individuals who do not have to drop their children off at school).
The primary limitation of all microsimulation models is the complexity of modelling human behaviour, which requires calibration with a large amount of GPS data and the use of big data. Additionally, while the real-time assignment of the O/D matrix is not feasible, the small number of roads to and from the study area did not lead to errors in the simulation.
Finally, this type of model normally requires very detailed information on the type of vehicles on the road to estimate the pollutants. This involves a considerable cost in both data collection and calibration, and, in general, the results are not always reliable as they also depend on specific environmental and meteorological contexts that the model does not take into account. For this study, we have used a conservative estimate of the traffic flow reduction, corresponding to a reduction in all pollutants.
Two reports were created to assess the influence of the walking bus programme on the whole area, analysing the same study area and time frames but investigating two distinct periods: March to May 2022 (pre-event) and March to May 2023 (Walking School Bus event). The report examines the following factors:
- (a)
- Area analysis;
- (b)
- Pre-event TomTom report dates: March to May 2022 (excluding weekends and holidays, focusing solely on school days);
- (c)
- Walking School Bus TomTom report dates: March to May 2023 (excluding weekends and holidays, focusing solely on school days);
- (d)
- Times of recording, with a 15 min time slot spanning the start and end of the school day (7:30–10:00 and 12:00–15:30).
The travel time before the event (March 2022), the result of the microsimulation, and the actual travel time after the service was used (March 2023) are compared in Table 8, as the service operated from September 2022 to May 2023.
Table 8.
Travel time (before the event).
The analysis was limited to the road network near the school, which was identical to that used in the microsimulation model.
The introduction of the WSB has reduced journey times slightly on the main road network because suitable parking spaces have been identified near the WSB stops. However, the impact on the secondary road network is more significant because cars only have to stop for a few minutes to drop off children at the WSB stop.
Two observations are relevant from the reports.
School area: The traffic density analysis (Figure 7) carried out around the school indicated a significant reduction in traffic, with an average decrease of 54%.
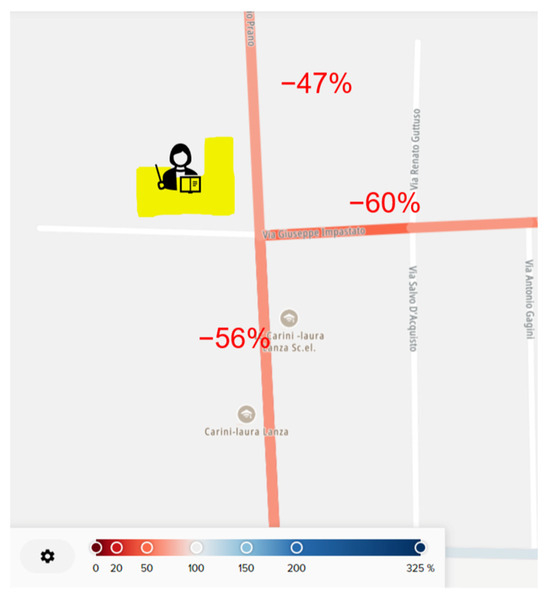
Figure 7.
Traffic density analysis.
The data presented in Table 8 indicate that, despite the closure of roads in the vicinity of the school to vehicular traffic, residual traffic flow persists, primarily attributable to residents exiting the study area and to drivers who disregard the prohibition on access. The deployment of control systems is thus recommended to enhance the efficacy of the WSB.
This result underlines the effectiveness of the Walking School Bus in reducing the flow of vehicles in the area. It is important to note that despite this reduction in traffic, there were no excessive deviations in average speed on the roads adjacent to the school, indicating that the reduction in traffic did not lead to situations of excessive speed or road safety.
Walking School Bus terminal area: With regard to the area used as a Walking School Bus terminal, an analysis of the median speed of the vehicles was carried out (Figure 8).
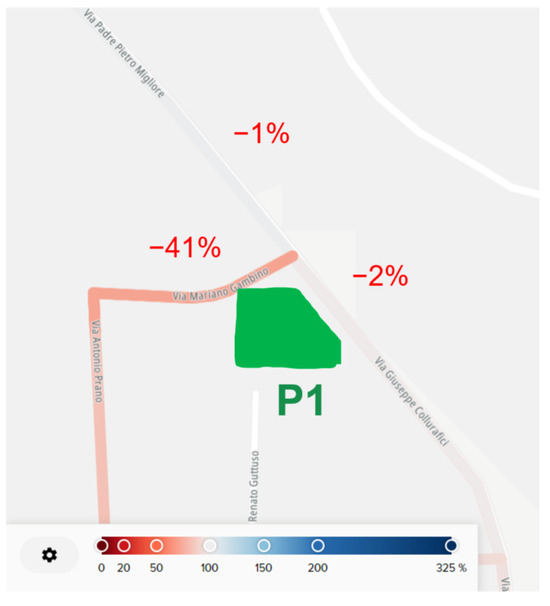
Figure 8.
Median speed analysis.
A speed slow-down was observed on the access road to the school (Figure 9), contributing to increased safety for the students. Furthermore, no significant speed variations were observed on the main axis of Padre Piero Migliore Road. These data indicate the absence of traffic congestion and confirm the efficiency of the student–vehicle exchange point in the P1 car park, which is separated from the traffic flow. This contributes to an orderly and safe traffic flow, even at peak times.
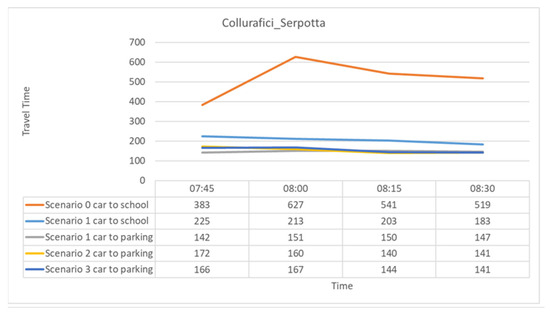
Figure 9.
Travel time along study network.
But how much, how, and to what extent can the WSB be promoted?
In the short term, the methodology and monitoring tools can support the local authority for analysis of traffic (traffic congestion and user behaviour, travel times, traffic loads, etc.) with regard to the road network under consideration. Further data are required on economic growth, technological advancement, urban land use expansion, and travel choices, in addition to an analysis of the role of urban public transport, when it is available.
In the medium term, the local authority technicians can use the methodology and big data tools for urban area transport planning processes. They can identify which schools are most promising for any proposed interventions in terms of the quantitative benefits of implementing some Walking School Bus routes, as well as estimate the overall network effects. Different types of transport interventions can be evaluated, including traffic management schemes, signal control policies, and new public transport services.
When designing the scenarios, the use of on-street parking for dropping off students was also evaluated. This solution is not presented because it did not offer any significant results in terms of reducing congestion, highlighting the importance of locating parking away from traffic flows to improve parents’ perceptions of safety.
Additionally, very few studies have highlighted parents’ mistrust of leaving their children unprotected and none of the studies reviewed assessed the impact of on-street parking rather than protected parking.
Finally, it is possible to update the information base on which the model chain operates through field control and monitoring tools and to support the calibration and validation of the chain itself.
6. Conclusions
This paper demonstrates that focusing on the journey to school can provide short-term benefits for children and long-term benefits for whole communities and cities.
The WSB line is available to all children regardless of their cultural status, income, and urban location (i.e., inner city or suburban). The results are generalisable for children attending classes 4 and 5. However, for other classes, it is essential to consider parents’ reluctance to entrust their children to volunteers. The experimental phase on school roads and Walking School Bus lines, launched during European Mobility Week, has received extremely positive feedback from parents and children; after one year of use, it has been confirmed that the community is interested in replicating the service for other schools. During the school year, the only reduction in use was due to the weather.
Monitoring for one school year demonstrated that the service is minimally affected by lifestyles. Parents accept providing a sustainable transport service that is considered safe and reliable.
Simulation scenarios have shown that an increase in the number of lines leads to an increase in the number of users. However, the opening of a new line has increased the need for volunteers to accompany children to school, as a minimum of two volunteers are required. It is important to bear in mind that school routes are not the same as one-off play routes, but it may be beneficial to “activate” a pilot project with activities to get children and parents more involved.
The estimated travel time takes into account nearby parking areas for the school. During the preliminary investigation, it was found that the parking spaces along the neighbouring streets are fully occupied, with occupancy rates of up to 99% between 7:45 and 8:45, corresponding to the beginning of the school day, with frequent illegal parking, and up to 80% between 13:00 and 14:00, corresponding to the end of the school day.
The travel time was estimated by calculating the average time for each transport mode and each simulated scenario.
Based on the outcome data of the microsimulation, it was possible to estimate a time saving of more than 40% due to the presence of walking school lines.
More generally, this following conclusions can be drawn:
- Addressing traffic congestion and air pollution by implementing “school streets” around schools and pedestrian routes will not only improve safety but also promote sustainable transport practices and manage mobility demand.
- Pedestrianism of the “last mile” commute and pedestrian-focused initiatives, particularly the Walking School Bus system, offer a practical solution for short-distance school commutes, reducing private car usage.
- Data-driven decision-making, integrating big data insights like TomTom Traffic Stats, can optimise pedestrian routes, timings, and traffic management strategies.
The study presents the first step toward shared mobility solutions. The methodology is applied to a specific case study with the aim of describing the steps needed to design and implement a WSB service in any other urban context.
Additionally, the case study results showed the importance of parental involvement in the design and management of the service. The selection of the educational institution was influenced by the willingness of parents to participate in the experiment, and the encouraging positive results have prompted the municipal administration to consider implementing WSB in other districts. This would involve utilising the results of microsimulation models that are implemented ad hoc in the design phase. Using microsimulation models, which gradually increase the number of WSB lines in scenarios, is advantageous for evaluating the impact of transport demand on outflow along the road network. This approach also supports the planning of the service, particularly in determining the number of volunteers needed to provide the service. The service could be adapted to students’ needs regarding route and schedule.
Finally, the study showed that when developing new solutions in the vicinity of other school facilities, the availability of alternative routes and specific contextual solutions should be evaluated before starting the microsimulation steps.
Although there are some limitations, this study contributes to planning policies that empirically sensitise parents to sustainable lifestyles and educate children in active walking. Additionally, the study offers guidelines for public administration to implement actions that promote a healthy balance of daily activities for optimal health benefits.
The study proposes that research should be extended to older children by involving ethno-cultural groups living in suburban areas. It is also hoped that the study will influence future urban planning and interventions developed in light of this example and, in the long term, contribute to creating healthy and active communities for children and young people.
Author Contributions
All the authors contributed to the study’s conception and design. The manuscript was written by G.S. All the authors reviewed and commented on previous versions of the manuscript. All authors have read and agreed to the published version of the manuscript.
Funding
This research received no external funding.
Institutional Review Board Statement
Not applicable.
Informed Consent Statement
Not applicable.
Data Availability Statement
The raw data supporting the conclusions of this article were acquired by the authors and are available on the website https://move.tomtom.com/ under a commercial license.
Conflicts of Interest
Luigi Sanfilippo and Alberto Brignone were employed by the CitiEU Consultancy Ltd. The remaining authors declare that the research was conducted in the absence of any commercial or financial relationships that could be construed as a potential conflict of interest.
References
- Rezasoltani, M.; Behzadfar, M.; Said, I. A Model Development for Children’s Walking in Neighborhood. Procedia-Soc. Behav. Sci. 2015, 201, 30–38. [Google Scholar] [CrossRef][Green Version]
- Kingham, S.; Meaton, J.; Sheard, A.; Lawrenson, O. Assessment of exposure to traffic-related fumes during the journey to work. Transp. Res. Part D Transp. Environ. 1998, 3, 271–274. [Google Scholar] [CrossRef]
- Davison, K.K.; Werder, J.L.; Lawson, C.T. Children’s active commuting to school: Current knowledge and future directions. Prev. Chronic. Dis. 2008, 5, A100. [Google Scholar] [PubMed]
- Lubans, D.R.; Boreham, C.A.; Kelly, P.; Foster, C.E. The relationship between active travel to school and health-related fitness in children and adolescents: A systematic review. Int. J. Behav. Nutr. Phys. Act. 2011, 8, 5. [Google Scholar] [CrossRef] [PubMed]
- Mitra, R.; Buliung, R.N.; Roorda, M.J. Built Environment and School Travel Mode Choice in Toronto, Canada. Transp. Res. Rec. 2010, 2156, 150–159. [Google Scholar] [CrossRef]
- Banerjee, T.; Uhm, J.; Bahl, D. Walking to School: The Experience of Children in Inner City Los Angeles and Implications for Policy. J. Plan. Educ. Res. 2014, 34, 123–140. [Google Scholar] [CrossRef]
- Zubrick, S.; Wood, L.; Villanueva, K.P.; Wood, G.; Giles-Corti, B.; Christian, H. Nothing but Fear Itself: Parental Fear as a Determinant of Child Physical Activity and Independent Mobility; Victorian Health Promotion Foundation: Carlton, Australia, 2010; Available online: https://pdfs.semanticscholar.org/fe8e/cb16bfa6250fe465f86266334fd23e0812a4.pdf (accessed on 2 August 2024).
- Barceló, J. Fundamentals of Traffic Simulation, International Series in Operations Research & Management Science; Springer: New York, NY, USA, 2011. [Google Scholar]
- Chung, E. Transport Simulation: Beyond Traditional Approaches; CRC Press: Boca Raton, FL, USA, 2019. [Google Scholar]
- Pliakas, T.; Hawkesworth, S.; Silverwood, R.J.; Nanchahal, K.; Grundy, C.; Armstrong, B.; Casas, J.P.; Morris, R.W.; Wilkinson, P.; Lock, K. Optimising measurement of health-related characteristics of the built environment: Comparing data collected by foot-based street audits, virtual street audits and routine secondary data sources. Health Place 2017, 43, 75–84. [Google Scholar] [CrossRef] [PubMed]
- Lu, Y.; Sarkar, C.; Xiao, Y. The effect of street-level greenery on walking behavior: Evidence from Hong Kong. Soc. Sci. Med. 2018, 208, 41–49. [Google Scholar] [CrossRef] [PubMed]
- Lu, Y.; Yang, Y.; Sun, G.; Gou, Z. Associations between overhead-view and eye-level urban greenness and cycling behaviors. Cities 2019, 88, 10–18. [Google Scholar] [CrossRef]
- Chandra, S.; Bharti, A.K. Speed Distribution Curves for Pedestrians During Walking and Crossing. Procedia-Soc. Behav. Sci. 2013, 104, 660–667. [Google Scholar] [CrossRef]
- David, K.S.; Sullivan, M. Expectations for Walking Speeds: Standards for Students in Elementary Schools. Pediatr. Phys. Ther. 2005, 17, 120–127. [Google Scholar] [CrossRef] [PubMed]
- Gurusinghe, G.S.; Nakatsuji, T.; Azuta, Y.; Ranjitkar, P.; Tanaboriboon, Y. Multiple Car-Following Data with Real-Time Kinematic Global Positioning System. Transp. Res. Rec. 2002, 1802, 166–180. [Google Scholar] [CrossRef]
- Luttrell, T.; Sampson, W.; Ismart, D.; Matherly, D. Predicting Performance with Traffic Analysis Tools: Final Report, Science Applications International Corporation, United States; FHWA-HOP-08-055; Federal Highway Administration: Washington, DC, USA, 2008. Available online: https://rosap.ntl.bts.gov/view/dot/16634 (accessed on 26 June 2023).
- Bowerman, R.; Hall, B.; Calamai, P. A multi-objective optimization approach to urban school bus routing: Formulation and solution method. Transp. Res. Part A Policy Pract. 1995, 29, 107–123. [Google Scholar] [CrossRef]
- Faraj, M.F.; Sarubbi, J.F.; Silva, C.M.; Porto, M.F.; Nunes, N.T.R. A real geographical application for the school bus routing problem. In Proceedings of the 17th International IEEE Conference on Intelligent Transportation Systems (ITSC), Qingdao, China, 8–11 October 2014; pp. 2762–2767. [Google Scholar]
Disclaimer/Publisher’s Note: The statements, opinions and data contained in all publications are solely those of the individual author(s) and contributor(s) and not of MDPI and/or the editor(s). MDPI and/or the editor(s) disclaim responsibility for any injury to people or property resulting from any ideas, methods, instructions or products referred to in the content. |
© 2024 by the authors. Licensee MDPI, Basel, Switzerland. This article is an open access article distributed under the terms and conditions of the Creative Commons Attribution (CC BY) license (https://creativecommons.org/licenses/by/4.0/).