Article

Efficiency Assessment of Urban Road Networks Connecting Critical Node Pairs under Seismic Hazard

1
Department of Engineering, Telematic University Pegaso, Centro Direzionale Isola F2, 80143 Napoli, Italy
2
Department of Structural, Building and Geotechnical Engineering, Politecnico di Torino, Corso Duca degli Abruzzi, 24, 10129 Turin, Italy
3
Department of Structures for Engineering and Architecture, University of Naples “Federico II”, Via Claudio 21, 80125 Naples, Italy
*
Author to whom correspondence should be addressed.
Sustainability 2024, 16(17), 7465; https://doi.org/10.3390/su16177465
Submission received: 5 May 2024 / Revised: 8 August 2024 / Accepted: 27 August 2024 / Published: 29 August 2024

Abstract

:
Building resilient infrastructure is at the core of sustainable development, as evidenced by the UN Sustainable Development Goal 9. In fact, the effective operation of road networks is crucial and strategic for the smooth functioning of a nation’s economy. This is also fundamental from a sustainability perspective, as efficient transportation networks reduce traffic, and thus, their environmental impact. However, road networks are constantly at risk of traffic closure and/or limitations due to a plurality of natural hazards. These environmental stressors, among other factors like aging and degradation of structural materials, negatively affect the disaster resilience of both single components and the system of road networks. However, the estimation of such resilience indices requires a broad multidisciplinary vision. In this work, a framework for application to large road networks is delineated. In the proposed methodology, seismic hazard is considered, and its corresponding impacts on road networks are evaluated. The assessment encompasses not only the road network system (including squares, roads, bridges, and viaducts) but also the buildings that are located in the urban area and interact with the network. In this context, the probability that buildings will suffer seismic-induced collapse and produce partial or total obstruction of roads is considered. This scheme is designed for implementation in different geographical contexts using geo-referenced data that include information about specific risks and alternative rerouting options. The proposed methodology is expected to support the mitigation of functionality loss in road networks after disasters, contributing to both the economic and social dimensions of sustainability. To evaluate the methodology, two case studies focusing specifically on hospital-to-hospital connections were conducted in Naples and Turin, Italy. However, the proposed approach is versatile and can be extended to other critical infrastructures, such as theatres, stadiums, and educational facilities.

1. Introduction

Future generations need sustainable industrialisation and development. To this end, the United Nations’ Sustainable Development Goal (SDG) No. 9 prescribes a transition to resilient infrastructure. In this regard, there is a strong relationship between Structural Health Monitoring (SHM), Asset Management, and disaster resilience assessment at the network level. That is to say, the potential occurrence of damage in a single structure inevitably has repercussions throughout the whole network due to the need for rerouting, traffic congestion, and increased use of alternative paths (if available). This is particularly evident in the aftermath of disastrous events such as strong earthquakes and landslides [1,2,3,4]. However, this broader perspective still needs to be delineated and implemented. Indeed, while there is a large quantity of research works focusing on damage detection of single bridges and viaducts, e.g., [5,6,7,8], the post-damage assessment phases are less commonly addressed in the published scientific literature, with a few notable exceptions—see, e.g., [9], for a dedicated reading. Thus, there are not many indications for the asset owner or the regulator on how to manage the impeded infrastructure and respond to the event.
Along these lines, it is vital to ensure the functionality of assets at risk by evaluating their seismic resilience. As far as road networks (RNs) are concerned, their failure during a seismic event can lead to catastrophic outcomes, due to their central role during emergency activities that involve evacuation and relief supply. To assess their seismic resilience, not only is it important to consider their specific vulnerability [10], but the accuracy of the risk analysis must also be improved by considering the additional disruption to network performance caused by interactions with damaged objects in their vicinity [11,12]. Another crucial aspect is the recovery time [13], which typically influences decision-making on post-event rehabilitation/repair actions [14]. However, the fundamental aspect that influences the complexity of the model and, in turn, its associated computational costs is the scale of the transportation system [15].
Infrastructure assessments at a larger (regional) scale, at the network level, and/or on a portfolio of infrastructures are seldom found as well. Therefore, a multiscale holistic approach is required. Importantly, multidisciplinary approaches play a key role, as this assessment requires expertise from different engineering fields—i.e., earthquake, transportation, management, and structural engineering.
The economic and safety benefits of this approach are easily understandable. Nevertheless, the positive social impacts from a sustainability standpoint should not be underestimated.
Efficiency and sustainability share a close link, as higher efficiency naturally contributes to enhanced sustainability. This correlation is embodied in the concept of eco-efficiency, which seeks to diminish the adverse impact of human activities on the environment by increasing productivity and optimising resource utilisation [16]. The European Union’s “Sustainability and Resource Use Efficiency OP” program underscores the significance of resource efficiency for attaining sustainable growth [17]. These general concepts find specific implementations in good practices in many different industries, such as more efficient manufacturing processes, as well as water and energy management. Of course, these sustainable efficiency practices have applications in the construction and transportation industries as well. In the case of interest here, less road congestion results in lower fuel consumption and gas emissions, among other direct and indirect benefits.
In this context, this research work aims to propose indicators to measure the post-disaster efficiency of a network in the aftermath of a seismic event. More specifically, efficiency is measured according to how quickly roads within a specific urban context connect critical nodes. The proposed framework has potential applicability to a wide array of critical infrastructures within RNs, including hospitals, stadiums, theatres, public office buildings, and other facilities. This adaptability arises from an efficiency index that accounts for road travel time. Within this context, the methodology is applied to two case studies, each representing a distinct urban context featuring two prominent hospitals. In fact, this scheme is designed for implementation in different geographical contexts using geo-referenced data that includes information about specific risks and alternative rerouting options. Finally, the efficiency of the analysed RN is compared between the two different applications, and an overall discussion on the potential and limits of the proposed resilience indices is proposed.
The methodology proposed herein integrates the essential tools for evaluating the efficiency and resilience of road networks through a multidisciplinary approach, while combining the vulnerability of both transportation infrastructure and surrounding buildings and bridges. In this respect, it addresses some of the challenges outlined above. In fact, this approach addresses seismic uncertainty through a model based on Monte Carlo simulations that implements probabilistic seismic hazard while reducing computational costs by focusing on specific origin-destination pairs. It strikes an optimal balance between the high computational costs of existing models and overly simplified methods, which might fail to account for the interaction between road vulnerability, seismic hazards, and physical vulnerability.

2. Methodology

This paper proposes a framework to assess the engineering efficiency of a road network (RN). Our approach assesses the capacity of an RN and the relevant built environment to maintain its functionality after a seismic event. Simple relationships are created and examined to measure the RN efficiency with reference to seismic events, considering how these could be used in traditional urban disaster management. The uniqueness of our proposed framework lies in its independence from time and its ability to assess various factors influencing RN efficiency. Thus, RN performance is assessed both before the event and by examining the number of road segments disrupted post-earthquake while also evaluating the overall damage to buildings and bridges.
The methodology introduced in this paper is described through the framework depicted in Figure 1. This framework involves RN modelling, hazard-based seismic scenario analysis, and seismic vulnerability modelling into a comprehensive assessment of post-event RN efficiency.
RN modelling encompasses the identification of urban critical node pairs along with all possible road connections and their relevant features, including travel time. Concurrently, hazard-based seismic scenarios simulate events with different return periods and consider site-specific seismic intensities. During the seismic vulnerability modelling phase, the most critical vulnerability factors of buildings are identified, and bridge typologies are categorised. By coupling these elements, the proposed framework links the structural and transportation engineering features and provides a systematic tool for evaluating the efficiency of urban RNs during seismic events.
In the remainder of Section 2, the main phases of the methodologic framework are described.

2.1. GIS-Integrated Road Network (RN) Modelling

The RN is modelled as a QGIS-v3.38 informed graph. QGIS is a software for geographic information systems (GIS) that integrates a wide variety of data and helps one identify specific information by acquiring and georeferencing. The RN is represented by a graph composed of a discrete set of nodes and arches, the latter of which simulates roads. The network is conceptualised as the framework upon which urban services are organised. QGIS allows to precisely locate each building and bridge along the RN, also defining their typology, which is crucial for the subsequent phase of the proposed framework outlined in Figure 1, namely, the seismic vulnerability modelling of structures. Specifically, bridge typologies are classified based on the main features that mostly influence their seismic response and damage, such as the type of pier, deck, and pier-to-deck connection. Conversely, building typology classifications are limited to the height of buildings, assuming for brevity that all buildings are constructed with reinforced concrete (RC).

2.2. Hazard Analysis and Damage Assessment

After that, the RN is modelled as a graph, as shown later in Figure 2; earthquake scenarios are simulated by integrating hazard analyses with fragility models of buildings and bridges. This approach is an alternative to the use of a Ground Motion Prediction Equation (GMPE) and the selection of a past seismic event, particularly in terms of magnitude and location [18]. Specifically, two scenarios labelled Sc50 and Sc475 are defined to address seismic events with return periods T50 = 50 y and T475 = 475 y, respectively. This phase is important for assessing seismic demand in terms of peak ground acceleration, that is, a PGAdem on the structures within the RN. Thus, every simulation of an earthquake event will entail subjecting all bridges and buildings within the RN to the corresponding PGAdem. In the aforementioned graph representing the RN, each bridge and building is assigned a logic value of 1 if they meet the condition
PGAdem > PGAcap,
or 0 otherwise. In Equation (1), the seismic demand and capacity are modelled as follows:
PGAdem = µ50 exp(βA),
PGAcap = M50 exp(BA),
where A is a uniformly distributed pseudorandom scalar, µ50 and M50 are the 50th percentile of the lognormal distribution of demand and capacity, respectively, and β and B denote their standard deviations. The choice of distributions is guided by the appropriateness of the specific assets under consideration. In Section 3, the distributions developed by Moschonas et al. [19] for bridges are adopted, whereas for buildings, Rosti et al. [20] are considered. Subsequently, after each simulation, roads containing at least one structure marked with a value of 1 will be deemed disrupted, resulting in a decrease in the RN’s operational efficiency, as detailed in the subsequent paragraph.

2.3. Post-Event RN Efficiency Assessment

In the landscape of urbanisation, the efficiency of an RN plays a pivotal role in achieving the desired levels of resilience [4] and, in a sense, sustainability, for a city. Efficiency is defined as the measure of how quickly roads within a specific urban context connect critical nodes, such as hospitals. To define the efficiency of an RN, the demand for traffic flow was assumed to be rigid [21] with respect to any changes occurring in the RN due to the seismic event. Thus, for an RN consisting of n roads, the efficiency of the ith road, denoted by Ep,i, is assessed using the following formula:
Ep,i = 1tp,i/tref
where i ranges from 1 to n, tp represents the mean travel time of the ith road, and tref denotes the maximum time required to connect the two critical nodes of interest. In the application of this paper reported in Section Application and Results, tref is selected to be the time tooh, commonly referred to as out-of-hospital time [22], specifically referring to the patient transport phase. The mean travel time of the ith path within the road network is calculated as follows:
tp,i = Lp,i/vm,i,
where Lp represents the path length and vm is the mean velocity. Information on Lp and vm in Equation (5) is sourced from QGIS. When selecting between ground emergency medical services (EMS) (EMS) and helicopter EMS for transportation between two hospitals or from a hospital to any other critical node, hospital managers must decide which route offers optimal intervention for ground EMS [23,24]. To facilitate this decision-making process, tooh is defined as the maximum travel time tp,max among n suitable routes, with an additional 50% accounting for uncertainties related to fluctuating traffic conditions and road availability [22]. This is expressed as follows:
tooh = 1.5 tp,max.
Since a post-disaster assessment is carried out, the aim is to ascertain how the efficiency of the RN changes in a post-event scenario. Whenever a road is indexed with 1 digit during a simulation, indicating disruption, its efficiency Ep will be considered zero. Therefore, for a generic jth simulation, the efficiency associated with the RN, denoted as ERN, is the maximum efficiency Ep,j within the RN among the available roads marked with only 0 digits. This allows one to evaluate the changes in RN efficiency in response to seismic events.

3. Selected Case Studies

3.1. Selected Case Studies and Road Network (RN) Modelling

The selected case studies focus on the cities of Naples and Turin, Italy. While both cities have nearly one million inhabitants, Turin covers an area of 130.17 km2, whereas Naples spans 117.27 km2, resulting in a higher population density in Naples. Furthermore, the study area in Naples includes a significantly greater number of buildings integrated into the RN. For the application of the proposed framework, as outlined in Figure 1, to the selected case studies, the RNs are modelled as a QGIS-informed graph, as visually represented in Figure 2.
The overarching methodology described in Section 2 holds potential applicability to a wide array of critical infrastructures within road networks (RNs), including hospitals, stadiums, educational infrastructures, theatres, and public office buildings. This adaptability arises from an efficiency index that accounts for road travel time. Within this context, the proposed methodology is applied to urban contexts featuring two prominent hospitals. Thus, healthcare facilities are the critical nodes selected for the case studies of this paper. In this analysis of hospital urban networks, the parameter tooh is employed, which is commonly referred to as out-of-hospital time [22]. More precisely, tooh denotes a particular segment of the overall out-of-hospital time, representing the duration required by emergency medical services (EMSs) personnel to transport the patient from their location to the nearest healthcare facility.

3.2. Hazard Assessment

Concerning seismic hazard, the seismic demand PGAdem is derived from the probabilistic seismic hazard analysis conducted by the INGV [25], which provides expected PGA values for various return periods across Italy’s entire territory.
Specifically, two scenarios labelled as Sc50 and Sc475 are defined to address seismic events with return periods T50 = 50 y and T475 = 475 y, respectively. This phase is important for assessing the seismic demand in terms of peak ground acceleration, namely, a PGAdem on the structures within the RN. Thus, every simulation of the earthquake event will entail subjecting all bridges and buildings within the RN to the corresponding PGAdem.

3.3. Vulnerability Assessment

Instead, the structures’ PGA capacity, or PGAcap, is evaluated by adopting the fragility curves documented in Moschonas et al. [19] for bridges and Rosti et al. [20] for buildings. This process enables the determination of the damage state (DS) incurred by each structure. In this context, it is important to meticulously define the practical implications of each DS, as exceeding a certain DS threshold could lead to the road’s interruption. Specifically, regarding bridges, Moschonas et al. [19] In addition to the no-damage state (DS0), they used four DSs: minor/slight (DS1), moderate (DS2), major/extensive (DS3), and failure/collapse (DS4). To interpret these DSs comprehensively, Moschonas et al. drew upon various studies, including those by Choi et al. [26], Erduran and Yakut [27], and Basöz et al. [28]. Concerning RC buildings, Rosti et al. [20] defined five DSs in accordance with the EMS-98 macroseismic scale [29]. These DSs correspond to the following levels of damage to vertical structures: no damage (DS0), insignificant to negligible damage (DS1), considerable to serious damage (DS2), very serious damage (DS3), partial collapse (DS4), and collapse (DS5). After meticulous evaluation, the authors have determined that reaching a PGA capacity corresponding to an intermediate DS between DS1 and DS2 is adequate to trigger road interruption in the case of Scenario Sc50 with a return period Tr = 50 y. Conversely, reaching DS3 would lead to road interruption in the case of Scenario Sc475 with a return period Tr = 475 y.

4. Application of the Proposed Methodology to the Selected Case Studies

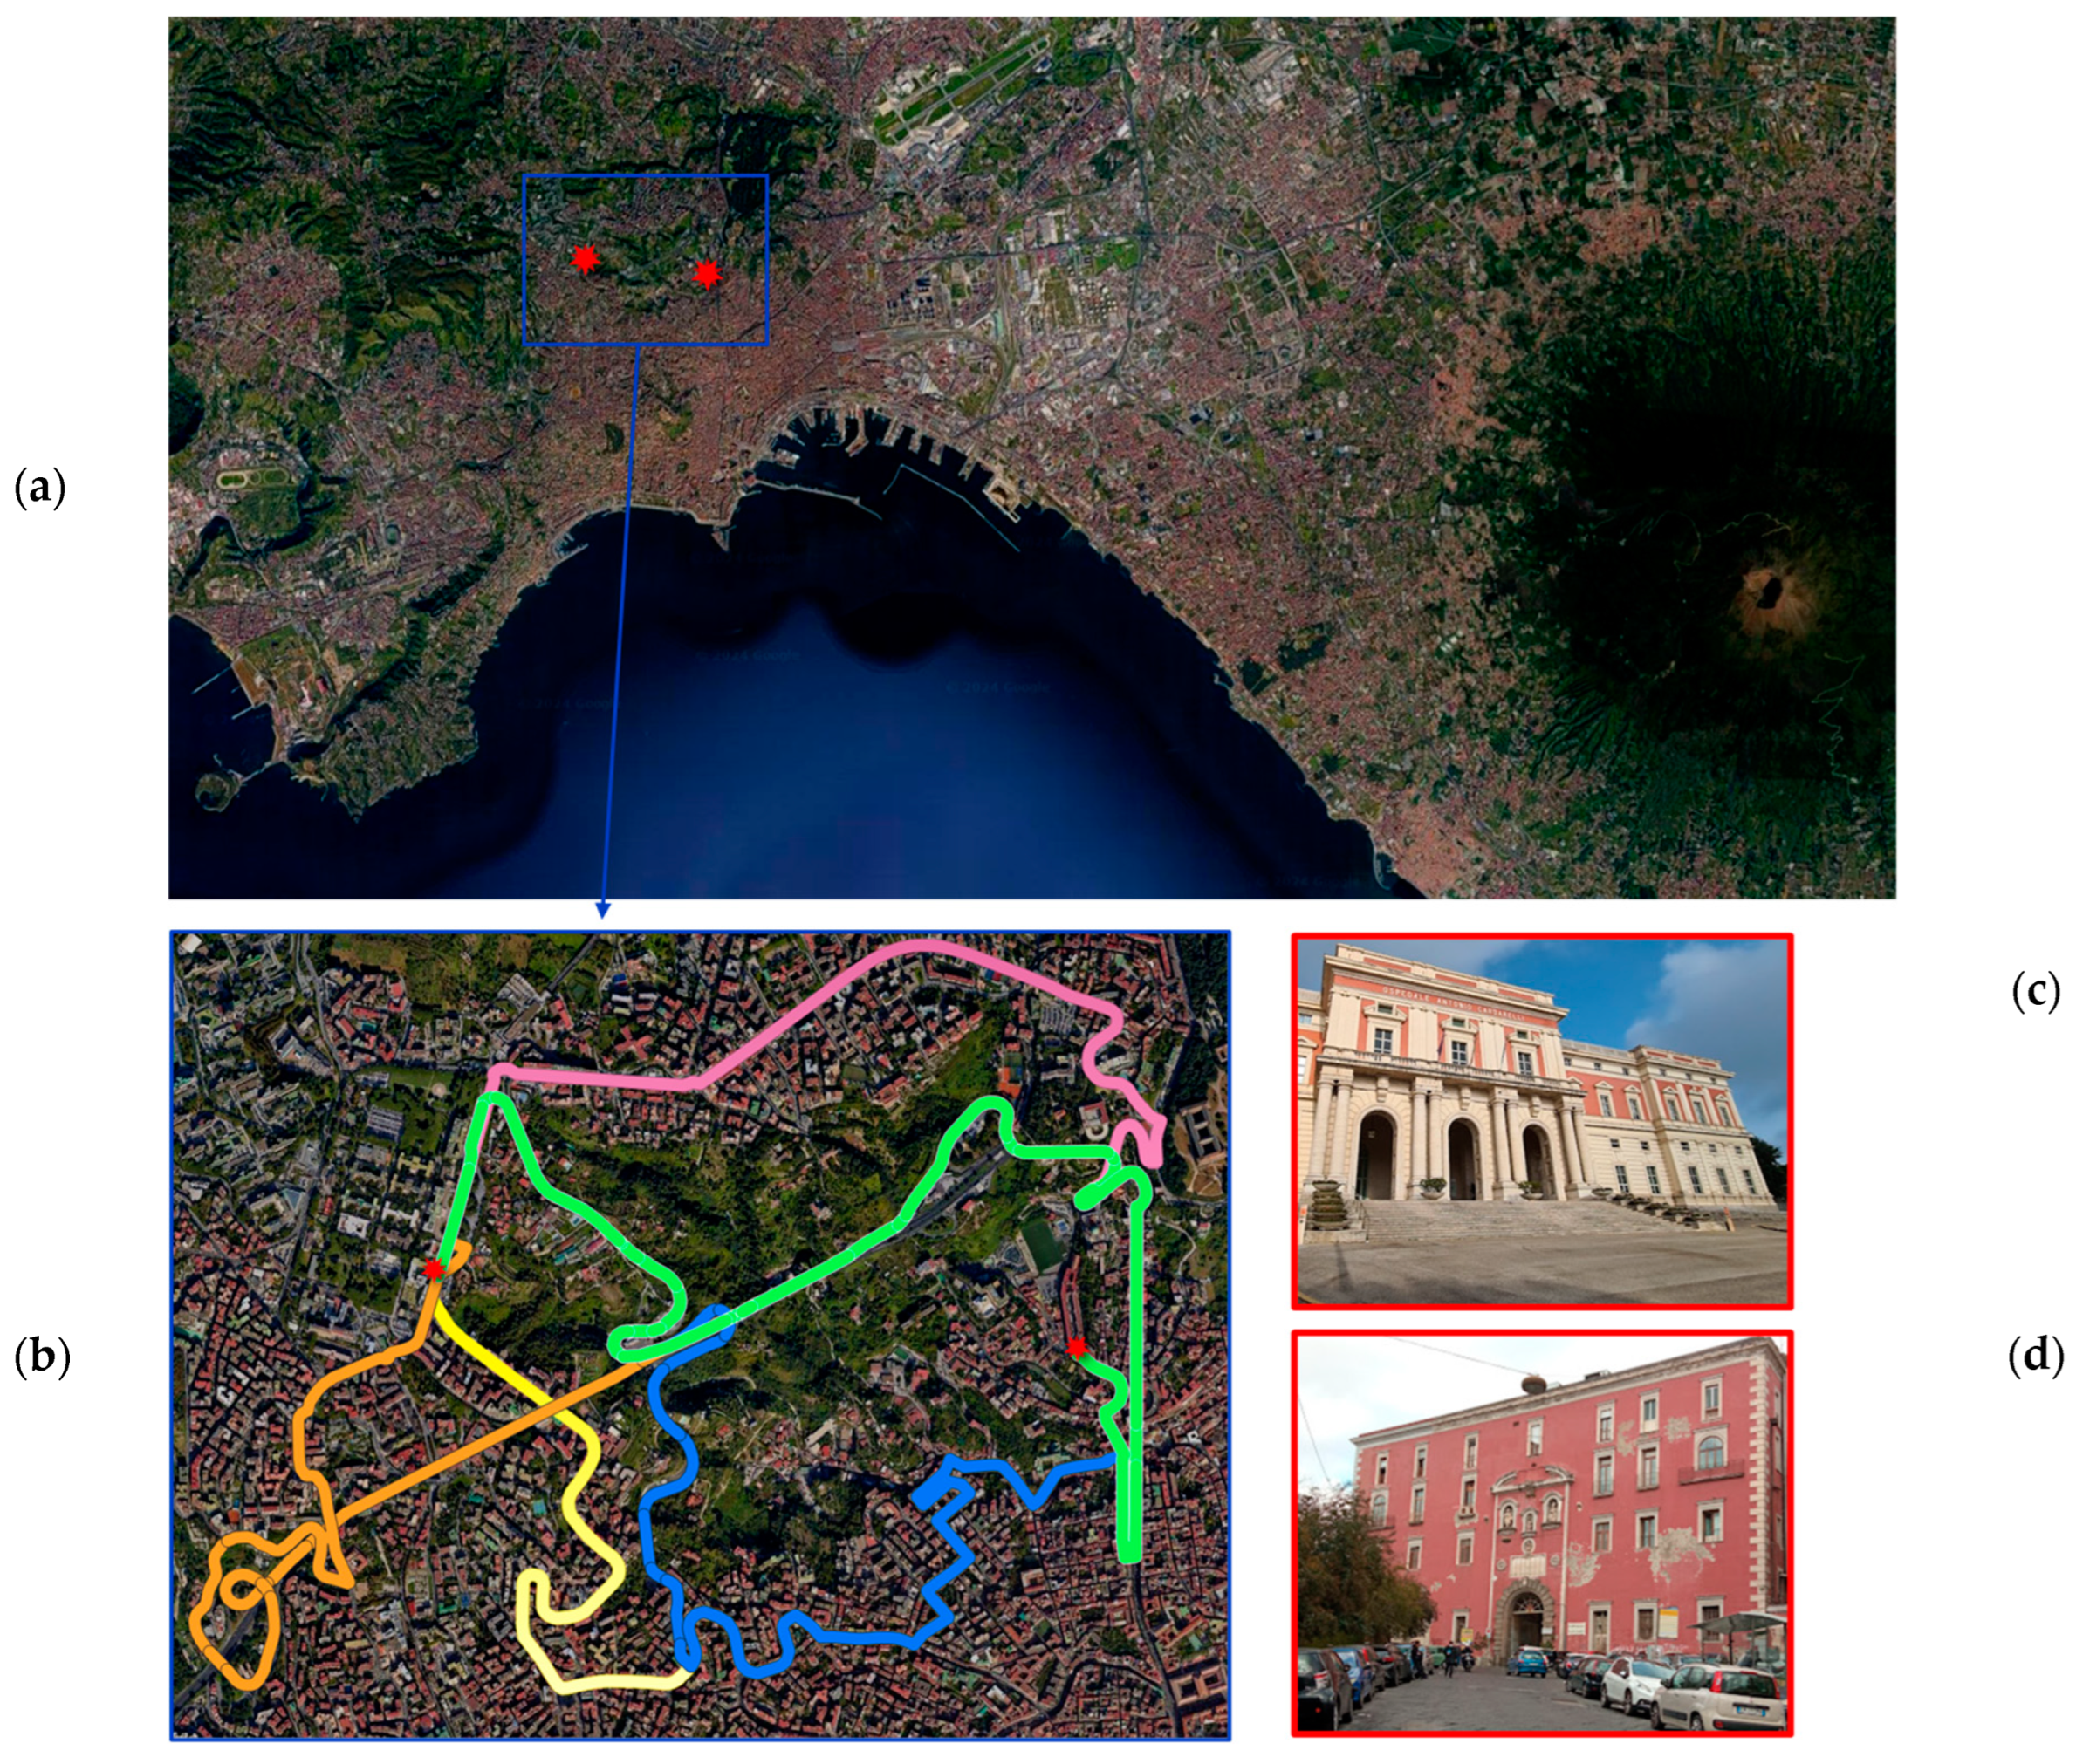
4.1. Case Study #1: Hospital-to-Hospital Connections in Naples, Italy

The hilly area of Naples named ‘Area collinare di Napoli’, as depicted in Figure 3b, is a densely populated region in the southern Italian city of Naples. This area is mostly dominated by residential neighbourhoods, so it provides homes to a significant portion of the city’s population. It is also worth noting that this area of Naples hosts critical healthcare facilities, including the two hospitals that serve as critical nodes in this study, as depicted in Figure 3c,d. The entire area is identified via QGIS and is depicted in Figure 3.
The seismic exposure of the area depicted in Figure 3b is characterised by the following features. The green, blue, and orange paths traverse both the urban area and segments of the beltway of Naples, i.e., the Tangenziale di Napoli, an extra-urban road. More specifically, the area contains six bridges and 90 buildings along the green path, three bridges and 199 buildings along the blue path, and six bridges and 74 buildings along the orange path. Conversely, the pink and yellow paths solely traverse urban areas, including one bridge, 154 buildings, and 280 buildings with no bridges (Figure 4).
The seismic capacity of bridges located along the above-mentioned paths is detailed in Table 1 in terms of their fragility curve parameters, which are the median and standard deviation of PGAcap, as available in the literature [19].
The proposed framework depicted in Figure 1 is implemented for the RN relevant to the city of Naples through the methodology described in Section 2. Specifically, after Nsim simulations of the seismic event, the post-event efficiency is assessed through Equation (4). Then, since a certain degree of uncertainty is considered in this study according to Equations (2) and (3), it is necessary to estimate the number of simulations after which the value of efficiency is stable (convergence analysis). To do this, the mean and standard deviation of the assessed efficiency index are evaluated as follows:
E m = j = 1 N s i m E p , j N s i m
E s t d = j = 1 N s i m ( E p , j E p , m ) 2 N s i m 1 / 2
where Ep,j is the maximum post-event efficiency among the roads that are still available, as indicated in Section 2.3, and Nsim is the total number of simulations. The values of Equations (7) and (8) for Scenario Sc475 are depicted in Figure 5.
The mean of the efficiency index stabilises after about 1000 simulations at approximately Em = 0.2. The maximum value of the pre-event efficiency ERN,max of the RN is higher than 0.4. This means that according to our model, a seismic scenario with a return period of Tr = 475 years would cause an efficiency reduction of about 50% in the RN.
With regard to Scenario Sc50, corresponding to a return period of 50 years, the values from Equations (7) and (8) are illustrated in Figure 6.
The mean efficiency index stabilises at around Em = 0.37 after approximately 1000 simulations. The maximum efficiency value ERN,max prior to the seismic event, exceeds 0.4. This indicates that, as per our model simulating a seismic scenario with a return period Tr = 50 y, the efficiency of the RN results in an approximately 8% reduction. Note that when adding the standard deviation to the mean of the efficiency, one creates a confidence interval, which in this case exceeds the ERN,max. Obviously, in this case, the upper-bound efficiency value must be the maximum efficiency value ERN,max.

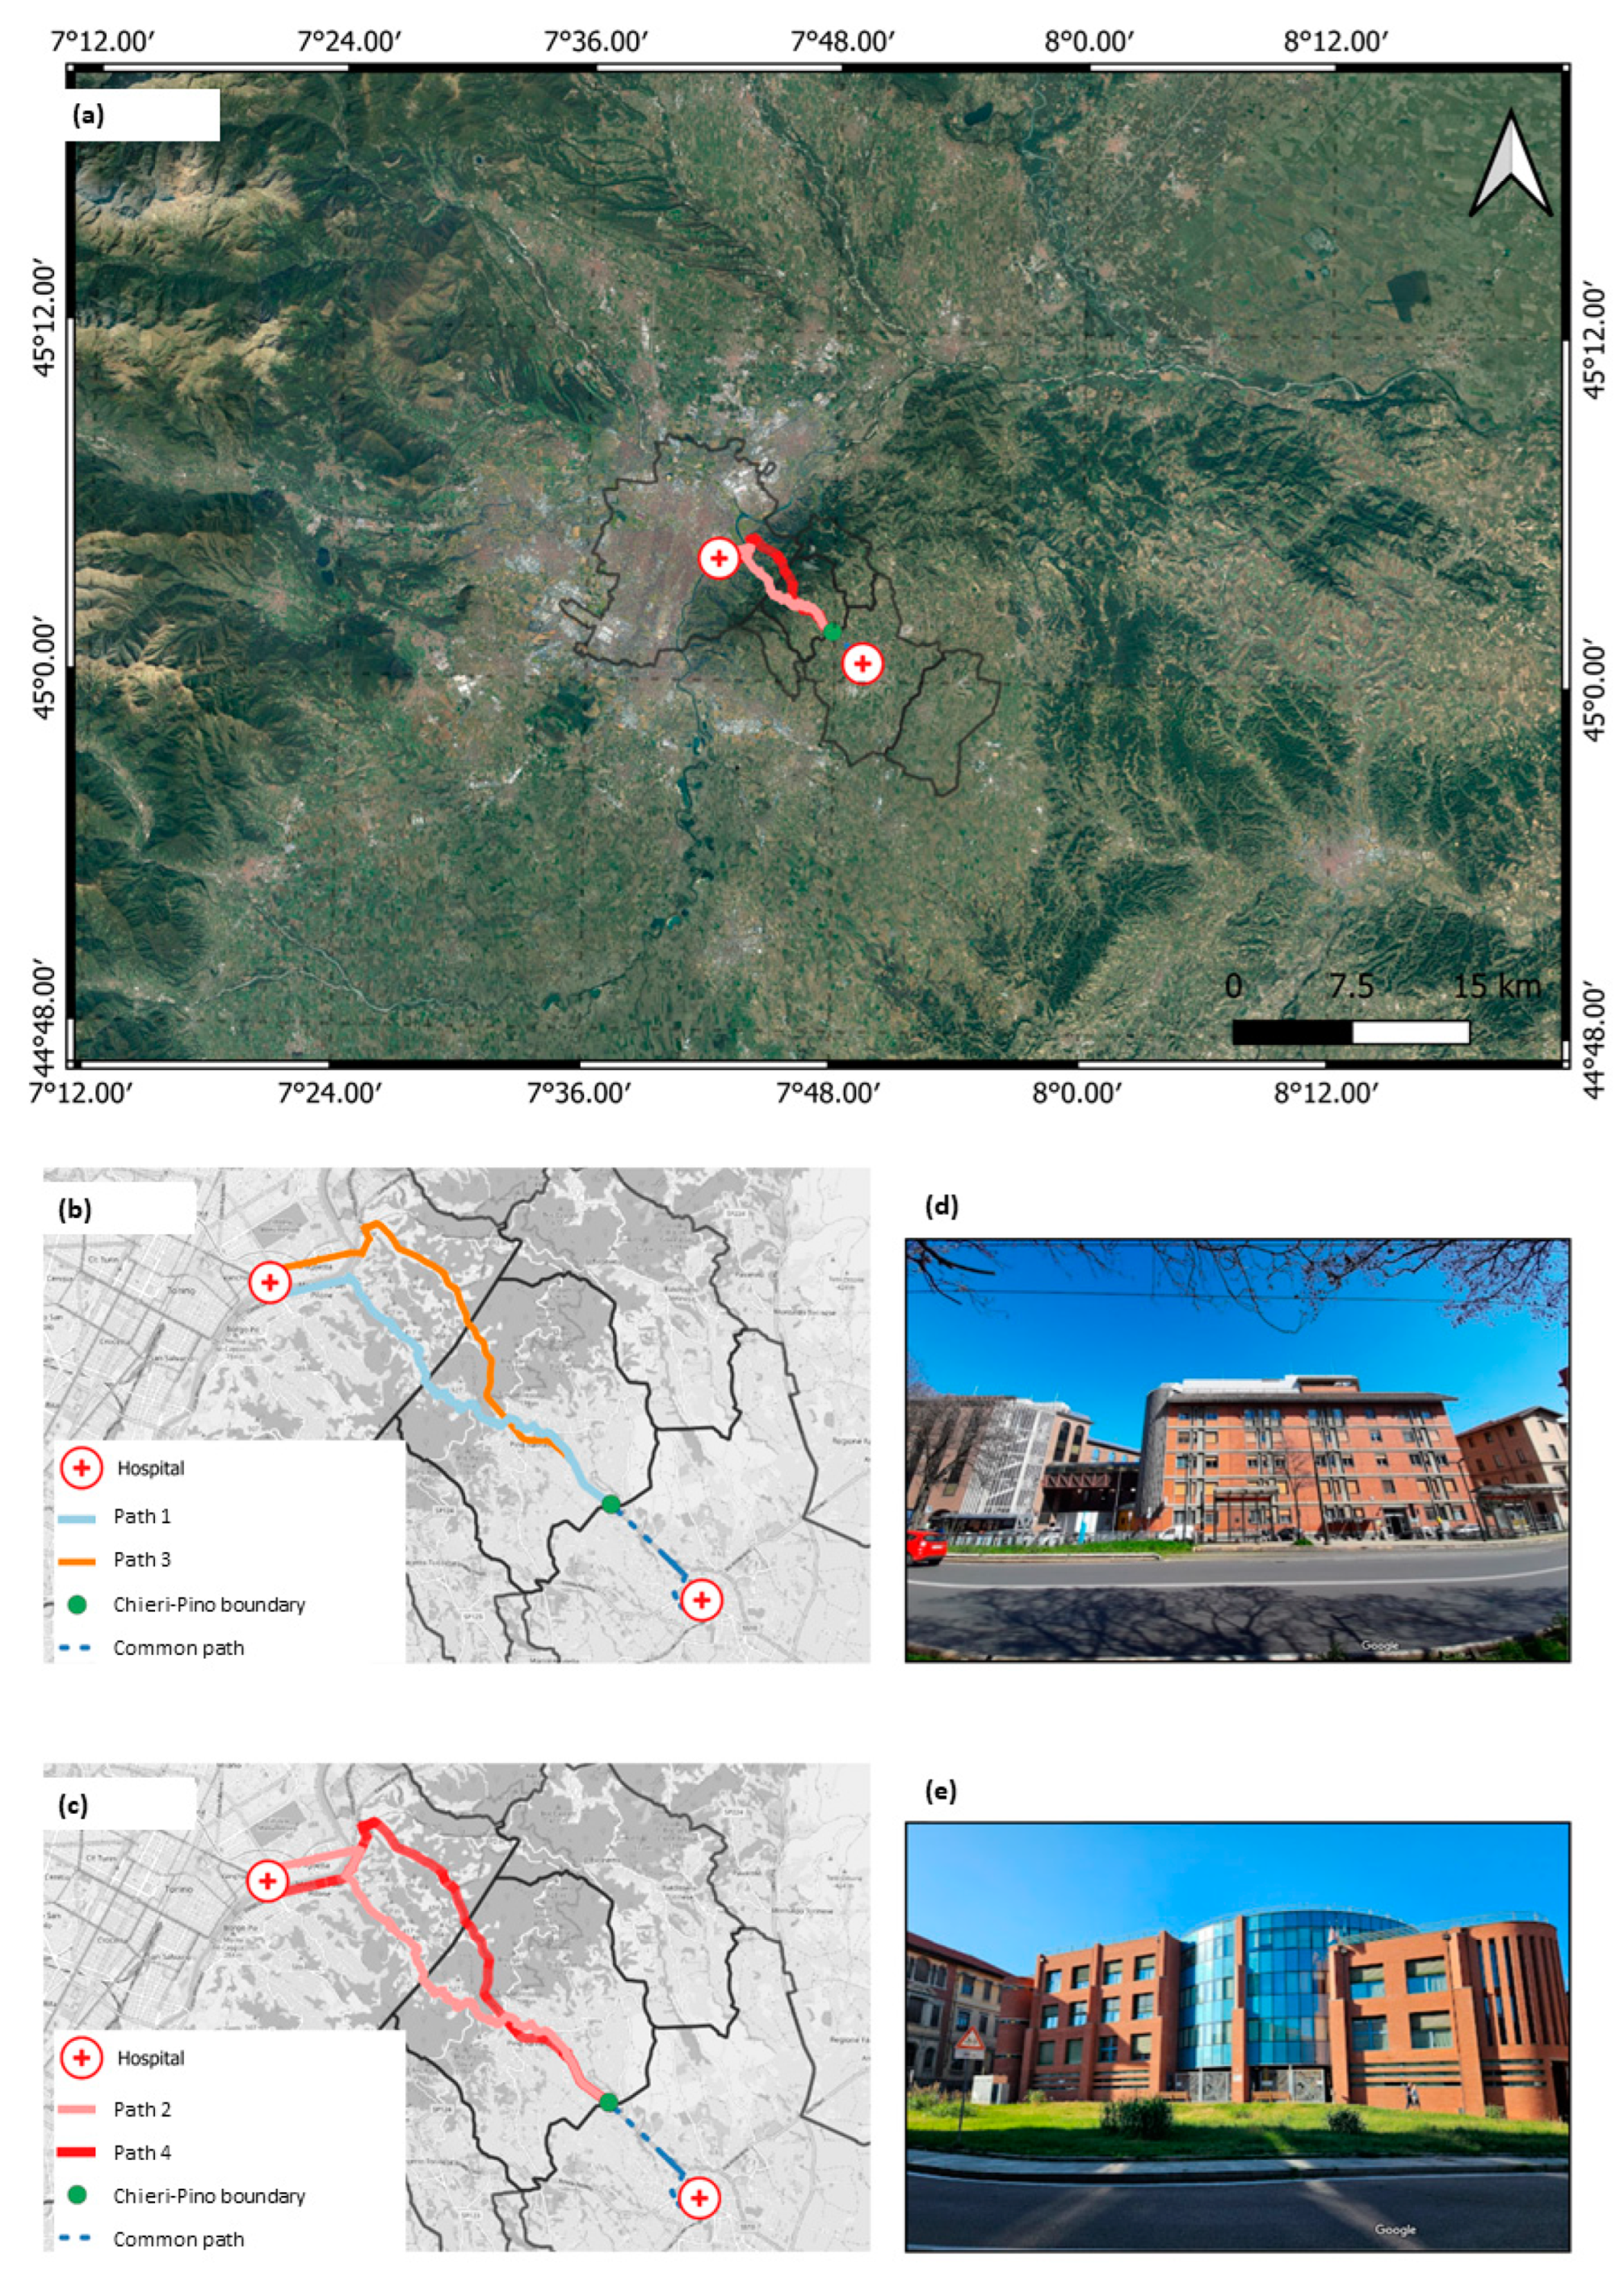
4.2. Application #2: Hospital to Critical Node Connection in Turin, Italy

The second case study, depicted in Figure 7, is located in the northwestern Italian region of Piemonte. Unlike Application #1, this revolves around a major suburban road named the Strada Statale (SS) 10. Notably, the SS10 Padana Inferiore begins in Turin and ends in the Veneto region. Thus, more specifically, the roadway segment of interest here runs from the outskirts of Turin, in the Sassi and Reaglie neighbourhoods, to the municipality boundary between Pino Torinese and Chieri. This area encompasses a portion of the Collina Torinese (Turin Hills). From a road network perspective, the SS10 represents the main connection between the city of Turin and the other towns located on its southeast side.
The selected SS10 segment includes a total of 14 infrastructures, namely, 13 viaducts (including one overpass) and one tunnel. The latter represents the main tunnel in the greater Turin area. Built between 1949 and 1956, that tunnel is a classic example of post-war infrastructure, excavated to facilitate the movement of people and goods from Turin to Asti. All viaducts, except for the overpass, were built in the same period, and except for one short-span monolithic RC block, they share the same structural configuration: a simply supported girder deck with four longitudinal prestressed RC girders. Due to interference with a secondary road known as ‘Strada Tetti Bertoglio’, the aforementioned overpass on the SS10 road is an RC bridge with a longer central span and two much shorter lateral spans.
In contrast to an urban environment, there are fewer options for transportation between points in such a road network. Among the secondary routes that can be used, the main alternative, by far, is the road named Corso Torino on the Pino Torinese side and Corso Chieri on the Turin side. This is also well-known among the locals as the Strada del Pino Vecchio, or old road through Pino Torinese, in contrast with the SS10, colloquially named Strada del Pino Nuovo. Importantly, this older road passes through the historical centre of Pino Torinese, a very small but relatively densely populated village, and moves across the hills overpassing the tunnel, following the natural turns of the hill slopes without encountering any bridge on its full length.
The four paths considered here encompass the main option for a driver move from the starting point (Pino Torinese-Chieri boundary) to the endpoint (Gradenigo Hospital).
Importantly, the critical connection representing the southern point can be seen as indicative of a hospital-to-hospital route—as in the case of Application #1—minus a time constant. That is to say, all traffic moving from Chieri Hospital (Figure 7c) to Gradenigo Hospital in Turin (Figure 7d) would need to follow the same road, regardless of the four optional paths, up to this point. The four paths begin to diverge only after the critical node. For this reason, this shared road segment (indicated by the dashed line in Figure 7) did not affect the comparison between the four options; therefore, it was not considered in the calculations.
The first option available to the driver is to follow SS10, passing through the road tunnel and the series of viaducts described above. The second option is to bypass them through an older route. Then, coming from SS10 or Corso Chieri into the Sassi neighbourhood, the driver must cross the Po River. Again, the two chokepoints limit the possible routes. One can cross the Po River into Corso Belgio (using the so-called Ponte Sassi Bridge, a historical multi-span RC arch bridge) and then pass through the Vanchiglia and Vanchiglietta neighbourhoods. Alternatively, one can use the Corso Regina Margherita Bridge, which is directly in Vanchiglia. The latter bridge, shown in Figure 8, represents the most important infrastructure along the way. This infrastructure is an RC arch bridge built between 1970 and 1972, designed with the extensive use of post-tensioned DYWIDAG cables. It is also subjected to high daily traffic loads, with an average daily traffic of 2715 vehicles.
Therefore, Path 1—coloured in light blue in Figure 7b—includes only one bridge, i.e., Corso Regina Margherita Bridge (hereinafter, V1-T), and 384 adjacent buildings the collapse of which may produce road disruption. Path 2—which is coloured in pink in Figure 7c—includes only one bridge as well, i.e., Ponte Sassi Bridge (code-named V2-T here) but more buildings than Path 1 (specifically, 445 buildings). Paths 3 and 4, in orange and red, respectively, in Figure 7b,c, add to these 13 viaducts located on SS10 (V3-T to V15-T). Path 3 (ss10 then Ponte Sassi Bridge) includes 310 buildings in total, while Path 4 (ss10 plus Corso Regina Margherita Bridge), which includes a longer detour to cross Po River
As per Application #1, Table 2 briefly describes the bridges involved in the paths of interest. The two river crossing bridges, as well as the first nine viaducts of SS 10 (V3-T to V15-T), are managed by the Municipality of Turin. The other four viaducts of SS 10 (V12-T to V15-T) are included in the boundaries of the Pino Torinese municipality area. As mentioned, only one viaduct (V8-T) is not an infrastructure of the actual paths but rather an overpass due to the intersection of SS 10 with a secondary road. This has been included since its potential collapse would nevertheless cause traffic interruption in the path below. The Municipality of Turin performed reinforcement interventions on seven SS 10 viaducts (V3-T to V7-T, V9-T, and V10-T) from 2012 to 2020, with the replacement of longitudinal girders.
The same fragility curves were assigned to all the viaducts with similar structural typology, independently of the number of spans. This assumption is consistent with the study by Moschonas et al. [19], who did not provide fragility curves based on these geometrical parameters, and with the multi-hazard loss estimation methodology known as HAZUS [30], which again does not present a substantial difference between single- and multi-span variants of the same structural typology.
On the one hand, one can notice that due to the several (yet small) water crossings throughout the whole length of the Collina Torinese, Application #2 includes many more bridges than its #1 counterpart. Furthermore, it presents two antithetical cases: the Pino Nuovo option (i.e., SS10, shared by Paths 3 and 4), where almost all the infrastructure is located, and the Pino Vecchio option (Paths 1 and 2), with no bridges, except for the Po River crossing. Conversely, the seismic hazard in this geographical area is much lower than that in Naples. The methodology follows what has already been discussed in Section 2 and Section 3.1, resulting in the graphs depicted in Figure 9 and Figure 10, representing—in the same order—return periods of 475 and 50 years.
As already highlighted in the previous case study, the upper-bound efficiency value exceeds the maximum efficiency value ERN,max, i.e., the solid red line in Figure 9 and Figure 10, corresponding to ERN = 0.64. This upper boundary represents the maximum efficiency within the road network (RN) among the available roads marked with only 0 digits, i.e., the roads that are still available after the seismic event.
In the first case, the mean efficiency index stabilises around Em = 0.55 after less than 1000 simulations. The maximum efficiency value prior to the seismic event is ERN,max = 0.64. By contrast, under Tr = 50 y, the proposed approach returns Em = 0.45 (at convergence). As previously mentioned, this should be compared with ERN,max = 0.64. In conclusion, these two hypothetical scenarios (with Tr = 475 y and Tr = 50 y) would induce an efficiency reduction of approximately 14% and 30%, respectively.

5. Discussion

The key findings of this study can be summarised as follows:
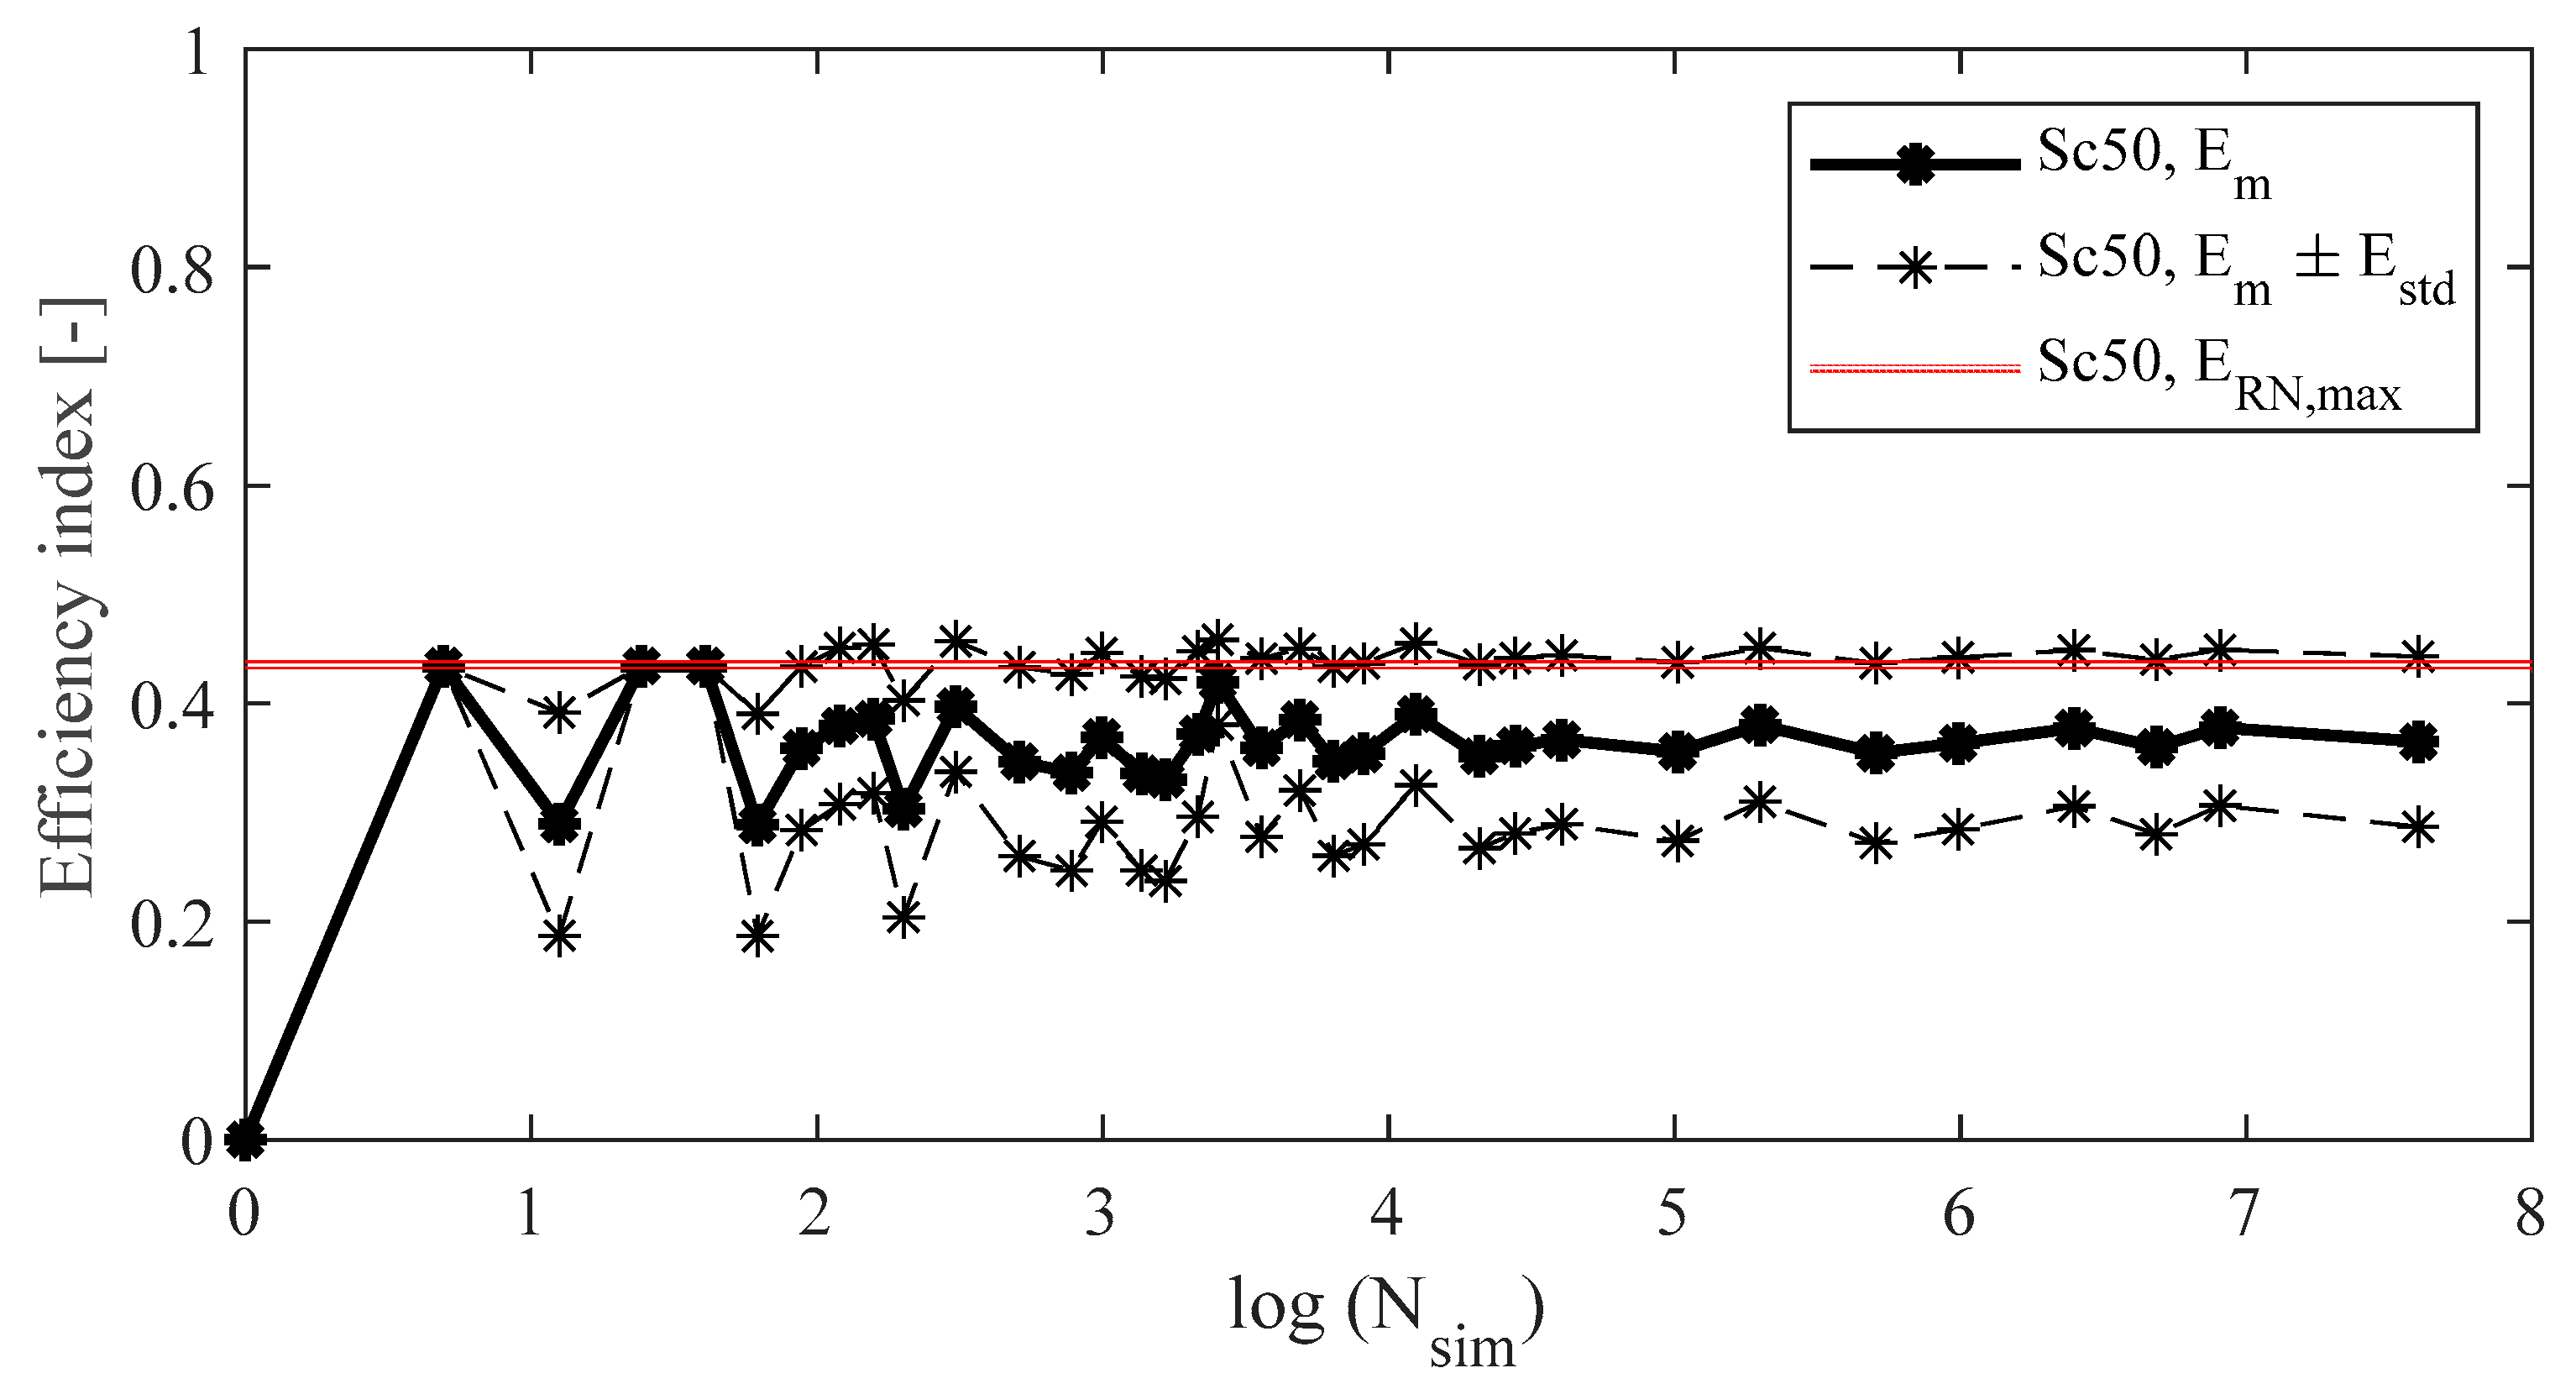
  • Application #1 has highlighted that the selected seismic scenarios can produce a reduction in road network efficiency. Specifically, the RN of Application #1 has proven to be very effective, especially against the scenario with Tr = 50y. In fact, while an efficiency reduction of 50% would occur in the case of a Tr = 475 y seismic event, only a very slight decrease in the efficiency would occur for a Tr = 50 y event. This is because, according to our simulations, more road disruptions of beltway segments (Tangenziale di Napoli) would occur in the case of an event with a return period of 475 years.
  • Application #2 has remarked on the potentially huge consequences of the selected earthquake scenarios. Two paths on SS10 were investigated, finding that, in the event of an interruption of the main route, the secondary road alternative (i.e., Pino Vecchio) may not be able to redistribute traffic, with potential traffic congestion and disruptions for all mobility services. Even if potentially less impactful, in the event of interruption of one of the two strategic crossings on the Po River (i.e., Corso Regina Margherita Bridge or Ponte Sassi Bridge), the traffic rerouted on the remaining crossing would still be very compromising in the case of emergency hospital-to-hospital transports.
As a partially unexpected finding, the results of Sc475 and Sc50 in Application #2 highlighted that, on the one hand, the first scenario (Tr = 475 y) shows a much less severe decrease than that observed in Application #1, where Em was halved. On the contrary, the second scenario (Tr = 50 y) is quite interesting since, unlike in Application #1, in Application #2, the decrease is larger (more than doubled) for Sc50 than for Sc475. Furthermore, in general terms, it is much higher than that encountered in Application #1 (more than 3.5 times). These findings can be explained by the fact that the two simulations considered the occurrence of two specific seismic events, Sc50 and Sc475, but also the corresponding relevant damage states (DSs), that is, an intermediate DS between DS1 and DS2 for Sc50 and DS3 for Sc475.
From this perspective, the conclusions drawn from the two case studies underscore the variability in the RN efficiency under different seismic scenarios. In fact, in Application #1, the RN can sustain its efficiency under moderate seismic activity but suffers significant disruptions in more severe scenarios. On the other hand, Application #2 indicates the possibility of a severe drop in efficiency when key routes are obstructed by a moderate seismic event. In this sense, it must be remarked that the proposed approach is intended for the evaluation of RN resilience in the immediate aftermath of seismic events: in the medium and long term, heavier damage (DS3) will require more time to be dealt with, while more moderate damage states (DS1 and DS2) can be taken care of more rapidly. However, in the first hours after the event, when transportation to hospitals is more urgent, the practical effects of road disruption are basically identical for the two circumstances. This explains why a smaller magnitude seismic event could be more consequential than a larger one in some cases, where moderate damage (DS1 and DS2) can affect the efficiency even more significantly than severe damage (DS3).

6. Conclusions

In recent years, there has been a rapidly growing interest in disaster resilience and the sustainability of road networks (RNs). This critical issue is not limited to structural engineers, since it has practical implications for urban planners and policymakers. However, despite the vast scientific literature on Structural Health Monitoring and structural integrity assessment at the single bridge level, there remains a notable lack of established methodologies and essential tools for network-level assessment.
This study addresses this gap by examining the RN efficiency before and after a significant natural event, more specifically, T50 = 50 y and T475 = 475 y earthquakes.
In further detail, the proposed methodology considers RN efficiency in terms of how quickly roads within an urban or extra-urban area connect to critical nodes. This is achieved by incorporating an efficiency index based on road travel time. The scheme utilises geo-referenced data, including information about alternative rerouting options. It also accounts for several seismic-related risks such as direct damage to RNs (collapsed bridges) or indirect effects (nearby buildings collapsing on the RN and obstructing it).
The proposed framework is highly adaptable and applicable to a wide array of critical structures within RNs, including, amongst others, schools, public office buildings, emergency facilities, or, as in the specific case discussed here, hospitals. In this work, the methodology has been demonstrated through two case studies, each featuring two major hospitals. In an emergency situation, such as in the immediate post-earthquake aftermath, such facilities would represent critical assets for which the minimum possible travel time must be guaranteed.
The two RNs have been purposefully chosen to complement each other. The first is in a highly populated urban area, which is more subject to seismic risk, while the second connects two urban areas through a rural, hilly countryside with a lower expected seismic hazard. These different contexts demonstrate the implementability of the overarching concept in diverse geographical settings.
Future work will expand the proposed method to include other seismic- and non-seismic-related risks such as rainfall and earthquake-induced landslides. The concept will also be validated for different geographic areas, such as flood-prone terrains, and infrastructure types, e.g., road tunnels, in the risk analysis.
All of these research efforts will help improve future planning and disaster management practices, which currently need a more holistic view that brings together structural and transportation perspectives.

Author Contributions

Conceptualisation, A.M., M.C., V.D.B., B.C., F.P. and A.P.; methodology, A.M., M.C., F.A. and F.P.; software, F.A.; validation, A.M., M.C. and F.A.; formal analysis, A.M., M.C. and F.A.; investigation, A.M., M.C. and F.A.; resources, B.C. and A.P.; writing—original draft preparation, A.M., M.C. and F.A.; writing—review and editing, V.D.B., F.P., B.C. and A.P.; supervision, V.D.B., B.C., F.P. and A.P.; funding acquisition, B.C. and A.P. All authors have read and agreed to the published version of the manuscript.

Funding

This study was carried out within the MOST—Sustainable Mobility National Research Center and received funding from the European Union Next-Generation EU (PIANO NAZIONALE DI RIPRESA E RESILIENZA (PNRR)—MISSIONE 4 COMPONENTE 2, INVESTIMENTO 1.4—D.D. 1033 17/06/2022, CN00000023), specifically for Spoke 7 WP4 ‘resilience of networks, structural health monitoring and asset management’.

Institutional Review Board Statement

Not applicable.

Informed Consent Statement

Not applicable.

Data Availability Statement

The original contributions presented in the study are included in the article; further enquiries can be directed to the corresponding author/s.

Acknowledgments

The Authors would like to express their gratitude to Filippo Dringoli, Cesare Cilvini, Davide Petralia, and Amirmohamad Parvanehdehkordi for their support in the early stages of this research work. Also, the Authors acknowledge the support from Divisione Infrastructure e Mobilità–Servizio Ponti, Vie d’Acqua e Infrastrutture of Comune di Torino, in particular Barbara Salza, for providing the information regarding the infrastructures located on SS10.

Conflicts of Interest

The authors declare no conflicts of interest.

References

  1. Zhou, Y.; Wang, J.; Sheu, J.-B. On connectivity of post-earthquake road networks. Transp. Res. E Logist. Transp. Rev. 2019, 123, 1–16. [Google Scholar] [CrossRef]
  2. Kilanitis, I.; Sextos, A. Impact of earthquake-induced bridge damage and time evolving traffic demand on the road network resilience. J. Traffic Transp. Eng. (Engl. Ed.) 2019, 6, 35–48. [Google Scholar] [CrossRef]
  3. Wu, Y.; Hou, G.; Chen, S. Post-earthquake resilience assessment and long-term restoration prioritization of transportation network. Reliab. Eng. Syst. Saf. 2021, 211, 107612. [Google Scholar] [CrossRef]
  4. Bozza, A.; Asprone, D.; Parisi, F.; Manfredi, G. Alternative Resilience Indices for City Ecosystems Subjected to Natural Hazards. Comput. -Aided Civ. Infrastruct. Eng. 2017, 32, 527–545. [Google Scholar] [CrossRef]
  5. Tronci, E.M.; Beigi, H.; Feng, M.Q.; Betti, R. A transfer learning SHM strategy for bridges enriched by the use of speaker recognition x-vectors. J. Civ. Struct. Health Monit. 2022, 12, 1285–1298. [Google Scholar] [CrossRef]
  6. Palmisano, F.; Asso, R.; Chiaia, B.; Marano, G.C.; Pellegrino, C. Structural assessment of existing R.C. half-joint bridges according to the new Italian guidelines. J. Civ. Struct. Health Monit. 2023, 13, 1551–1575. [Google Scholar] [CrossRef]
  7. Martucci, D.; Civera, M.; Surace, C. Bridge monitoring: Application of the extreme function theory for damage detection on the I-40 case study. Eng. Struct. 2023, 279, 115573. [Google Scholar] [CrossRef]
  8. Zinno, R.; Haghshenas, S.S.; Guido, G.; VItale, A. Artificial Intelligence and Structural Health Monitoring of Bridges: A Review of the State-of-the-Art. IEEE Access 2022, 10, 88058–88078. [Google Scholar] [CrossRef]
  9. Caldera, S.; Mostafa, S.; Desha, C.; Mohamed, S. Exploring the Role of Digital Infrastructure Asset Management Tools for Resilient Linear Infrastructure Outcomes in Cities and Towns: A Systematic Literature Review. Sustainability 2021, 13, 11965. [Google Scholar] [CrossRef]
  10. Argyroudis, S.; Fotopoulou, S.; Pitilakis, K. Semi-Empirical Assessment of Road Vulnerability to Seismically Induced Slides. In Landslide Science and Practice; Springer: Berlin/Heidelberg, Germany, 2013; pp. 321–326. [Google Scholar] [CrossRef]
  11. Byun, J.-E.; D’Ayala, D. Urban seismic resilience mapping: A transportation network in Istanbul, Turkey. Sci. Rep. 2022, 12, 8188. [Google Scholar] [CrossRef]
  12. Argyroudis, S.; Selva, J.; Gehl, P.; Pitilakis, K. Systemic Seismic Risk Assessment of Road Networks Considering Interactions with the Built Environment. Comput. -Aided Civ. Infrastruct. Eng. 2015, 30, 524–540. [Google Scholar] [CrossRef]
  13. Capacci, L.; Biondini, F.; Frangopol, D.M. Resilience of aging structures and infrastructure systems with emphasis on seismic resilience of bridges and road networks: Review. Resilient Cities Struct. 2022, 1, 23–41. [Google Scholar] [CrossRef]
  14. Sun, L.; D’Ayala, D.; Fayjaloun, R.; Gehl, P. Agent-based model on resilience-oriented rapid responses of road networks under seismic hazard. Reliab. Eng. Syst. Saf. 2021, 216, 108030. [Google Scholar] [CrossRef]
  15. Pan, S.; Yan, H.; He, J.; He, Z. Vulnerability and resilience of transportation systems: A recent literature review. Phys. A Stat. Mech. Its Appl. 2021, 581, 126235. [Google Scholar] [CrossRef]
  16. Borza, M. The Connection between Efficiency and Sustainability—A Theoretical Approach. Procedia Econ. Financ. 2014, 15, 1355–1363. [Google Scholar] [CrossRef]
  17. European Commission Sustainability and Resource Use Efficiency OP, 2021–2027. Available online: https://ec.europa.eu/regional_policy/in-your-country/programmes/2014-2020/pt/2014pt16cfop001_en (accessed on 4 April 2024).
  18. Miano, A.; Jalayer, F.; Forte, G.; Santo, A. Empirical fragility assessment using conditional GMPE-based ground shaking fields: Application to damage data for 2016 Amatrice Earthquake. Bull. Earthq. Eng. 2020, 18, 6629–6659. [Google Scholar] [CrossRef]
  19. Moschonas, I.F.; Kappos, A.J.; Panetsos, P.; Papadopoulos, V.; Makarios, T.; Thanopoulos, P. Seismic fragility curves for greek bridges: Methodology and case studies. Bull. Earthq. Eng. 2009, 7, 439–468. [Google Scholar] [CrossRef]
  20. Rosti, A.; Del Gaudio, C.; Rota, M.; Ricci, P.; Di Ludovico, M.; Penna, A.; Verderame, G.M. Empirical fragility curves for Italian residential RC buildings. Bull. Earthq. Eng. 2021, 19, 3165–3183. [Google Scholar] [CrossRef]
  21. Bellei, G.; Gentile, G.; Meschini, L.; Papola, N. A demand model with departure time choice for within-day dynamic traffic assignment. Eur. J. Oper. Res. 2006, 175, 1557–1576. [Google Scholar] [CrossRef]
  22. Spaite, D.W.; Valenzuela, T.D.; Meislin, H.W.; Criss, E.A.; Hinsberg, P. Prospective validation of a new model for evaluating emergency medical services systems by in-field observation of specific time intervals in prehospital care. Ann. Emerg. Med. 1993, 22, 638–645. [Google Scholar] [CrossRef]
  23. Lerner, E.B.; Billittier, A.J.; Sikora, J.; Moscati, R.M. Use of a Geographic Information System to Determine Appropriate Means of Trauma Patient Transport. Acad. Emerg. Med. 1999, 6, 1127–1133. [Google Scholar] [CrossRef]
  24. Chen, X.; Gestring, M.L.; Rosengart, M.R.; Billiar, T.R.; Peitzman, A.B.; Sperry, J.L.; Brown, J.B. Speed is not everything: Identifying patients who may benefit from helicopter transport despite faster ground transport. J. Trauma Acute Care Surg. 2018, 84, 549–557. [Google Scholar] [CrossRef] [PubMed]
  25. INGV—Istituto Nazionale di Geofisica e Vulcanologia I dati Online della Pericolosità Sismica in Italia. Available online: http://esse1.mi.ingv.it/ (accessed on 4 April 2024).
  26. Choi, E.; DesRoches, R.; Nielson, B. Seismic fragility of typical bridges in moderate seismic zones. Eng. Struct. 2004, 26, 187–199. [Google Scholar] [CrossRef]
  27. Erduran, E.; Yakut, A. Drift based damage functions for reinforced concrete columns. Comput. Struct. 2004, 82, 121–130. [Google Scholar] [CrossRef]
  28. Basöz, N.I.; Kiremidjian, A.S.; King, S.A.; Law, K.H. Statistical Analysis of Bridge Damage Data from the 1994 Northridge, CA, Earthquake. Earthq. Spectra 1999, 15, 25–54. [Google Scholar] [CrossRef]
  29. Gru, G. European Macroseismic Scale 1998: EMS-98; European Seismological Commission, Subcommission on Engineering Seismology, Working Group Macroseismic Scales: Luxembourg, 1998. [Google Scholar]
  30. FEMA-NIBS. HAZUS MH Technical Manual—Multi-Hazard Loss Estimation Methodology—Earthquake Model; FEMA-NIBS: Washington, DC, USA, 2004. [Google Scholar]
Figure 1. Flowchart depicting the novel framework for the application of the proposed methodology.
Sustainability 16 07465 g001
Figure 2. Visual representation of the road network (RN) modelled as a graph for application of the proposed framework; the dots represent the buildings along the roads, the rectangles depict the bridges, while Critical nodes a and b represent the start and finish points respectively.
Sustainability 16 07465 g002
Figure 3. (a) Satellite image of a part of the city of Naples, Italy, sourced from Google Maps, and (b) hilly area of Naples (named ‘Area collinare di Napoli’) in a close-up view integrated with QGIS, with the five paths forming the relevant RN (highlighted in blue, yellow, orange, green, and pink). Red stars indicate the locations of the two hospitals used as examples in this study, namely, the Critical node a depicted in (c) and the Critical node b depicted in (d).
Sustainability 16 07465 g003
Figure 4. Representation of V3–N: (a) the digital elevation model (DEM) from Google Earth, and (b) a close-up view.
Sustainability 16 07465 g004
Figure 5. Application #1 (Naples): Road network efficiency under a seismic scenario with return period Tr = 475 y.
Sustainability 16 07465 g005
Figure 6. Application #1 (Naples): Road network efficiency under a seismic scenario with return period Tr = 50 y.
Sustainability 16 07465 g006
Figure 7. (a) Satellite image of a part of the area of interest between the cities of Turin, Pino Torinese, and Chieri, all located in Piedmont, Italy. Sourced from Google Maps (April 2024). (b) Paths 1 (light blue) and 3 (orange) run through the Collina Torinese, in a close-up view integrated with QGIS. (c) Paths 2 (pink) and 4 (red). In both cases, the red crosses indicate the locations of the two hospitals on the northern (d) and southern (e) ends. The green dot indicates the Chieri-Pino Torinese city boundary, after which all paths converge in the blue dotted line.
Sustainability 16 07465 g007
Figure 8. Close-up view of the Corso Regina Margherita Bridge (V1-T), which is the subject of this and other ongoing research.
Sustainability 16 07465 g008
Figure 9. Application #2 (Turin): Road network efficiency under a seismic scenario with return period Tr = 475 y.
Sustainability 16 07465 g009
Figure 10. Application #2 (Turin): Efficiency of the analysed road network under a seismic scenario with return period Tr = 50 y.
Sustainability 16 07465 g010
Table 1. Lognormal fragility curve parameters for the bridges pertaining to the RN are depicted in Figure 3b.
Sc50Sc475
Bridge NameBridge TypologyM50BM50B
V1-NMasonry arch 0.120.620.300.59
V2-NLightweight slab deck on prestressed RC piers RC0.300.620.880.61
V3-NTruss deck on prestressed RC piers RC0.160.640.380.59
V4-NLightweight slab deck on prestressed RC piers RC0.300.620.880.61
V5-NSteel box deck0.370.620.890.59
V6-NTruss deck on prestressed RC piers RC0.340.600.680.58
V7-NLightweight slab deck on prestressed RC piers RC0.210.590.480.60
V8-NTruss deck on prestressed RC piers 0.160.640.380.59
V9-NViaduct with 6-span prestressed RC girder deck and single-span steel box deck0.340.600.680.58
Table 2. Detailed description of the typology for the bridges pertaining to the RN depicted in Figure 7b.
Bridge NameBridge TypologyNumber of Spans
V1-TRiver-crossing post-tensioned RC arch bridgeOne longer central span and two significantly shorter lateral spans
V2-TRiver-crossing RC arch bridge three spans of equal length
V3-TSimply supported viaduct with prestressed RC girder decknine spans
V4-TSimply supported viaduct with prestressed RC girder deck three spans
V5-TSimply supported viaduct with prestressed RC girder deck single span
V6-TSimply supported viaduct with prestressed RC girder deck nine spans
V7-TSimply supported viaduct with prestressed RC girder deck two spans
V8-TOverpass viaduct with RC deck one longer central span and two significantly shorter lateral spans
V9-TSimply supported viaduct with prestressed RC girder deck five spans
V10-TSimply supported viaduct with prestressed RC girder deck three spans
V11-TRC monolithic decksingle span
V12-TSimply supported viaduct with prestressed RC girder deck four spans
V13-TSimply supported viaduct with prestressed RC girder deck six spans
V14-TSimply supported viaduct with prestressed RC girder deck two spans
V15-TSimply supported, prestressed RC girder deck with seven spans (end-span RC deck replaced by mixed steel girder-RC deck)
Disclaimer/Publisher’s Note: The statements, opinions and data contained in all publications are solely those of the individual author(s) and contributor(s) and not of MDPI and/or the editor(s). MDPI and/or the editor(s) disclaim responsibility for any injury to people or property resulting from any ideas, methods, instructions or products referred to in the content.

