Article

Spatial and Temporal Matching Measurement of Ecosystem Service Supply, Demand and Human Well-Being and Its Coordination in the Great Rivers Economic Belt—Evidence from China’s Yangtze River Economic Belt

College of Land Resources and Environment, Jiangxi Agricultural University, Nanchang 330045, China
*
Authors to whom correspondence should be addressed.
Sustainability 2024, 16(17), 7487; https://doi.org/10.3390/su16177487
Submission received: 18 July 2024 / Revised: 16 August 2024 / Accepted: 26 August 2024 / Published: 29 August 2024
(This article belongs to the Section Sustainable Products and Services)

Abstract

:
Understanding the complex relationship between ESSD and human well-being is of paramount significance to protecting regional ecology, enhancing human well-being and achieving sustainable development. We take the Yangtze River Economic Belt as an example and use multi-source data to analyse land use and cover change, as well as the spatiotemporal evolution of ESSD and human well-being. We explore and reveal the coupling coordination relationship between ESSD and human well-being. The results show that from 2000 to 2020, the overall trend in ESs in the region improved significantly, and the supply notably increased, whereas the demand growth rate was even more pronounced. The supply–demand ratio for water yield and soil conservation showed little change, with variations of <10%. However, the supply–demand ratio for carbon sequestration declined significantly by 41.83%, whereas that for food supply increased notably by 42.93%. The overall spatial pattern in ESSD presented a mismatch, which was characterised by ‘low supply and high demand in the eastern region and high supply and low demand in the western region’. Overall, human well-being remained stable and was in line with the level of socio-economic development, thereby exhibiting a distinct trend of well-being ‘polarisation between the rich and poor’. Well-being was higher in the eastern and central urban agglomerations and lower in the western plateau and mountainous areas. Over 20 years, the degree of coupling coordination between ESSD and human well-being increased by 0.0107, and the coupling level gradually transitioned from moderate imbalance to moderate coordination. Spatially, Hubei Province, Chongqing Municipality and the Yangtze River Delta were the main ‘high–high’ agglomeration areas, whereas the Sichuan Basin and the Yunnan-Guizhou Plateau were the main ‘low–low’ agglomeration areas. Based on these findings, we propose the following management recommendations for the Yangtze River Economic Belt and other related great river economic belts: optimise land use structure, rationally allocate natural resources, strengthen regional and external connections and promote regional coordinated development, enhance the implementation of policies for ecological and environmental protection, establish regional ecological compensation mechanisms and coordinate ecological protection in a full scope and focus on harmonising human–land relationships, build a multi-stakeholder collaborative governance mechanism and promote regional ecological protection and the elevation of human well-being.

1. Introduction

Ecosystem services (ESs) are crucial benefits that humans obtain from the natural environment [1]. Quantitative evaluation of these services is essential to understanding the current state of ecosystems and their developmental changes. Such an evaluation also serves as a vital means for the rational optimisation and allocation of natural resources, which has implications for regional development [2]. According to the Millennium Ecosystem Assessment, the supply of ESs is key for human well-being. ESs sustain human survival and development, maintain biodiversity and provide necessary natural resources [3], thus serving as a prerequisite for all other forms of development [4]. On the other hand, demand for ESs refers to the quantity of ecological products consumed or used by humans [5]. The demand level is an indicator that is critical for determining whether there are high levels of human well-being. Together, supply and demand constitute the dynamic process by which ecological products and services flow from natural systems to social systems [6]. As a population grows and develops socio-economically, its demand for ESs gradually increases [7,8], which leads to greater conflict between supply, and well-being may alleviate this imbalance and promote harmonious coexistence between humans and nature, through high-quality regional development and the construction of ecological civilisation [9,10].
Currently, the relationship between the balance in ecosystem service supply and demand (ESSD) and human well-being has become a significant line of ecosystem service research [11]. This research focuses on four core points: (1) exploring the evaluation index system for ESSD [12]; (2) measuring and spatially distributing supply and demand [13,14]; (3) judging the balance of supply–demand relationships and identifying spatial matching relationships [15,16]; (4) investigating the correlation between supply–demand relationships and human well-being [4,17,18,19]. At present, due to the research efforts of numerous domestic and international scholars, a relatively complete evaluation index system has been constructed. Costanza et al. [20] proposed, in 2001, an assessment system for 17 types of ESs. Subsequently, the United Nations’ Millennium Ecosystem Assessment report further refined this system and developed a comprehensive framework for ecosystem service functions. This framework provided robust and comprehensive support for subsequent ecosystem service research. Scholars typically study this issue by using four key indicators—water [21,22], soil retention [23], food supply [24] and carbon storage [25,26]—that primarily represent ecosystem functions. This approach has yielded a variety of theoretical and practical results. Additionally, with the advancement in information technology, various ecological models such as INVEST [27], RUSLE [28], and ARIES [29] were quickly developed and applied. These models effectively address the quantification and spatial characterisation of ESSD. Furthermore, many scholars have used socio-economic data to measure total demand [30,31]. With the progress in remote sensing technology, some researchers have also integrated night-time light remote sensing indices to identify spatial ecological demand [32,33]. Moreover, in other studies of the balance and spatial matching of supply–demand relationships, scholars have predominantly used the ‘supply–demand ratio’ to measure the degree to which ecosystem service needs are met. They have also employed spatial autocorrelation and the index of Moran’s I to perform the spatial clustering of ecological supply–demand relationships, categorising different types of supply–demand matches [34]. These methods effectively address the identification of ‘inflow’ and ‘outflow’ regions in ES. Finally, the correlation between supply–demand relationships and human well-being is still in the exploratory stage. Current perspectives suggest that in ecosystems, the supply–demand relationship is a crucial indicator of whether a positive feedback loop exists between the natural environment and human society.
Human well-being is maximised and maintained when ecosystems reach their optimal utilisation state [35]. The optimal utilisation of ecosystems is contingent upon the intrinsic attributes of the ES itself, including the stability of resource supply, climate regulation, biodiversity support, recreational and cultural values, and the provision of a foundation for economic development. When ecosystems are optimally utilised, the corresponding human well-being attributes can be secured and enhanced. Conversely, when human demand for ESs exceeds that ecosystem’s maximum carrying capacity and effective value feedback to increase supply is not successfully established, a negative interaction mechanism comes into play that exacerbates conflicts between natural and social systems, causes environmental degradation, and ultimately reduces human well-being [36]. Existing research primarily focuses on the contribution and response to the human well-being of ecosystems [17,18,37], emphasising the supply side. Existing studies also explore the evaluation of and interactions between ESs [4], as well as the sustainable management of ecosystems [19] and their driving factors [21]. The analysis of interactions between ESs and human well-being represents a crucial frontier in human–land coupling systems [7,14], with the goal being the establishment of a bidirectional connection between the two. However, direct studies on the coupling coordination between the two are relatively scarce [38]. Most studies have explored their trade-offs [39], nonlinear relationships [29] and the differences in ecosystem benefits obtained from a spatiotemporal perspective. Moreover, existing ecosystem service studies tend to focus on supply quantity [35], so a deeper exploration into the coupling coordination between supply and demand is needed. Current human well-being research primarily considers quantitative indicators from the perspective of livelihood well-being [40], and it requires further exploration into the multidimensional aspects of human well-being. Furthermore, many studies have been limited to small regions [41,42], often at the county or municipal level, which makes it difficult to achieve a consensus in cross-regional governance and coordination.
The Yangtze River Economic Belt (YREB) spans China’s eastern, central, and western regions, making it the most developed area in the entire Yangtze River Basin and a zone that pioneers ecological civilisation construction. It is critical to China’s ecological civilisation efforts. Emphasising comprehensive protection over large-scale development, prioritising ecology, and promoting green development are essential for high-quality development in the YREB. This approach is vital to protect the environment of the Yangtze River Basin, enhancing human well-being and leading China’s ecological civilisation. Given the current gaps in research and the fact that the YREB is typical and holds research significance, we chose this region as the research object. We use multi-source data, including land use data, to examine the relationship between ESSD and human well-being from a spatiotemporal perspective. The specific research objectives are (1) to explore the spatiotemporal variation of ecosystem supply and demand by analysing the characteristics of land use and cover change (LUCC) in the YREB from 2000 to 2020; (2) to investigate the balance of ESSD and its spatiotemporal variation; (3) to measure human well-being across different dimensions and analyse its spatiotemporal variation; (4) to reveal the coupling coordination between the balance of ESSD and human well-being and to propose management recommendations. The overall goal of this study is to elucidate the spatiotemporal relationship between the balance of ESSD and human well-being in the YREB. This will lay a foundation for regional ecological protection, the enhancement of human well-being and the construction of ecological civilisation.

2. Materials and Methods
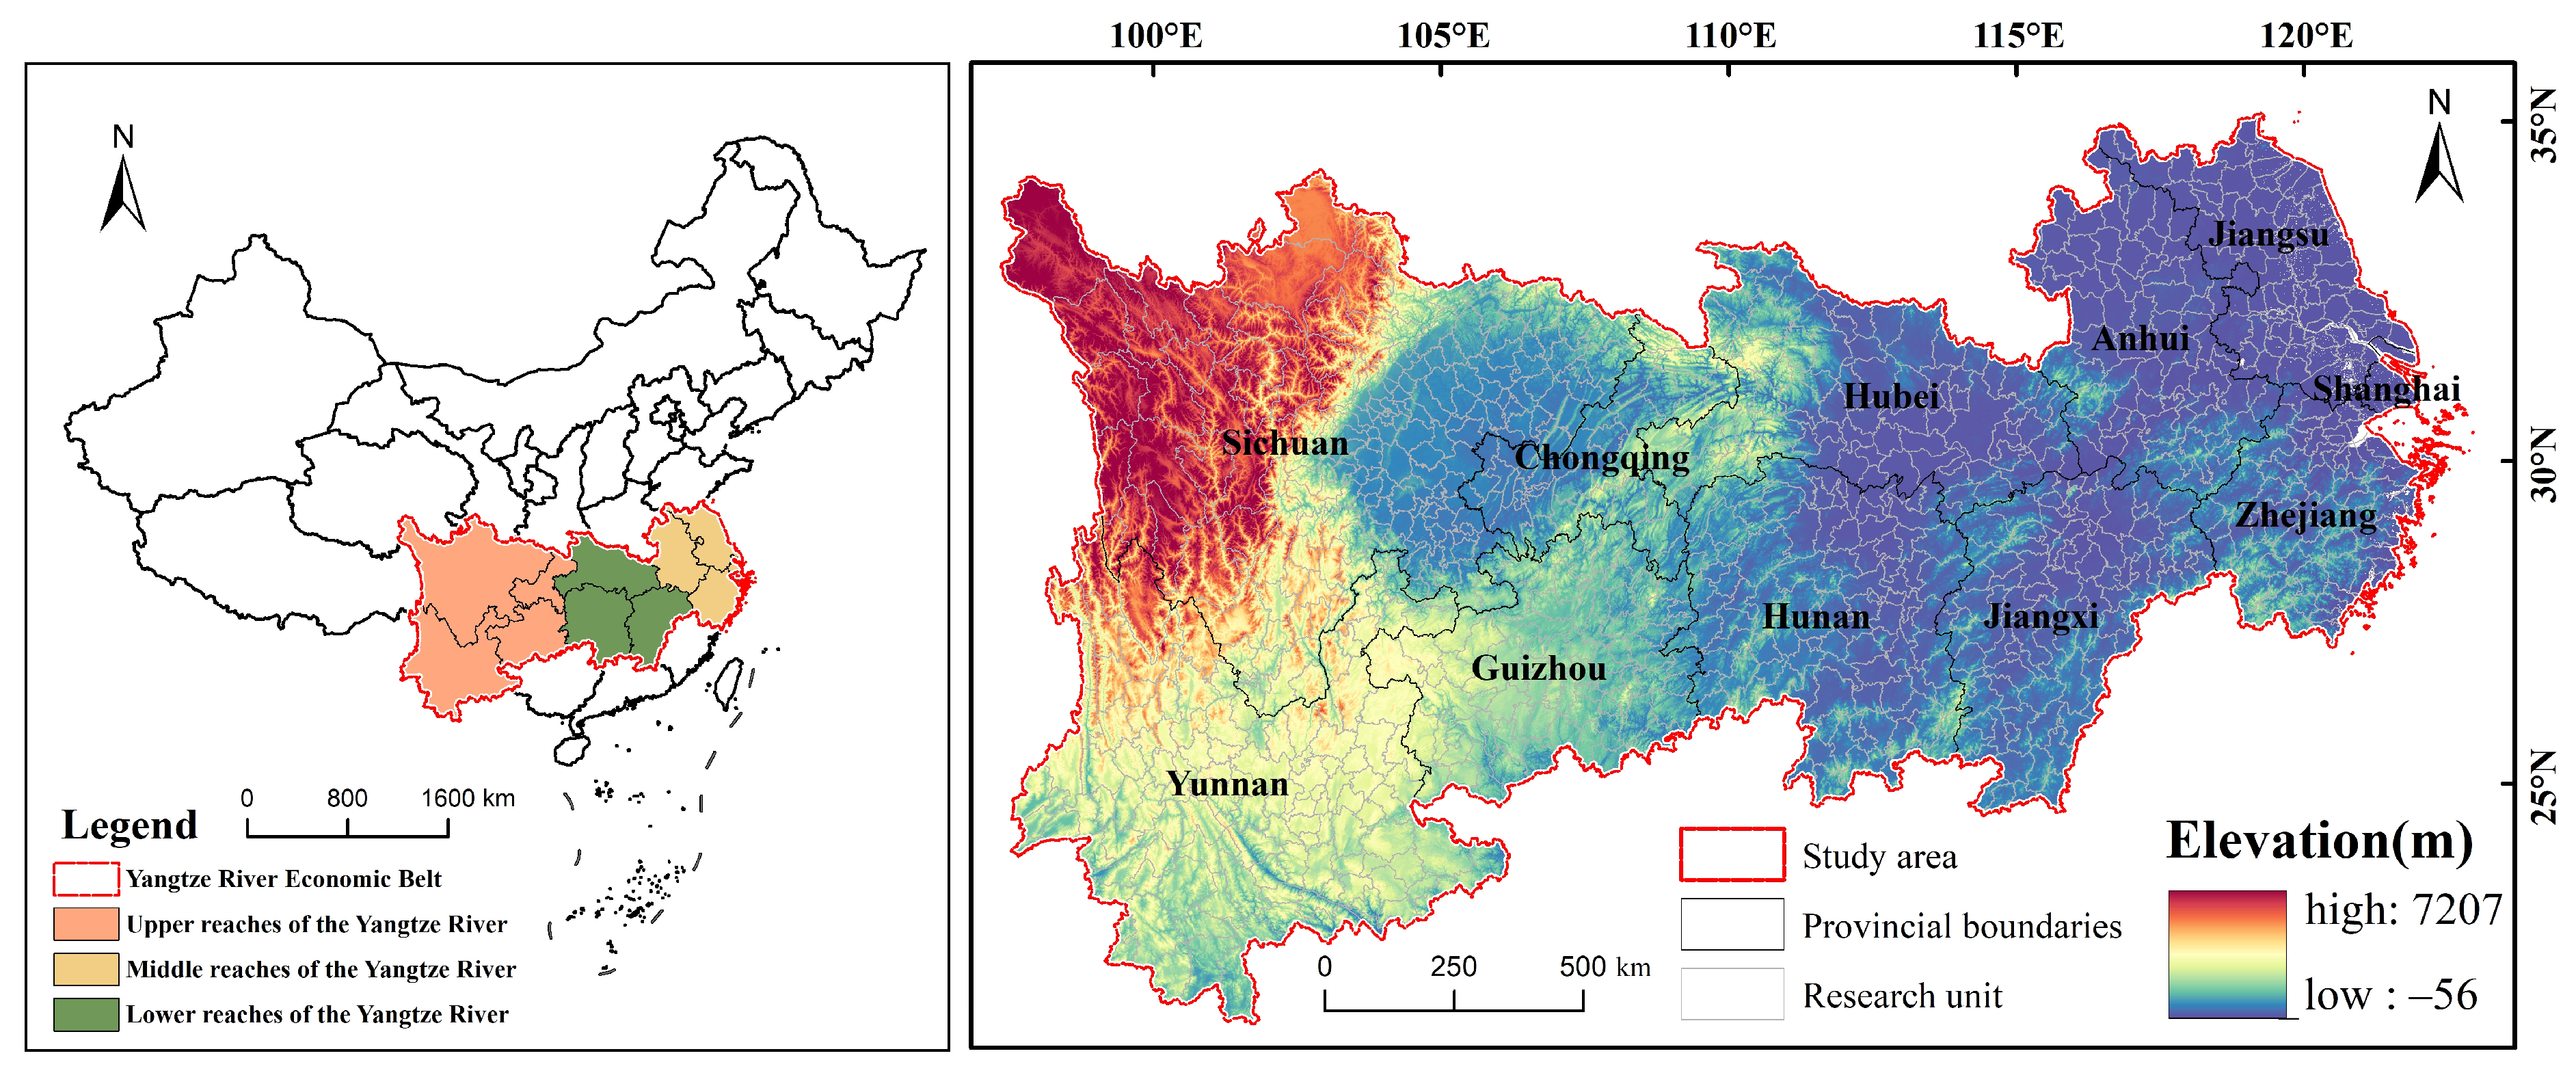
2.1. Study Area

The Yangtze River Economic Belt spans the eastern, central, and western regions of China, covering 11 provincial-level administrative regions (Figure 1). The YREB’s geographical structure is centred on the Yangtze River and is divided into upper, middle, and lower reaches. The upper reaches include Chongqing, Sichuan, Guizhou and Yunnan, the middle reaches comprise Jiangxi, Hubei and Hunan, and the lower reaches encompass Shanghai, Jiangsu, Zhejiang and Anhui. The total land area of the YREB is ~2.05 million km2, and the YREB hosts three urban agglomerations at the national level: the Yangtze River Delta, the middle reaches of the Yangtze River, and the Chengdu–Chongqing region. These areas significantly promote regional urbanisation and ecological civilisation. In the national policy, the arable land in the Yangtze River Economic Belt needs to be maintained at 399,800 km2, the urban area is controlled at 79,700 km2, and the area of ecological protection is not less than 806,600 km2. The current land use cover is mainly woodland and arable land, with the distribution of cropland in the plain area interspersed with water, and the woodland concentrated in mountainous areas. The YREB is rich in natural resources, and it has a dense network of waterways. Its total water resources amount to approximately 1.56 trillion m3 and account for approximately 49.4% of the national total. The average forest coverage rate is approximately 44.93%, which is roughly double the national average. The region’s population represents approximately 42.9% of the national population, and its gross domestic product (GDP) accounts for approximately 46.40% of the national GDP. The urbanisation rate exceeds 60%. However, the YREB faces several challenges, including severe environmental conditions, pronounced imbalances in regional development and significant tasks related to industrial transformation and upgradation. Therefore, promoting the coordinated and high-quality development of regional ecological protection and human well-being has become an urgent issue.

2.2. Data Sources

The data used in this study include land use data, meteorological data, topographic data, soil data, vegetation data, socio-economic data and other multi-source data, as shown in Table 1. To facilitate the research, this study merged the municipal districts and the administrative districts that were difficult to obtain data from, obtaining 894 research units, and used the Bayesian overlapping model to fill in the missing data. The rasters covered in this study were resampled to a raster with a spatial resolution of 1 km using Arc GIS 10.8 software at WGS 1984 World Mercator. And, the data were unified to each study unit using spatial analysis methods such as partition statistics and area tabulation.

2.3. Method

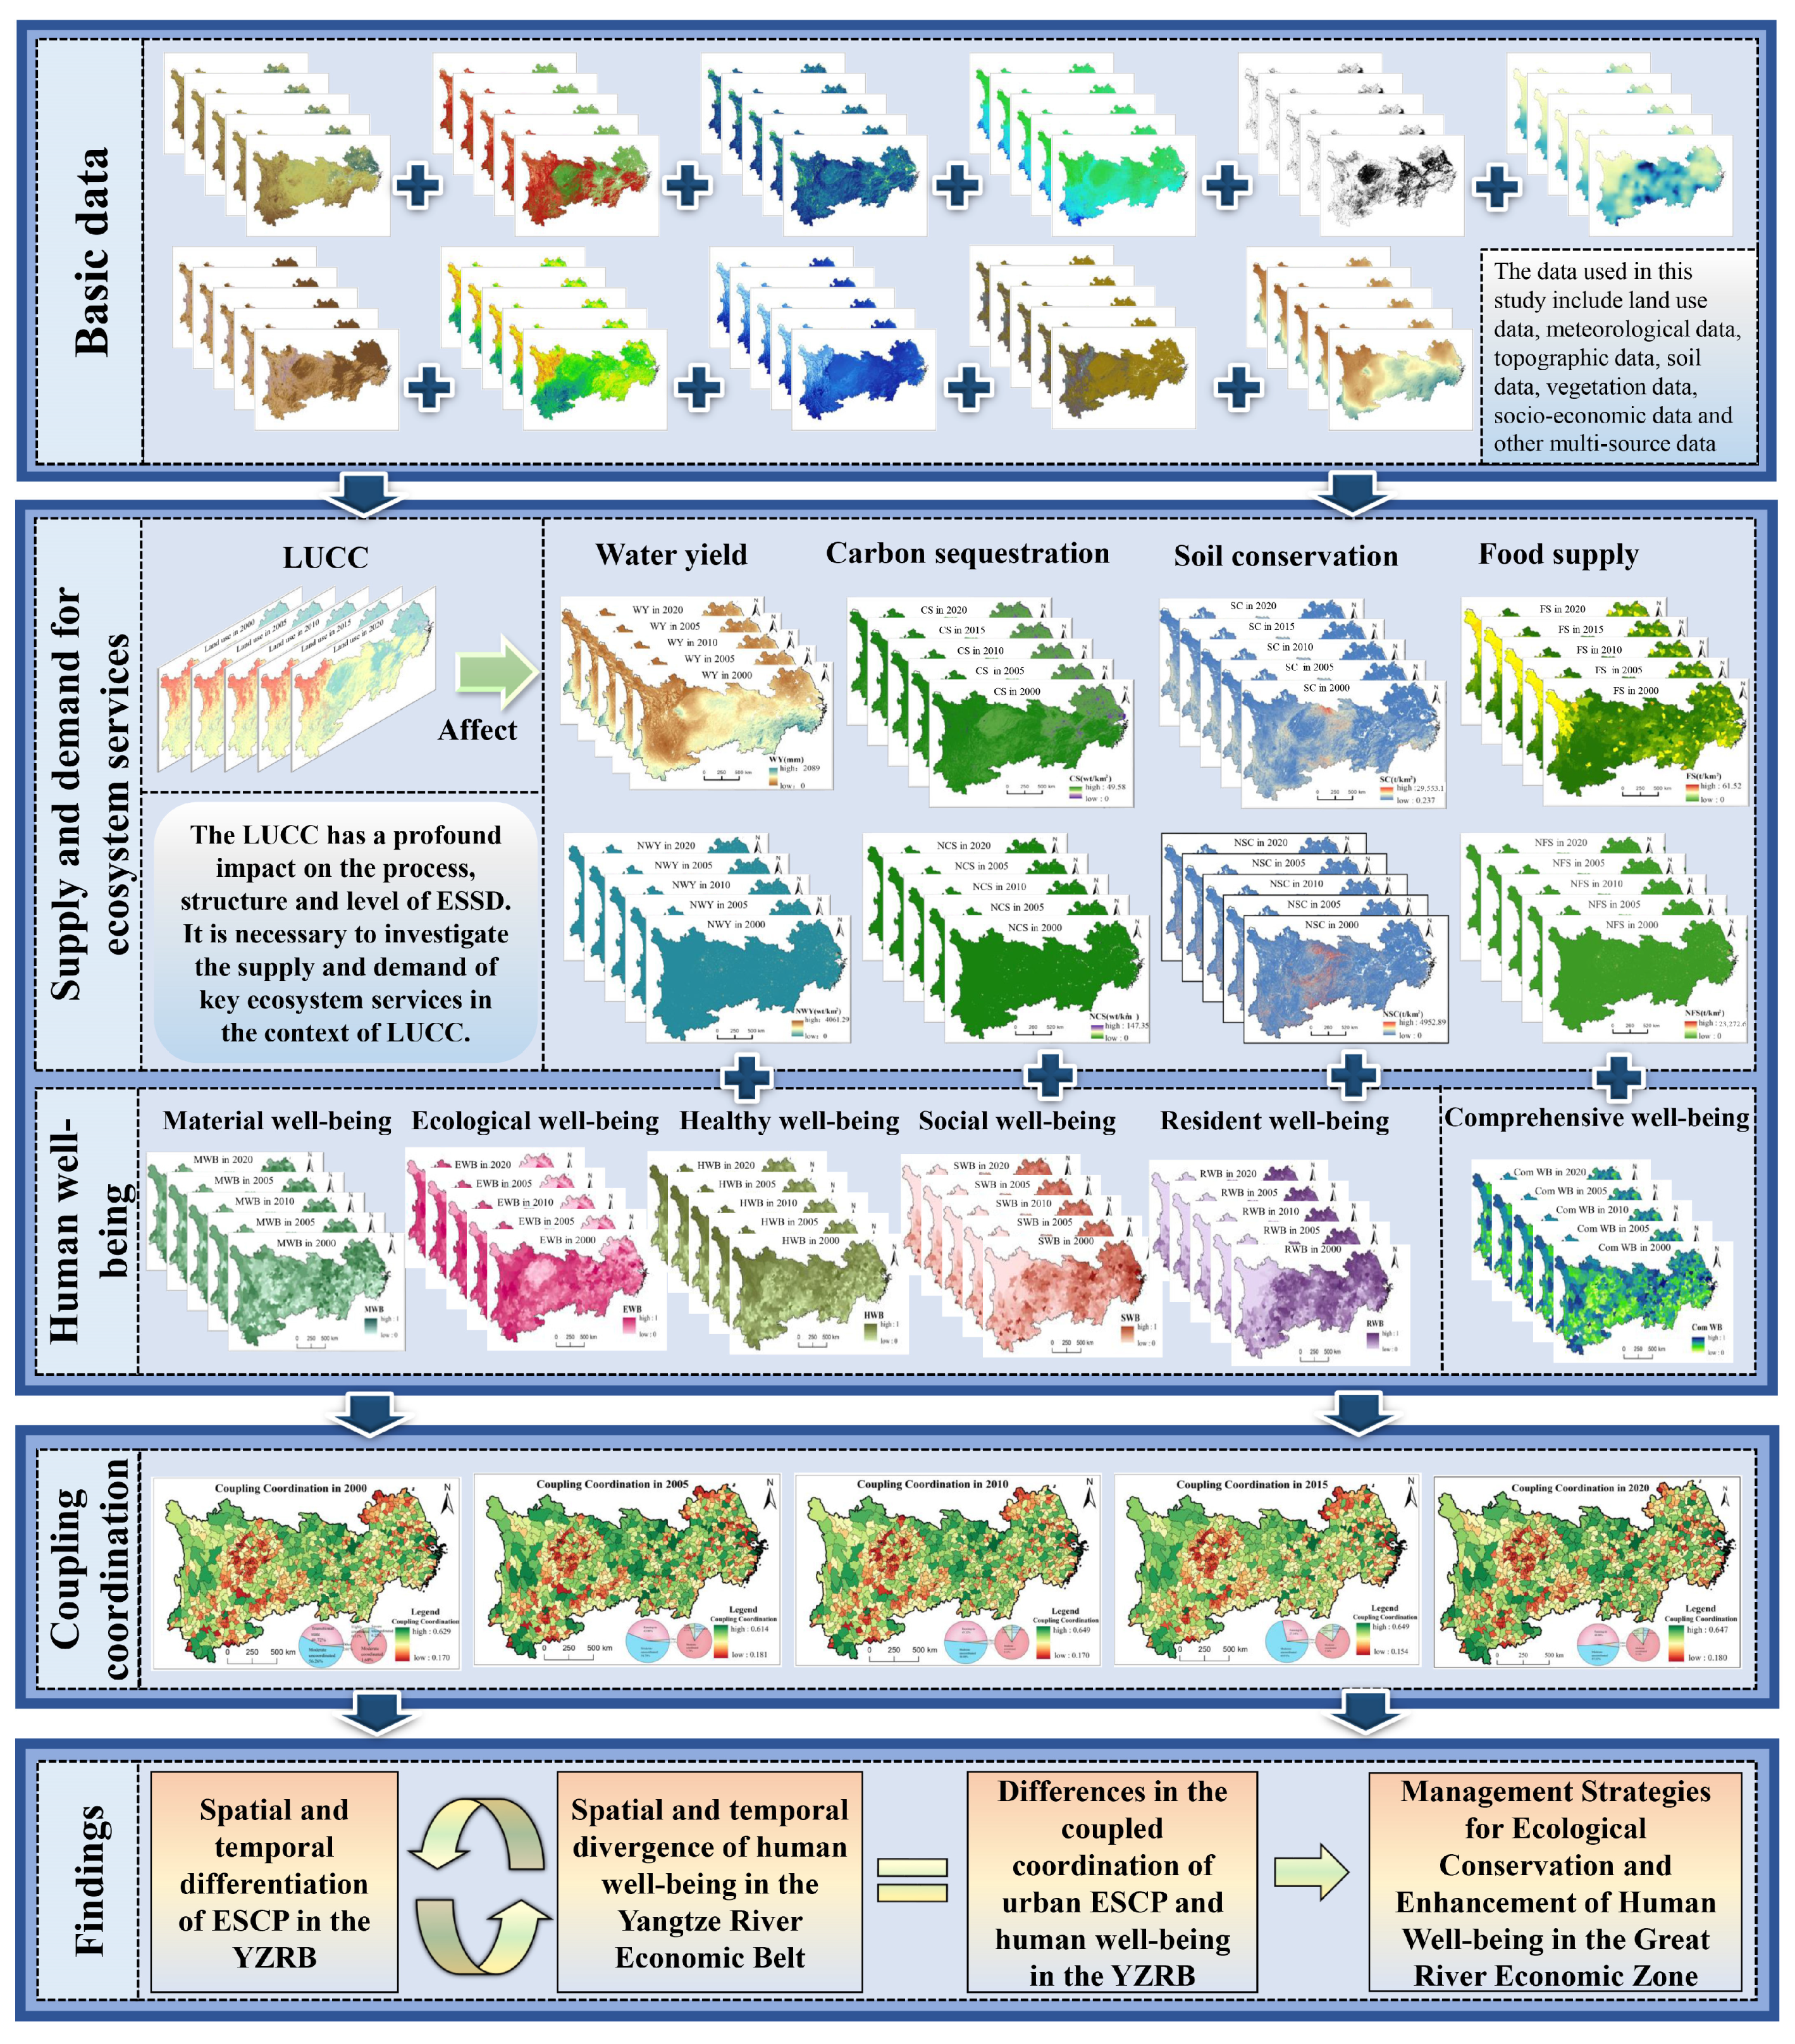
2.3.1. Methodological Framework

Figure 2 illustrates the principal research concepts and framework of this study. It commences with the integration and processing of fundamental data from multiple sources, overlaying the analysis to obtain the supply and demand of the four ESs, as well as analysing the spatiotemporal matching relationship. Subsequently, an evaluation of the five human well-being indicators is conducted based on the socio-economic and physical–geographical data of each research unit within the Yangtze River Economic Belt. This is followed by a spatiotemporal characterisation. Once the equilibrium between the supply and demand of ESs and the level of human well-being in each study unit of the Yangtze River Economic Belt had been established, the relationship between ESs and human well-being was analysed in terms of coupled coordination using the coupled coordination degree model under spatiotemporal variation. The findings of the coupled coordination analysis for each city in the Yangtze River Economic Belt are used to inform recommendations for the optimisation of ecosystems and the enhancement of human well-being in the region.

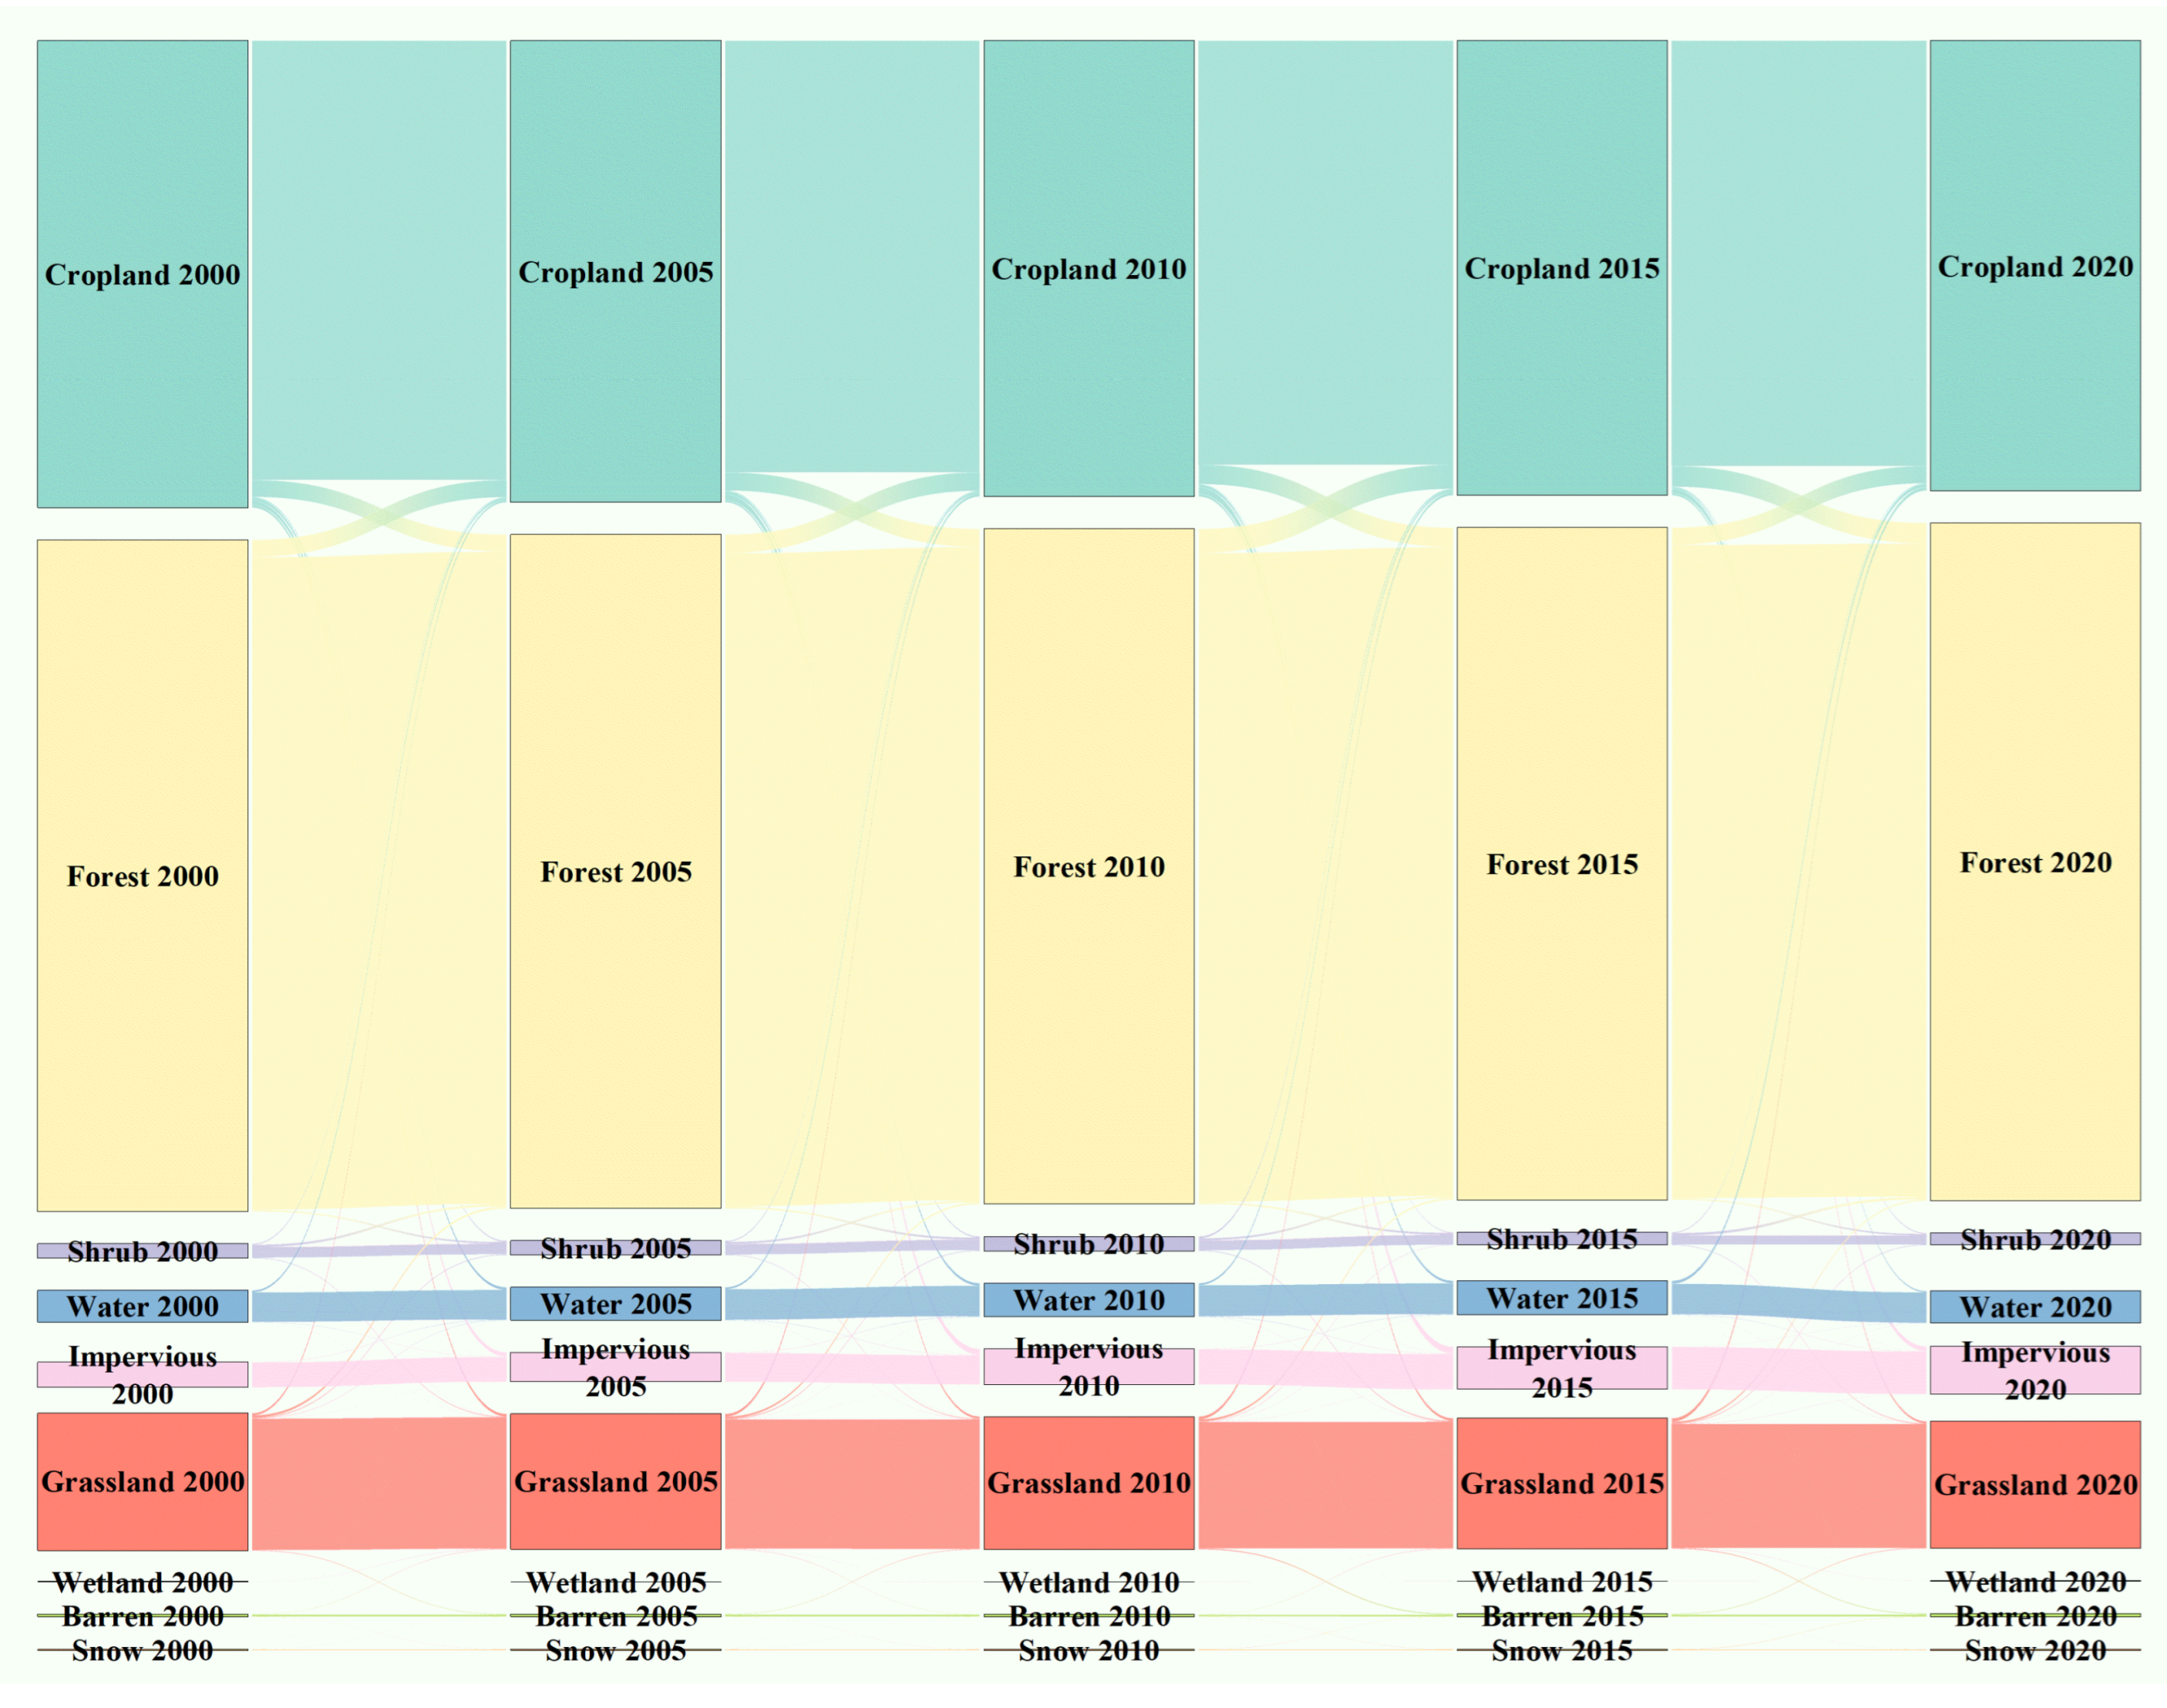
2.3.2. Land Use Transfer Matrix

The matrix shows the transfer area and direction of each land use type from the beginning to the end of the period. This includes the land-use-transfer area and probability matrices. The formula is as follows:
A i j = A 11 A 12 A 1 n A 21 A 22 A 2 n A n 1 A n 2 A n n
In this formula, Aij (i, j = 1, 2, …, n) denotes area transformed from land type i to land type j, and there are n land types. The quantification of ESs in this article mainly considers four types of services that have a significant impact on socio-economic development, including water yield, carbon sequestration, soil conservation, and food supply.

2.3.3. Calculation of Supply and Demand for Ecological Services

ESs are direct or indirect contributions by ecosystems to human society, and their supply–demand balance is a critical indicator of regional sustainable development [47]. On the one hand, human activities increasingly impact the natural environment, reduce the area and quantity of natural environments and consequently decrease the supply of ESs. On the other hand, population growth continues to increase the demand for ESs such as water, energy, and food. Thus, this research focuses on the supply–demand relationship of ESs that profoundly affect human well-being. From the perspective of the importance of ecosystems for socio-economic development, this study assesses the supply and demand of ESs using a total of four types of ESs, mainly water yield, carbon sequestration, soil conservation, and food supply.

Water Yield

The InVEST model was used to determine the water yield in the Yangtze River Economic Belt, using the water balance principle. The demand for water yield was calculated by multiplying the per capita consumption in the study area by the population density at the grid scale. The supply and demand formulas are as follows:
W Y = 1 A E T x P x × P x
N W Y = D p e r w a t e r × ρ p o p
In the formula, WY represents the total amount of water yield for the service supply (mm). AET(x) denotes the annual actual evapotranspiration, while P(x) signifies the annual rainfall (mm). Dperwater is the per capita water consumption derived from the ratio of the total water consumption of industry, agriculture, and domestic use, as well as the ecological water consumption and the resident population of each region of the Yangtze River Economic Belt; NWY is the annual demand for the water yield service (t); ρpop is the population grid density (person/km2).

Carbon Sequestration

The provision of carbon sequestration services within the Yangtze River Economic Belt is assessed using the carbon module of the InVEST model. The data pertaining to demand are directly derived from the Emissions Database for Global Atmospheric Research. The relevant formulas for the supply and demand of these services are as follows:
CS = C above + C below + C soil + C dead  
In the formula, CS represents the total annual carbon sequestration (t/km2); Cabove, Cbelow, Csoil, and Cdead are the contents of above-ground biomass, below-ground biomass, soil organic matter, and dead organic matter, respectively. NCS is the demand for carbon sequestration services. The demand was calculated using the carbon emission dataset of China from 2000 to 2020 from the Emissions Database for Global Atmospheric Research (https://edgar.jrc.ec.europa.eu/, accessed on 10 May 2024), with an accuracy of 11 km.

Soil Conservation

The RUSLE (Revised Universal Soil Loss Equation) model was selected to assess the supply and demand of soil conservation services within the defined area. The supply was defined as soil retention, whereas demand was represented by the actual amount of soil erosion expected to be treated. The formulas for the supply and demand of soil conservation services are as follows:
S C = A c N S C = R × K × L S × 1 C × P
N S C = R × K × L S × C × P
In the formula, SC represents the total annual soil conservation (t/km2). Ac is defined as the potential soil erosion, while NSC represents the actual soil erosion. R is known as the rainfall erosivity factor, K is the soil erodibility factor, LS is the slope length and slope gradient factor, and C is the vegetation cover and management factor. Finally, P represents the soil conservation measures factor, which is also sometimes referred to as the conservation practises factor.

Food Supply

The food supply in the study area was calculated by applying the ratio between the NDVI of cultivated land and the total NDVI in the study area. The demand for food supply services was determined by multiplying the food consumption of Chinese residents by the population density in the same year. The formulas for the supply and demand of food are as follows:
F S i = G s u m × N i N s u m
N F S = D p e r c r o p × ρ p o p
In the formula, FSi is the result of food supply allocation (t); Gsum is the total food production in the study area, obtained from the panel data of the statistical yearbook; Ni is the NDVI value of raster i; Nsum is the total NDVI value of arable land in the study area; NFS is the food demand (t); Dpercrop is the per capita food demand, using the food consumption of Chinese residents in that year; and ρpop is the population raster density (persons/km2).

Supply and Demand Analysis of Ecological Services

According to Liebig’s law of the minimum [48], the intensity of human well-being in a region is constrained by the most limiting factor. To measure the overall constraint of ESs, this research involves calculating the total supply–demand ratio of ESs and relating it to human well-being, thereby revealing the surplus and deficits in ESs. The formula is as follows:
E S C P j = E S j E D j E S j + E D j
In the formula, ESCPj represents the ratio of ecosystem service supply and demand, ESj and EDj denote the ecosystem service supply and demand, respectively, and j is the j-th ecosystem service. An ESCP greater than zero indicates that the research unit is an area with a surplus of ESs, whereby ecological supply exceeds ecological demand. Conversely, an ESCP less than zero denotes an ecosystem service potential area, where ecological supply is insufficient and ecological demand is unmet. Finally, an ESCP equal to zero signifies an area of ecosystem service balance, where ecological supply and demand are approximately in equilibrium.

2.3.4. Human Well-Being Measurements

Based on the interactive coupling between ESSD and human well-being and with reference to existing research [49,50,51,52,53,54], we infer that there is a significant relationship between ESs and material production, ecological quality, human health, socio-economics, and individual residents. From five perspectives, namely material well-being (MWB), ecological well-being (EWB), health well-being (HWB), social well-being (SWB), and resident well-being (RWB), we establish a human well-being evaluation index system (Table 2). Due to the different dimensions of the original indicators, the range method is used to standardise them. To reduce the random error of any single weighting method, this study uses both the entropy weight and coefficient-of-variation methods for determining individual weights and then averages them to obtain the comprehensive index weights. Because the range method is used for standardisation, the data for some years may have a value of zero. To satisfy subsequent calculations, 0.0001 is added to the standardised values as a translation adjustment.
The weighted summation method is employed to evaluate the level of human well-being for each research unit. This method calculates a comprehensive average value by multiplying the weights of each indicator by their standardised values and then summing them arithmetically. The formula is as follows:
W B z = i = 1 n u i × w i
C o m   W B = W B 1 + W B 2 + + W B z z
In the formula, WBz, refers to the z-th human well-being, ui represents the standardised value of the i-th indicator under the corresponding well-being, and wi denotes the composite weight of the i-th indicator. Com WB represents the composite index of human well-being, calculated in such a way that each subsystem of well-being is of equal importance.

2.3.5. Coupling Coordination Model

Based on the coupling coordination coefficient of physics and relevant research [55,56,57,58,59,60], we construct a coupling coordination model between human well-being and the ecological supply–demand relationship. The specific formula is as follows:
C = E S C P 1 × × E S C P n × W B 1 × × W B z E S C P 1 × × E S C P j × W B 1 × × W B z n + z n + z 1 n + z
D = C × T , T = β E S C P 1 + + β E S C P n + β W B 1 + + β W B z
In the formula, C represents the degree of coupling between human well-being and the supply and demand of ESs. D denotes the degree of coordination of the coupling between human well-being and the supply and demand of ESs. ESCPn is the ratio of supply and demand of the nth ecosystem service, while WBz is the value of the z-th human well-being. β is a coefficient that will be determined at a later stage. The above data are standardised using the range method and 0.0001 is added to the processed items due to the presence of 0 values after the range method.
As one of China’s important economic development belts, the YREB is currently in a rapid development stage. The core themes of this region are economic development and ecological protection, both of which are crucial [61]. They play an equally important role in constructing a broad ecological security pattern and socio-economic-development framework. Therefore, this study considers the functions of each system to be equally important [62,63,64], meaning that all undetermined coefficients are equal. In order to facilitate a more detailed analysis of the coupled coordination results, the coupled coordination results D are divided into five distinct categories based on the coordination levels. These categories are [0, 0.2] for severely uncoordinated, (0.2, 0.4] for moderately uncoordinated, (0.4, 0.5] for running-in, (0.5, 0.6] for moderately coordinated, and (0.6, 1] for highly coordinated.

2.3.6. Spatial Autocorrelation Analysis

To investigate the spatial relationship of coupling coordination among different research units, this study employs the Global Moran’s I and the Local Moran’s I for evaluating the spatial correlation of the coupling coordination index [65]. Moran’s I ranges from −1 to 1. A negative value indicates that the coupling coordination degree in the focal area exhibits opposite characteristics, whereas a positive value indicates similar characteristics. A value of 0 in Moran’s I indicates that the coupling coordination degree is randomly distributed in space. In accordance with Local Moran’s I, the calculations were categorised into five distinct groups, namely Not Significant, High–High, Low–Low, High–Low, and Low–High. The Global Moran’s Index and the Local Moran’s Index were both calculated using GeoDa 1.16 software, with the geographic weighting matrix being the distance weight matrix. The formula is as follows
G l o b a l M o r a n s I = i = 1 n j = 1 n w i j x i x ¯ x j x ¯ σ 2 i = 1 n j = 1 n w i j
L o c a l M o r a n s I = x i x ¯ j 1 n w i j x j x ¯ σ 2
x = 1 n i = 1 n x i
In the formula, xi and xj denote the coupling coordination index of region i and region j, respectively; n is the total number of study units; Wij denotes the spatial weight matrix; x denotes the mean value of coupling coordination; and σ denotes the standard deviation of coupling coordination.

3. Results

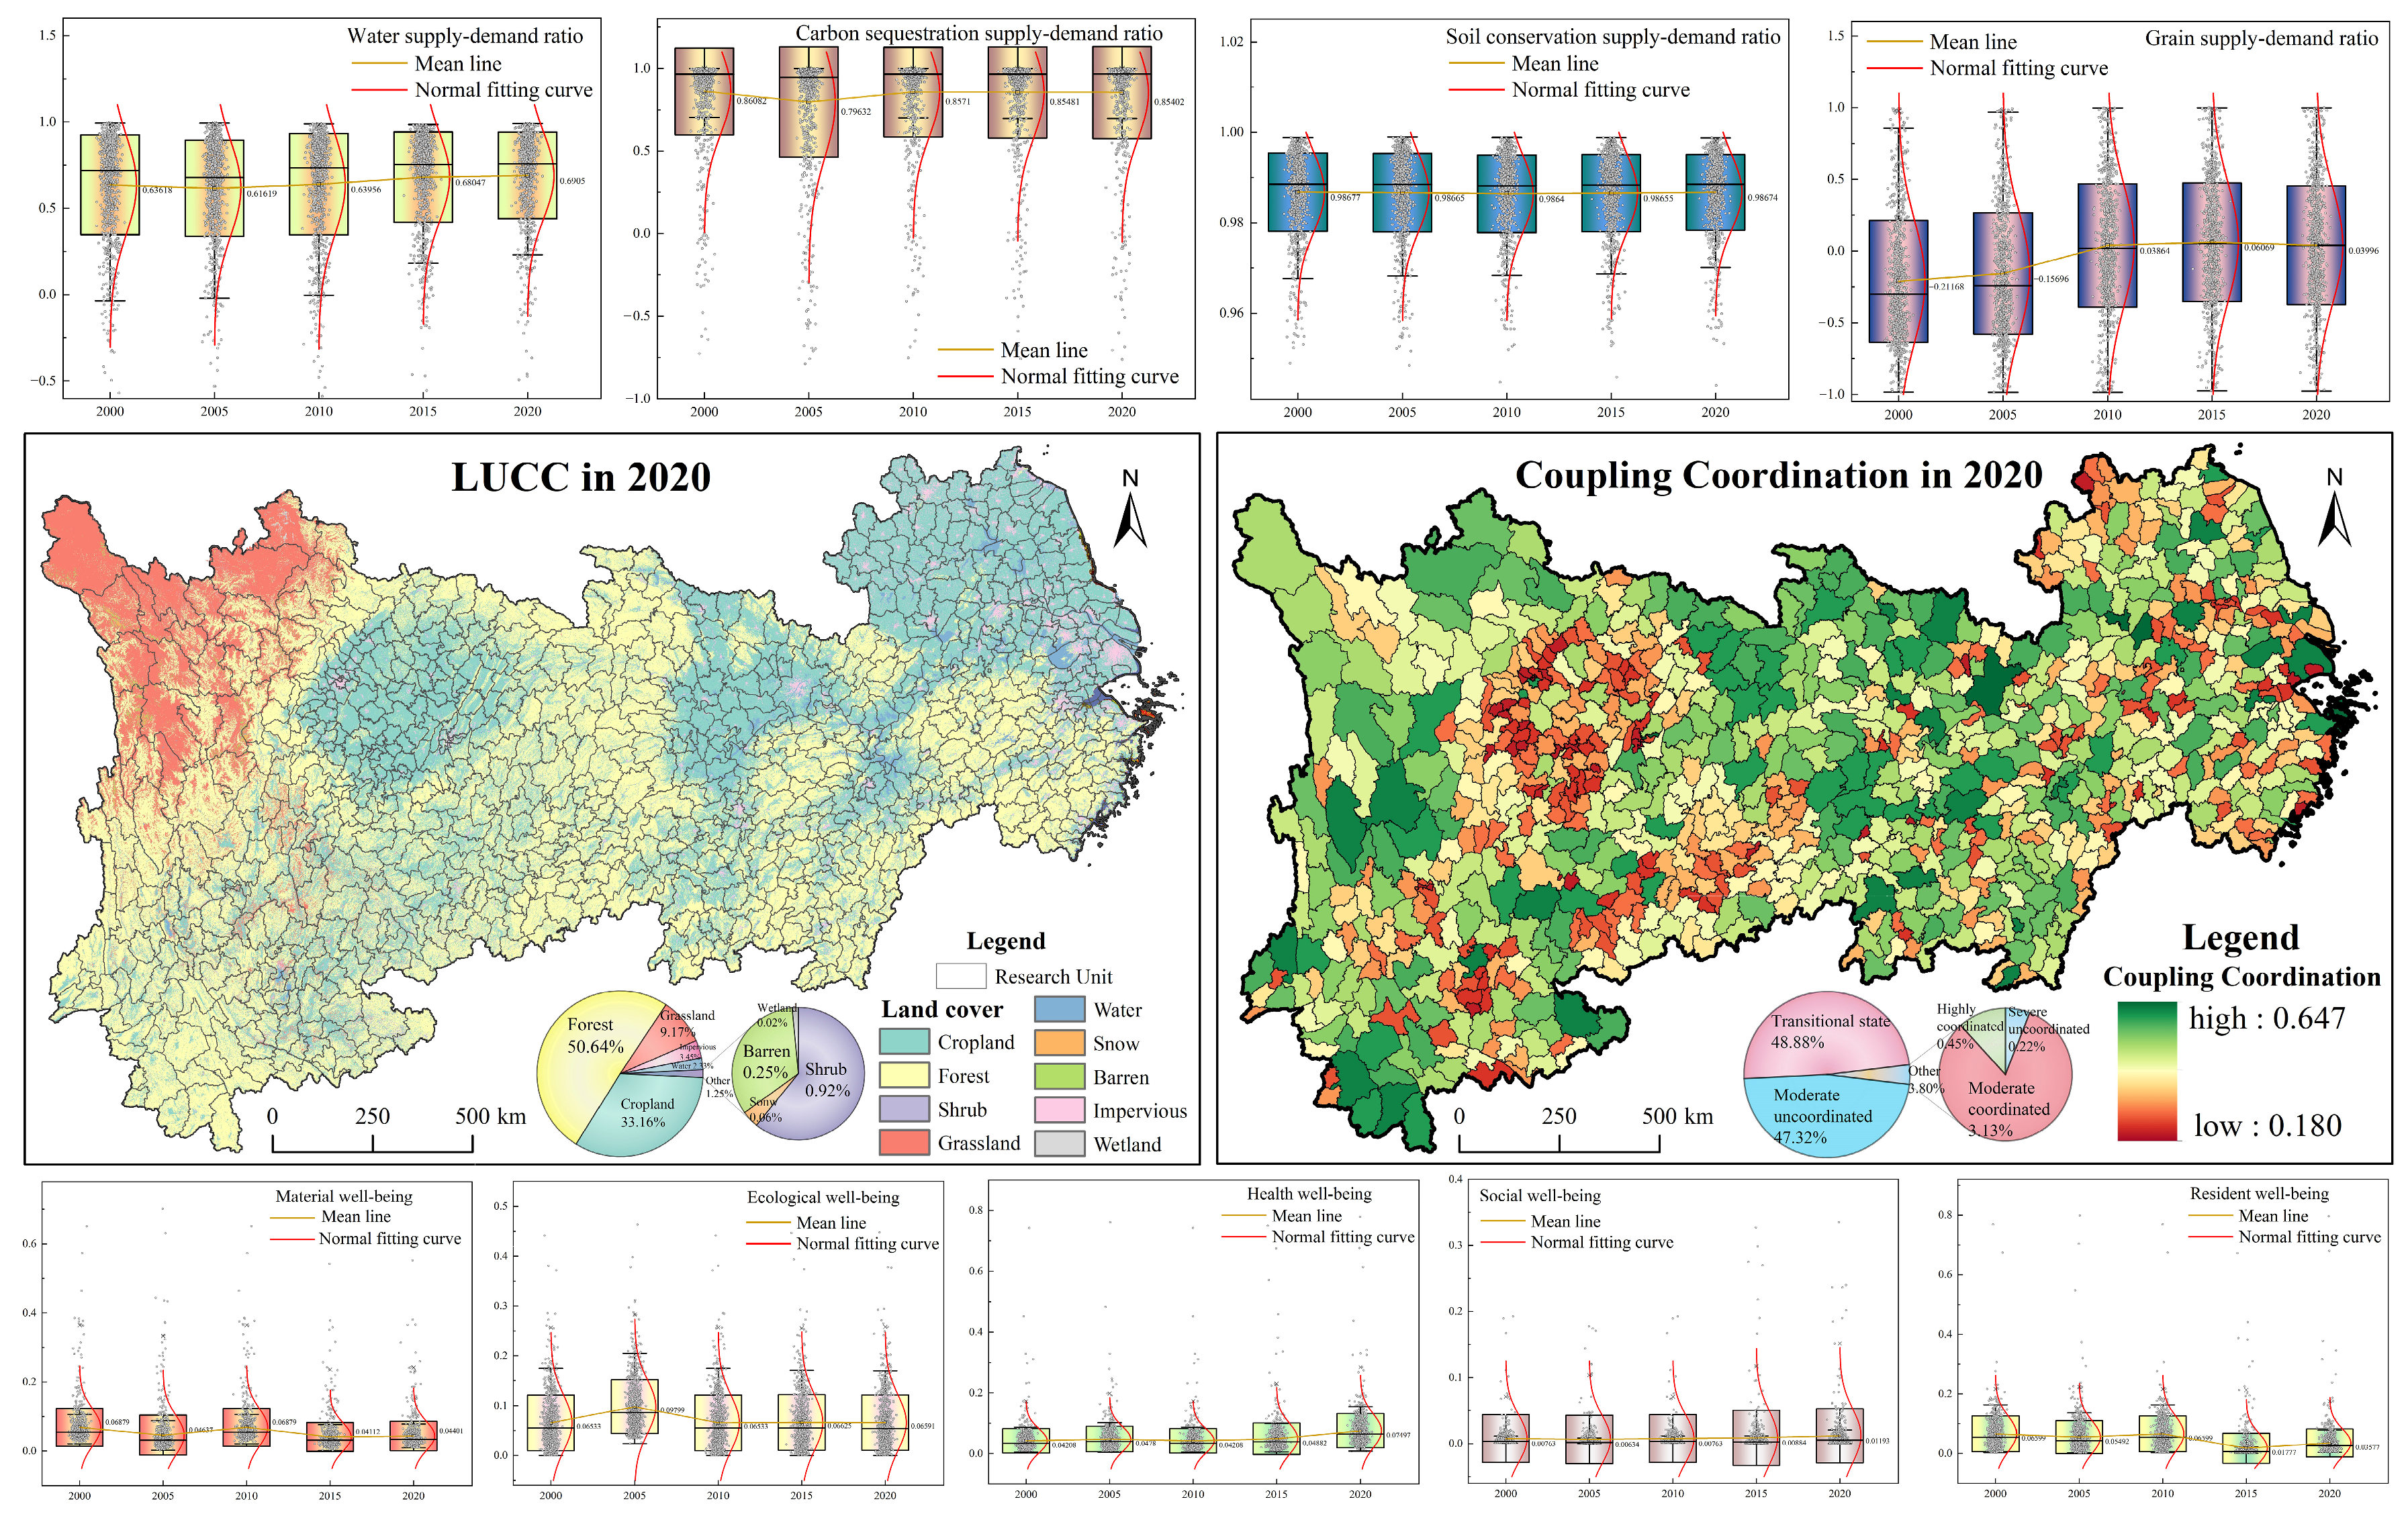
3.1. Analysis of Land Use Change in the YZRB

The land use transfer directions from 2000 to 2020 are illustrated in Figure 3. As shown in Figure 3, forest and cropland are the two most prominent and extensive land use types in the YREB. Over the 20-year period, the most notable LUCC occurred in cultivated and construction lands. The cultivated land area shows a continuous decrease, with a total reduction of 33,628 km2 over the 20 years. The most significant reduction occurred between 2005 and 2010, and it amounted to 11,369 km2 and accounted for 33.8% of the total reduction over 20 years. This reduction mainly converted to construction and forest lands. The grassland area decreased significantly by approximately 20,528 km2, and it was mainly converted to construction land. Construction land showed a rapid increase, with a total raise of 44,449 km2 over the 20 years, representing a growth rate of 47.3%. The most substantial increase occurred between 2010 and 2015, with an expansion in area of 14,108 km2. The total forest land area showed minimal change, with a growth rate of less than 0.1% over the 20 years. The water area increased from 2000 to 2015, but it decreased by 3972 km2 from 2015 to 2020. Other land categories showed little change.

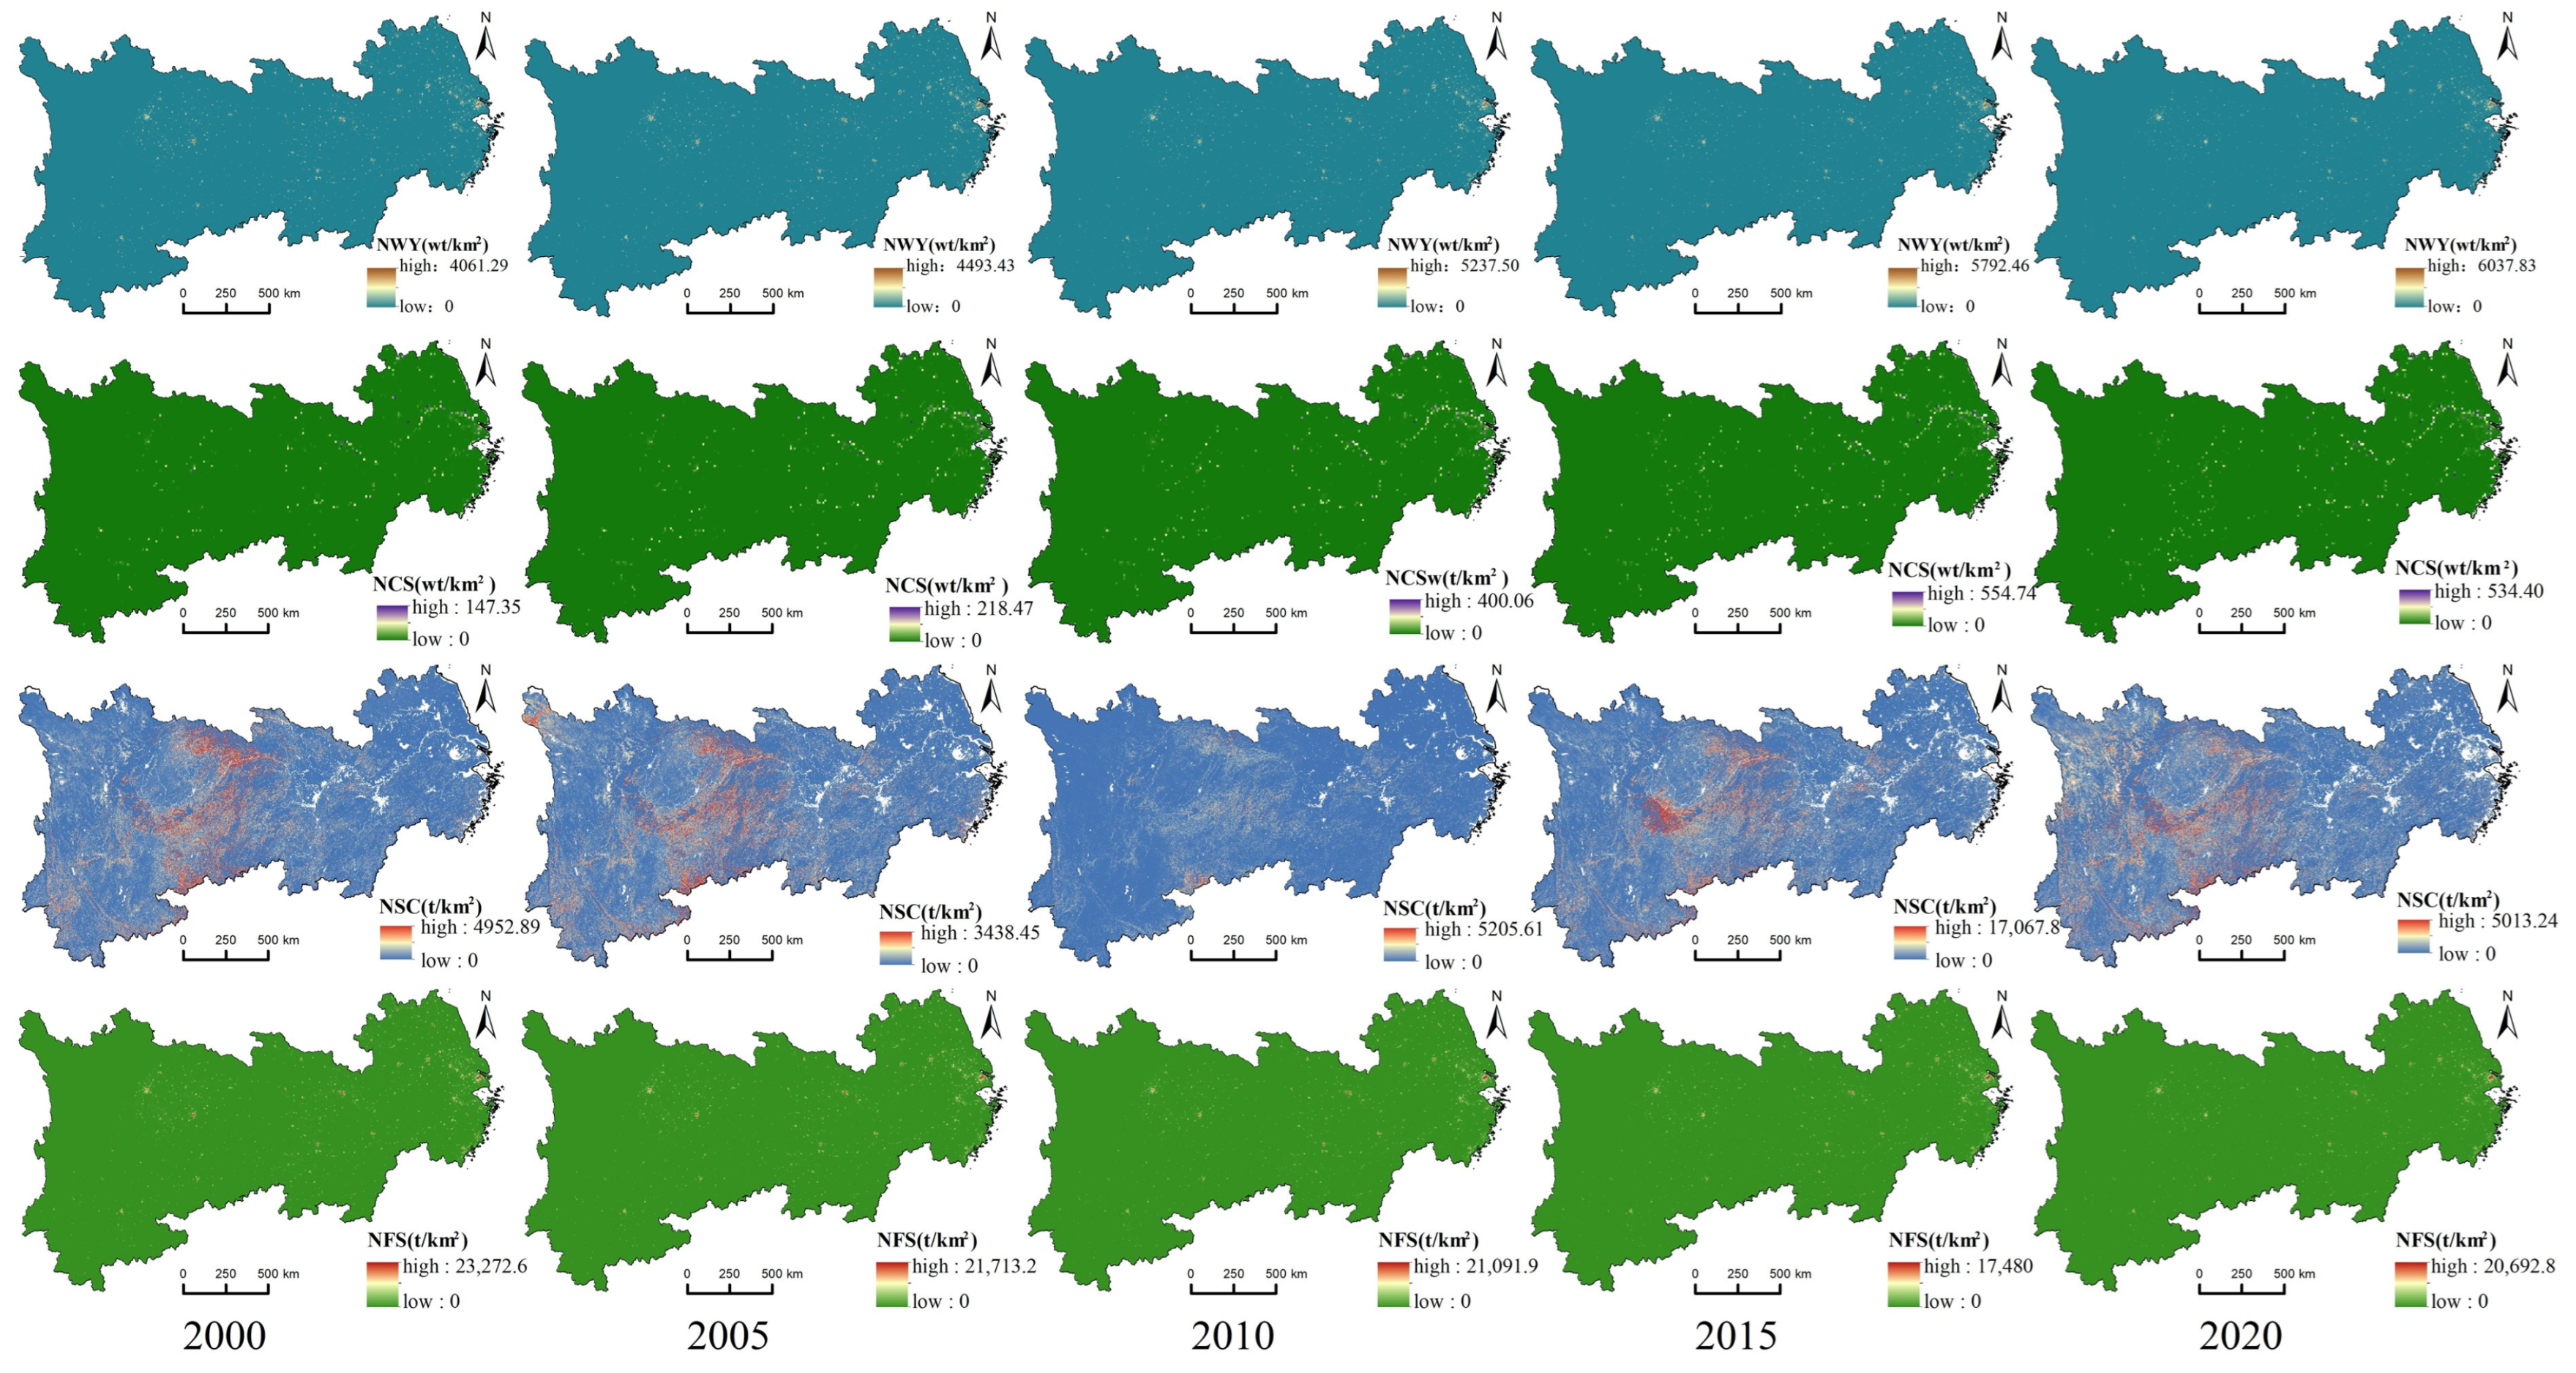
3.2. Analysis of Temporal and Spatial Variations in ESSD in the YZRB

The spatiotemporal distribution of ESSD from 2000 to 2020 is shown in Figure 4 and Figure 5. From a temporal perspective, the supply and demand for water yield (WY), carbon sequestration (CS), soil conservation (SC), and food supply (FS) in the YREB exhibited significant changes from 2000 to 2020. Overall, ecosystem service supply exceeded demand. Specifically, the WY in the YREB exhibited a continuous upward trend, and the highest average water yield was 628.54 mm in 2015. Over the 20-year period, the total WY demonstrated a 14.75% rise, with an average increase of 76.67 mm. Over the 20-year period, the average WY increased by 76.67 mm, and the total water yield increased by 14.75% year-on-year. However, the NWY increased by only 3.76%. Furthermore, the highest average water demand reached 96,207.03 m3/km2 in 2015, which represented an increase of 3303.27 m3/km2 over 20 years. Consequently, the YREB WY was in a state of surplus, indicating ample usable space. The CS supply per unit area showed a slight decline from 34.19 wt/km2 in 2000 to 34.01 wt/km2 in 2020, a change rate of −0.53%. However, due to rapid economic development, the NCS increased significantly from 6.62 to 20.09 t/km2 over the 20 years, a growth rate of 203.47%. The most notable increase occurred between 2005 and 2010, and it was closely related to industrial development. The unit area supply of SC and FS increased from 2.96 wt/km2 and 10.26 t/km2, respectively, in 2000 to 3.96 t/km2 and 60.56 t/km2 in 2020, with growth rates of 15.28% and 50.42%. These changes were linked closely to soil and water conservation policies, as well as food protection policies. Over the 20-year period, the overall NSC levels in the YREB remained relatively stable, with an average regional growth rate of only 6.66%. However, the NFS exhibited a fluctuating trend, as it initially decreased from 50.43 t/km2 in 2000 to 29.03 t/km2 in 2015 and then rose to 31.4 t/km2 in 2020. This represents an overall decline in food demand by 37.74% over the 20 years, which was linked closely to improvements in dietary structure and socio-economic development levels. In addition to the changes in total supply and demand over time, it is crucial to focus on the maximum values of supply and demand for various services. The results indicate that the maximum unit area demands for WY, CS, and SC increased by 48.47%, 262.61%, and 21.67%, respectively, whereas that for FS decreased by 37.74%. Correspondingly, the maximum unit area supply of WY increased by 14.75%, whereas CS decreased by 0.53%. The supply of SC per unit area increased by 15.28%, and the supply of FS per unit area rose by 50.42%. The increases and decreases in these maximum values reflect significant spatial differentiation and extreme ‘supply–demand disparity’, as environments are affected by rapid socio-economic development.
From a spatial perspective, WY is primarily concentrated in the major lake basins, river valleys and some of the basin catchment areas of the YREB. The overall spatial pattern shows higher concentrations in the southeastern regions and lower concentrations in the western regions. Over time, the key areas of WY have remained relatively unchanged, with high-value areas becoming more concentrated. This distribution pattern is closely related to the region’s topography and its water systems. NWY is primarily distributed around major cities, and it shows significant growth in areas with construction land. CS is generally low in the Yangtze River Delta urban agglomeration, the middle reaches of the Yangtze River urban agglomeration and Chengdu–Chongqing urban agglomeration. High values of CS are found in the western mountainous regions and southern hilly areas. The overall spatial pattern presents a gradient of higher values in the west and lower values in the east, with lower values in economically developed regions. Although the overall region remains stable over time, the low-value areas of CS in economically developed regions have significantly expanded. NCS exhibits a spatial trend that is opposite to that of CS as it is mainly concentrated along the Yangtze River. The spatial pattern of SC shows considerable variation primarily influenced by annual precipitation. High-value SC areas are widely distributed and mainly covered by forests, and low-value SC areas are primarily found in southeastern construction land and steep western mountainous areas. NSC is largely determined by topography and vegetation conditions. Severe rocky desertification and frequent soil erosion in the Yunnan-Guizhou Plateau result in high-value NSC areas primarily located in this region. High-value FS areas are mainly distributed in regions that are dominated by cultivated land and grassland. In contrast, areas that are primarily covered by forests and water bodies exhibit lower FS values. The general pattern shows higher FS in the central and eastern plains and lower FS in the southwestern plateau regions. NFS shows little variation, with high values mainly in densely populated urban areas.

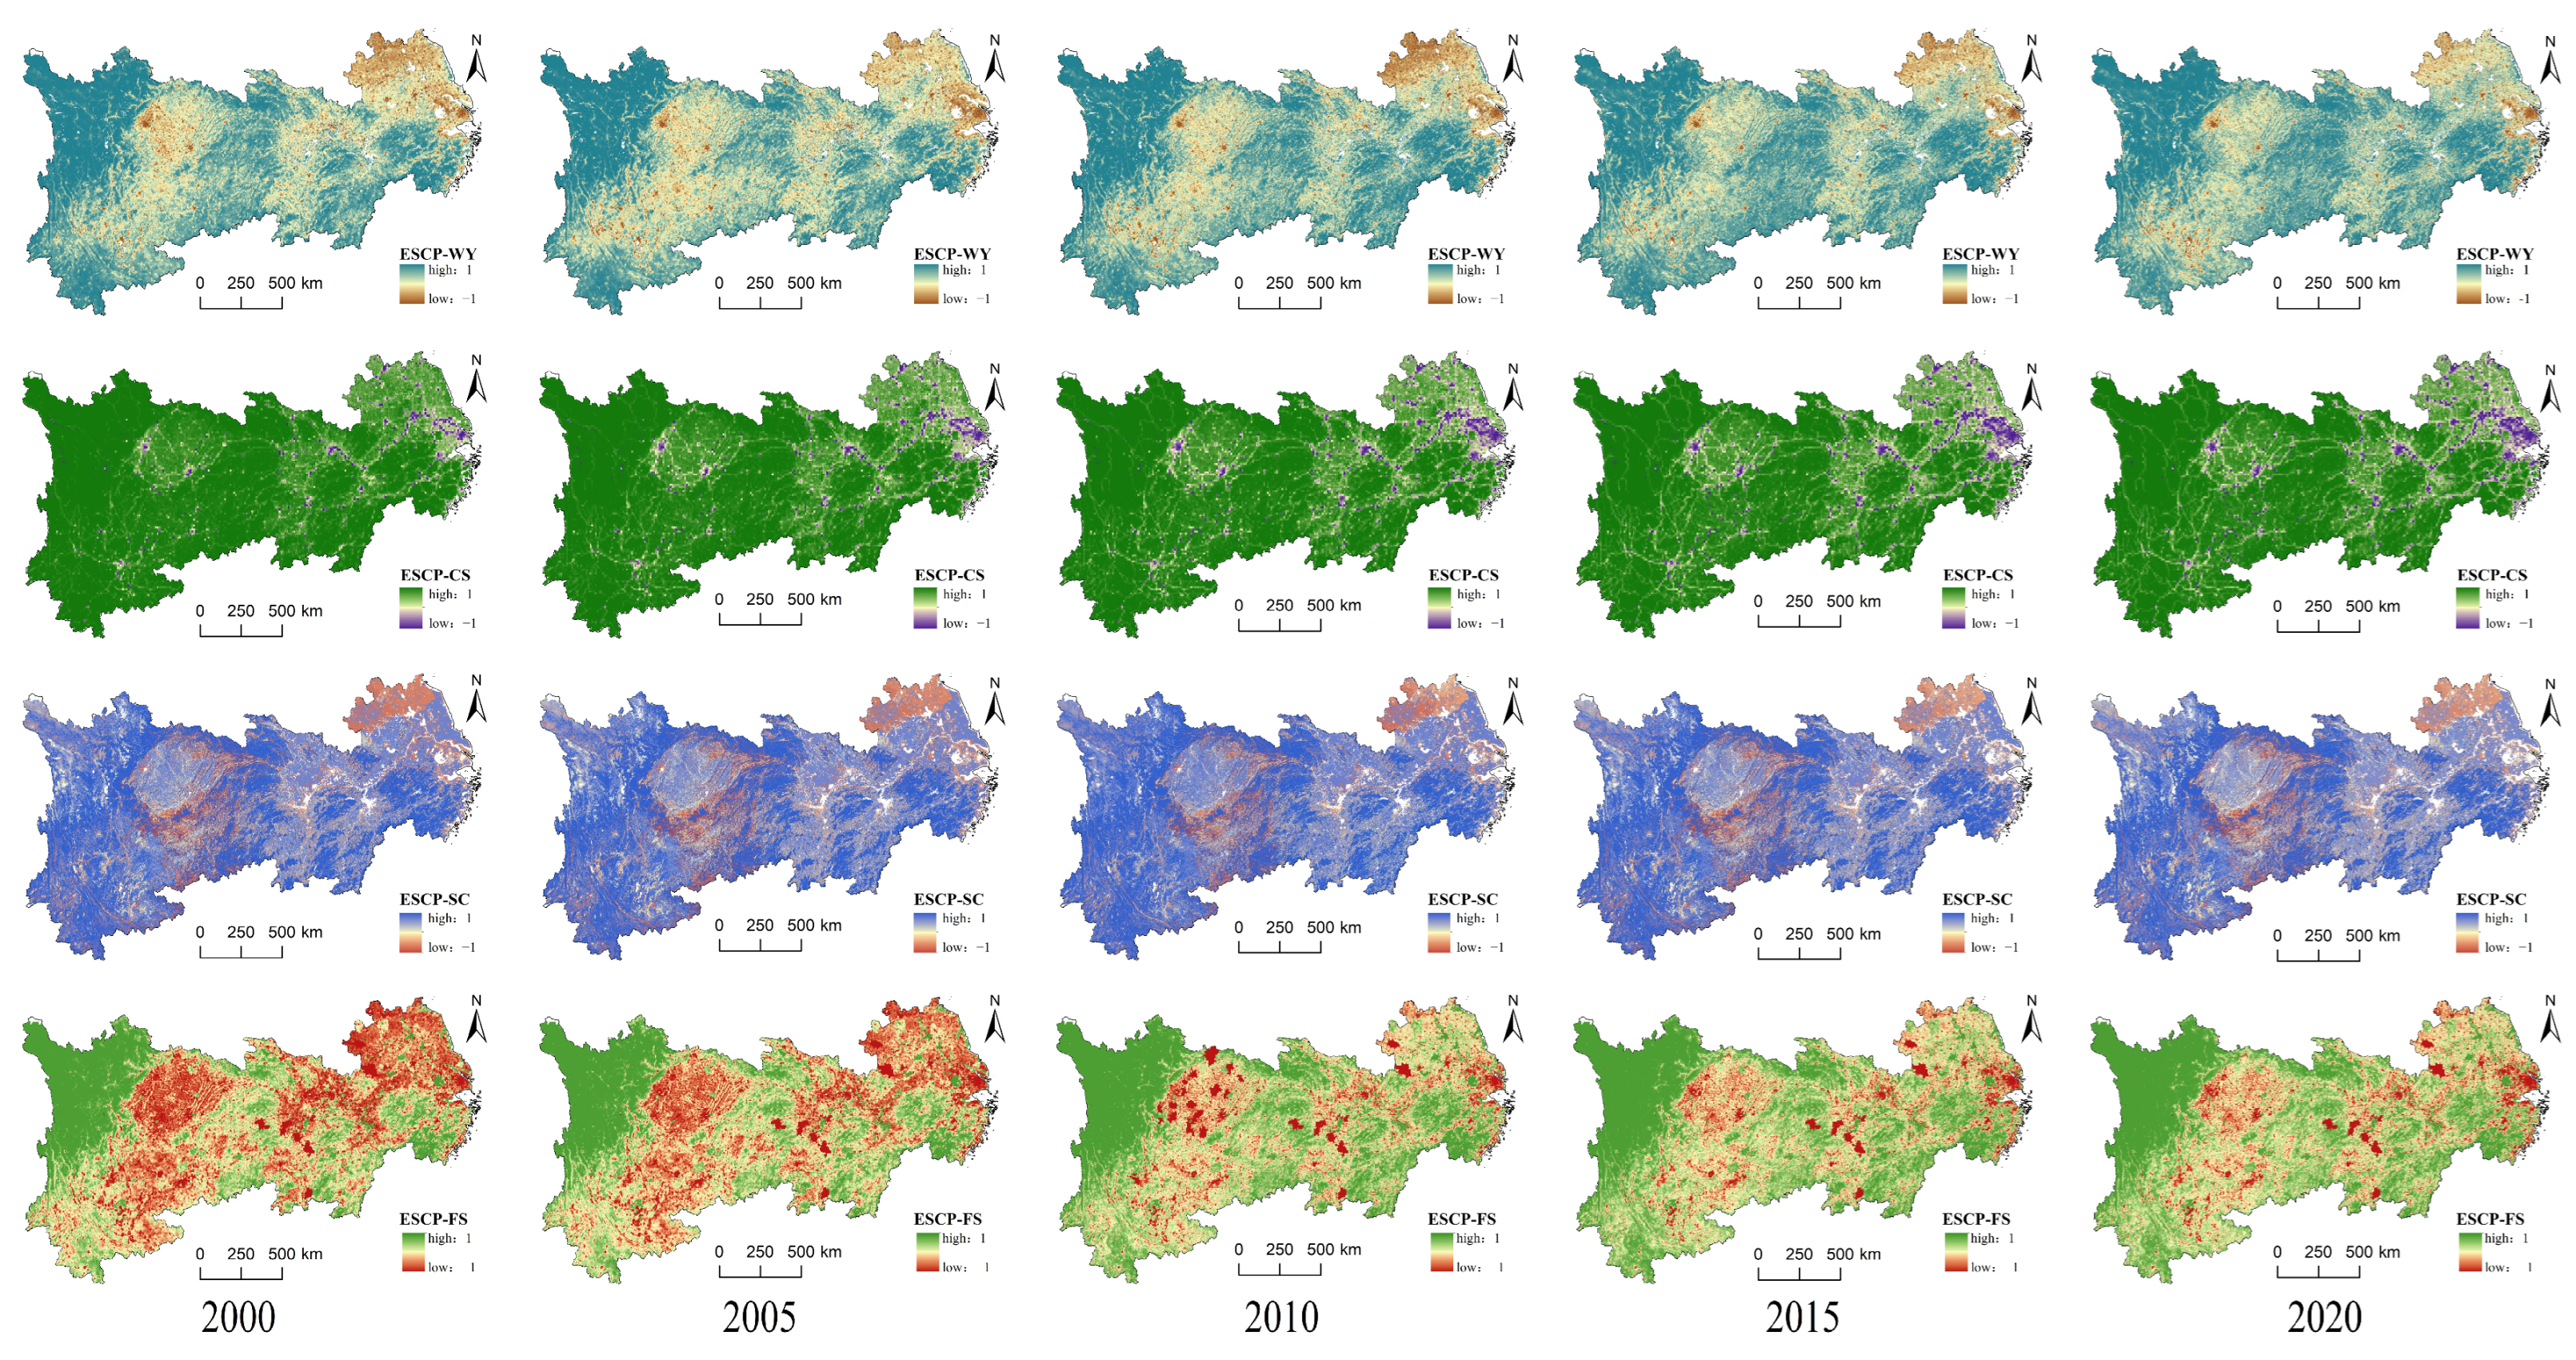
3.3. Analysis of Temporal and Spatial Changes in the ESCP in the YZRB

The spatiotemporal distribution of the ecosystem service supply–demand balance from 2000 to 2020 is presented in Figure 6. The results indicate that most regions primarily exhibit high supply–low demand or low supply–low demand patterns, whereas high supply–high demand and low supply–high demand patterns are less common. A few regions show mismatched supply and demand. For WY, supply–demand deficits are primarily observed in the Yangtze River Delta and Chengdu–Chongqing urban agglomerations. Slight deficits can also be seen in the urban agglomerations of the middle reaches of the Yangtze River and the southwestern mountainous areas. The overall WY deficit in these cities has remained relatively stable over time. The WY supply–demand index improved from 0.1988 in 2000 to 0.2015 in 2020, which was an overall increase of 4.78%. In contrast, the CS supply–demand ratio decreased significantly from 0.6758 in 2000 to 0.4181 in 2020, which is a decline of 41.83%. Spatially, there was a notable expansion of extreme values in major metropolitan areas. Cities such as Shanghai, Nanjing, Nanchang, Wuhan, Changsha, Chongqing, Chengdu, and their surrounding areas showed significant spatial expansion in CS supply–demand deficits. The SC supply–demand ratio saw a slight increase from 0.8914 in 2000 to 0.8964 in 2020, and it showed minimal overall change over time. Spatially, there remains a clear topographical demarcation, where lower supply–demand ratios are observed in areas such as the northern Jiangsu Plain, the Sichuan Basin and the Yunnan-Guizhou Plateau. The FS supply–demand ratio improved significantly from −0.1122 in 2000 to 0.1509 in 2020, which is an increase of 42.93%. Spatially, the FS supply–demand pattern shows a clear concentration in the central and eastern regions, with few deficits in the western regions. The overall spatial distribution of FS supply–demand deficits is shrinking. The focal expansion in the supply–demand balance of WY, CS, and FS can be attributed to rapid economic development, high population density, stricter ecological and agricultural land protection policies, and increased environmental awareness and living standards among residents in the YREB.

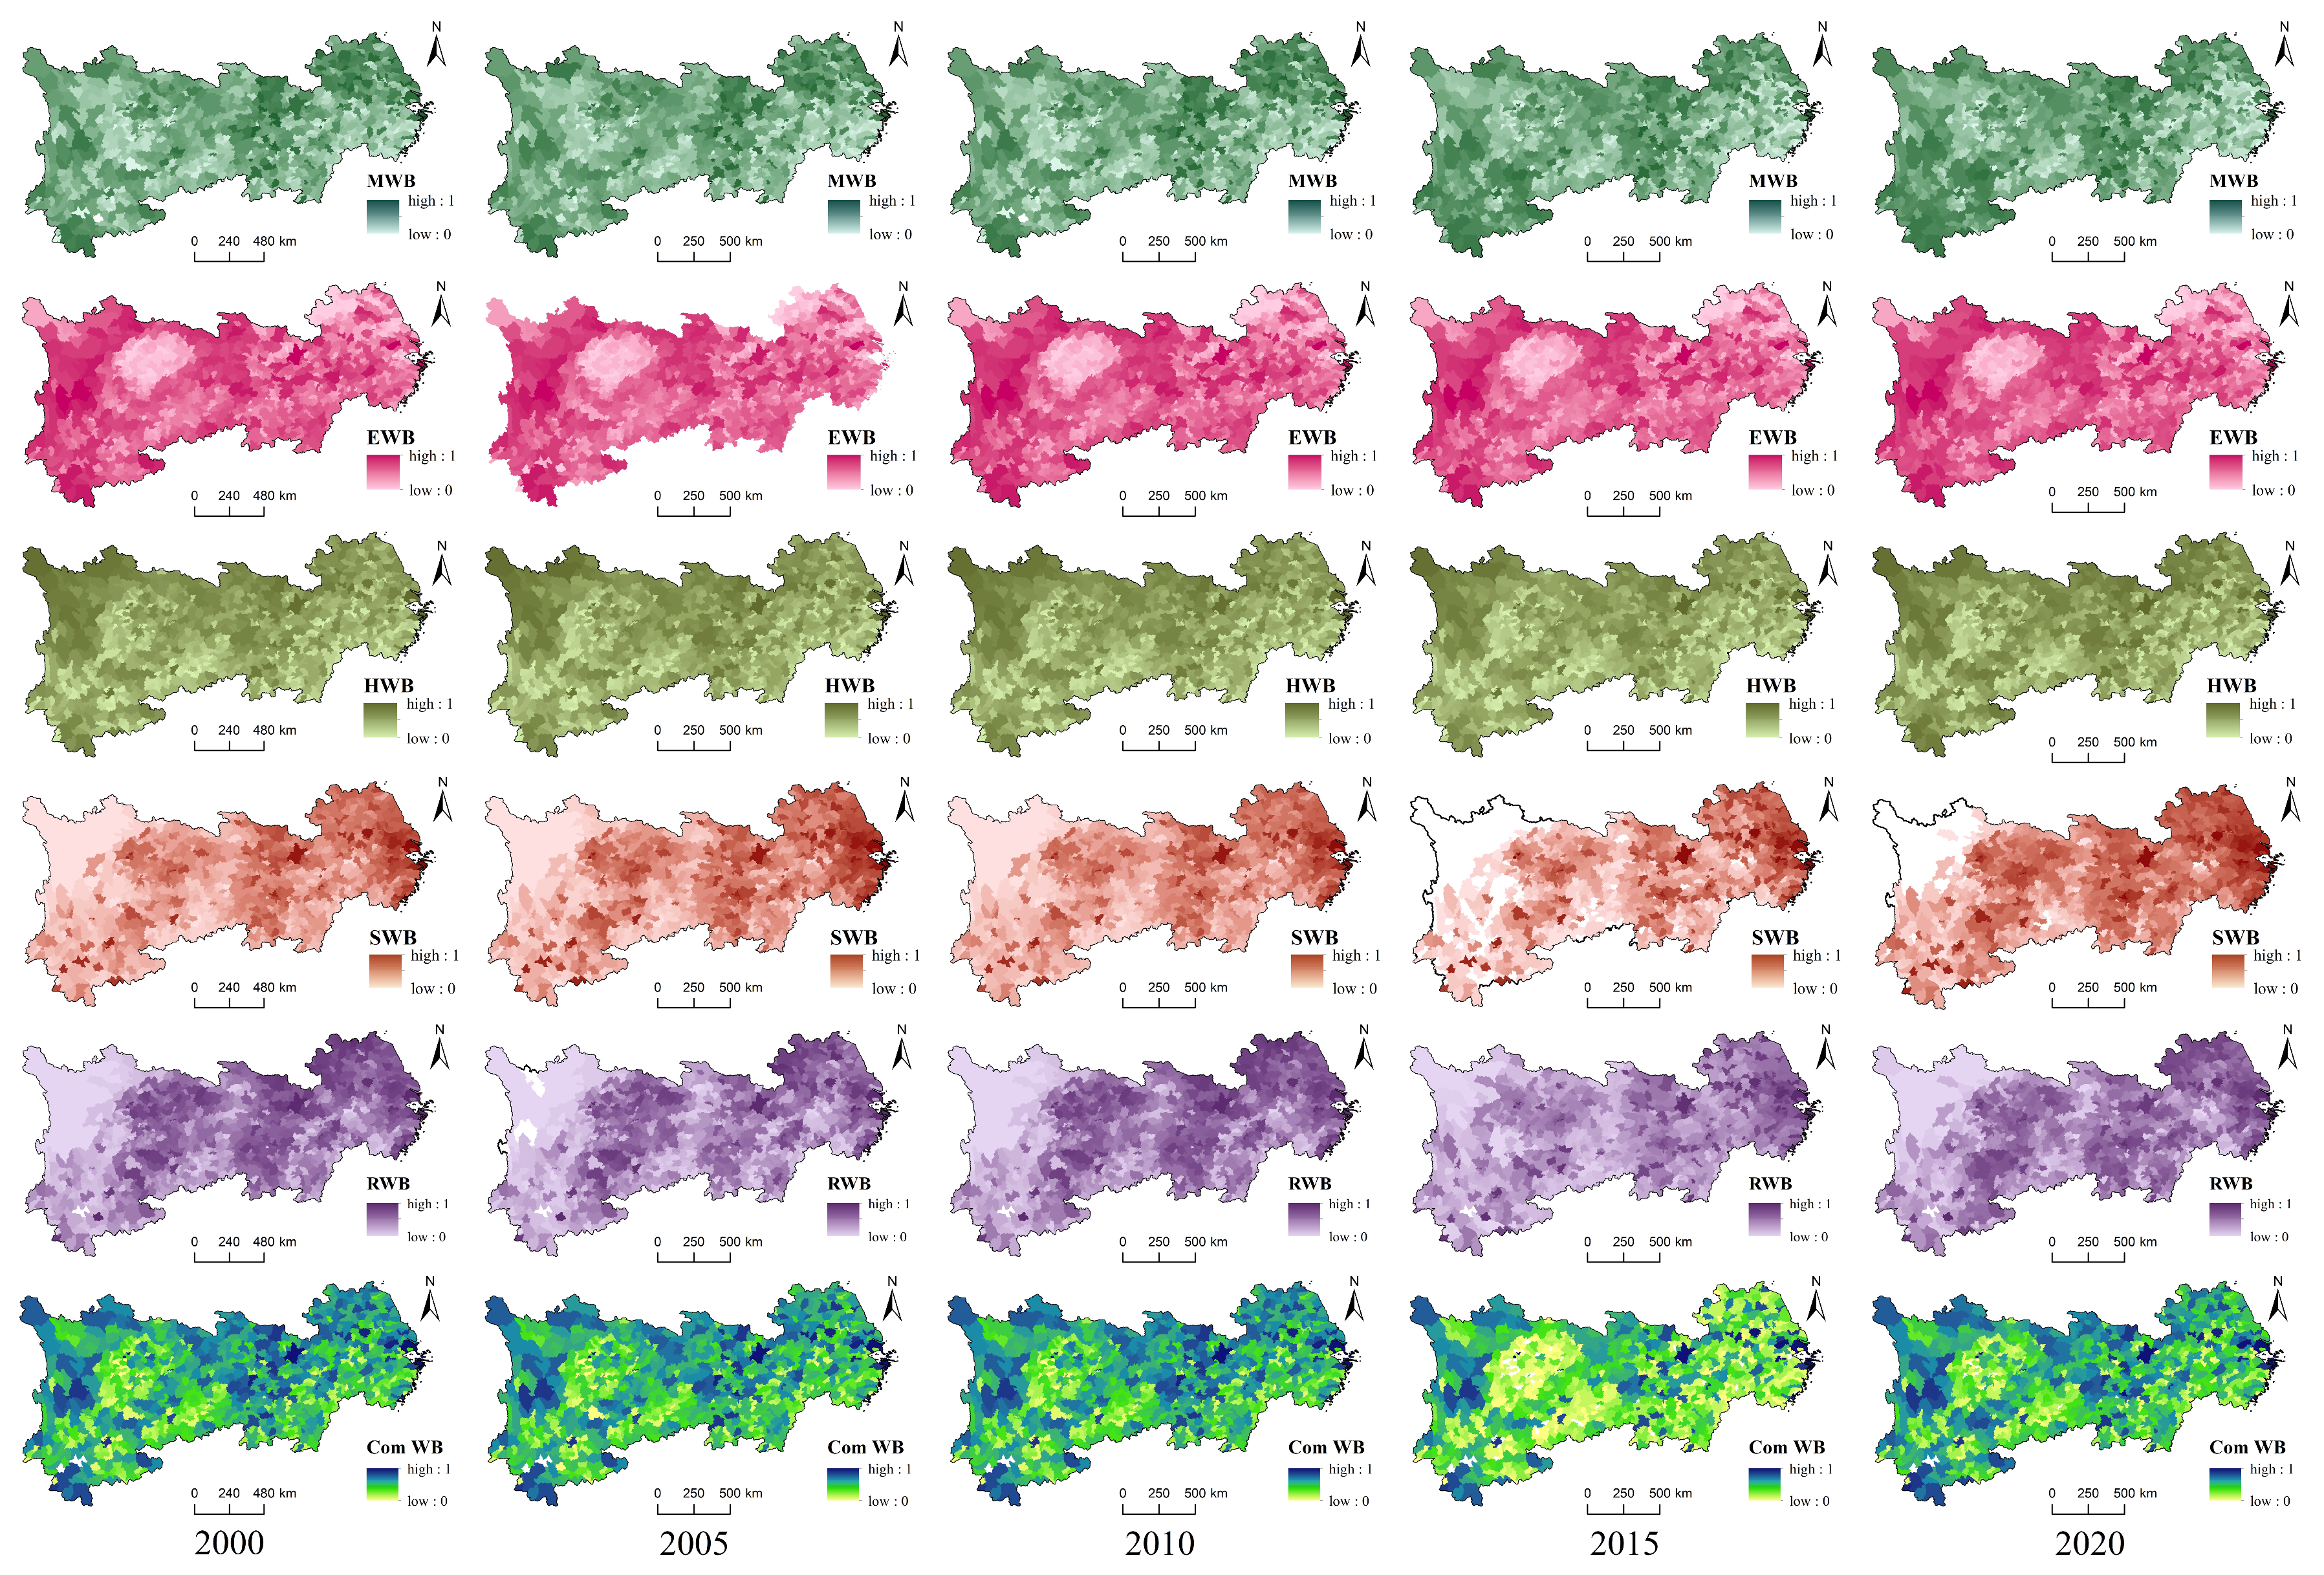
3.4. Analysis of Spatial and Temporal Changes in Human Wellbeing in the YZRB

The spatiotemporal distribution of human well-being from 2000 to 2020 is depicted in Figure 7. Over the 20-year period, the overall human well-being index showed an upward trend, with clear spatial differentiation characterised by ‘high values in the central and eastern regions and low values in the western regions’. Specifically, MWB exhibited high-value clusters in the plains of the central and northeastern regions, which are areas that have grain production. However, the MWB level decreased by 36.02% over the 20 years. In contrast, EWB showed an opposite spatial distribution pattern, with notable high-value clusters in the mountainous and hilly areas of the western and southwestern regions, and its level remained relatively stable over the 20 years. The overall HWB level was high across the region, with no significant spatial differentiation, and it increased by 78.15% over the 20 years. SWB and RWB exhibited similar spatial distributions, with prominent high-value clusters in the eastern coastal cities and central Yangtze River cities. Over the 20 years, the SWB level increased by 56.43%, whereas the RWB level decreased by 45.80%. This indicates a significant ‘polarisation of well-being between the rich and poor,’ where SWB continuously improved, but the well-being of individual residents declined. Comparing the level of socio-economic development with that of other regions in the YZRB, the eastern coastal cities and the three major urban agglomerations are more developed, and showed a marked spatial concentration of Com WB. The disparity between the eastern and western regions is significant and suggests that the socio-economic-development level is an important factor that influences human well-being.

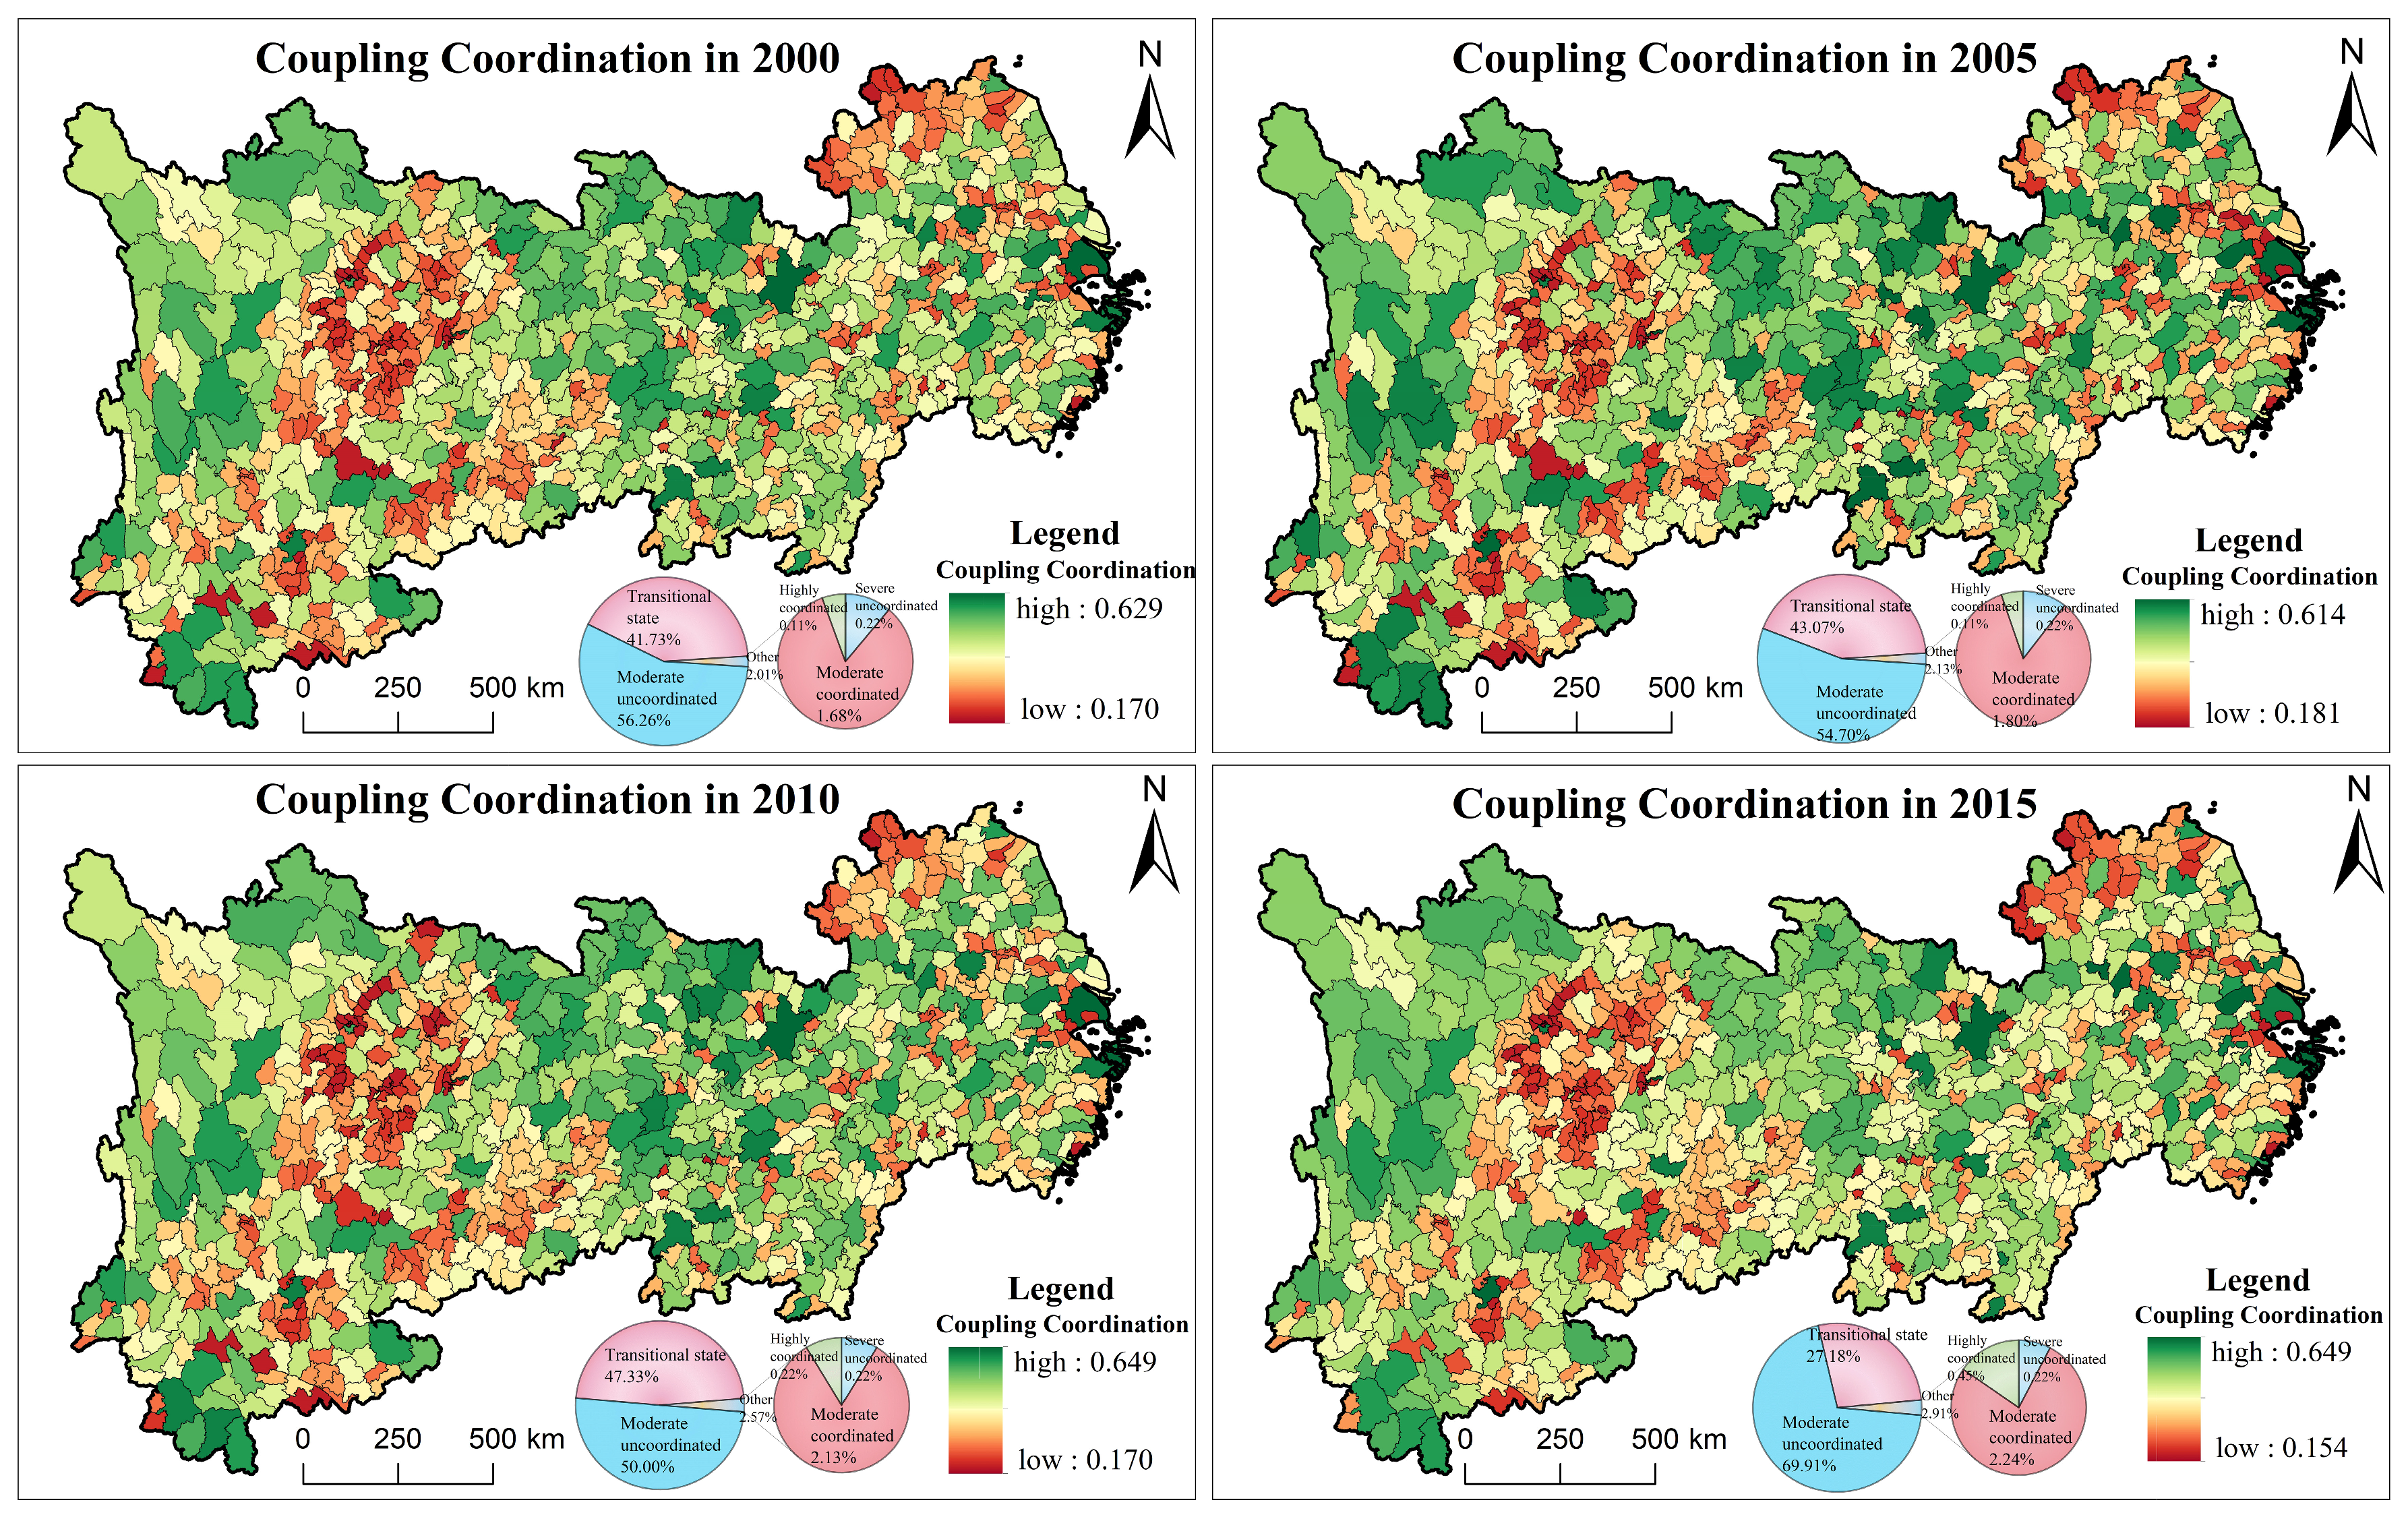
3.5. Spatiotemporal Analysis of the Coupling Coordination between ESCP and Com WB in the YZRB

The coupling coordination among ESSD, human well-being, and socio-economic development evolves with stages of social and economic development. Analysing the coupling coordination degree from the perspective of social development stages allows for a deep understanding of its intrinsic logic and fundamental mechanisms. The spatiotemporal distribution, coupling coordination relationship, and average degree of coupling coordination from 2000 to 2020 are shown in Figure 8, Figure 9, and Figure 10, respectively. The average degrees of coupling coordination of ESSD and human well-being in the years of 2000, 2005, 2010, 2015, and 2020 were 0.3926, 0.3941, 0.3997, 0.3818, and 0.4034, respectively, which indicates an overall increase of 0.0107 over the 20 years. In terms of the proportion of research units, the percentage of moderately imbalanced units decreased from 56.26% in 2000 to 47.32% in 2020, which is a decrease of 8.95%. The proportion of units in a transitional state increased from 41.72% in 2000 to 48.88% in 2020. The proportions of moderately coordinated and highly coordinated units also showed an increase. Spatially, the supply–demand of ecosystem service and human well-being exhibited a pronounced clustered distribution over the 20 years. This led to a concentrated spatial distribution of coupling coordination, with a notable ‘wealth disparity’ in coupling coordination levels. Sichuan Basin had a low coupling-coordination level, and most of its areas were in a state of moderate imbalance. Urban expansion and low land use efficiency exacerbated this imbalance between ecological and social systems. In contrast, the central region of Hubei Province, Chongqing Municipality and the eastern city of Shanghai exhibited higher coordination levels. These areas, located along the Yangtze River, enjoyed favourable ecological conditions, high ecosystem service supply–demand ratios, rapid economic growth, high land use efficiency and reasonable spatial patterns. The past 20 years have witnessed a continuous improvement in the degree of coupling coordination between human well-being and ESSD. Other regions showed a ‘misaligned’ distribution of ecological and social systems, and their coupling coordination level varied. Economically developed cities showed higher levels of coupling coordination; in comparison, economically underdeveloped cities had significant ecological advantages but lower degrees of coupling coordination with human well-being. The improvement in the degree of coupling coordination reflects increasing harmony between the natural ecology and human society in the YREB. The three major urban agglomerations are core development areas; hence, their levels of coupling coordination are at the top. This continuous improvement also highlights the ‘polarisation between the rich and poor’ issue in the coupling coordination between cities. On the one hand, we can see that the three major urban agglomerations have achieved effective environmental protection over the past 20 years. Their industrial transformation and upgrading have yielded significant results, and their ecological restoration and management have also been effective. Consequently, the supply and demand of ESs in these regions show improvement. On the other hand, the levels of human well-being in the three major urban agglomerations have rapidly risen. High-value areas of human well-being, primarily driven by socio-economic development, are mainly concentrated in these urban agglomerations. As socio-economic-development levels continue to rise, human well-being levels have also improved significantly. Combined with the 2020 LUCC, spatially, the overall coupling coordination in areas where the main land use cover type is cropland appears more obviously in low-value aggregation areas, and the general coupling coordination in areas where the land use cover type is forest appears obviously in high-value aggregation areas, and the ratio of other related land use covers in different cities also leads to the different cities in the coupling coordination degree. From the distribution of the proportion of LUCC and coupling coordination, the proportion of construction land in all land use covers is similar to the proportion of moderately coordinated cities in all cities, the proportion of forest is similar to the proportion of transitional states, and the proportion of other different land use covers is similar to the proportion of coupling coordination. The proportion of forest is similar to that of transitional states, and the proportion of other different land use covers is also similar to the proportion of moderately coordinated cities. This pattern may be explained by the fact that land use cover is an important factor contributing to the degree of coordination between ecosystems and human well-being. To further improve the relationship between ESs and human well-being, it is essential to optimise the national spatial layout, maintain ecosystem stability, promote inter-regional linkage development and drive industrial transformation and diversification.

3.6. Analysis of Spatial Autocorrelation Results

This study further analyses the spatial autocorrelation of the degree of coupling coordination between ESSD and human well-being. The global Moran’s I and local Moran’s I indices were employed to evaluate the spatial correlation of the coupling coordination degree. The results of the global Moran’s I are presented in Figure 11. From 2000 to 2020, the Moran’s I of the coupling coordination degree ranged from 0.143 to 0.196 and this difference was significant at the 1% level of probability, indicating that cities with a high coupling coordination degree tend to be geographically close and form strong alliances. However, this clustering of cities with a high coupling-coordination degree also highlights the challenge of balanced development within the YREB. The positive Moran’s I results suggest a significant spatial spillover effect for the degree of coupling coordination within a certain regional scope. However, the Moran’s I decreased from 0.183 in 2000 to 0.144 in 2020, indicating a declining trend in regional interconnectivity. This suggests that the spillover effects might have weakened across regions within the YREB. To identify spatial clustering patterns, a Local Indicators of Spatial Association cluster map was created (Figure 11). The results show that economically developed areas such as Hubei Province, Chongqing Municipality and the Yangtze River Delta urban agglomeration primarily exhibit ‘high–high’ clustering, with a clear and contiguous clustering pattern interspersed with some ‘low-high’ clusters. The northern Jiangsu Plain, Sichuan Basin and Yunnan-Guizhou Plateau regions primarily exhibit ‘low–low’ clustering and also show a clear contiguous pattern interspersed with some ‘high-low’ clusters. Over the 20 years, the number of ‘high–high’ clustered units decreased from 144 in 2000 to 89 in 2020; the number of ‘low–low’ clustered units also decreased from 176 in 2000 to 149 in 2020. This indicates a significant contraction in the effect of inter-regional linkage.

4. Discussion

4.1. ESSD and Increasing Levels of Human Well-Being

This study analysed the coupling coordination between ESSD and human well-being from a spatiotemporal perspective.
The research findings contribute to our understanding of the human–environment relationship within the context of ecology, geography and sociology [21]; they align with the Chinese Government’s vision of creating a Community with a Shared Future for Mankind within the YREB [66]. On the one hand, the observed improvement in ESs within the YREB aligns with the national development goals for the region and is directly related to the continuous conservation and sustainable utilisation of natural resources [67]; on the other hand, the enhancement of human well-being within the region helps to alleviate the conflict between ecological protection and the improvement in livelihood well-being, which is closely related to the vision of constructing a ‘Community with a Shared Future for Mankind’ [47]. LUCC may lead to notable variations in the supply and demand of ESs. Relevant studies have indicated that optimising land use structure helps enhance ecosystem integrity and promotes the restoration of ecosystems [68]. Over the past 20 years, the supply levels in the YREB of ESs such as WY, CS, SC, and FS have been continuously improving, and this result is similar to previous studies [39,69,70]. The spatial pattern of these services primarily exhibits a ‘more-in-the-west, less-in-the-east’ characteristic. Although the high-value supply areas have been shrinking, the number of cities that have supply peaks is increasing. Conversely, NWY, NCS, NSC, and NFS have shown a clear spatial expansion trend primarily in the Yangtze River Delta urban agglomeration, the middle reaches of the Yangtze River urban agglomeration and the Chengdu–Chongqing urban agglomeration. The demand peaks in these regions are continually increasing, consistent with existing research findings [30,63,71,72,73,74]. In the supply–demand relationships, the balance of WY and SC has remained relatively stable. Although CS remains in a surplus state, it has been declining rapidly. In contrast, the balance of FS has been steadily improving and has shifted from a deficit to a surplus state. This trend is related to the long-term rapid economic development and strong farmland protection policies of the YREB [75]. Thus, it is essential to optimise land use structure, focus on ecological protection, mitigate human–land conflicts, and promote regional coordinated development. Moreover, the overall level of human well-being has remained stable and has shown homogeneity with socio-economic-development levels, with higher well-being levels in the central and eastern urban agglomerations. This indicates that while some aspects of well-being are degrading, others are improving. From a conservation perspective, urban expansion has led to increased levels of SWB but has damaged the environment and resulted in lower EWB levels [40]. Thus, in addressing human–land relationships, greater attention must be paid to the coupling coordination between ecosystems and social systems [59].

4.2. Exploration of Coordination Issues in Ecosystem Governance and Human Well-Being

The results of the coupling coordination model show significant temporal and spatial variations in the balance between ESs and human well-being in the YREB. These variations manifest as either spatial spillover effects or spatial inhibition feedbacks, as has been found in related studies [38,57,60]. Overall, the coupling coordination level shows that most cities in the YREB are either in a transitional state or are moderately imbalanced. In those cities that are moderately imbalanced, the mismatch between well-being levels and ESs may constrain the development of human well-being. To address this problem, diversifying and expanding the channels through which ESs contribute to human well-being is essential. In cities that are in a transitional state, both human well-being and ecosystem service levels are generally positive. However, sudden drops in ecosystem supply or spikes in demand may negatively impact well-being levels and reduce coupling coordination. To prevent this, land use structures should be optimised, local vegetation cover should be increased, and the environment should be protected by ‘zoning control policies’ [76]. For cities that have moderate–high coordination, government agencies should enhance the regional spillover effects of the ESs and leverage geographic proximity to further harmonise human–environment relationships and promote coordinated development both within and outside the region. Furthermore, over the past 20 years, the trend in coupling coordination between ESs and human well-being has generally been positive. This improvement is likely due to coordinated development within and outside the region. Therefore, strengthening intra- and inter-regional coordination is crucial. This can be achieved by promoting the ‘spread of well-being’ from coastal to inland areas and by fostering ‘ecological expansion’ from inland to coastal regions.

4.3. Recommendations for Promoting Ecological Conservation and Human Well-Being

This study aims to provide a reference for the long-term coordinated development of China’s coastal, riverine and economic belts. It significantly shapes a new pattern of regional coordinated development. This pattern is characterised by the orderly and free flow of factors, effective constraints on functional entities, equal access to basic public services and sustainable resources and the environmental capacity. More importantly, by using the YREB in China as a typical study object representing the coordinated development between ESs and human well-being, this study offers universal reference cases for other major river basin economic belts worldwide [77].
This study proposes the following management recommendations: optimising land use structure, rationally allocating regional environmental resources and strengthening intercity connections and cooperation, particularly among the upper, middle and lower reaches of the river, to promote regional coordinated development; reinforcing the implementation of policies associated with ecological and environmental protection, establishing regional ecological compensation mechanisms, setting up special funds for regional environmental protection and coordinating comprehensive ecological protection across the entire area; emphasising the coordination of human–land relationships, building multi-stakeholder collaborative governance mechanisms to ensure efficient resource utilisation, improving people’s well-being and enhancing regional ecological protection and human well-being.

4.4. Innovations and Limitations

This study explores the spatiotemporal characteristics of the supply and demand of ESs and human well-being, and it reveals their coupling coordination relationship. The research findings serve as a reference with which to formulate multi-objective collaborative management policies and development strategies for promoting ecological protection and human well-being. However, there are some limitations and shortcomings to this study. First, the use of statistical yearbook data for measuring human well-being may result in significant regional differences. These data do not match the precision of the grid data used for measuring ESs. To address this problem, this study standardises all data to research units, and it calculates the degree of coupling coordination between ESSD and human well-being. Second, the measurement of human well-being at the county level overlooks the impact of individual residents’ happiness at the micro-scale. To address this, this study uses individual well-being instead of a subjective sense of happiness. Finally, the coupled coordination degree model is used in the study of the relationship between ESCP and human well-being, and reference is made to related studies [38,78,79] to improve the credibility of the coupled coordination degree in this study. On the one hand, the coupled coordination degree approach is a quantification of the binary system, and on the other hand, the use of the coupled coordination degree model with a high degree of credibility is more able to accurately measure the actual relationship between the complex systems. Future research should adopt questionnaire surveys and participatory interviews to evaluate subjective happiness and to allow for a deeper exploration of the coupling coordination relationship.

5. Conclusions

This study focuses on the YREB and explores the spatiotemporal evolution characteristics of ESSD and human well-being based on LUCC analysis, thereby revealing their coupling coordination relationship.
The study found that from 2000 to 2020, the overall trend in ESs in the YREB improved, and there was a significant increase in supply, and the demand growth rate was more pronounced. The supply–demand ratio exhibited negligible change for WY and SC, with variations being <10%. However, the supply–demand ratio for CS significantly declined by 41.83%, whereas the supply–demand ratio for FS significantly increased by 42.93%. The overall spatial pattern of ESSD presented a mismatch: ‘low supply and high demand in the east and high supply and low demand in the west’. The overall level of human well-being remained stable, and it showed homogeneity with socio-economic-development levels, with a clear trend of well-being ‘polarisation between the rich and poor’. Higher levels of well-being were observed in the eastern and central urban agglomerations, whereas lower levels were observed in the western plateau and mountainous areas. Over the 20-year period, the degree of coupling coordination between ESSD and human well-being increased by 0.0107, and it transitioned from moderate imbalance to moderate coordination. Spatially, Hubei Province, Chongqing Municipality and the Yangtze River Delta were the main ‘high–high’ agglomeration areas, and the Sichuan Basin and Yunnan-Guizhou Plateau were the main ‘low–low’ agglomeration areas. The inter-regional linkage effect, geographic proximity effect and spatial spillover mechanisms of coupling coordination significantly weakened.

Author Contributions

Fund acquisition, Z.L.; conceptualization, Z.L. and S.L.; methodology, Z.L. and S.L.; formal analysis, Z.L.; writing—original draft preparation, Z.L. and S.L.; writing—review and editing, Z.L., S.L., F.Z. and X.Y.; supervision, Z.L. and S.L. software, S.L. and F.Z.; visualisation, S.L. and F.Z.; data collection, S.L. and X.Y. All authors have read and agreed to the published version of the manuscript.

Funding

This research was supported by the Humanities and Social Sciences Research Planning Foundation of the Ministry of Education of China “Research on Spatial Coupling and Optimization Control of Urban Land Expansion and Ecological Network Protection Based on Game theory” (Grant No. 19YJAZH061), and by the National Natural Science Foundation of China “Research on Spatiotemporal Coupling and Optimization Control of Urban Expansion and Ecological Network Protection Based on Game theory” (Grant No. 41961042).

Institutional Review Board Statement

Not applicable.

Informed Consent Statement

Not applicable.

Data Availability Statement

Data can be made available by contacting the corresponding author.

Conflicts of Interest

The authors declare that they have no known competing financial interests or personal relationships that could have appeared to influence the work reported in this paper.

References

  1. Daily, G.; Dasgupta, S. Ecosystem Services, Concept of. In Encyclopedia of Biodiversity; Levin, S.A., Ed.; Elsevier: New York, NY, USA, 2001; pp. 353–362. [Google Scholar]
  2. Guo, Z.; Xiao, X.; Gan, Y.; Zheng, Y. Ecosystem functions, services and their values—A case study in Xingshan County of China. Ecol. Econ. 2001, 38, 141–154. [Google Scholar] [CrossRef]
  3. Reid, W.V.; Mooney, H.A. The Millennium Ecosystem Assessment: Testing the limits of interdisciplinary and multi-scale science. Curr. Opin. Env. Sust. 2016, 19, 40–46. [Google Scholar] [CrossRef]
  4. Wang, Y.; Sun, J.; Liu, C.; Liu, L. Exploring the nexus between perceived ecosystem services and well-being of rural residents in a mountainous area, China. Appl. Geogr. 2024, 164, 103215. [Google Scholar] [CrossRef]
  5. Burkhard, B.; Petrosillo, I.; Costanza, R. Ecosystem services—Bridging ecology, economy and social sciences. Ecol. Complex. 2010, 7, 257–259. [Google Scholar] [CrossRef]
  6. Mancini, M.S.; Galli, A.; Coscieme, L.; Niccolucci, V.; Lin, D.; Pulselli, F.M.; Bastianoni, S.; Marchettini, N. Exploring ecosystem services assessment through Ecological Footprint accounting. Ecosyst. Serv. 2018, 30, 228–235. [Google Scholar] [CrossRef]
  7. Li, S.; Yu, D.; Li, X. Exploring the impacts of ecosystem services on human well-being in Qinghai Province under the framework of the sustainable development goals. J. Environ. Manag. 2023, 345, 118880. [Google Scholar] [CrossRef]
  8. Xu, Y.; Liu, Y.; Sun, Q.; Qi, W. Construction of Cultivated Land Ecological Network Based on Supply and Demand of Ecosystem Services and MCR Model: A Case Study of Shandong Province, China. Sustainability 2024, 16, 3745. [Google Scholar] [CrossRef]
  9. Xue, B.; Han, B.; Li, H.; Gou, X.; Yang, H.; Thomas, H.; Stückrad, S. Understanding ecological civilization in China: From political context to science. Ambio 2023, 52, 1895–1909. [Google Scholar] [CrossRef]
  10. Hansen, M.H.; Li, H.; Svarverud, R. Ecological civilization: Interpreting the Chinese past, projecting the global future. Glob. Environ. Chang. 2018, 53, 195–203. [Google Scholar] [CrossRef]
  11. Zhang, C.; Li, J.; Zhou, Z. Ecosystem service cascade: Concept, review, application and prospect. Ecol. Indic. 2022, 137, 108766. [Google Scholar] [CrossRef]
  12. Huang, X.; Chen, Y.; Ma, J.; Chen, Y. Study on change in value of ecosystem service function of Tarim River. Acta Ecol. Sin. 2010, 30, 67–75. [Google Scholar] [CrossRef]
  13. Bai, Y.; Zhuang, C.; Ouyang, Z.; Zheng, H.; Jiang, B. Spatial characteristics between biodiversity and ecosystem services in a human-dominated watershed. Ecol. Complex. 2011, 8, 177–183. [Google Scholar] [CrossRef]
  14. Wegner, G.; Pascual, U. Cost-benefit analysis in the context of ecosystem services for human well-being: A multidisciplinary critique. Glob. Environ. Chang. 2011, 21, 492–504. [Google Scholar] [CrossRef]
  15. Zeng, J.; Cui, X.; Chen, W.; Yao, X. Ecological management zoning based on the supply-demand relationship of ecosystem services in China. Appl. Geogr. 2023, 155, 102959. [Google Scholar] [CrossRef]
  16. Zheng, P.; Jin, L.; Huang, Y.; Pan, W. Spatial and Temporal Dynamic Evolution and Correlation of Ecological Quality and Ecosystem Service Value in Fujian Province. Sustainability 2024, 16, 5063. [Google Scholar] [CrossRef]
  17. He, L.; Zhang, X.; Zhang, X. Urbanization with the pursuit of efficiency and ecology: Theory and evidence from China. Environ. Impact Assess. Rev. 2023, 103, 107274. [Google Scholar] [CrossRef]
  18. Wang, M.; Huang, H.; Xiong, J.; Yuan, Z.; Zeng, K. Impact of ecological reserves on the local residents’ health: Evidence from a natural experiment in China. Soc. Sci. Med. 2023, 336, 116186. [Google Scholar] [CrossRef]
  19. Wu, J. Urban ecology and sustainability: The state-of-the-science and future directions. Landsc. Urban Plan 2014, 125, 209–221. [Google Scholar] [CrossRef]
  20. Costanza, R.; D’Arge, R.; de Groot, R.; Farber, S.; Grasso, M.; Hannon, B.; Limburg, K.; Naeem, S.; O’Neill, R.V.; Paruelo, J.; et al. The value of the world’s ecosystem services and natural capital. Nature 1997, 387, 253–260. [Google Scholar] [CrossRef]
  21. Zhou, Y.; Huang, Q.; Wu, P.; Hou, Y.; Zhou, Y.; Chen, P.; Duan, X. Seasonal variations in ecosystem service supply and demand based on the SWAT model: A case study in the Guanting Reservoir Basin, China. Ecol. Indic. 2024, 158, 111552. [Google Scholar] [CrossRef]
  22. Liu, L.; Bao, S.; Han, M.; Li, H.; Hu, Y.; Zhang, L. Dynamic Spatio-Temporal Simulation of Land Use and Ecosystem Service Value Assessment in Agro-Pastoral Ecotone, China. Sustainability 2024, 16, 5922. [Google Scholar] [CrossRef]
  23. Jian, Z.; Sun, Y.; Wang, F.; Zhou, C.; Pan, F.; Meng, W.; Sui, M. Soil conservation ecosystem service supply-demand and multi scenario simulation in the Loess Plateau, China. Glob. Ecol. Conserv. 2024, 49, e02796. [Google Scholar] [CrossRef]
  24. Xie, Y.; Dai, W.; Xiang, S.; Deng, H.; Wang, Z.; Li, Y.; Wang, Z.; Zhou, M.; Gao, M. Supply and demand of ecosystem services and their interaction with urbanization: The case of Chengdu-Chongqing urban agglomeration. Urban Clim. 2024, 55, 101978. [Google Scholar] [CrossRef]
  25. Daigneault, A.; Simons-Legaard, E.; Weiskittel, A. Tradeoffs and synergies of optimized management for maximizing carbon sequestration across complex landscapes and diverse ecosystem services. Forest Policy Econ. 2024, 161, 103178. [Google Scholar] [CrossRef]
  26. Wu, C.; Lu, R.; Zhang, P.; Dai, E. Multilevel ecological compensation policy design based on ecosystem service flow: A case study of carbon sequestration services in the Qinghai-Tibet Plateau. Sci. Total Environ. 2024, 921, 171093. [Google Scholar] [CrossRef]
  27. Yang, X.; Luo, J. Construction of territorial spatial ecological network oriented to residents’ ecological well-being: Take Nanchang City as an example. Acta Agric. Univ. Jiangxiensis 2023, 45, 1297–1310. [Google Scholar] [CrossRef]
  28. Gao, G.; Liang, Y.; Liu, J.; Dunkerley, D.; Fu, B. A modified RUSLE model to simulate soil erosion under different ecological restoration types in the loess hilly area. Int. Soil Water Conserv. 2024, 12, 258–266. [Google Scholar] [CrossRef]
  29. Perschke, M.J.; Harris, L.R.; Sink, K.J.; Lombard, A.T. Using ecological infrastructure to comprehensively map ecosystem service demand, flow and capacity for spatial assessment and planning. Ecosyst. Serv. 2023, 62, 101536. [Google Scholar] [CrossRef]
  30. Qu, H.; You, C.; Feng, C.; Guo, L. Spatial responses of ecosystem services to carbon emission efficiency based on spatial panel models in the Yangtze River Economic Belt. J. Clean. Prod. 2024, 434, 139953. [Google Scholar] [CrossRef]
  31. Sisay, G.; Gessesse, B.; Fürst, C.; Kassie, M.; Kebede, B.; Alemu, W.G. Evaluating the spatiotemporal dynamics of ecosystem service values in response to land use/land cover change in Goang watershed, Northwest Ethiopia. Environ. Chall. 2024, 15, 100908. [Google Scholar] [CrossRef]
  32. Liu, Z.; Zhang, W.; Lu, H.; Ji, J.; Yang, Z.; Chen, C. Exploring evolution characteristics of eco-environment quality in the Yangtze River Basin based on remote sensing ecological index. Heliyon 2023, 9, e23243. [Google Scholar] [CrossRef]
  33. Liu, S.; Wang, C.; Chen, Z.; Li, Q.; Wu, Q.; Li, Y.; Wu, J.; Yu, B. Enhancing nighttime light remote Sensing: Introducing the nighttime light background value (NLBV) for urban applications. Int. J. Appl. Earth Obs. 2024, 126, 103626. [Google Scholar] [CrossRef]
  34. Li, Y.; Geng, H.; Luo, G.; Wu, L.; Wang, J.; Wu, Q. Multiscale characteristics of ecosystem service value trade-offs/synergies and their response to landscape pattern evolution in a typical karst basin in southern China. Ecol. Inform. 2024, 81, 102584. [Google Scholar] [CrossRef]
  35. Zhang, C.; Yang, G.; Chen, D.; Zhang, H. Spatiotemporal coupling relationship between supply-demand balance of ecosystem services and welfare of residents in the Middle Reaches of the Yangtze River. Trans. Chin. Soc. Agric. Eng. 2024, 40, 356–368. [Google Scholar]
  36. Mitchell, A.; Larson, K.L.; Pfeiffer, D.; Rosales Chavez, J. Planning for Urban Sustainability through Residents’ Wellbeing: The Effects of Nature Interactions, Social Capital, and Socio-Demographic Factors. Sustainability 2024, 16, 4160. [Google Scholar] [CrossRef]
  37. Tao, J.; Lu, Y.; Ge, D.; Dong, P.; Gong, X.; Ma, X. The spatial pattern of agricultural ecosystem services from the production-living-ecology perspective: A case study of the Huaihai Economic Zone, China. Land Use Policy 2022, 122, 106355. [Google Scholar] [CrossRef]
  38. Zhang, K.; Jin, Y.; Li, D.; Wang, S.; Liu, W. Spatiotemporal variation and evolutionary analysis of the coupling coordination between urban social-economic development and ecological environments in the Yangtze River Delta cities. Sustain. Cities Soc. 2024, 111, 105561. [Google Scholar] [CrossRef]
  39. He, L.; Xie, Z.; Wu, H.; Liu, Z.; Zheng, B.; Wan, W. Exploring the interrelations and driving factors among typical ecosystem services in the Yangtze river economic Belt, China. J. Environ. Manag. 2024, 351, 119794. [Google Scholar] [CrossRef]
  40. Yang, L.; Zhou, X.; Gu, X.; Liang, Y. Impact mechanism of ecosystem services on resident well-being under sustainable development goals: A case study of the Shanghai metropolitan area. Environ. Impact Asses. 2023, 103, 107262. [Google Scholar] [CrossRef]
  41. Jiang, W.; Guo, P.; Lin, Z.; Fu, Y.; Li, Y.; Kasperkiewicz, K.; Gaafar, A.Z. Factors influencing the spatiotemporal variation in the value of ecosystem services in Anxi county. Heliyon 2023, 9, e19182. [Google Scholar] [CrossRef]
  42. An, M.; Wu, Y.; Ouyang, Y.; Song, M.; Huang, J.; Dong, X.; Thomas Stephen, R. Spatial-Temporal evolvement and the contributing factors for the economic potential of ecosystem services in counties situated along a river. J. Nat. Conserv. 2023, 75, 126461. [Google Scholar] [CrossRef]
  43. Yang, J.; Huang, X. The 30 m annual land cover dataset and its dynamics in China from 1990 to 2019. Earth Syst. Sci. Data 2021, 13, 3907–3925. [Google Scholar] [CrossRef]
  44. Peng, S. 1-km monthly precipitation dataset for China (1901–2022). In National Tibetan Plateau Data Center; Institute of Tibetan Plateau Research, Chinese Academy of Sciences: Beijing, China, 2020. [Google Scholar]
  45. Peng, S. China’s 1km Monthly Potential Evapotranspiration Dataset (1901–2022). In National Qinghai Tibet Plateau Scientific Data Center; Institute of Soil and Water Conservation, Northwest A&F University: Yangling, China, 2022. [Google Scholar]
  46. Hengl, T.; Mendes De Jesus, J.; Heuvelink, G.B.M.; Ruiperez Gonzalez, M.; Kilibarda, M.; Blagoti, A.; Shangguan, W.; Wright, M.N.; Geng, X.; Bauer-Marschallinger, B.; et al. SoilGrids250m: Global gridded soil information based on machine learning. PLoS ONE 2017, 12, e0169748. [Google Scholar] [CrossRef] [PubMed]
  47. Yang, Z. Comparison and empirical analysis of the urban economic development level in the Yangtze River urban agglomeration based on an analogical ecosystem perspective. Ecol. Inform. 2021, 64, 101321. [Google Scholar] [CrossRef]
  48. Warsi, O.M.; Dykhuizen, D.E. Evolutionary implications of Liebig’s law of the minimum: Selection under low concentrations of two nonsubstitutable nutrients. Ecol. Evol. 2017, 7, 5296–5309. [Google Scholar] [CrossRef]
  49. Tsuyoshi, G.; Genki, Y. Debt issuance incentives and creative accounting: Evidence from municipal mergers in Japan. J. Jpn. Int. Econ. 2023, 68, 101259. [Google Scholar]
  50. Jansson, M.; Schneider, J. The Welfare Landscape and Densification—Residents’ Relations to Local Outdoor Environments Affected by Infill Development. Land 2023, 12, 2021. [Google Scholar] [CrossRef]
  51. Yang, X.; Xiong, C.; Han, W.; Yang, Y. Analysis of the impacts of carbon neutral policy portfolios on the economy, environment, and residents’ welfare based on computable general equilibrium models. J. Clean. Prod. 2024, 458, 142288. [Google Scholar] [CrossRef]
  52. Rui, D.; Yuqi, Z.; Siwei, S.; Du, L.; Jun, F.; Jian, Z.; Lina, P. Does Urban Shrinkage Inhibit Residents’ Welfare? From the Perspective of Urban–Rural Development in China. Soc. Indic. Res. 2024, 171, 847–876. [Google Scholar]
  53. Congxian, H.; Can, Z.; Huwei, W. Improving the consumer welfare of rural residents through public support policies: A study on old revolutionary areas in China. Socio-Econ. Plan Sci. 2024, 91, 101767. [Google Scholar]
  54. Yangyi, Z.; Yuanying, C.; Guozheng, L.; Xufeng, Z. The impact of carbon tax policy on residents’ welfare of China and its heterogeneity under the carbon neutrality goal: A CGE model-based analysis. J. Clean Prod. 2024, 434, 140442. [Google Scholar]
  55. Deng, H.; Hu, J. A comparative analysis of the coupling and coordination between the ecological civilization construction and tourism development in different types of resource-based cities. J. Nat. Conserv. 2024, 79, 126563. [Google Scholar] [CrossRef]
  56. Dong, Q.; Zhong, K.; Liao, Y.; Xiong, R.; Wang, F.; Pang, M. Coupling coordination degree of environment, energy, and economic growth in resource-based provinces of China. Resour. Policy 2023, 81, 103308. [Google Scholar] [CrossRef]
  57. Sun, J.; Zhai, N.; Mu, H.; Miao, J.; Li, W.; Li, M. Assessment of urban resilience and subsystem coupling coordination in the Beijing-Tianjin-Hebei urban agglomeration. Sustain. Cities Soc. 2024, 100, 105058. [Google Scholar] [CrossRef]
  58. Wang, H.; Xu, Y.; Li, C. Coupling coordination and spatio-temporal pattern evolution between ecological protection and high-quality development in the Yellow River Basin. Heliyon 2023, 9, e21089. [Google Scholar] [CrossRef] [PubMed]
  59. Wu, H.; Deng, H.; Gao, X. Corporate coupling coordination between ESG and financial performance: Evidence from China’s listed companies. Environ. Impact Asses. 2024, 107, 107546. [Google Scholar] [CrossRef]
  60. Zhong, Q.; Fu, H.; Yan, J.; Li, Z. How does energy utilization affect rural sustainability development in traditional villages? Re-examination from the coupling coordination degree of atmosphere-ecology-socioeconomics system. Build. Environ. 2024, 257, 111541. [Google Scholar] [CrossRef]
  61. Shi, J.; Li, S.; Liu, M.; Li, X.; Yan, H.; Dong, C. Ecological well-being and its equity in various economic contexts: Evidence from 130 cities in the yangtze river economic belt. Ecol. Indic. 2023, 156, 111093. [Google Scholar] [CrossRef]
  62. Fan, S.; Yan, M.; Yu, L.; Chen, B.; Zhang, L. Integrating ecosystem service supply–demand and ecological risk assessment for urban planning: A case study in Beijing, China. Ecol. Indic. 2024, 161, 111950. [Google Scholar] [CrossRef]
  63. Pan, Z.; He, J.; Liu, D.; Wang, J.; Guo, X. Ecosystem health assessment based on ecological integrity and ecosystem services demand in the Middle Reaches of the Yangtze River Economic Belt, China. Sci. Total Environ. 2021, 774, 144837. [Google Scholar] [CrossRef]
  64. Li, J.; Jiang, H.; Bai, Y.; Alatalo, J.M.; Li, X.; Jiang, H.; Liu, G.; Xu, J. Indicators for spatial–temporal comparisons of ecosystem service status between regions: A case study of the Taihu River Basin, China. Ecol. Indic. 2016, 60, 1008–1016. [Google Scholar] [CrossRef]
  65. Lee, S. Developing a bivariate spatial association measure: An integration of Pearson’s r and Moran’s I. J. Geogr. Syst. 2001, 3, 369–385. [Google Scholar] [CrossRef]
  66. Feng, Y.; Sun, M.; Pan, Y.; Zhang, C. Fostering inclusive green growth in China: Identifying the impact of the regional integration strategy of Yangtze River Economic Belt. J. Environ. Manag. 2024, 358, 120952. [Google Scholar] [CrossRef] [PubMed]
  67. She, Y.; Liu, Y.; Jiang, L.; Yuan, H. Is China’s River Chief Policy effective? Evidence from a quasi-natural experiment in the Yangtze River Economic Belt, China. J. Clean. Prod. 2019, 220, 919–930. [Google Scholar] [CrossRef]
  68. Ma, S.; Wen, Z. Optimization of land use structure to balance economic benefits and ecosystem services under uncertainties: A case study in Wuhan, China. J. Clean. Prod. 2021, 311, 127537. [Google Scholar] [CrossRef]
  69. Zhang, Z.; Fang, F.; Cheng, X.; Huang, C. Interactions of socioecological factors on the supply–demand balance of ecosystem services in the Yangtze River Economic Belt, China. Watershed Ecol. Environ. 2024, 6, 125–137. [Google Scholar] [CrossRef]
  70. Fang, L.; Wang, L.; Chen, W.; Sun, J.; Cao, Q.; Wang, S.; Wang, L. Identifying the impacts of natural and human factors on ecosystem service in the Yangtze and Yellow River Basins. J. Clean. Prod. 2021, 314, 127995. [Google Scholar] [CrossRef]
  71. Ji, R.; Wang, C.; Wang, P.; Wang, W.; Chen, N. Quantitative analysis of spatiotemporal disparity of urban water use efficiency and its driving factors in the Yangtze River Economic Belt, China. J. Hydrol. Reg. Stud. 2024, 51, 101647. [Google Scholar] [CrossRef]
  72. Li, B.; Wan, R.; Yang, G.; Yang, S.; Dong, L.; Cui, J.; Zhang, T. Centennial loss of lake wetlands in the Yangtze Plain, China: Impacts of land use changes accompanied by hydrological connectivity loss. Water Res. 2024, 256, 121578. [Google Scholar] [CrossRef]
  73. Peng, Y.; Welden, N.; Renaud, F.G. Incorporating ecosystem services into comparative vulnerability and risk assessments in the Pearl River and Yangtze River Deltas, China. Ocean Coast Manag. 2024, 249, 106980. [Google Scholar] [CrossRef]
  74. Wu, X.; Yue, Y.; Borthwick, A.G.L.; Slater, L.J.; Syvitski, J.; Bi, N.; Yang, Z.; Wang, H. Mega-reservoir regulation: A comparative study on downstream responses of the Yangtze and Yellow rivers. Earth-Sci. Rev. 2023, 245, 104567. [Google Scholar] [CrossRef]
  75. Dan, L.; Qianwen, G.; Wenjie, Y. The Evolution of Farmland Protection Policy and Optimization Path from 1978 to 2018. Chin. Rural Econ. 2018, 12, 37–51. [Google Scholar]
  76. Hu, H.; Yan, K.; Shi, Y.; Lv, T.; Zhang, X.; Wang, X. Decrypting resilience: The spatiotemporal evolution and driving factors of ecological resilience in the Yangtze River Delta Urban Agglomeration. Environ. Impact Asses. 2024, 106, 107540. [Google Scholar] [CrossRef]
  77. Tang, T.; Lin, X.; Lu, M. Analysis of the dynamic mechanism of trans-boundary pollution collaborative control in the Yangtze River Economic Belt. Environ. Res. 2024, 257, 119327. [Google Scholar] [CrossRef]
  78. Liu, T.; Song, Q.; Lu, J.; Qi, Y. An integrated approach to evaluating the coupling coordination degree between low-carbon development and air quality in Chinese cities. Adv. Clim. Chang. Res. 2021, 12, 710–722. [Google Scholar] [CrossRef]
  79. Wang, S.; Kong, W.; Ren, L.; Zhi, D.; Dai, B. Research on misuses and modification of coupling coordination degree model in China. J. Nat. Resour. 2021, 36, 793. [Google Scholar] [CrossRef]
Figure 1. Sketched map of the geographic location of the study area.
Sustainability 16 07487 g001
Figure 2. Research framework for ecosystem service supply and demand and human well-being in the YZRB.
Sustainability 16 07487 g002
Figure 3. Sanjay map of land use change from 2000 to 2020.
Sustainability 16 07487 g003
Figure 4. Spatial and temporal distributions of ecosystem service supplies from 2000 to 2020.
Sustainability 16 07487 g004
Figure 5. Spatial and temporal distributions of ecosystem service demands from 2000 to 2020.
Sustainability 16 07487 g005
Figure 6. Spatial and temporal distribution of ESCP from 2000 to 2020.
Sustainability 16 07487 g006
Figure 7. Spatial and temporal distribution of human well-being from 2000 to 2020.
Sustainability 16 07487 g007
Figure 8. Spatial and temporal distribution of ESCP and Com WB coupling coordination from 2000 to 2015.
Sustainability 16 07487 g008
Figure 9. Spatial distribution of ESCP and Com WB in 2020 based on LUCC.
Sustainability 16 07487 g009
Figure 10. Mean ESCP and Com WB coupling coordination, 2000–2020.
Sustainability 16 07487 g010
Figure 11. YERB Global Moran’s I and LISA Aggregation Plots of coupled coordination of ESCP and Com WB from 2000 to 2020.
Sustainability 16 07487 g011
Table 1. Data sources and precision.
TypeFormatsPrecisionData SourcesSource
Land use dataRaster30 mChina Land Cover Dataset [43]https://zenodo.org/record/8176941, accessed on 10 May 2024.
Annual precipitationRaster1 kmNational Tibetan Plateau Data Center [44,45]https://data.tpdc.ac.cn/, accessed on 16 December 2023.
Potential evapotranspiration dataRaster1 km
PM2.5Raster1 km
PM10Raster1 km
Plant root restricted layer dataRaster1 kmWorld Soil Information [46]https://www.isric.org/, accessed on 10 May 2024.
Plant available water content dataRaster1 km
Copernicus DEMRaster30 mEuropean Space Agencyhttps://panda.copernicus.eu/panda, accessed on 9 May 2024.
Soil conservation factor datasetRaster1 km and 300 mWorld Bank Open Datahttps://www.scidb.cn, accessed on 10 May 2024.
NPPRaster500 mMOD17A3HGF Version 6.0https://e4ftl01.cr.usgs.gov/, accessed on 8 June 2024.
NDVIRaster1 km
Population densityRaster1 kmWorld pophttps://hub.worldpop.org/, accessed on 16 December 2023.
Carbon emissions dataRaster11 kmEmissions Database for Global Atmospheric Researchhttps://edgar.jrc.ec.europa.eu/, accessed on 10 May 2024.
Administrative districtVector\National Geographical Information Resource Directory Service Systemhttps://www.webmap.cn/main.do?method=index, accessed on 9 May 2024.
Other socio-economic dataPanel data\Statistical yearbooks of corresponding provinces, cities, counties and districtsGovernment Gazette and Statistical Yearbook, accessed on 8 May 2024.
Table 2. Human well-being factors and weights.
GoalSub-Dimensional GoalsCodeLocalised IndicatorIndicator DirectionWeighting of Entropy Weights (Physics)Coefficient-of-Variation Weights (CoV)Combined Weights
Human well-beingMaterial well-being (MWB)u1grain production+0.3880.1710.280
u2oilseed production+0.1050.3850.245
u3meat production+0.3630.3740.368
u4NPP+0.1440.0700.107
Ecological well-being (EWB)u5Forest ecosystem area+0.5640.3160.440
u6Area of aquatic ecosystems+0.4360.6840.560
Healthy well-being (HWB)u7PM 2.50.1750.1290.152
u8PM 100.2040.1480.176
u9Number of beds in medical institutions+0.6210.7230.672
Society well-being (SWH)u10Public Finance Revenue+0.4080.4420.425
u11Public financial expenditures+0.2880.2980.293
u12GDP+0.3040.2600.282
Resident well-being (RWB)u13Average residential savings+0.2200.2440.232
u14Average GDP+0.0850.0680.077
u15Number of students enrolled in secondary schools+0.0570.0670.062
u16Number of primary school pupils in school+0.6380.6210.629
Disclaimer/Publisher’s Note: The statements, opinions and data contained in all publications are solely those of the individual author(s) and contributor(s) and not of MDPI and/or the editor(s). MDPI and/or the editor(s) disclaim responsibility for any injury to people or property resulting from any ideas, methods, instructions or products referred to in the content.

