Abstract
Floods, caused by intense rainfall or typhoons, overwhelming urban drainage systems, pose significant threats to urban areas, leading to substantial economic losses and endangering human lives. This study proposes a methodology for flood assessment in urban areas using a multiclass classification approach with a Deep Neural Network (DNN) optimized through hyperparameter tuning with genetic algorithms (GAs) leveraging remote sensing data of a flood dataset for the Ibadan metropolis, Nigeria and Metro Manila, Philippines. The results show that the optimized DNN model significantly improves flood risk assessment accuracy (Ibadan-0.98) compared to datasets containing only location and precipitation data (Manila-0.38). By incorporating soil data into the model, as well as reducing the number of classes, it is able to predict flood risks more accurately, providing insights for proactive flood mitigation strategies and urban planning.
1. Introduction
Urban areas worldwide face increasing challenges from floods [1,2], exacerbated by climate change and rapid urbanization. Pluvial floods, triggered by intense rainfall events that exceed the capacity of urban drainage systems, have emerged as a significant threat, causing substantial economic losses and endangering lives [2,3,4,5]. A fluvial flood occurs when rivers overflow their banks, typically due to excessive rainfall or runoff, inundating surrounding low-lying areas [6,7,8]. Typhoons can also trigger devastating floods due to their combination of heavy rainfall, storm surges, and intense winds [9,10,11]. Effective assessment and management of these floods are necessary for urban resilience and sustainable development.
Utilizing machine learning (ML) approaches in the realm of flood prediction is actively highlighted in the scientific literature. Lin et al. [12] examined the impact of urban land’s morphological spatial patterns on pluvial floods using ML techniques, employing Pearson’s correlation test and the random forest algorithm to explore associations between flood hotspot density and various influencing factors. Their study in a low-lying coastal city revealed that flood hotspot density was positively associated with certain urban land types and negatively with others, providing valuable guidance for urban planners and policymakers. Similarly, Ke et al. [13] used ML models to predict precipitation characteristics and classify flood versus non-flood events, specifically applied to Shenzhen, China. Their subspace discriminant analysis model improved classification accuracy significantly, demonstrating the broader applicability of these models in urban catchments.
Noymanee et al. [14] investigated the use of ML methods for forecasting pluvial floods in the Pattani River using open data, finding the Bayesian linear model to be the most effective. Zahura et al. [15] addressed the need for real-time, street-scale flood forecasting in coastal areas using the random forest (RF) algorithm. Their model, trained with environmental and topographic data, accurately predicted flood extent and depth, enhancing real-time flood prediction and decision-making in urban coastal regions.
In terms of deep learning (DL) applications, Lowe et al. [16] adapted the U-NET architecture to predict 2D maximum water depth maps during urban floods. Their model, U-FLOOD, achieved optimal performance and rapid predictions, signaling potential improvements with balanced training data and integration with sewer system models. Hofmann et al. [17] introduced floodGAN, a deep convolutional generative adversarial network, which predicted 2D inundation patterns conditioned on diverse rainfall distributions. This model demonstrated significant speed advantages over traditional hydrodynamic models, facilitating comprehensive early warning systems.
Katti et al. [18] focused on creating a comprehensive dataset to predict flood occurrences using various ML models, aiming to enhance flood detection capabilities and support proactive flood mitigation strategies. Chang et al. [19] presented an AI-based platform for real-time flood forecasting, integrating rainfall hyetographs with uncertainty analyses, and hydrological and hydraulic modeling. Their DL techniques detected and extracted feature parameters to predict rainfall events and inundation depths, promising timely predictions and effective flood hazard prevention in urban areas.
Liao et al. [20] explored the use of convolutional neural networks (CNNs) to predict urban floods induced by rainstorms, achieving high predictive accuracy and computational speed. Their model simulated inundation with high spatial and temporal resolutions, demonstrating a substantial speed increase over traditional models, thus validating CNNs as potent tools for rapid urban flood simulation.
Fidan et al. [21] highlighted the gap in flood modeling research, which had predominantly focused on urban areas, by developing an ML framework tailored for rural, agricultural landscapes. Their random forest model, applied to Hurricane Matthew, produced daily flood predictions with high accuracy, indicating significant impacts on crops. This model helped identify flood-susceptible agricultural areas and predict crop impacts.
Tehrany et al. [22] discussed the use of ensemble techniques, combining the weights-of-evidence (WoE) model with support vector machine (SVM) modeling, for flood susceptibility mapping in Terengganu, Malaysia. By integrating these models and considering various factors, including slope, stream power index, and rainfall, the study achieved a high success rate of 96.48% using the RBF kernel in SVM. This approach showed promise for assisting researchers and local governments in flood mitigation strategies.
Cities worldwide have evolved on diverse geological substrates, with human activities acting as geomorphic agents for millennia, creating various erosion landforms and anthropogenic deposits. As urban areas expand and disrupt natural systems, understanding the dynamics of urban environments becomes crucial. Pica et al. [23] explored eight case studies from Italy, Greece, and Brazil, focusing on geomorphological processes in urban environments. They supported geo-hazard assessments and urban sustainability while raising awareness of urban geoheritage. The study proposed an approach to urban geomorphological analysis to improve the understanding and planning of urban environments globally.
The analysis of these studies reveals a growing emphasis on utilizing ML and DL for more efficient and accurate flood prediction in urban areas. However, there are research gaps in the application of these models across diverse geographical regions and varying urban–rural landscapes. The significance of these studies lies in their potential to inform urban planning, enhance early warning systems, and support disaster mitigation efforts. Future research should focus on integrating these models with real-time data, expanding their applicability, and addressing the unique challenges of different environments to further improve flood prediction and management. Table 1 summarizes these studies.

Table 1.
Summary of studies on urban flood prediction using ML.
This study proposes an approach to flood risk assessment in urban areas, using the Ibadan metropolis and Metro Manila as case studies. By leveraging advanced Deep Neural Network (DNN) models optimized with genetic algorithms (GAs), this research aims to significantly enhance the accuracy and reliability of flood risk predictions. A key objective is to demonstrate how incorporating a diverse set of features—beyond basic variables such as precipitation, latitude, longitude, and elevation—can improve the model’s performance. This approach emphasizes the necessity of including a comprehensive range of relevant indicators, such as topographic features and drainage patterns, to achieve more precise flood risk categorization and inform better urban flood management strategies.
2. Materials and Methods
2.1. Ibadan Metropolis Flood Dataset
The flood dataset [24] was developed by integrating conditioning variables associated with floods [25,26,27,28], documentary sources from selected locations within the study’s scope, and the interpretation of Shuttle Radar Topography Mission (SRTM DEM) digital elevation model land imagery. To generate the dataset, the researcher underwent a month-long training program on the use of ArcGIS 10.8.1 [29] software, a geographic information system (GIS) tool for capturing, managing, analyzing, and displaying geographically referenced data, in collaboration with GIS Academy.
The dataset’s fieldwork was supported by the Ibadan Urban Flood Management Project and Risk Management Solutions Inc., India. Data collection involved gathering information from the United States Geological Survey (USGS) [30] and the Copernicus Climate Data Store [31], as well as attending all relevant meetings during the fieldwork period.
The study focused on the Ibadan metropolis, Nigeria. The resulting dataset after deleting skipped values consisted of 3005 records of flood-prone areas in the Ibadan metropolis.
The X and Y coordinates represent the longitude and latitude, respectively, of the flood location (Figure 1) of flood cases in Ibadan by month from 1 June 2020, to 31 December 2020. The slope and aspect columns describe the terrain’s steepness and compass direction, which are crucial in understanding the flow of water.
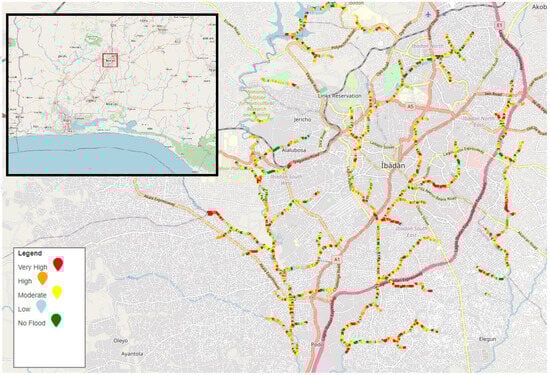
Figure 1.
Flood risks map in the Ibadan metropolis, Oyo State, Nigeria.
The elevation map [26], ranging from 59 to 395 m, was created using digital elevation models in ArcGIS software, ensuring flow continuity after sink filling and classification by natural breaks.
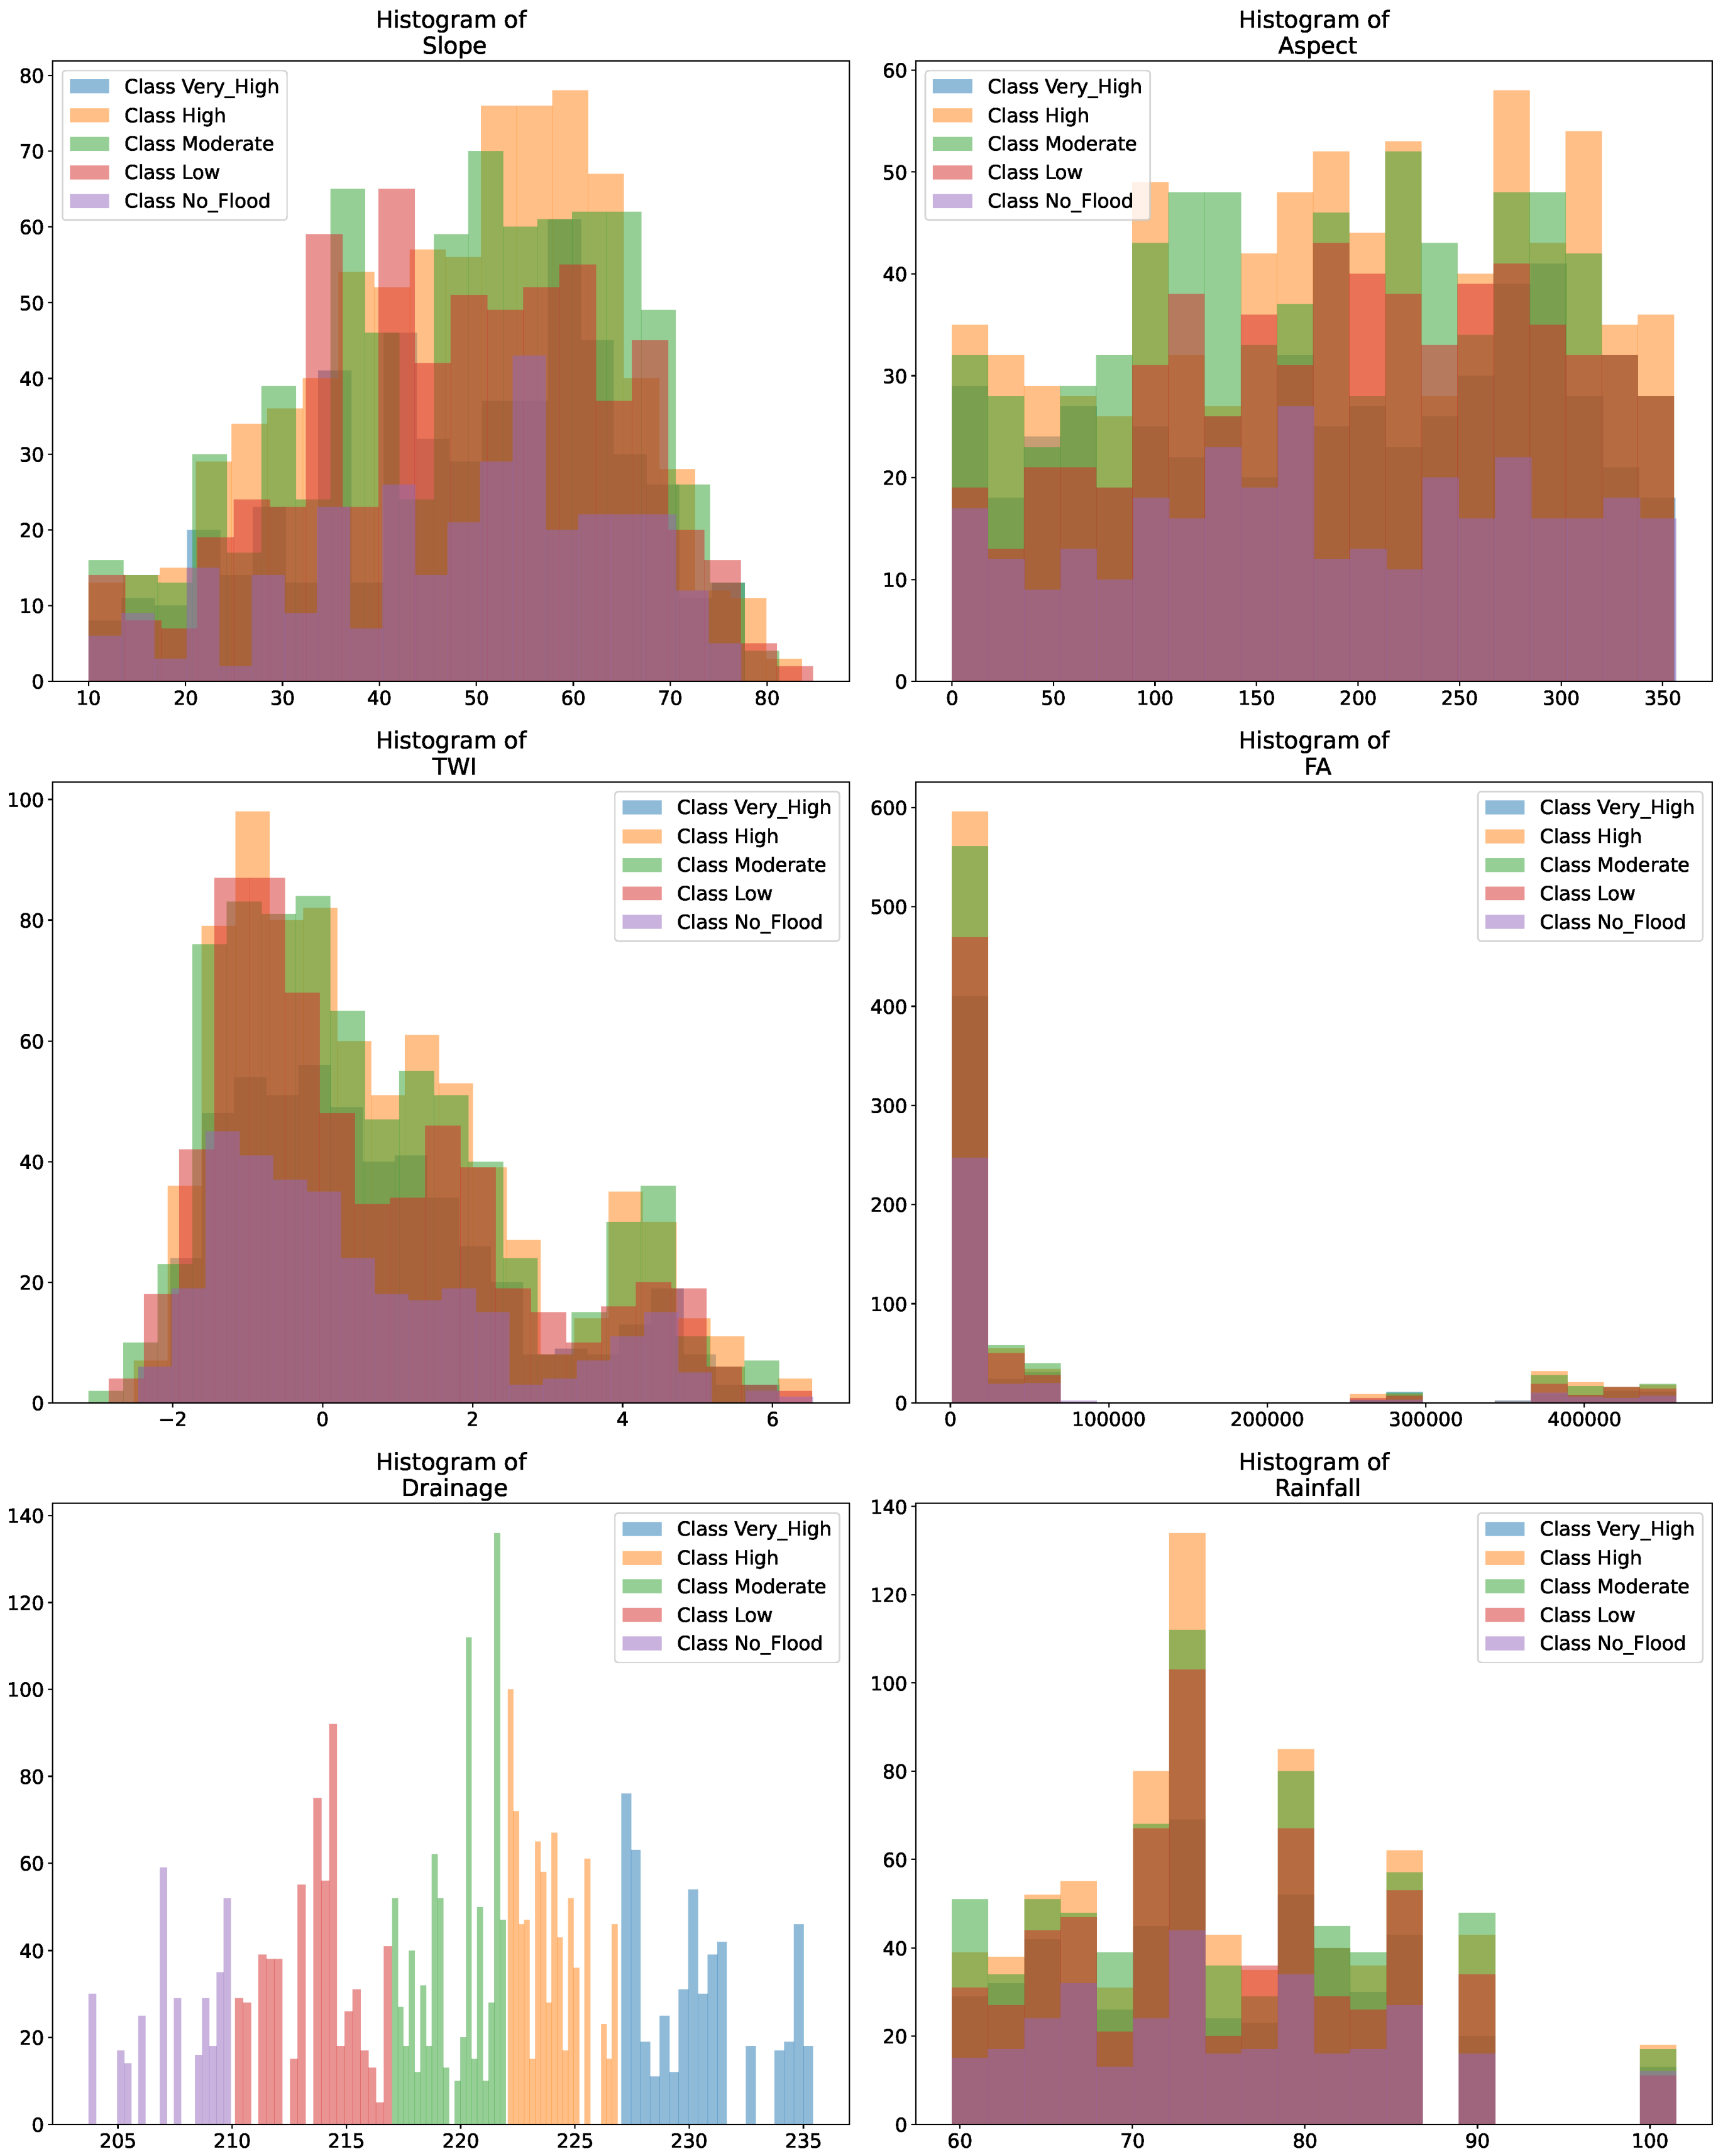
The Topographic Wetness Index (TWI) is a parameter that evaluates the likelihood of moisture presence in the soil and on the surface based on topographic data. This index helps identify potential areas where water may accumulate or drain, which is essential for flood risk assessment (Figure 2). The TWI combines upstream area and slope to quantify flood-prone areas. Higher TWI values are typically found in floodplain areas, indicating potential moisture accumulation or high drainage. The TWI’s impact on flood dynamics was quantitatively assessed by Hong et al. [32], highlighting its importance in flood susceptibility analysis.

Figure 2.
Histogram of feature distributions in the Ibadan floods dataset across the target variable, the susceptibility of flood, using data sourced from the United States Geological Survey (USGS) and the Copernicus Climate Data Store. The dataset includes comprehensive climate and topographic information relevant to the region’s flood risk assessment [24].
The Flow Accumulation (FA) [33] parameter indicates the amount of water that can accumulate in a specific area due to rainfall or snowmelt for north or mountain regions. This is vital for predicting the volume of water that may enter rivers and streams, affecting flood risk.
Drainage [34] characterizes the land’s ability to drain water, with lower values indicating better capacity to manage water and reduce flood risk. However, in some cases, drainage may be insufficient, especially during heavy rains or floods. Studies by Dinesh Kumar et al. [35] and Das [36] highlighted the impact of drainage density on flood occurrence. High drainage density areas are more prone to flooding due to their role in runoff generation. A drainage density map was created using ArcGIS software [26], categorizing values into five classes based on stream network data. The range of values within the study area indicates susceptibility levels to flooding based on drainage density.
Rainfall represents the amount of precipitation in the area, which is a direct factor in flood occurrence. By analyzing these columns together, the dataset provides a comprehensive understanding of the factors contributing to flood risk in the Ibadan metropolis. Rainfall intensity directly impacts flooding, with higher intensity and frequency increasing the risk of floods [37]. The rainfall map, based on 2018 and 2019 monthly mean data, was interpolated using ArcGIS’ spatial analyst inverse distance weight function [38,39]. Rainfall values were classified into five classes and ranked from lowest (77.7 mm) to highest (121.3 mm).
According to the established criteria [26], the flood susceptibility factors were further classified into five categories: very low susceptibility, low susceptibility, moderate susceptibility, high susceptibility, and very high susceptibility, based on the scale of importance of the criteria.
2.2. Metro Manila Flood Dataset
Metro Manila frequently experiences flooding [40,41,42] due to recurrent tropical storms. The goal of the dataset [43] is to identify areas most prone to flooding and potential locations for evacuation centers. It comprises detailed flood reports, including specific coordinates, average precipitation, land elevation, and reported flood height in Metro Manila, Philippines. The data were acquired by applying spatial kriging using ArcGIS 10.8.1 and Python 3.12 scripts on flood reports, elevation rasters, and average precipitation data sourced from public government data. The primary intention for this dataset was to create a heat map to identify correlations among the parameters.
The dataset includes the following features: latitude and longitude, which provide the exact coordinates of the flood locations (Figure 3).
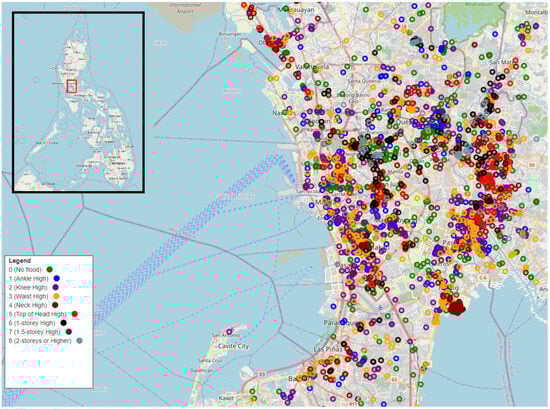
Figure 3.
Map of Manila floods.
Additionally, flood height, categorized into levels from 0 (no flood) to 8 (2 stories or higher); elevation, measured in meters; and precipitation, measured in millimeters per hour are also included (Figure 4). Flood height levels are detailed as follows: 0 indicates no flood, 1 represents ankle-high, 2 is knee-high, 3 is waist-high, 4 is neck-high, 5 is top-of-head-high, 6 is 1-story-high, 7 is 1.5-story-high water, and 8 is water 2 stories or higher.
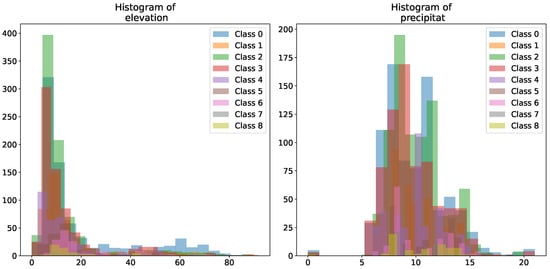
Figure 4.
Histogram of feature distributions in Manila flood dataset across the target variable, flood height.
Flood cases from Figure 3’s map are based on information provided by the National Operational Assessment of Hazards (NOAH) [44] and information from the National Mapping and Resource Information Authority (NAMRIA) [45]. Figure 5 illustrates the flood zones that were recorded over a five-year period from 2012 to 2017 in Manila which corresponds to these cases. Project NOAH [46] was launched in 2012 to enhance disaster prevention and mitigation [47], providing a 6-h lead-time [47] warning for floods and improving geo-hazard vulnerability maps. A Web-GIS tool was created to disseminate information to local government units, supporting their disaster preparedness efforts. This model can be replicated in other resource-limited countries to address natural hazards effectively.
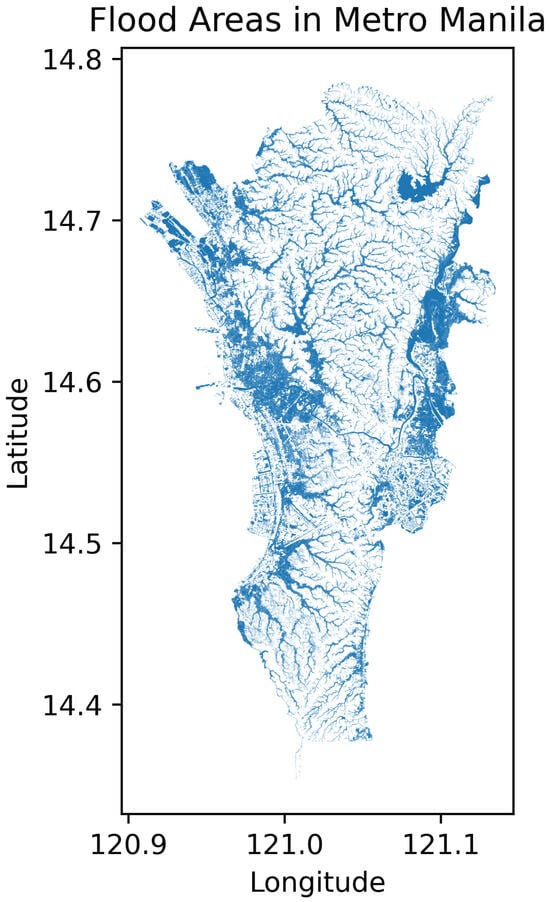
Figure 5.
Flood areas in Metro Manila.
Urban flooding from intense thunderstorms is a growing issue in Metro Manila. An analysis [48] using LiDAR-derived topography and data from the Metro Manila Development Authority (MMDA) shows that most flood-prone areas are at creek–street intersections in low-lying regions, leading to inundation when creeks overflow. Proposed solutions [48] include elevating flood-prone roads above creek floodplains or creating retention basins for excess water.
Analyzing these flood zones enables a better understanding of the dynamics of flooding in the region, including its coverage and scale. During this period, various cataclysms in Philippines occurred. For instance, on 8 November 2013, Typhoon Haiyan, known locally as Yolanda, struck the central Philippines, becoming one of the most powerful typhoons in recorded history [49]. Haiyan’s impact underscored the need for improved disaster preparedness and response strategies [50,51]. The lessons learned from this tragedy can serve as a crucial reference for mitigating the effects of future storm surge events in the Philippines and elsewhere. NOAH simulated historical tropical cyclones and used the Japan Meteorological Agency’s model to estimate surge heights [52]. They combined these with astronomical tide data to create inundation maps for specific public storm warning signals (PSWS). Lapidez et al. [53] simulated Haiyan type conditions using tropical cyclone tracks from 1948 to 2013 to calculate the maximum probable storm surge heights for each coastal locality. Key outcomes included a list of the 30 most vulnerable coastal areas for prioritizing flood risk management [54] and storm tide inundation maps for local governments. These maps aided in developing risk-sensitive land use plans, identifying safe areas for buildings and critical facilities, and creating disaster response and evacuation plans. Moreover, May et al. [55] indicated that tropical cyclones could shift large boulders, highlighting the need to reevaluate storm-related transport previously attributed only to tsunamis. These results suggested that infragravity waves from the typhoon caused unusual flooding patterns, which were not captured in phase-averaged storm surge models.
With increasing population and infrastructure, mapping flood potential [56] is essential for public safety and land development. To create rainfall-induced shallow flood hazard maps, Stability Index Mapping (SINMAP) [57] was applied by Alejandrino et al. [58] using a 5 m interferometric synthetic aperture radar (IFSAR)-derived digital terrain model (DTM). This method assigned topographic, soil, and hydrologic parameters to compute the factor of safety across the studied area. The resulting hazard maps, validated against a flood inventory, classified areas into safe zones [59,60], those needing slope intervention, and no-build zones, supporting effective zoning for residential and infrastructure development.
Many volcanoes near populated cities experience annual monsoon seasons, prompting the need for flood hazard mitigation in the Philippines. The southwest monsoon rains [61] from 18 to 21 August 2013, severely flooded Metro Manila, paralyzing the capital for a week. This event, known as the 2013 Habagat, followed a similar incident in 2012, with cyclones enhancing the monsoon. Analysis [62] shows that the stratovolcanoes Natib and Mariveles, located west of Metro Manila, significantly contributed to the extreme rainfall and flooding through an orographic effect that disperses rain clouds, posing a major flood risk to the area.
2.3. Flood Classification Methodology
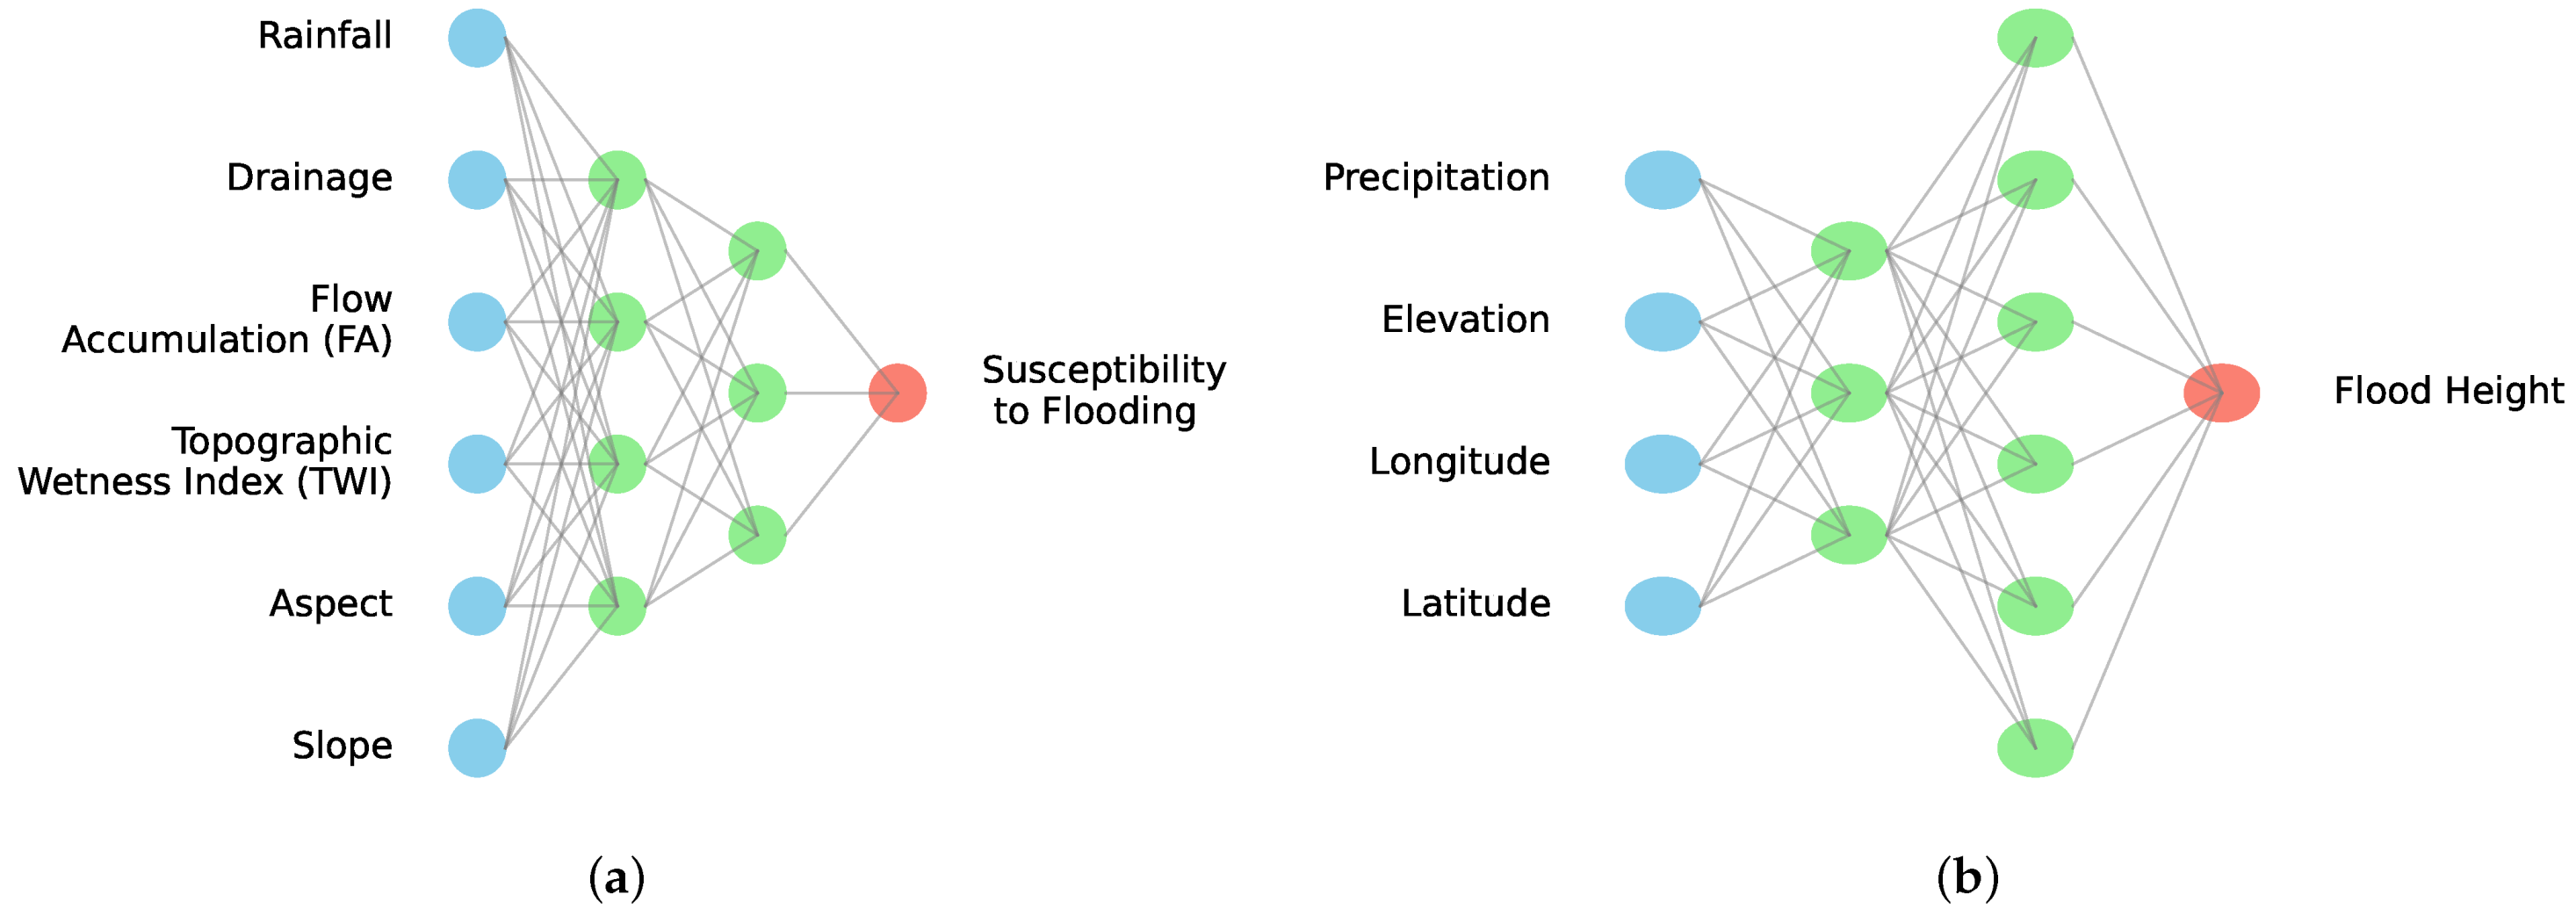
The research involved the development of a predictive model for susceptibility to flooding using a neural network trained on a dataset of Ibadan and Manila floods. The selection of this approach can be justified for several reasons. Flood prediction involves numerous complex and non-linear interactions between various environmental and geographical parameters. DNNs are well suited for capturing these patterns due to their multi-layered architecture, which allows them to learn high-level features from raw data. DNNs can automatically learn and extract relevant features from the input data, reducing the need for manual feature engineering. This is particularly beneficial in flood prediction, where the relationships between features (such as rainfall, land elevation, and drainage capacity) can be highly non-linear and difficult to model explicitly. Genetic algorithms (GAs) were used to optimize the hyperparameters of the DNN. The performance of a DNN is highly dependent on its hyperparameters (e.g., learning rate, number of layers, number of neurons per layer). GAs are particularly effective in exploring the hyperparameter space and finding optimal or near-optimal configurations, as they can avoid local minima better than traditional gradient-based optimization methods. GAs perform a global search in the hyperparameter space by simulating the process of natural selection. This parallel search approach can evaluate multiple solutions simultaneously, leading to a more robust and potentially better-performing model compared to other optimization techniques that might get stuck in local optima. The combination of DNNs and GAs can result in a robust model that is adaptable to different datasets and conditions. Possible architectures for optimizing DNN are shown on Figure 6. In both cases, the datasets were initially split into features and target variables, with the features comprising various environmental and geographical parameters. The target variables, indicating susceptibility to flooding (Ibadan dataset) and flood height (Manila dataset), were encoded into a categorical format using label encoding and one-hot encoding techniques.
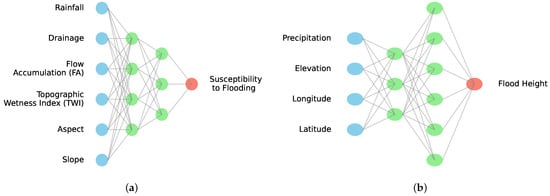
Figure 6.
Possible DNN architectures for classifying (a) susceptibility to flooding in Ibadan metropolis, (b) flood height in Metro Manila.
The dataset was then partitioned into training and testing sets in a ratio of 80% and 20%, respectively, ensuring a balanced distribution of samples. Prior to partitioning, any missing values were addressed by applying appropriate imputation techniques to maintain data integrity. Additionally, feature scaling was implemented to standardize the input data, which improved the performance and convergence speed of the neural network model. This normalization step ensured that all features contributed equally to the model’s learning process, preventing any single feature from disproportionately influencing the results.
The search space included parameters such as the number of layers (from 1 to 20), the number of neurons per layer (from 1 to 128), activation functions, optimizers, learning rates, and loss functions. Various optimizers, including Adam, SGD, RMSprop, Adagrad, Adadelta, Adamax, and Nadam, were considered.
The space of possible values for the number of layers () was defined as:
The space of possible values for the number of neurons in each layer () was defined as:
The space of possible activation functions () was defined as a set of common activation functions:
The space of possible optimization algorithms () was defined as a set of commonly used optimizers:
The space of possible learning rates () was defined as:
The space of possible loss functions () was defined as:
The overall hyperparameter search space () was the Cartesian product of these individual spaces:
Each element of is a tuple , where l is the number of layers chosen from , n is the number of neurons per layer chosen from , a is the activation function chosen from , o is the optimizer chosen from , r is the learning rate chosen from , and f is the loss function chosen from .
This conceptual framework allows for a structured approach to hyperparameter optimization, facilitating the search for the optimal set of hyperparameters that yields the best model performance. To evaluate each configuration, a neural network model was constructed using the Sequential API from TensorFlow Keras. The model architecture was defined based on the selected hyperparameters, and the network was trained on the training dataset. The optimizer was dynamically chosen according to the current hyperparameters, and the model was compiled with the appropriate loss function.
The fitness of each model was assessed using accuracy on the testing set. The genetic algorithm initialized a population of potential solutions, with each individual representing a unique set of hyperparameters. Through iterations, the population evolved by selecting the best-performing individuals as parents and generating offspring through crossover and mutation operations.
Each generation of the genetic algorithm involved evaluating the fitness of individuals, selecting the top-performing candidates, and generating a new population. This iterative process aimed to find the optimal combination of hyperparameters that yielded the highest accuracy. The overall process of a GA could be itemized as the following steps:
- Defining the DNN model:where are the layers of the model defined by the selected hyperparameters.
- Evaluating model fitness function:or:where is the predicted value, is the true value, N is the number of test samples, and is the indicator function.
- Population initialization:where M is the population size, and is a set of hyperparameters.
- Parent selection:where is the current population, and f is the fitness function (accuracy).
- Crossover operation:where and are the hyperparameters of the parents.
- Mutation operation:where is the set of hyperparameters before mutation.
- Creating a new population:
- Fitness evaluation:where represents the model’s hyperparameters.
- Iterate this process:
The results of each iteration, including the hyperparameters and corresponding accuracies, were documented. This approach facilitated the identification of the most effective neural network configuration for predicting flood susceptibility/height. The final outcomes were stored in a CSV file for further analysis and interpretation.
3. Results
3.1. DNN Results
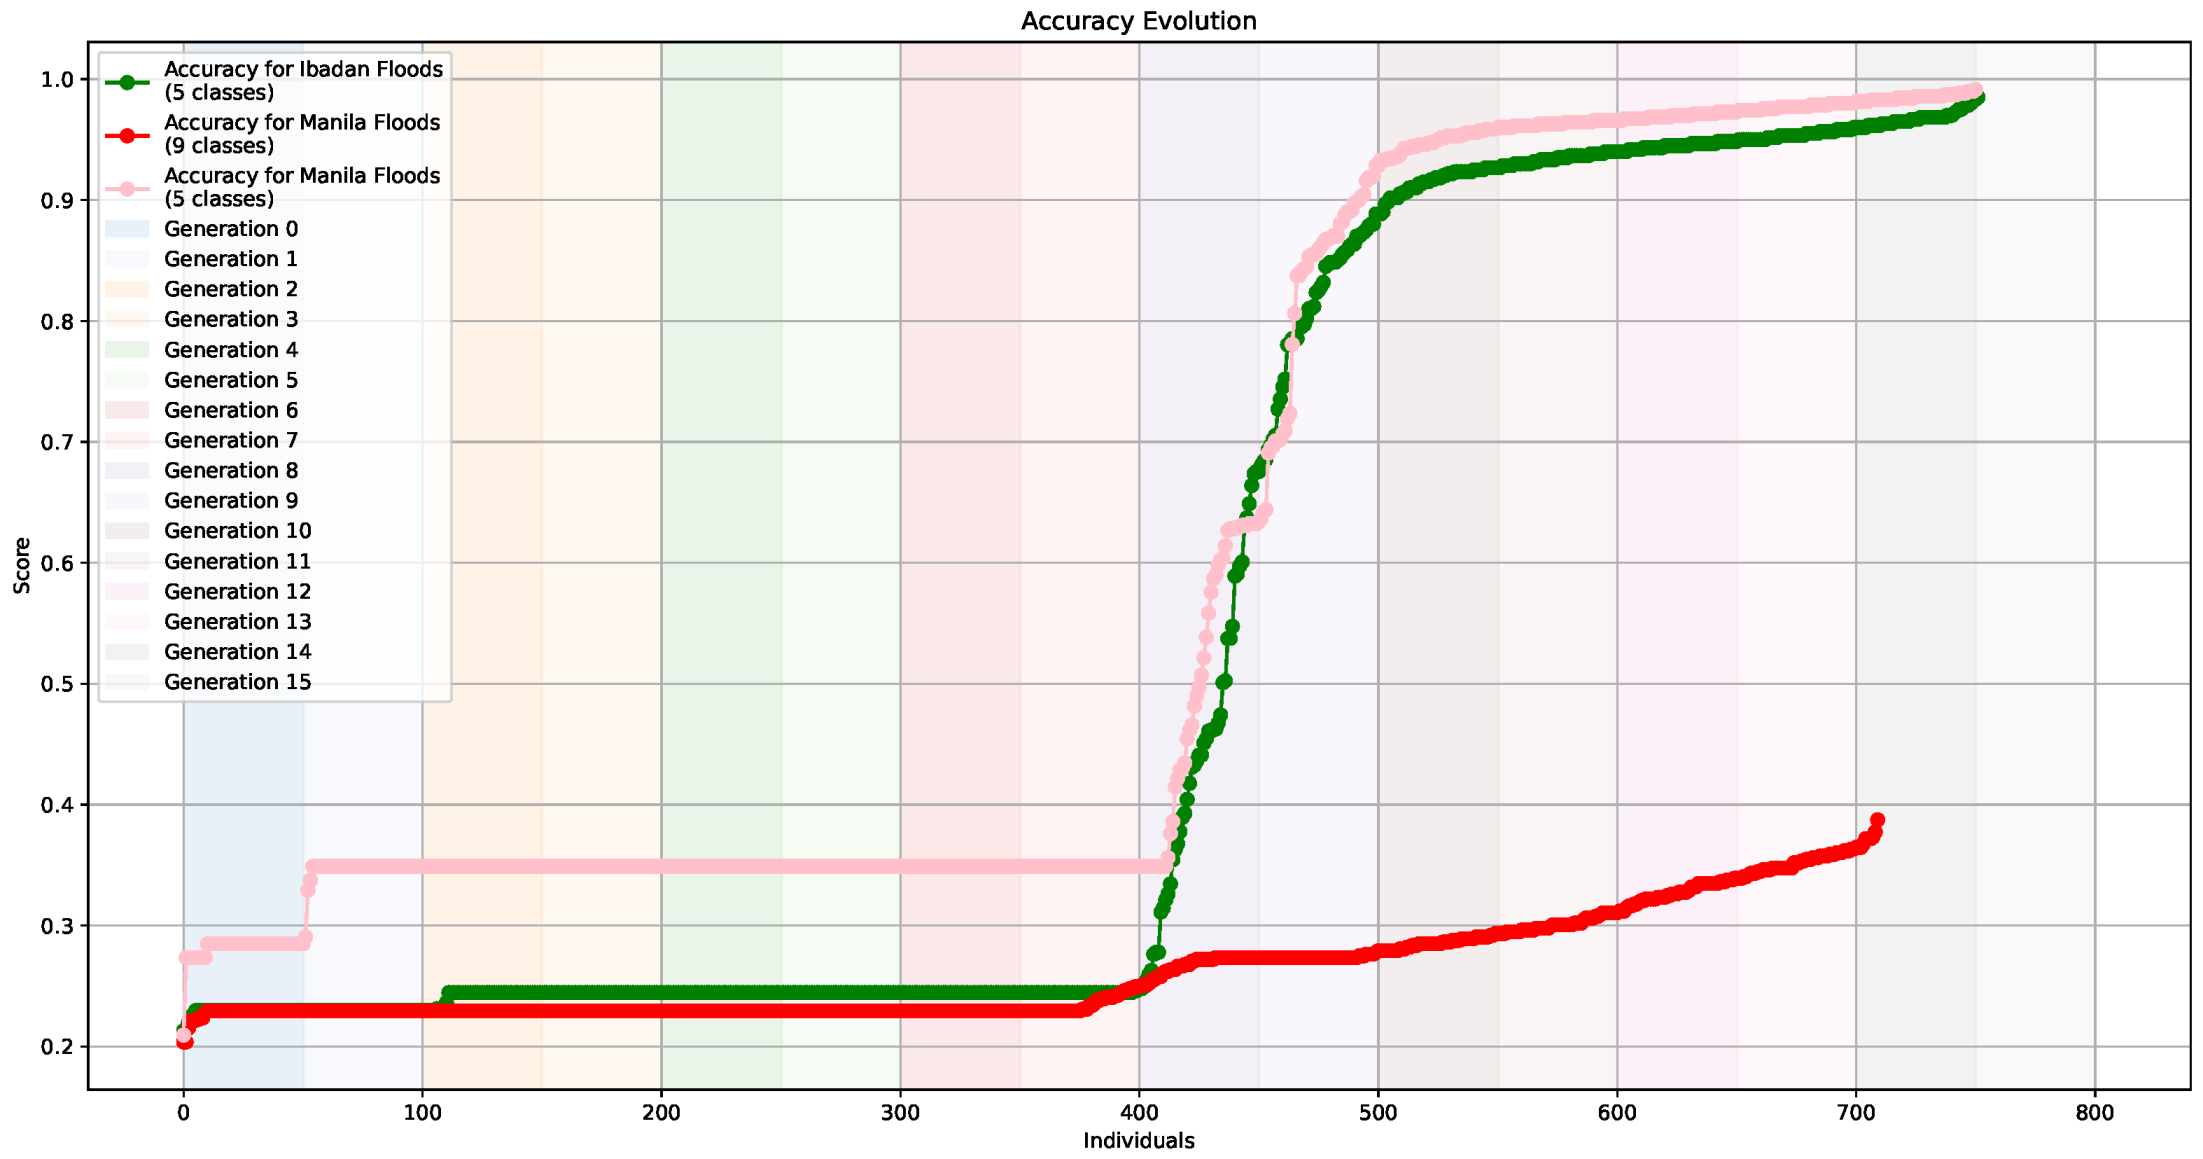
Figure 7 shows the evolution of accuracy curves sorted by GA-optimized DNN models in ascending order. For the Ibadan dataset, the computation time for evaluating each individual model took approximately 30 s. In contrast, the computation time for the Manila dataset was significantly shorter, averaging around 18 s per individual model. The shorter processing time can be attributed to the reduced number of features in the dataset. Both datasets were processed on a machine equipped with an Intel® Core™ i5-6600K CPU @ 3.50 GHz and 8.00 GB of RAM. This hardware configuration provided sufficient computational power to handle the training and evaluation of the DNN models within reasonable timeframes, although more powerful hardware could potentially reduce computation times further.
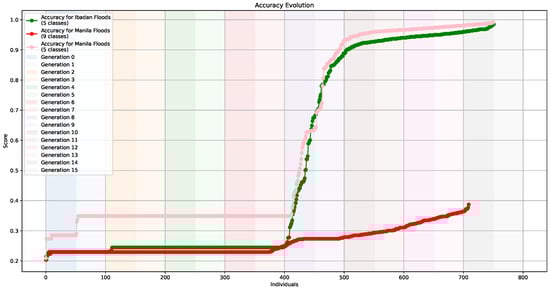
Figure 7.
Accuracy evolution of optimized DNN architectures for Ibadan (green) and Manila (red) flood datasets.
It is evident that for the Ibadan dataset, which includes features such as X, Y coordinates, slope, aspect, Topographic Wetness Index (TWI), Flow Accumulation (FA), drainage, and rainfall, along with the target variable SUSCEP with five categories, the accuracy reached 0.98. In contrast, for the Manila dataset, which includes only latitude (lat), longitude (lon), elevation, precipitation, and flood height with nine categories, the accuracy did not exceed 0.4.
The high accuracy for the Ibadan flood dataset (0.98) indicated that the inclusion of more detailed and diverse features, such as topographic and hydrological parameters, significantly improved the model’s performance in predicting flood risk categories. The low accuracy for the Manila flood dataset (less than 0.4) suggested that the features used were insufficient for accurate prediction. This implied that additional parameters, similar to those used for Ibadan, needed to be included to improve accuracy. These results highlight the importance of selecting relevant and diverse features to build effective machine learning models for flood risk categorization tasks. The best architectures and corresponding confusion matrices for Ibadan flood dataset are shown in Table 2 and Figure 8, respectively.
Table 2.
Neural network parameters and performance for the Ibadan flood dataset.
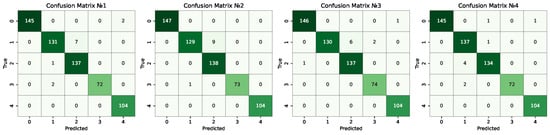
Figure 8.
Confusion matrices for best DNN models of the Ibadan flood dataset.
To assess the generalization performance of the GA-optimized DNN models and to ensure they are not overfitting to the training data, cross-validation was employed. Specifically, the dataset was divided into five subsets or folds. The model was trained five times, with each iteration using four folds for training and the remaining fold for validation. This process was repeated such that each fold served as the validation set once.
The performance metrics obtained from these five iterations were averaged, and the standard deviation was recorded in the Table 2 and Table 3, represented with a ± symbol. This cross-validation approach helped to mitigate the variance associated with a single train–test split, providing a more reliable estimate of the model’s performance on unseen data.
Table 3.
Deep Neural Network model parameters and performance.
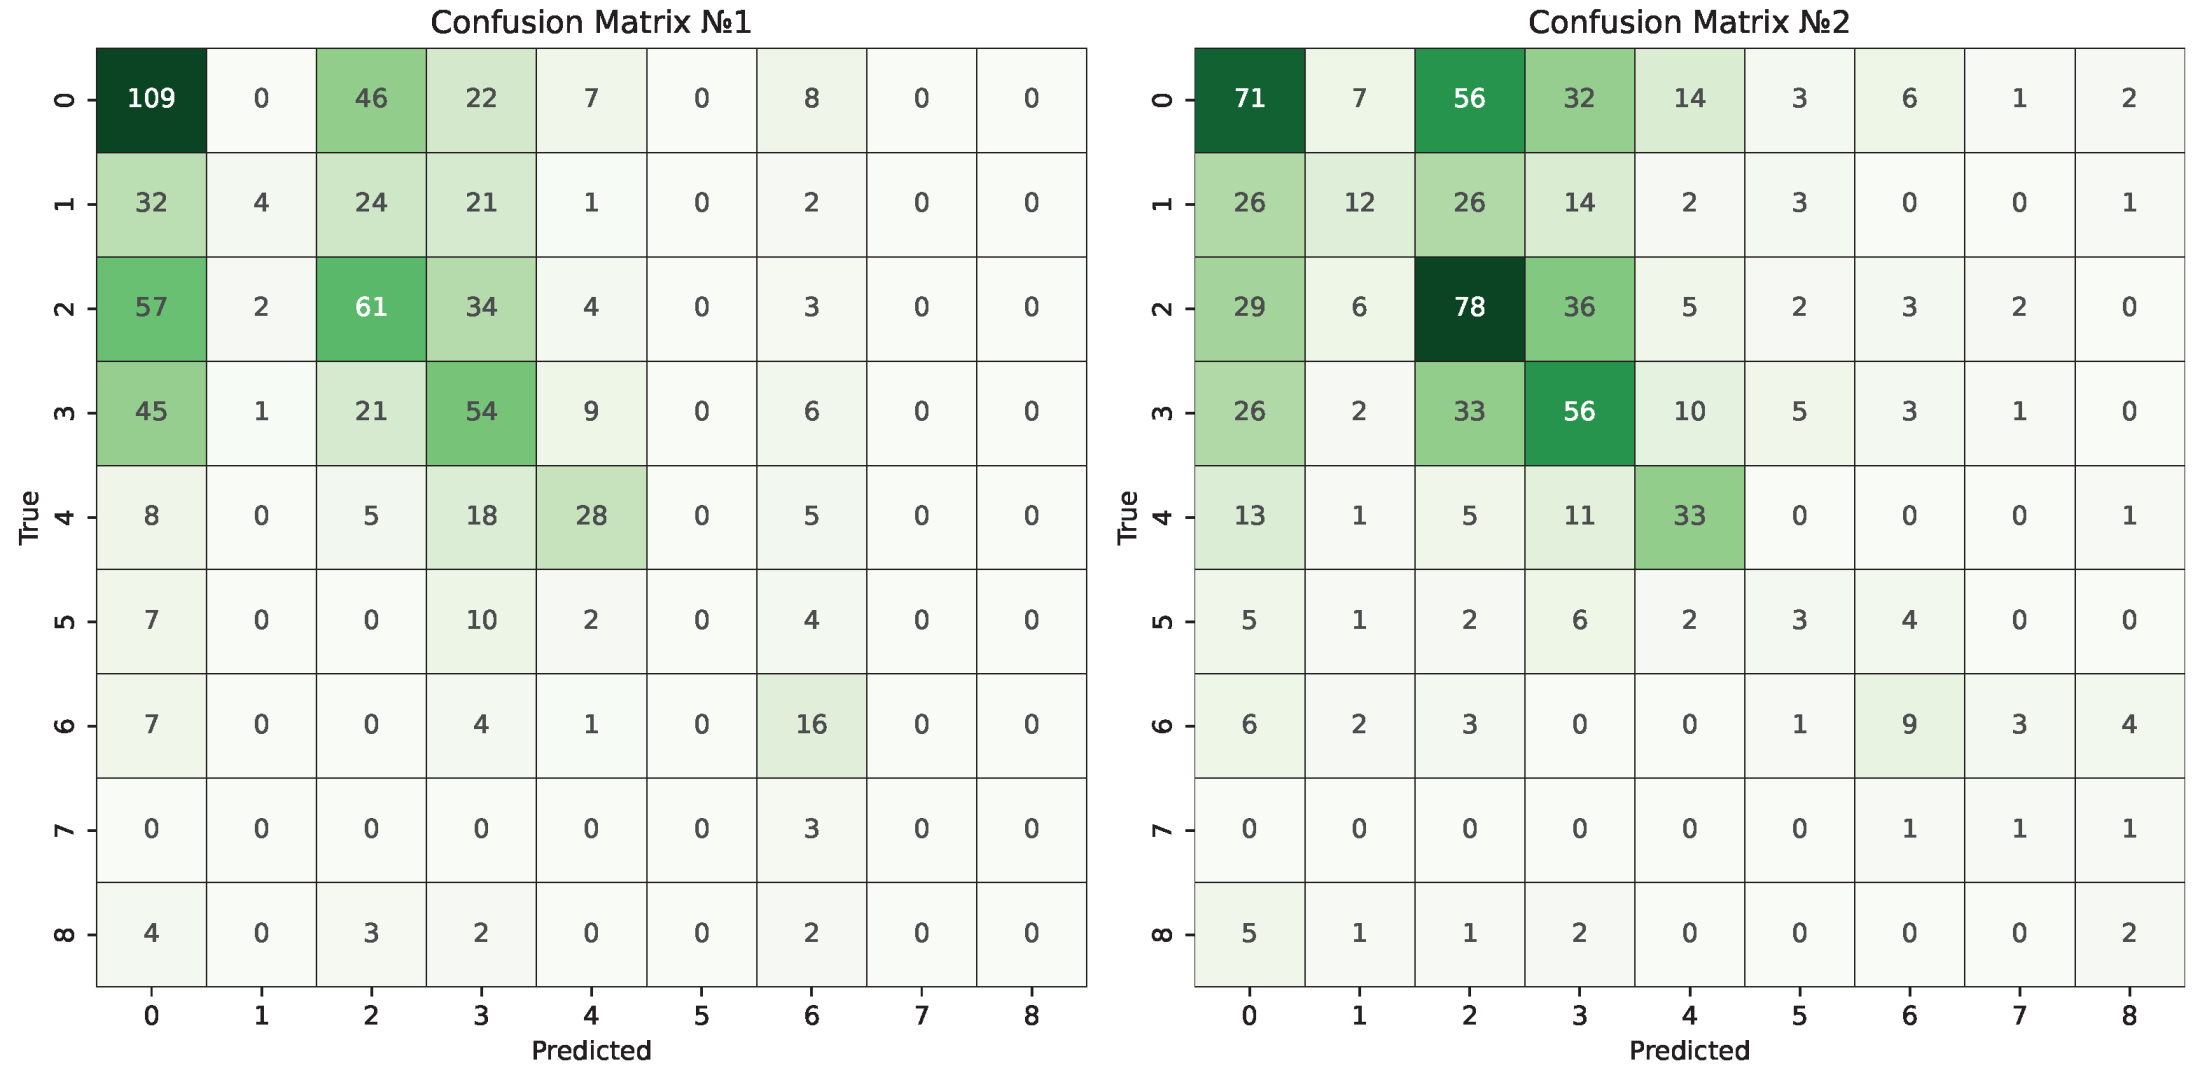
Despite thorough optimization and tuning of the DNN model using a GA for the Manila flood dataset, the results were suboptimal. Best architectures’ performance values are shown in Table 3.
The accuracy of the model in distinguishing between the flood height categories did not exceed 40%. A detailed analysis of the classification results revealed overlap among the categories. Specifically, the model struggled to accurately differentiate between instances of no flood, ankle-level floods, and knee-level floods (Figure 9).
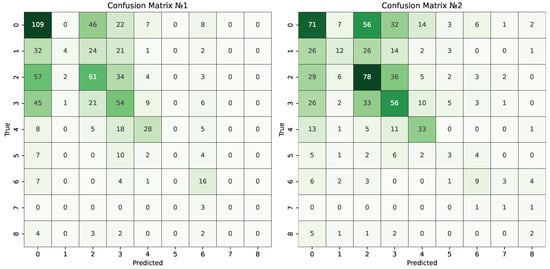
Figure 9.
Confusion matrices for best DNN models of the Manila flood dataset.
There are several potential reasons for this poor performance, one of them lies in insufficient features. Hourly precipitation, location, and elevation may not capture the full complexity of flood dynamics. Flood height is influenced by various factors such as soil saturation, drainage capacity, land use, and infrastructure, which were not included in our feature set. Additionally, the dataset had imbalanced classes, with fewer instances of certain flood heights compared to others. This imbalance can lead to the model being biased towards the more frequent classes, thus reducing its ability to correctly classify less common flood heights. Also, the inherent variability in environmental conditions can cause significant differences in flooding outcomes even with similar precipitation levels. Factors such as vegetation cover, urbanization, and climate conditions can lead to different flooding responses that are not accounted for by the simple feature set used.
3.2. Reduction in Number of Classes
In flood risk assessment, the number of classes in the target variable significantly impacts model performance. This effect is evident when comparing flood risk models in different regions, such as Ibadan and Manila.
In the case of Ibadan, the target variable was classified into five risk categories: very high, high, moderate, low, and no flood. This classification scheme, which is relatively straightforward, provides a clear and actionable framework for assessing flood risk. The model, utilizing this classification, demonstrated high performance and accuracy, largely due to the clear distinctions between risk levels and the relevance of the chosen features such as rainfall, topography, and drainage characteristics.
In contrast, the flood risk classification for Manila involved a more granular approach with nine categories: no flood, ankle high, knee high, waist high, neck high, top of head high, 1-story high, 1.5-story high, and 2-stories or higher. This detailed classification aimed to capture a wider range of potential flood depths and their impact on urban infrastructure. However, this increased number of classes, coupled with fewer features, often complicates the model’s ability to accurately predict flood risks. The finer resolution in classification may lead to challenges in distinguishing between closely related risk levels, potentially impacting model performance.
The comparison between these two classification schemes underscores the importance of feature selection and classification granularity in flood risk assessment. While a more detailed classification scheme can provide a nuanced understanding of flood risks, it also requires a more sophisticated model and comprehensive feature set to achieve high accuracy. Therefore, increasing the number of features and adopting standardized classification approaches can significantly enhance model performance. A well-chosen classification scheme, aligned with a sufficient number of relevant features, can improve the accuracy and reliability of flood risk predictions.
To address the issue of dataset standardization and to improve the analysis and evaluation of different scenarios, we reduced the number of classes for the Manila dataset from nine to five to align with the classification scheme used for the Ibadan dataset, which originally had five classes (Table 4). The classification rule used for this standardization was as follows: classes 7 and 8 were mapped to ‘Very High’, classes 5 and 6 to ‘High’, classes 3 and 4 to ‘Moderate’, classes 1 and 2 to ‘Low’, and class 0 to ‘No Flood’. This standardization ensured that both datasets were comparable and could be analyzed using the same model. After reclassifying the Manila dataset, we performed a new classification again using GA combined with DNN HPO. This process involved optimizing the DNN’s hyperparameters to improve the model’s performance on the standardized datasets. The results, illustrated by the pink curve in Figure 7, demonstrate that the accuracy achieved near-perfect results, with values around 0.99.
Table 4.
DNN hyperparameter optimization results for Metro Manila flood dataset categorized into 5 classes.
4. Discussion
4.1. Effectiveness of GA-Optimized DNN Techniques
This study demonstrated the effectiveness of GA-optimized DNN techniques for assessing floods in urban areas with a sufficient dataset of records about floods. Based on the results from applying the GA+DNN model to flood risk classification using different datasets, such as those from Ibadan and Manila, several suggestions and policy implications for urban flood prevention and control can be made. The GA+DNN model achieved high accuracy of nearly 0.98 with datasets including rainfall, slope, aspect, Topographic Wetness Index (TWI), Flow Accumulation (FA), and drainage. In contrast, using only precipitation, latitude, longitude, and elevation resulted in a lower accuracy of 0.38, if classifying with more classes.
These results highlight the necessity of incorporating a broader set of influencing factors into flood risk models. Urban flood prevention and control strategies should integrate detailed datasets that cover various environmental and topographic features to enhance prediction accuracy. Policies should focus on using comprehensive flood risk models that include a wide range of relevant indicators [63,64]. This approach will improve the identification of directions for future research, infrastructure design, and emergency response strategies. Enhanced models with diverse data inputs can better inform decision-making and contribute to more resilient urban flood management systems.
DNNs are powerful but sensitive to hyperparameters [65] like layer count and neuron configurations, which greatly impact their accuracy. Nikbakht [66] utilized a genetic algorithm to optimize these parameters within the deep energy method for structural analysis. By applying this approach to scenarios like Timoshenko beams and plates with holes, the study enhanced predictions of stress distribution. This highlights how precise hyperparameter optimization can substantially improve DNN performance in structural analysis and beyond. By the way, DNNs excel in prediction but rely on optimal hyperparameters. Peng et al. [67] proposed an enhanced Gene Expression Programming-based method to automatically optimize DNN hyperparameters for precipitation modeling. Experiments with real datasets showed our method outperformed multiple linear regression, back-propagation, support vector machine, random forest, and conventional DNNs. It also surpassed state-of-the-art hyperparameter optimization methods like genetic algorithm, Bayes search, grid search, randomized search, and quasi-random search.
4.2. Comparison with Hydraulic Modeling
The significance of DNN-based flood assessment compared to traditional physics-based hydraulic modeling [68] lies in several key advantages, including speed, efficiency, scalability, and the ability to leverage large datasets. Physics-based hydraulic models, such as those used in hydrodynamic simulations [69], rely on solving complex differential equations [70] to simulate water flow and flood extents. While these models are highly accurate and detailed, they are computationally intensive and time-consuming, often requiring significant processing time and resources to produce results. In contrast, DNNs can significantly reduce computation time, providing near real-time predictions. For instance, Hofmann et al. introduced floodGAN, a DNN model that predicted 2D inundation patterns up to 106 times faster than traditional hydrodynamic models. This speed is crucial for emergency response and real-time decision-making during flood events, allowing for timely warnings and actions.
Traditional hydraulic models require extensive data inputs, such as detailed topographic maps [71], hydrological data [72], and precise rainfall measurements [73]. The calibration and validation processes are also labor-intensive, often requiring specialized knowledge and significant computational power. DNNs streamline the process by learning from large datasets, reducing the need for extensive manual input and calibration. Once trained, these models can quickly adapt to new data, making them more efficient in terms of both time and resource allocation. This efficiency is particularly beneficial for urban planners and emergency management teams who need to frequently update flood risk assessments.
Scaling physics-based models to larger or more complex areas can be challenging due to the increased computational demands and the need for high-resolution data across extensive regions [70,74]. DNNs are inherently scalable. They can be trained on diverse datasets from various geographical regions and can generalize well to new, unseen scenarios. For example, Lowe et al.’s U-FLOOD model [16] adapts the U-NET architecture to predict flood depths with high accuracy across different urban settings. This scalability makes DNNs versatile tools for stakeholders managing flood risks across large or varied landscapes.
While accurate, traditional hydraulic models are static once set up and require significant re-calibration with new data inputs or changing conditions, such as urban development or climate change [75]. DNNs continuously improve as more data become available. They can integrate various data sources, including satellite imagery, sensor networks, and crowdsourced information, enhancing their predictive power over time. Zahura et al.’s [76] use of the random forest algorithm to incorporate real-time environmental data exemplifies how DNNs can dynamically adjust to changing conditions, providing more accurate and current flood assessments.
Traditional hydraulic models are highly detailed and scientifically rigorous, making them ideal for in-depth studies and understanding the fundamental mechanics of flood events [77]. However, their complexity can be a barrier for non-experts, limiting their practical application in fast-paced decision-making environments. DNNs offer user-friendly and interpretable outputs, such as real-time flood maps and predictive analytics, which are easily understood by stakeholders without specialized technical backgrounds [78]. This accessibility is crucial for local authorities, urban planners, and emergency responders who need actionable insights to mitigate flood impacts effectively.
That is why stakeholders should consider a DNN-based assessment to enhance real-time flood prediction, optimize resource use, and improve decision-making processes. As these models continue to evolve and integrate more diverse data sources, their reliability and accuracy will further solidify their role as essential tools in flood risk management and mitigation.
4.3. Challenges and Solutions for Interpreting DNN Models
Although DL models demonstrate high accuracy, the challenge of explaining their inner workings [79] can significantly impact the interpretation and application of their results, particularly in the context of flood risk assessment. The complex nature of these models, often regarded as ‘black boxes’ [80,81], makes it difficult to understand how specific inputs are transformed into predictions of flood risk. This lack of transparency can undermine confidence in the model’s outputs, which is crucial in flood risk management where decision-makers rely on these predictions to mitigate potential disasters.
In flood risk assessment, understanding how a model arrives at its conclusions is essential for ensuring that its predictions are reliable and actionable [82]. The inability to interpret the model’s decision-making process can obscure the reasons behind specific risk assessments, complicating efforts to validate the model’s performance and address any biases or errors that might arise. This can hinder the development of effective strategies for flood prevention and response, as stakeholders may struggle to trust or act upon recommendations from models that lack clear explanatory power.
Furthermore, regulatory requirements and public expectations often demand a clear rationale for automated risk predictions [83]. The inability to explain how a model generates its flood risk estimates can limit its applicability. For effective public communication and acceptance, it is important that the methods used to predict flood risks are understandable and defensible. If users, including policy-makers and the general public, do not grasp how predictions are made, they may be less inclined to trust or implement the recommendations.
Addressing these challenges involves leveraging techniques in explainable AI (XAI) to provide clearer insights into how DL models assess flood risks [84,85]. Approaches such as feature importance analysis, visualization of model decisions, and sensitivity analyses can help elucidate how different factors contribute to risk predictions. Additionally, integrating simpler, more interpretable models with DL techniques can offer a balanced approach, combining high accuracy with greater transparency. Comprehensive documentation of the modeling process, including data sources, methodology, and performance metrics, is also vital for providing context and enhancing understanding.
4.4. Limitations of the Suggested Model
Analyzing the performance of DNN models in flood risk assessment requires a detailed examination of various factors. The model’s performance can vary significantly between different regions due to geographic, climatic, and infrastructural differences. Ibadan, with its tropical climate and diverse topography, may exhibit different flood risk patterns compared to Manila, which faces frequent typhoons and has a distinct urban layout. To ensure accuracy, the model must be validated and potentially adjusted to account for these regional differences. Additionally, specific conditions such as seasonal weather patterns [86,87] and local flood management [88,89] infrastructure can influence the model’s effectiveness. The model might perform well during the rainy season but struggle with unusual weather events or rapidly changing conditions.
The model’s limitations also include its geographic specificity [90]. A model optimized for flood risk in Ibadan may not directly apply to Manila without modifications. Differences in local hydrology, land use, and weather patterns necessitate retraining or fine-tuning the model with local data to ensure accurate predictions. Data quality and availability further impact the model’s performance. In regions where historical flood data or real-time monitoring data are limited or unreliable, the model’s predictions may suffer in accuracy. High-quality, comprehensive data collection is essential for robust model performance.
To apply the GA+DNN model effectively in other contexts, it is necessary to adapt it to different regions and conditions. Retraining or fine-tuning the model with local data can make it suitable for new areas. For instance, the model developed for Ibadan can be modified for other tropical regions with similar flood patterns by incorporating local meteorological and hydrological data. Additionally, the model can be tailored to specific conditions such as urban versus rural areas or different types of flood events. Integrating the model with other tools, such as geographic information systems (GIS) or real-time weather forecasting systems [91], can further enhance its predictive capabilities and operational utility.
4.5. Directions for Future Research
Several directions for future research could substantially enhance the accuracy and applicability of the models, one of them consists in continuing the development of methods capable of handling higher spatial resolution data for more accurate modeling and forecasting of street-level and micro-scale floods [92,93,94], which are essential in urban environments. To enhance predictive capabilities, there is a need to integrate data on climatic conditions, hydrological and hydraulic parameters, sensor data, and social data [95,96,97] (e.g., from social media and mobile apps). This integration would provide a more comprehensive understanding of flood behaviors [98]. Using ML to develop automated monitoring and flood warning systems that can quickly respond to changing conditions is pivotal for models to adapt and learn in real time with new data will improve the timeliness and accuracy of flood warning systems [99,100]. Given the changing climate and rapid urbanization, models must adequately account for these factors. ML can be instrumental in analyzing and forecasting the impact of climate change on floods and evaluating the effectiveness of various urban adaptation strategies. It is essential to develop methods that ensure the interpretability and explainability of ML model results [101,102,103]. This capability will assist urban planners and management authorities in better understanding the causes and consequences of floods, thereby facilitating appropriate mitigation and risk management measures.
In future studies of urban flood risk assessment, it is crucial to consider a broader range of influencing factors to improve model accuracy and relevance. One significant aspect that should be integrated is the analysis of urban vertical patterns which encompass the spatial distribution and arrangement of buildings, infrastructure, and land use within a city, including variations in building heights, density, and usage.
This understanding may help to design buildings as their height significantly impacts stormwater drainage. High-rise buildings and densely built areas can alter natural drainage patterns, potentially increasing runoff and elevating flood risks in specific regions. By incorporating vertical patterns into flood risk models, it becomes possible to identify areas where existing drainage systems might be overwhelmed. The presence of tall buildings and other vertical structures affects how floodwaters flow through urban environments. These structures can create barriers or direct floodwaters in particular directions, leading to localized flooding. Models that account for these vertical elements can provide more precise predictions of flood flow and accumulation. Additionally, urban vertical patterns influence local microclimates and heat islands, which in turn can affect precipitation patterns and flood risks. High-density areas with tall buildings often experience different temperature and humidity conditions compared to lower-density regions, influencing rainfall and runoff dynamics.
The impact of infrastructure on flood [104] resilience also needs to be considered. Elevated structures may be less susceptible to flooding, while lower-lying areas could be more vulnerable. Understanding the vertical distribution of infrastructure [105] helps assess the effectiveness of flood defenses and informs future development planning. To accurately model the effects of urban vertical patterns on flood risks, it is necessary to integrate high-resolution spatial data, such as building heights, land use maps, and elevation data. Advanced geographic information systems (GIS) and remote sensing technologies can provide detailed insights into these patterns. Incorporating urban vertical patterns into flood risk assessments allows for a more comprehensive understanding of how various factors contribute to flooding in urban settings. This holistic approach enhances the accuracy of flood risk predictions, informs better urban planning and development strategies, and improves resilience to urban flooding. Future studies should therefore prioritize the inclusion of these factors to refine flood risk assessments and develop more effective mitigation strategies.
5. Conclusions
In conclusion, this study highlighted the critical role of ML techniques, particularly Deep Neural Networks (DNNs) optimized through genetic algorithms (GAs), in enhancing the accuracy of flood risk assessment in urban areas. By leveraging comprehensive datasets from Ibadan, Nigeria, and Metro Manila, Philippines, we demonstrated that integrating soil composition data significantly improved the predictive capability of the DNN model. Specifically, the optimized DNN achieved an accuracy of 0.98 for Ibadan, outperforming models that relied solely on location and precipitation data, as evidenced by the 0.38 accuracy observed for Manila.
The findings underscore the importance of incorporating diverse environmental data into flood risk assessment models. Such enhancements not only enable more accurate predictions but also provide information for urban planners and decision-makers to implement effective flood mitigation strategies. Moving forward, further research should explore the scalability and generalizability of these models across different urban settings and climate conditions, aiming to bolster resilience against the increasing threats posed by floods.
Author Contributions
Conceptualization, V.T. and I.M.; data curation, Y.T. and I.M.; formal analysis, X.W.; funding acquisition, T.P., V.K., Y.T., O.K. and X.W.; investigation, I.M.; project administration, T.P., V.K., V.T., Y.T., O.K., I.K. and X.W.; resources, O.K., I.K. and I.M.; software, T.P. and V.K.; supervision, T.P., V.K., Y.T., O.K., I.K. and X.W.; validation, V.T.; visualization, I.K. and I.M.; writing—original draft, I.M.; writing—review and editing, V.T. All authors have read and agreed to the published version of the manuscript.
Funding
This research received no external funding.
Institutional Review Board Statement
Not applicable.
Informed Consent Statement
Not applicable.
Data Availability Statement
Data are contained within the article.
Conflicts of Interest
The authors declare no conflicts of interest.
References
- Prokic, M.N.; Savic, S.; Pavić, D. Pluvial flooding in urban areas across the European continent. Geogr. Pannonica 2019, 23, 216–232. [Google Scholar] [CrossRef]
- Jiang, Y.; Zevenbergen, C.; Ma, Y. Urban pluvial flooding and stormwater management: A contemporary review of China’s challenges and “sponge cities” strategy. Environ. Sci. Policy 2018, 80, 132–143. [Google Scholar] [CrossRef]
- Francipane, A.; Pumo, D.; Sinagra, M.; La Loggia, G.; Noto, L.V. A paradigm of extreme rainfall pluvial floods in complex urban areas: The flood event of 15 July 2020 in Palermo (Italy). Nat. Hazards Earth Syst. Sci. 2021, 4, 1–32. [Google Scholar] [CrossRef]
- He, H.; Li, R.; Pei, J.; Bilodeau, J.P.; Huang, G. Current overview of impact analysis and risk assessment of urban pluvial flood on road traffic. Sustain. Cities Soc. 2023, 12, 104993. [Google Scholar] [CrossRef]
- Acosta-Coll, M.; Ballester-Merelo, F.; Martinez-Peiró, M.; De la Hoz-Franco, E. Real-time early warning system design for pluvial flash floods—A review. Sensors 2018, 18, 2255. [Google Scholar] [CrossRef]
- Hamidifar, H.; Nones, M.; Rowinski, P.M. Flood modeling and fluvial dynamics: A scoping review on the role of sediment transport. Earth-Sci. Rev. 2024, 253, 104775. [Google Scholar] [CrossRef]
- Gosset, M.; Dibi-Anoh, P.A.; Schumann, G.; Hostache, R.; Paris, A.; Zahiri, E.P.; Kacou, M.; Gal, L. Hydrometeorological extreme events in Africa: The role of satellite observations for monitoring pluvial and fluvial flood risk. Surv. Geophys. 2023, 44, 197–223. [Google Scholar] [CrossRef]
- Riedel, L.; Röösli, T.; Vogt, T.; Bresch, D.N. Fluvial flood inundation and socio-economic impact model based on open data. Geosci. Model Dev. 2024, 17, 5291–5308. [Google Scholar] [CrossRef]
- Gao, Z.; Geddes, R.R.; Ma, T. Direct and indirect economic losses using typhoon-flood disaster analysis: An application to Guangdong province, China. Sustainability 2020, 12, 8980. [Google Scholar] [CrossRef]
- Lyu, H.M.; Yin, Z.Y.; Zhou, A.; Shen, S.L. Sensitivity analysis of typhoon-induced floods in coastal cities using improved ANP-GIS. Int. J. Disaster Risk Reduct. 2024, 104, 104344. [Google Scholar] [CrossRef]
- Yan, Y.; Wang, G.; Wu, H.; Gu, G.; Nanding, N. Characteristics of precipitation and floods during typhoons in Guangdong Province. Remote Sens. 2022, 14, 1945. [Google Scholar] [CrossRef]
- Lin, J.; Zhang, W.; Wen, Y.; Qiu, S. Evaluating the association between morphological characteristics of urban land and pluvial floods using machine learning methods. Sustain. Cities Soc. 2023, 99, 104891. [Google Scholar] [CrossRef]
- Ke, Q.; Tian, X.; Bricker, J.; Tian, Z.; Guan, G.; Cai, H.; Huang, X.; Yang, H.; Liu, J. Urban pluvial flooding prediction by machine learning approaches—A case study of Shenzhen city, China. Adv. Water Resour. 2020, 145, 103719. [Google Scholar] [CrossRef]
- Noymanee, J.; Nikitin, N.O.; Kalyuzhnaya, A.V. Urban pluvial flood forecasting using open data with machine learning techniques in pattani basin. Procedia Comput. Sci. 2017, 119, 288–297. [Google Scholar] [CrossRef]
- Zahura, F.T.; Goodall, J.L. Predicting combined tidal and pluvial flood inundation using a machine learning surrogate model. J. Hydrol. Reg. Stud. 2022, 41, 101087. [Google Scholar] [CrossRef]
- Löwe, R.; Böhm, J.; Jensen, D.G.; Leandro, J.; Rasmussen, S.H. U-FLOOD–Topographic deep learning for predicting urban pluvial flood water depth. J. Hydrol. 2021, 603, 126898. [Google Scholar] [CrossRef]
- Hofmann, J.; Schüttrumpf, H. Floodgan: Using deep adversarial learning to predict pluvial flooding in real time. Water 2021, 13, 2255. [Google Scholar] [CrossRef]
- Katti, A.; Ashish, K.; Loke, A.; Bade, K. A Pluvial Flood Detection Model Using Machine Learning Techniques and Simulate The Flow of Water. In Proceedings of the 2020 5th International Conference on Communication and Electronics Systems (ICCES), Coimbatore, India, 10–12 June 2020; IEEE: Piscataway, NJ, USA, 2020; pp. 1189–1195. [Google Scholar]
- Chang, D.L.; Yang, S.H.; Hsieh, S.L.; Wang, H.J.; Yeh, K.C. Artificial intelligence methodologies applied to prompt pluvial flood estimation and prediction. Water 2020, 12, 3552. [Google Scholar] [CrossRef]
- Liao, Y.; Wang, Z.; Chen, X.; Lai, C. Fast simulation and prediction of urban pluvial floods using a deep convolutional neural network model. J. Hydrol. 2023, 624, 129945. [Google Scholar] [CrossRef]
- Fidan, E.; Gray, J.; Doll, B.; Nelson, N.G. Machine learning approach for modeling daily pluvial flood dynamics in agricultural landscapes. Environ. Model. Softw. 2023, 167, 105758. [Google Scholar] [CrossRef]
- Tehrany, M.S.; Pradhan, B.; Jebur, M.N. Flood susceptibility mapping using a novel ensemble weights-of-evidence and support vector machine models in GIS. J. Hydrol. 2014, 512, 332–343. [Google Scholar] [CrossRef]
- Pica, A.; Lämmle, L.; Burnelli, M.; Del Monte, M.; Donadio, C.; Faccini, F.; Lazzari, M.; Mandarino, A.; Melelli, L.; Perez Filho, A.; et al. Urban geomorphology methods and applications as a guideline for understanding the city environment. Land 2024, 13, 907. [Google Scholar] [CrossRef]
- Abiodun, O.K. Pluvial Flood Dataset. 2023. Available online: https://www.kaggle.com/datasets/oladapokayodeabiodun/pluvial-flood-dataset (accessed on 5 June 2024).
- Ajibade, F.O.; Ajibade, T.F.; Idowu, T.E.; Nwogwu, N.A.; Adelodun, B.; Lasisi, K.H.; Opafola, O.T.; Ajala, O.A.; Fadugba, O.G.; Adewumi, J.R. Flood-prone area mapping using GIS-based analytical hierarchy frameworks for Ibadan city, Nigeria. J. Multi-Criteria Decis. Anal. 2021, 28, 283–295. [Google Scholar] [CrossRef]
- Tella, A.; Balogun, A.L. Ensemble fuzzy MCDM for spatial assessment of flood susceptibility in Ibadan, Nigeria. Nat. Hazards 2020, 104, 2277–2306. [Google Scholar] [CrossRef]
- Olokeogun, O.S.; Ayanlade, A.; Popoola, O.O. Assessment of riparian zone dynamics and its flood-related implications in Eleyele area of Ibadan, Nigeria. Environ. Syst. Res. 2020, 9, 6. [Google Scholar] [CrossRef]
- Komolafe, A.A.; Olorunfemi, I.E.; Akinluyi, F.O.; Adeyemi, M.A.; Ajayi, J.A. Enhanced flood hazard modelling using hydraulic, analytical hierarchical process and height above nearest drainage models in Ogunpa river basin, Ibadan, Southwestern Nigeria. Model. Earth Syst. Environ. 2021, 7, 967–981. [Google Scholar] [CrossRef]
- Oyinna, B.; Okedu, K.E.; Diemuodeke, O.E.; David, L.E.; Negedu, I.O.; Osemudiamen, E.A.; Colak, I.; Kalam, A. Assessing small hydropower sites in Nigeria for sustainable development using ArcGIS. Energy Rep. 2023, 10, 2889–2898. [Google Scholar] [CrossRef]
- U.S. Geological Survey. Available online: https://www.usgs.gov/ (accessed on 24 August 2024).
- Copernicus Climate Change Service. Available online: https://climate.copernicus.eu/?promo=News&tr=true (accessed on 24 August 2024).
- Hong, H.; Panahi, M.; Shirzadi, A.; Ma, T.; Liu, J.; Zhu, A.X.; Chen, W.; Kougias, I.; Kazakis, N. Flood susceptibility assessment in Hengfeng area coupling adaptive neuro-fuzzy inference system with genetic algorithm and differential evolution. Sci. Total Environ. 2018, 621, 1124–1141. [Google Scholar] [CrossRef]
- de Jong, K.; Panja, D.; Karssenberg, D.; van Kreveld, M. Scalability and composability of flow accumulation algorithms based on asynchronous many-tasks. Comput. Geosci. 2022, 162, 105083. [Google Scholar] [CrossRef]
- Piadeh, F.; Behzadian, K.; Chen, A.S.; Kapelan, Z.; Rizzuto, J.P.; Campos, L.C. Enhancing urban flood forecasting in drainage systems using dynamic ensemble-based data mining. Water Res. 2023, 247, 120791. [Google Scholar] [CrossRef]
- Dinesh Kumar, P.; Gopinath, G.; Seralathan, P. Application of remote sensing and GIS for the demarcation of groundwater potential zones of a river basin in Kerala, southwest coast of India. Int. J. Remote Sens. 2007, 28, 5583–5601. [Google Scholar] [CrossRef]
- Das, S. Geospatial mapping of flood susceptibility and hydro-geomorphic response to the floods in Ulhas basin, India. Remote Sens. Appl. Soc. Environ. 2019, 14, 60–74. [Google Scholar] [CrossRef]
- Zhao, G.; Pang, B.; Xu, Z.; Yue, J.; Tu, T. Mapping flood susceptibility in mountainous areas on a national scale in China. Sci. Total. Environ. 2018, 615, 1133–1142. [Google Scholar] [CrossRef] [PubMed]
- Tien Bui, D.; Khosravi, K.; Li, S.; Shahabi, H.; Panahi, M.; Singh, V.P.; Chapi, K.; Shirzadi, A.; Panahi, S.; Chen, W.; et al. New hybrids of anfis with several optimization algorithms for flood susceptibility modeling. Water 2018, 10, 1210. [Google Scholar] [CrossRef]
- Cai, T.; Li, X.; Ding, X.; Wang, J.; Zhan, J. Flood risk assessment based on hydrodynamic model and fuzzy comprehensive evaluation with GIS technique. Int. J. Disaster Risk Reduct. 2019, 35, 101077. [Google Scholar] [CrossRef]
- Kefi, M.; Mishra, B.K.; Masago, Y.; Fukushi, K. Analysis of flood damage and influencing factors in urban catchments: Case studies in Manila, Philippines, and Jakarta, Indonesia. Nat. Hazards 2020, 104, 2461–2487. [Google Scholar] [CrossRef]
- Dulawan, J.M.T.; Imamura, Y.; Amaguchi, H.; Ohara, M. Social Drivers of Flood Vulnerability: Understanding Household Perspectives and Persistence of Living in Flood Zones of Metro Manila, Philippines. Water 2024, 16, 799. [Google Scholar] [CrossRef]
- Plyushteva, A.; Schwanen, T. “We usually have a bit of flood once a week”: Conceptualising the infrastructural rhythms of urban floods in Malate, Manila. Urban Geogr. 2023, 44, 1565–1583. [Google Scholar] [CrossRef]
- Giologicx. Aegis Dataset. 2024. Available online: https://www.kaggle.com/datasets/giologicx/aegisdataset (accessed on 29 June 2024).
- Nationwide Operational Assessment of Hazards (NOAH). Available online: https://noah.up.edu.ph (accessed on 1 June 2024).
- National Mapping and Resource Information Authority (NAMRIA). Available online: https://www.namria.gov.ph (accessed on 1 June 2024).
- Lagmay, A.M.F.A. Nationwide Operational Assessment of Hazards (NOAH): A responsive program for disaster risk reduction in the Philippines. In Humanitarian Technology Survey Policy Report; S. Rajaratnam School of International Studies (RSIS), Nanyang Technological University: Nanyang, China, 2017. [Google Scholar]
- Lagmay, A.M.F.A.; Racoma, B.A.; Aracan, K.A.; Alconis-Ayco, J.; Saddi, I.L. Disseminating near-real-time hazards information and flood maps in the Philippines through Web-GIS. J. Environ. Sci. 2017, 59, 13–23. [Google Scholar] [CrossRef]
- Lagmay, A.M.; Mendoza, J.; Cipriano, F.; Delmendo, P.A.; Lacsamana, M.N.; Moises, M.A.; Pellejera III, N.; Punay, K.N.; Sabio, G.; Santos, L.; et al. Street floods in Metro Manila and possible solutions. J. Environ. Sci. 2017, 59, 39–47. [Google Scholar] [CrossRef]
- Lagmay, A.M.F.; Agaton, R.P.; Bahala, M.A.C.; Briones, J.B.L.T.; Cabacaba, K.M.C.; Caro, C.V.C.; Dasallas, L.L.; Gonzalo, L.A.L.; Ladiero, C.N.; Lapidez, J.P.; et al. Devastating storm surges of Typhoon Haiyan. Int. J. Disaster Risk Reduct. 2015, 11, 1–12. [Google Scholar] [CrossRef]
- Lagmay, A.M.; Kerle, N. Typhoons: Storm-surge models helped for Hagupit. Nature 2015, 26, 519. [Google Scholar]
- Ross, M.; Santiago, J.; Lagmay, A.M. Integrating and applying technology in response to the super typhoon Bopha disaster. Procedia Eng. 2015, 107, 100–109. [Google Scholar] [CrossRef]
- Tablazon, J.; Caro, C.; Lagmay, A.; Briones, J.; Dasallas, L.; Lapidez, J.; Santiago, J.; Suarez, J.; Ladiero, C.; Gonzalo, L.; et al. Probabilistic storm surge inundation maps for Metro Manila based on Philippine public storm warning signals. Nat. Hazards Earth Syst. Sci. 2015, 15, 557–570. [Google Scholar] [CrossRef]
- Lapidez, J.P.; Tablazon, J.; Dasallas, L.; Gonzalo, L.; Cabacaba, K.; Ramos, M.; Suarez, J.; Santiago, J.; Lagmay, A.; Malano, V. Identification of storm surge vulnerable areas in the Philippines through the simulation of Typhoon Haiyan-induced storm surge levels over historical storm tracks. Nat. Hazards Earth Syst. Sci. 2015, 15, 1473–1481. [Google Scholar] [CrossRef]
- Rodolfo, K.S.; Lagmay, A.M.F.; Eco, R.C.; Herrero, T.M.L.; Mendoza, J.E.; Minimo, L.G.; Santiago, J.T. The December 2012 Mayo River debris flow triggered by Super Typhoon Bopha in Mindanao, Philippines: Lessons learned and questions raised. Nat. Hazards Earth Syst. Sci. 2016, 16, 2683–2695. [Google Scholar] [CrossRef]
- May, S.; Engel, M.; Brill, D.; Cuadra, C.; Lagmay, A.; Santiago, J.; Suarez, J.; Reyes, M.; Brückner, H. Block and boulder transport in eastern Samar (Philippines) during Supertyphoon Haiyan. Earth Surf. Dyn. 2015, 3, 543–558. [Google Scholar] [CrossRef]
- Luzon, P.K.; Montalbo, K.; Galang, J.; Sabado, J.M.; Escape, C.M.; Felix, R.; Lagmay, A.M.F. Hazard mapping related to structurally controlled landslides in Southern Leyte, Philippines. Nat. Hazards Earth Syst. Sci. 2016, 16, 875–883. [Google Scholar] [CrossRef]
- Lagmay, A.M.F.A.; Santiago, J.; Pulhin, J.M. Mainstreaming CCA-DRVRM Using Probabilistic Multi-scenario Hazard Maps for Future Resilience in Haiyan-Affected Areas. In Climate Change, Disaster Risks, and Human Security; Pulhin, J.M., Inoue, M., Shaw, R., Eds.; Springer: Singapore, 2021. [Google Scholar] [CrossRef]
- Alejandrino, I.K.; Lagmay, A.M.; Eco, R.N. Shallow landslide hazard mapping for Davao oriental, Philippines, using a deterministic GIS model. In Communicating Climate-Change and Natural Hazard Risk and Cultivating Resilience: Case Studies for a Multi-Disciplinary Approach; Springer: Berlin/Heidelberg, Germany, 2016; pp. 131–147. [Google Scholar]
- Lagmay, A.M.F.A.; Escape, C.; Ybanez, A.A.; Suarez, J.K.; Cuaresma, G. Anatomy of the Naga City landslide and comparison with historical debris avalanches and analog models. Front. Earth Sci. 2020, 8, 312. [Google Scholar] [CrossRef]
- Lagmay, M.; Racoma, B.A. Lessons from tropical storms Urduja and Vinta disasters in the Philippines. Disaster Prev. Manag. Int. J. 2019, 28, 154–170. [Google Scholar] [CrossRef]
- Chaivutitorn, T.; Tanasakcharoen, T.; Leelawat, N.; Tang, J.; Caro, C.V.C.; Lagmay, A.M.; Suppasri, A.; Bricker, J.D.; Roeber, V.; Yi, C.J.; et al. Statistical Analysis of Building Damage from the 2013 Super Typhoon Haiyan and Its Storm Surge in the Philippines. J. Disaster Res. 2020, 15, 822–832. [Google Scholar] [CrossRef]
- Lagmay, A.M.F.; Bagtasa, G.; Crisologo, I.A.; Racoma, B.A.B.; David, C.P.C. Volcanoes magnify Metro Manila’s southwest monsoon rains and lethal floods. Front. Earth Sci. 2015, 2, 36. [Google Scholar] [CrossRef]
- Zhang, D.; Shi, X.; Xu, H.; Jing, Q.; Pan, X.; Liu, T.; Wang, H.; Hou, H. A GIS-based spatial multi-index model for flood risk assessment in the Yangtze River Basin, China. Environ. Impact Assess. Rev. 2020, 83, 106397. [Google Scholar] [CrossRef]
- Yao, S.; Huang, G.; Chen, Z. Evaluation of urban flood adaptability based on the InVEST model and GIS: A case study of New York City, USA. Nat. Hazards 2024, 8, 1–20. [Google Scholar] [CrossRef]
- Rahaman, M.H.; Sajjad, H.; Hussain, S.; Masroor, M.; Sharma, A. Surface water quality prediction in the lower Thoubal river watershed, India: A hyper-tuned machine learning approach and DNN-based sensitivity analysis. J. Environ. Chem. Eng. 2024, 12, 112915. [Google Scholar] [CrossRef]
- Nikbakht, S.; Anitescu, C.; Rabczuk, T. Optimizing the neural network hyperparameters utilizing genetic algorithm. J. Zhejiang-Univ.-Sci. A 2021, 22, 407–426. [Google Scholar] [CrossRef]
- Peng, Y.; Gong, D.; Deng, C.; Li, H.; Cai, H.; Zhang, H. An automatic hyperparameter optimization DNN model for precipitation prediction. Appl. Intell. 2022, 52, 2703–2719. [Google Scholar] [CrossRef]
- Montalvo, C.; Reyes-Silva, J.D.; Sañudo, E.; Cea, L.; Puertas, J. Urban pluvial flood modelling in the absence of sewer drainage network data: A physics-based approach. J. Hydrol. 2024, 634, 131043. [Google Scholar] [CrossRef]
- Gaido-Lasserre, C.; Nederhoff, K.; Storlazzi, C.D.; Reguero, B.G.; Beck, M.W. Improved efficient physics-based computational modeling of regional wave-driven coastal flooding for reef-lined coastlines. Ocean. Model. 2024, 189, 102358. [Google Scholar] [CrossRef]
- Fraehr, N.; Wang, Q.J.; Wu, W.; Nathan, R. Assessment of surrogate models for flood inundation: The physics-guided LSG model vs. state-of-the-art machine learning models. Water Res. 2024, 252, 121202. [Google Scholar] [CrossRef]
- Rau, M.I.; Julzarika, A.; Yoshikawa, N.; Nagano, T.; Kimura, M.; Setiawan, B.I.; Ha, L.T. Application of topographic elevation data generated by remote sensing approaches to flood inundation analysis model. Paddy Water Environ. 2024, 22, 285–299. [Google Scholar] [CrossRef]
- Mangukiya, N.K.; Sharma, A. Alternate pathway for regional flood frequency analysis in data-sparse region. J. Hydrol. 2024, 629, 130635. [Google Scholar] [CrossRef]
- Dasari, I.; Vema, V.K. Spatial variability of rainfall: Deciphering flood characteristics and model precision. Hydrol. Sci. J. 2024, 69, 1317–1334. [Google Scholar] [CrossRef]
- Yu, S.; Hannah, W.; Peng, L.; Lin, J.; Bhouri, M.A.; Gupta, R.; Lütjens, B.; Will, J.C.; Behrens, G.; Busecke, J.; et al. ClimSim: A large multi-scale dataset for hybrid physics-ML climate emulation. Adv. Neural Inf. Process. Syst. 2024, 36, 22070–22084. [Google Scholar]
- Shrestha, A.; Garcia, M.; Doerry, E. Leveraging catchment scale automated novel data collection infrastructure to advance urban hydrologic-hydraulic modeling. Environ. Model. Softw. 2024, 178, 106046. [Google Scholar] [CrossRef]
- Morsy, M.M.; Roy, B.; Shen, Y.; Sadler, J.M.; Chen, A.B.; Zahura, F.T.; Goodall, J.L. Quantifying the Impact of Climate Change on Peak Stream Discharge for Watersheds of Varying Sizes in the Coastal Plain of Virginia. J. Hydrol. Eng. 2024, 29, 04024012. [Google Scholar] [CrossRef]
- Fernández-Nóvoa, D.; González-Cao, J.; García-Feal, O. Enhancing Flood Risk Management: A Comprehensive Review on Flood Early Warning Systems with Emphasis on Numerical Modeling. Water 2024, 16, 1408. [Google Scholar] [CrossRef]
- Bournas, A. Development and Implementation of a Methodological Framework for Early Warning of Intense Floods Using Innovative Technologies. Ph.D. Thesis, School of Civil Engineering, Houston, TX, USA, 2024. [Google Scholar]
- Barbierato, E.; Gatti, A. The challenges of machine learning: A critical review. Electronics 2024, 13, 416. [Google Scholar] [CrossRef]
- Marcus, E.; Teuwen, J. Artificial intelligence and explanation: How, why, and when to explain black boxes. Eur. J. Radiol. 2024, 23, 111393. [Google Scholar] [CrossRef]
- Deger, Z.T.; Taskin, G.; Wallace, J.W. No more black-boxes: Estimate deformation capacity of non-ductile RC shear walls based on generalized additive models. Bull. Earthq. Eng. 2024, 1–18. [Google Scholar] [CrossRef]
- Wilhelmi, O.V.; Morss, R.E.; Lazrus, H.; Boehnert, J.; Gambill, J.M. Examining the roles of visualizations in people’s understanding of uncertain storm surge forecasts, interpretation of risk, and decision-making. Int. J. Disaster Risk Reduct. 2024, 107, 104424. [Google Scholar] [CrossRef]
- Velegrakis, A.; Chatzistratis, D.; Chalazas, T.; Armaroli, C.; Schiavon, E.; Alves, B.; Grigoriadis, D.; Hasiotis, T.; Ieronymidi, E. Earth observation technologies, policies and legislation for the coastal flood risk assessment and management: A European perspective. Anthr. Coasts 2024, 7, 3. [Google Scholar] [CrossRef]
- Chu, W.; Zhang, C.; Li, H.; Zhang, L.; Shen, D.; Li, R. SHAP-powered insights into spatiotemporal effects: Unlocking explainable Bayesian-neural-network urban flood forecasting. Int. J. Appl. Earth Obs. Geoinf. 2024, 131, 103972. [Google Scholar] [CrossRef]
- Alshayeb, M.J.; Hang, H.T.; Shohan, A.A.A.; Bindajam, A.A. Novel optimized deep learning algorithms and explainable artificial intelligence for storm surge susceptibility modeling and management in a flood-prone island. Nat. Hazards 2024, 120, 5099–5128. [Google Scholar] [CrossRef]
- Al Mashoudi, A.; Akallouch, A.; Ziani, M.; El Mousaoui, M. Exploring the impact of weather patterns on exceptional flooding events in the Nekor watershed, NE Morocco. Environ.-Socio-Econ. Stud. 2024, 12, 1–12. [Google Scholar] [CrossRef]
- Liu, Y.; Yuan, X.; Jiao, Y.; Ji, P.; Li, C.; An, X. Ensemble Forecasts of Extreme Flood Events with Weather Forecasts, Land Surface Modeling and Deep Learning. Water 2024, 16, 990. [Google Scholar] [CrossRef]
- Bullen, J.; Miles, A. Exploring local perspectives on flood risk: A participatory GIS approach for bridging the gap between modelled and perceived flood risk zones. Appl. Geogr. 2024, 163, 103176. [Google Scholar] [CrossRef]
- Along, N.Z.B.; Ahmed, I.; MacKee, J. Flood knowledge management by multiple stakeholders: An example from Malaysia. Int. J. Disaster Resil. Built Environ. 2024, 15, 141–157. [Google Scholar] [CrossRef]
- Zhu, S.; Feng, H.; Arashpour, M.; Zhang, F. Enhancing urban flood resilience: A coupling coordinated evaluation and geographical factor analysis under SES-PSR framework. Int. J. Disaster Risk Reduct. 2024, 101, 104243. [Google Scholar] [CrossRef]
- Debata, S.; Elango, S. Empowering flood forecasting through meteorological and social media data. Int. J. Inf. Technol. 2024, 16, 3757–3770. [Google Scholar] [CrossRef]
- Hénonin, J.; Russo, B.; Roqueta, D. Urban flood real-time forecasting and modelling: A state-of-the-art review. In Proceedings of the MIKE by DHI Conference, Copenhagen, Denmark, 6–8 September 2010. [Google Scholar]
- Henonin, J.; Russo, B.; Mark, O. Real-time urban flood forecasting and modelling—A state of the art. J. Hydroinform. 2013, 15, 717–736. [Google Scholar] [CrossRef]
- Gerono, C.; Percival, S. A Street Level Flood Risk Assessment of Morpeth, UK. Routes J. Stud. 2023, 3, 159–177. [Google Scholar]
- Dong, S.; Yu, T.; Farahmand, H. Predictive multi-watershed flood monitoring using deep learning on integrated physical and social sensors data. Environ. Plan. B Urban Anal. City Sci. 2022, 49, 1838–1856. [Google Scholar] [CrossRef]
- Mishra, A.; Mukherjee, S.; Merz, B.; Singh, V. An overview of flood concepts, challenges, and future directions. J. Hydrol. Eng. 2022, 27, 03122001. [Google Scholar] [CrossRef]
- Mazzoleni, M. Improving Flood Prediction Assimilating Uncertain Crowdsourced Data into Hydrologic and Hydraulic Models; Taylor & Francis: Oxfordshire, UK, 2017. [Google Scholar]
- Rözer, V.; Müller, M.; Bubeck, P.; Kienzler, S.; Thieken, A.; Pech, I.; Schröter, K.; Buchholz, O.; Kreibich, H. Coping with pluvial floods by private households. Water 2016, 8, 304. [Google Scholar] [CrossRef]
- Wania, A.; Joubert-Boitat, I.; Dottori, F.; Kalas, M.; Salamon, P. Increasing timeliness of satellite-based flood mapping using early warning systems in the Copernicus Emergency Management Service. Remote Sens. 2021, 13, 2114. [Google Scholar] [CrossRef]
- Hohmann, T. Review of Early Warning Dissemination in Media and Assessment of Flood Early Warning Systems in Media: A Case Study in West Africa. Master’s Thesis, ETH Zurich, Zurich, Switzerland, 2021. [Google Scholar]
- Chakraborty, S.; Tomsett, R. Interpretability of deep learning models: A survey of results. In Proceedings of the 2017 IEEE Smartworld, Ubiquitous Intelligence & Computing, Advanced & Trusted Computed, Scalable Computing & Communications, Cloud & Big Data Computing, Internet of People and Smart City Innovation (Smartworld/SCALCOM/UIC/ATC/CBDcom/IOP/SCI), San Francisco, CA, USA, 4–8 August 2017. [Google Scholar]
- Linardatos, P.; Papastefanopoulos, V.; Kotsiantis, S. Explainable ai: A review of machine learning interpretability methods. Entropy 2020, 23, 18. [Google Scholar] [CrossRef]
- Dunn, J.; Mingardi, L.; Zhuo, Y. Comparing interpretability and explainability for feature selection. arXiv 2021, arXiv:2105.05328. [Google Scholar]
- Abegaz, R.; Xu, J.; Wang, F.; Huang, J. Impact of flooding events on buried infrastructures: A review. Front. Built Environ. 2024, 10, 1357741. [Google Scholar] [CrossRef]
- Fan, C.; Hou, J.; Li, D.; Chen, G.; Guan, B.; Wang, T.; Pinpin, L.; Gao, X. Characteristics and drivers of flooding in recently built urban infrastructure during extreme rainfall. Urban Clim. 2024, 56, 102018. [Google Scholar] [CrossRef]


Disclaimer/Publisher’s Note: The statements, opinions and data contained in all publications are solely those of the individual author(s) and contributor(s) and not of MDPI and/or the editor(s). MDPI and/or the editor(s) disclaim responsibility for any injury to people or property resulting from any ideas, methods, instructions or products referred to in the content. |
© 2024 by the authors. Licensee MDPI, Basel, Switzerland. This article is an open access article distributed under the terms and conditions of the Creative Commons Attribution (CC BY) license (https://creativecommons.org/licenses/by/4.0/).