Abstract
Leveraging advanced computational techniques, this study introduces an innovative hybrid computational-experimental approach for the recovery of hydroquinone and p-benzoquinone from the aqueous residue of pyrolysis oil derived from spent coffee grounds, offering a sustainable pathway for value-added chemicals recovery. A screw-type reactor operating within the temperature range of 450–550 °C was utilized for the conversion of spent coffee grounds into pyrolysis oil. A comprehensive characterization of the bio-oil was conducted using gas chromatography–mass spectroscopy (GC–MS) and high-performance liquid chromatography (HPLC), revealing hydroquinone and benzoquinone as the predominant phenolic compounds. Employing computer-aided molecular design (CAMD), we identified 1-propanol as an optimal green solvent for the selective extraction of quinones, offering superior process efficiency and economic viability. Notably, the extraction efficiency achieved for hydroquinone and p-benzoquinone reached up to 23.38 g/L and 14.39 g/L, respectively, from the aqueous fraction of pyrolysis oil at 550 °C, with an extraction time of 1 h. Techno-economic analysis indicated a robust rate of return of 20% and a payback period of 1.1 years for the separation process. This study underscores the critical role of a hybrid experimental-modelling approach in developing sustainable processes for the valorization of biowaste into valuable materials.
1. Introduction
The escalating global consumption of coffee, driven by its deepening cultural significance in numerous countries, has significantly bolstered its worldwide trade, thereby generating substantial by-products including coffee pulp, husks, and spent coffee grounds (SCGs) [1]. Projections for the 2023/2024 period estimate world coffee consumption to rise by 2.2% to 177.0 million 60 kg bags [2], with SCGs accounting for approximately 45% of this volume [3]. Currently, the bulk of SCGs is relegated to landfills, posing serious environmental risks due to its high organic content and acidity [4]. Nonetheless, SCGs’ substantial calorific value of 25 MJ/kg renders them an appealing biomass alternative for thermal energy [5], with energy content comparable to coal. SCGs are rich in organic compounds such as cellulose, hemicellulose, fatty acids, tannins, caffeine, and chlorogenic acids, which, if improperly managed, can lead to water pollution and soil degradation [6]. Conversely, these compounds hold significant potential for value-added applications. SCGs have been studied in relation to extracting bioactive substances [7], as adsorbents for harmful pollutants [8], as packaging coatings and biodegradable films [9], as nitrogen-rich fertilizers [10], and as oils for sunscreen formulations [11,12].
Pyrolysis is increasingly recognized as a sustainable and eco-friendly approach for converting residual biomass and food waste into value-added materials and products [13,14]. This process involves the thermal decomposition of carbonaceous feedstocks in the absence of oxidizing agents at temperatures ranging from 350 to 700 °C [15], resulting in the production of biochar, bio-oil, and pyrolysis gas [16,17]. Operating conditions, i.e., pyrolysis temperature and residence time, deeply influence the product yields and composition [18,19]. Fast pyrolysis is the fast heating of feedstocks with short vapor residence time (1–5 s) around the temperature of 500 °C to maximize the bio-oil yield [20]. Intermediate pyrolysis is carried out at a lower vapor residence time to obtain a more balanced yield of the three products [21]. Moreover, intermediate pyrolysis can process a broad range of feedstocks, including wet and heterogeneous waste [22].
Bio-oil is a complex mixture of water and hundreds of organic compounds derived from the depolymerization and fragmentation of cellulose, hemicellulose, and lignin [20]. Among the compounds identified in pyrolysis oil, there are acids, esters, aldehydes, ketones, anhydrosugars, furans, phenols, nitrogen-containing compounds, and large holocellulose-derived and lignin-derived oligomers [23]. In intermediate pyrolysis, bio-oil fractionates into two phases, i.e., an aqueous layer and a heavy semi-solid phase, also known as pyrolytic lignin [19]. Moreover, the feedstock properties contribute to the multiphase behavior of bio-oil. Ref. [24] outlined that high-extractives and ash-containing feedstocks result in separated-phases bio-oils after pyrolytic conversion.
Several studies have already investigated the pyrolytic conversion of SCGs. Ref. [25] investigated the fast pyrolysis of SCGs to evaluate the compounds present and their respective yields. Ref. [26] introduced a screw-conveyor reactor for SCGs fast pyrolysis, underling the impact of operating conditions on product yield and composition. In [27], the impact of pyrolysis temperature and lipid extraction on the product yields and energy output of the SCGs pyrolysis energy system was investigated.
The development of a circular economy based on waste reduction and biochemical recovery represents one of the most important research topics for the upcoming years [28]. However, extraction and recovery of single organics from the aqueous fraction of SCGs pyrolysis oil has not been extensively explored. The extraction of phenolic compounds in the SCGs is typically carried out via liquid–liquid extraction because the overlapping boiling points make it impractical to separate the complex mixtures via traditional distillation. Since a mass-separating agent is being introduced, the selection of solvent is pivotal. Utilizing green solvents can enhance extraction efficiency while simultaneously reducing costs, energy use, and secondary pollution from emissions [29]. Therefore, computer-aided molecular design techniques have the potential to identify the optimal solvents that can be used for the extraction. In CAMD, property prediction models can be inversed to identify the structures of solvents that can fulfil the targets of the solvents that can be used for the extraction of value-added chemicals from bio-oil [30]. Property estimation deals with predicting thermodynamically feasible properties for mixtures or individual solvents, whereas CAMD works inversely, sometimes yielding multiple or no satisfactory solutions that meet predefined targets.
Mixtures with varying concentrations of isopropanol [3], ethanol [31], and methanol [32] have previously been used to isolate polyphenols from bio-oil. While experimental methods can be employed to develop such solvents, these efforts are often laborious, protracted, and expensive [33]. For this reason, the aim of this study is to demonstrate the consistency of an integrated experimental-model approach (based on CAMD) for the valorization of the aqueous fraction of pyrolysis oil. Firstly, dried SCGs were pyrolyzed in a semi-continuous operation employing a lab-scale screw-reactor. Pyrolysis temperatures of 400 °C, 450 °C, and 550 °C were selected for intermediate pyrolysis and product yields were measured. The aqueous fraction of pyrolysis oil was characterized with GC–MS and HPLC. Hydroquinone (HQ) and p-benzoquinone (BQ), two widely employed intermediates for the synthesis of various chemicals in the industry, were found particularly abundant in the mixture and were objects for the liquid extraction [34].
For a solvent to be viable for extraction purposes, it must be recoverable both efficiently and economically. Yet, during the initial stages of solvent design, the cost of solvent recovery and the ease of separation are often overlooked. Consequently, a techno-economic analysis is necessary to evaluate potential solvents that not only have optimal solubility parameters, but also desirable physical properties [35]. The use of rigorous simulation models, equipped with appropriate property packages, is critical to accurately represent the necessary equipment and design requirements that significantly affect the process cost. Additionally, the discounted cash flow rate of return can be utilized to evaluate the profitability of the separation system, allowing for a comparison of solvents based on acceptable process performance [36]. For this reason, a techno-economic analysis was carried out for the solvent selected as the best option for extraction. To the best of the authors’ knowledge, studies aimed at the recovery of specific phenols (such as p-benzoquinone and hydroquinone) from the aqueous fraction of pyrolysis oil are not present in the literature, and the proposed article aims to fill this gap in the literature.
The structure of this paper is as follows: Section 2 provides a succinct review of the literature on CAMD methods; Section 3 details the materials and methods used in both the experimental and computational components of this study; Section 4 presents the results and discussion; and Section 5 elucidates the principal conclusions derived from the research.
2. Literature Review on CAMD
CAMD is an advanced technique that accelerates the development of promising molecular candidates by reverse-engineering molecules or mixtures to meet specific thermophysical, mechanical, and chemical property targets. Originally employed for the design of solvents, refrigerants, and polymers [36], CAMD leverages compound descriptors derived from fundamental fragments such as functional groups, utilizing quantitative structure–property relationships (QSPR) to predict molecular behavior. A notable approach within CAMD is the group contribution (GC) method, which links structural elements to properties through mathematical models and optimization algorithms, facilitating the selection of optimal solvents for specific applications [37].
CAMD aids in designing solvents tailored for extraction, separation, and chemical reactions. By utilizing mathematical models and optimization algorithms, it predicts solvent properties and selects the most suitable ones for a given application. This approach identifies solvents with desired traits like solubility, reactivity, and toxicity, and can even design novel solvents with unique properties not found in existing ones. This approach is widely used for anticipating properties in ionic liquids, estimating surface tension and viscosity, and formulating tailored solvents for various application [38]. There are different types of GC models, including those that are based on the contributions of individual atoms (ACs) and those that are based on the contributions of functional groups (GCs). The choice of model depends on the specific application and the available data [39]. The CAMD framework innovates entrainer design by analyzing iso-volatility curves and driving force information of ternary mixtures. It systematically explores chemical space to find optimal entrainer molecules, boosting extractive distillation efficiency. CAMD integrates property estimation methods and deep learning for faster molecular design and screening [40].
Group contribution methods (GCMs) are additive methods where the functional group is broken down into groups that constitute the building block of the molecules [29]. GC methods are used more commonly in chemical product design and process synthesis where the properties are set more qualitatively than quantitatively and are experimentally verified later, especially when pertaining to solvent-based extraction [41]. Ref. [42] adds the classification of pure-component functional properties as being dependent on either: [43], the principle of corresponding states or equations of states where the needed parameters are already calculated by the GCM [44]; the use of GCMs for the pure-component parameters followed by the ideal mixing rule [44]; or, lastly, the molecular architecture and intensive variables, such as pressure and temperature. It is to be noted that a corresponding functional property can be regarded as primary at a normal pressure of 1 atm and/or at temperature of 273 K [45].
The MG group contribution method [46] has the highest degree of accuracy due to its inclusion of interactions between second- and third-order molecular groups, as well as the foundational primary molecular blocks. The MG method is enacted at three levels: the first-order groups capture non-overlapping groups that allow for a vast range of organic compounds with partial inculcation of proximity effects, whereas the second- and third-order groups encapsulate overlapping interactions, providing introspection into proximity effects. Ref. [46] illustrates the additive formula, showing a general representation for the property estimation model as Equation (1).
where f(X) is a function of a property X, which can be melting temperature, boiling temperature, viscosity, etc.; w and z are estimated binary coefficients; and Ni, Mj, and Ok are the number of times each molecular group appeared, whereas Ci, Dj, Ek are the contributions of each of the respective group towards the physical property and are calculated using regression over a large database of molecular properties.
When the predictive models are used for CAMD, it is essential to ensure that the molecular arrangements enhancing these performance metrics are structurally viable. The rules followed in CAMD are as follows: (1) for structures with valency, all groups must be interconnected to avoid a shortage or excess of free attachments; (2) structures with one-too-many branch chains should be avoided, and proximity effects must be prohibited; (3) all non-hydrocarbon attachments must be boned with a carbon atom; and (4) only one bond of the carbon atom can be used for attachments other than carbon and hydrogen atoms [41]. Double or triple bonds are included but contained within each molecular group. Additional constraints may include the total number of groups making a molecule or the number of groups [47].
The PSE for the SPEED database has developed pure component property models based on experimental values of 25 properties spanning over 24,259 molecular structures, with each property having a minimum of 400 recorded datapoints [48]. A common property software program, the ICAS—Integrated Computer-Aided System—has come up as a tool to design solvents, based on the problem and selection of properties alongside the methods chosen. The platform contains a diverse range of product design toolboxes that are partitioned based on their computational usage, such as the SolventPro extension, which can be used in solvent swaps, and solvent-based separation, such as LLE, Distillation, etc. The SolventPro toolbox has been used in this paper to select solvents that will extract both quinones separately from the bio-oil mixture. Pivotal to solvent design is not only chemical stability, but also economic conceivability. After defining the target properties in SolventPro, a list of compounds is generated but only for hypothetical cases—a chemical feasibility and stability test would be required to gauge whether these could be possibly manufactured. The pro-CAPD tool within the CAMD set-up is at the behest of two divisions: a molecular representation and a property prediction tool, namely, the group contribution method. From the set property targets, pre-determined functional group type, and number constraints, molecules are either sought directly from the database or constructed using the GCM.
Solubility data is mostly not available or is too time and cost-intensive to experimentally determine the solute of interest [49], as each data point may require up to a day [50], as dissolution is functionally dependent on temperature, pressure, and mole fraction. The Hildebrand total solubility parameter (SI Units Mpa0.5) is defined as the square root of the cohesive energy density [51]:
where the cohesive energy is given by:
where is the standard enthalpy of vaporization at 298 K, is the universal gas constant, and is the absolute temperature. Equation (3) can be modified as follows:
where is the molar volume at a given temperature.
3. Materials and Methods
This study was structured into four distinct stages. The first stage involved the pyrolysis of spent coffee grounds to produce bio-oil, which was subsequently analyzed for its composition. In the second stage, CAMD was employed to identify a set of promising solvents that can effectively extract value-added chemicals from the pyrolysis bio-oil. The third stage entailed a techno-economic evaluation of the complete separation process using the identified solvents. In the final stage, the performance of the selected solvent was tested and validated through experimental methods. A detailed flow diagram outlining the methodology is presented in Figure 1.
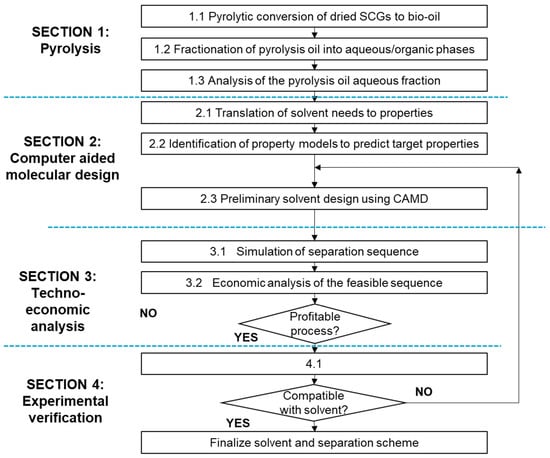
Figure 1.
Research methodology.
3.1. Materials
1-propanol (HPLC Grade; 99%, mixed isomers) and ethanol (99.8% with 1% MEK) were purchased from Merck (Darmstadt, Germany). Hydroquinone, p-benzoquinone, catechol, o-cresol, and phenol, used for the preparation of standard solutions, as well as phosphoric acid (HPLC grade) and methanol (HPLC grade), were purchased from Sigma-Aldrich in Steinheim, Germany. In all cases, distilled water (Merk Life Science S.r.l., Milan, Italy, USA) was used for preparing the aqueous solutions used in the HPLC measurements, along with RephiQuik PTFE filters with a pore size of 0.45 μm (RephiLe Bioscience Ltd., Shanghai, China). Spent coffee grounds (a blend of arabica/robusta, 40:60 by weight, as specified by the producers) were collected from the coffee shop of the Department of Engineering of the Tor Vergata University of Rome. The feedstock was dried for 12 h in a static oven at 105 ∓ 1 °C before each test and sieved to obtain a uniform particle size, with a mesh size 500 ÷ 850 μm.
3.2. Pyrolysis Set-Up
A 300 g/h screw-type reactor was employed for the intermediate pyrolysis process. A graphical representation is displayed in Figure 2. Briefly, a single shaftless screw conveys the biomass from the hopper to the electrically heated horizontal reactor. Particle residence time can be adjusted by variation of the angular speed of the shaftless screw and was settled to 10 s for this study. A mass flow controller (Aalborg GFC 17, Alborg Instruments & Controls, Inc., Orangeburg, NY USA) controlled the nitrogen volumetric flow rate of 1–2 NL/min. The pyrolysis process was carried out at a reactor temperature range of 450–550 °C. Vapors were filtered using a sand-filled filter maintained at 350 °C to avoid volatile condensation in the hot zone. A single-pass uncooled heat exchanger and two cooled coil-tube heat exchangers were employed for bio-oil condensation recovery. Non-condensable gas, after filtering in a nylon filter (Dwyer F710N), was sampled and collected in a 1 L sampling bag (Supelco—Inert Multi-Layer Foil) and the residual fraction was vented. Char and bio-oil yield were gravimetrically measured, while non-condensable gas yield was calculated by difference. Standard deviations were calculated on the 3 most significant tests. Further specifications of the experimental set-up can be found in our previous study [26].
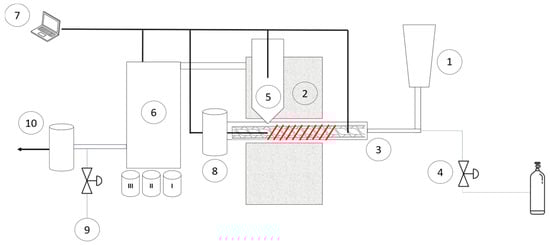
Figure 2.
Scheme of the screw-type reactor for fast pyrolysis tests. The main components are: (1) biomass hopper; (2) electrically heated oven; (3) shaftless screwdriver; (4) mass flow controller; (5) hot gas filter; (6) bio-oil condensers; (7) data log system; (8) biochar tank; (9) gas sampling port; (10) to vent.
3.3. Analytical Techniques
A Shimadzu GC/MS (QP2010SE) equipped with an Equity® 5 capillary column (30 m × 0.25 mm × 0.25 μm) was used for the GC–MS analysis of the pyrolysis oil. The samples were prepared for analysis by dissolving 0.5 mL of the aqueous fraction of pyrolysis oil in 25 mL of ethanol and filtering before the injection using a 0.45 μm PTFE syringe filter. The GC was programmed to maintain the temperature at 50 °C for 3 min, followed by heating to 310 °C at a heating rate of 15 °C/min, and holding at the final temperature for 30 min. The injection took place at 200 °C and was made in a split mode, injecting 1 μL of sample. The flow rate of the carrier gas (helium) was adjusted to 1.99 mL/min. The ion source temperature was 230 °C and the interface temperature was 280 °C for the mass selective detector. Data were acquired in the 50–500 m/z scan mode. A solvent cut at 5 min was applied to protect the MS from solvent shock. The identification of compounds was performed by comparing the mass spectra of the peaks with the standard spectra of other compounds using the NIST library.
High-performance liquid chromatography (HPLC) analyses were conducted using an Agilent 1100 system, incorporating a reversed-phase C18 column (5 μm, 250 × 4.6 mm, PINNACLE II, RESTEK, Cernusco sul Naviglio (MI), Italy), an autosampler (G1329A), four pumps (G1311A), and a diode array detector (DAD) series 1100 (Agilent Instruments, Milan, Italy). The analytical procedure, depicted schematically in Figure 3, commenced with a solvent gradient changing from 60:40 (v/v) water + 0.1% phosphoric acid/methanol to 41:59 (v/v) over the initial 3 min at a constant flow rate of 0.7 mL/min. An isocratic phase followed from 3 to 15 min, maintaining this ratio. Subsequently, from 15 to 18 min, the eluent ratio was reverted to the initial 60:40 (v/v). Detection was carried out at 218 nm, 244 nm, 270 nm, 274 nm, and 292 nm, with a reference wavelength set at 700 nm. The column temperature was consistently regulated at 20 °C, completing the process within 20 min with an injection volume of 20 μL.
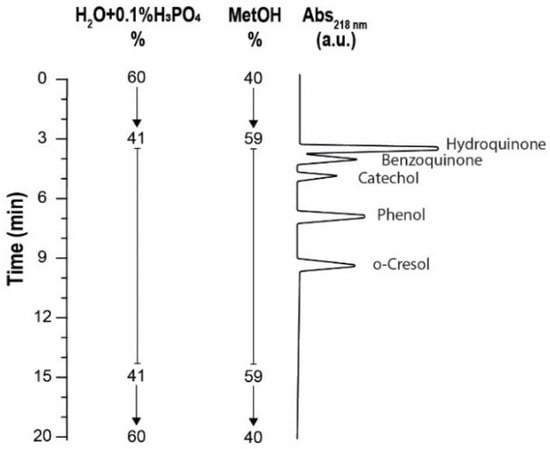
Figure 3.
Representation of the measurement conditions and corresponding elution time of the separate analyte present in the sample.
For qualitative analysis (refer to Figure S1A), retention times (summarized in Table S1) were determined for standards dissolved in 1-propanol at 100 μg/mL, filtered through RephiQuik PTFE filters (0.45 μm, RephiLe Bioscience Ltd., Shanghai, China). Quantitative analysis of hydroquinone and p-benzoquinone involved constructing calibration curves (Figure S1B,C), with concentrations ranging from 0 to 100 μg/mL in 1-propanol, including a negative control, all filtered before analysis.
To assess the extraction efficiency of quinones using 1-propanol, samples from various pyrolysis temperatures (400 °C, 450 °C, and 500 °C) were analyzed at extraction intervals of 0, 1, 5, and 24 h. The sample solutions were mixed with 1-propanol in a 1:10 (v/v) ratio and agitated in a rotary shaker (Dynal sample mixer, model MXIC1) at room temperature. Extracts, designated as E0, E1, E5, and E24 based on extraction duration, were subsequently centrifuged at 6000 rpm for 30 min using a Microspin 12 V.4AY centrifuge, diluted at a ratio of 1:100 (v/v) in 1-propanol, and filtered before the HPLC analysis.
3.4. Computer-Aided Molecular Design
To choose the best solvent to extract the quinones, an algorithmic framework for the CAMD of solvents that considers all aspects of solvent characteristics until the separation of quinones from the extracted mixture needed to be developed. For the solvent to be well-integrated, molecular design was evaluated, along with the ease of recovery from the extracted mixture, solvent price, economic considerations of relevant equipment capital, and operational costs. The steps used in the design have been described below.
3.4.1. Problem Specification and Design Objectives
The solvent design targets should consider the attributes related to the solvent power, selectivity, ease of separation, and safety, health, and environmental concerns [52]. The solvent needs to meet the design objective of solute dissolution and ease of recovery, once scaled up. For environmentally sustainable industries, the process energy must be conceived to a minimum [53]. One such way to achieve this is to select a solvent with physio-chemical properties conducive to a mode of separation that is energy efficient [54]. Distillation is chosen as the designated separation method due to its commercial acceptability in industries, set equipment, and procedural knowledge. The easiness for separation along with the possibility of thermal decomposition of quinones during various recovery stages must also be considered during this stage.
The relative volatility of the possible solvents was noted relative to the quinones, as with a higher difference in volatility, there is more convenience in separation: the distillation column will be shorter with a lesser number of stages, the reflux will be lower, and a higher-grade of purity of quinones can be obtained. Profit can then be compounded by not only low equipment and operating cost, but also by selling the quinones at a higher selling price for the increased purity. The suitability and sustainability of the process then lie in the higher return on investment (ROI), along with the environmental safety of a less energy-intensive process. For a more energy-yielding process, with a higher heat requirement, the associated steam flow rate will increase costs, and the fuel cost contributing to the steam generation will generate more greenhouse emissions.
3.4.2. Solvent Screening
The CAMD framework proposed for the design utilizes the process needs to establish thermodynamic and/or economic criteria based on specific physio-chemical properties. To avoid heavy process energy and capital requirements, the solvent must have a low boiling point, and thus, for the solvent design, the first property identified was boiling points, where the higher threshold was selected below 180 °C (boiling point of p-benzoquinone) to ensure the recovery of the quinones against the solvent used for extraction. In addition, the solvent must pose low toxicity, low explosiveness, low viscosity, and low respiratory hazard. The predictive models for these (5) attributes are shown in Equations (5)–(8).
where is the normal boiling point (K) [46], is the dynamic viscosity [55], is the acute toxicity [56], and is the permissible exposure limit [56].
Solubility parameters were used to obtain a preliminary screening of promising solvents. Hansen solubility parameters were used to identify promising solvents. Hansen solubility parameters of the quinones were sought from the database whilst the missing properties for the remanent components were estimated using the MG method within the ProPred by constructing each molecule. The Hansen solubility parameter values can be estimated from Equation (9):
where is the Hansen solubility parameter, while , and are the solubility parameter components from dispersion, hydrogen bonding, and polar. These values may be obtained experimentally for common solvents. However, for several components, predictive models were used to estimate these values from the molecular structure. The group contribution models for the estimation of these values are given in Equations (10)–(12):
The δt, δd, δp, and δhb values of all viable solutes, as shown in Table 1, were sequentially used to fix the solvent’s threshold. An approximated solubility parameter range of ±3 may help the solvent extract the component. In addition, the selected solvent must have a solubility parameter of 3 more than the rest of the components in the mixture. The short-listed solvents must also have desirable boiling points, low toxicity, low explosiveness, low viscosity, and low respiratory hazard:

Table 1.
Solubility parameters of components in bio-oil.
The most important attributes of the solvents used in extraction are the capacity and selectivity of the solvents [57]. In addition, these are antagonistic properties, which makes the identification of the solvents challenging for extraction processes [57]. Therefore, in addition to a solubility parameter close to the target compounds, a significant difference from the rest of the components is also required for the ideal solvent [58].
The CAMD model used structural constraints that included only acyclic compounds containing C, H, and O compounds. Thus, the list of solvents was narrowed to acyclic compounds with a maximum of 2 “functional groups” (functional group here refers to aldehydes, ketones, alcohols, and carboxylic acids), which were targeted within the molecule. Structures that contained amines, halides, and aromatic compounds were excluded based on their environmental effects and cautious disposal. Promising acyclic, cyclic, and aromatic compounds with desirable properties were designed.
3.5. Simulation Environment and Economic Analysis
A rigorous flowsheet model was constructed using the Aspen HYSYS V14 simulator and evaluated using the Economic Analyser. The UNIQUAC model was chosen due to the non-linearity of the system and the model’s ability to aptly estimate binary interaction parameters for VLE calculations. For phase equilibrium-related properties, the group-contribution-based UNIFAC method was predictive [58]. The employed simulation utilized the pyrolysis reactor’s bio-oil product as the feed, and extraction was conducted at room temperature and pressure for each solvent. The model was built on the following assumptions: steady and stable operation, ideal gas phase, and negligible pressure drop. To separate the solvent from the extracted mixture, the rigorous distillation method was used, and the recovered solvent was recycled back into the system. For distillation columns, a single-diameter tray tower was the equipment used, whereas for the mixer with the extraction input, an enclosed agitated tank was used [59]. Other costs, such as the liquid delivery pumps, valves, pipes, and pipe fittings, may be excluded at the preliminary process construction stage.
In order to conduct the economic analysis, a plant life of 25 years was set with a plant construction time of 2 years. The capital cost of the equipment was estimated using the Aspen Capital Cost Estimator (ACCE). The ACCE is utilized by a wide range of companies as it can accurately estimate the cost of each piece of equipment and associated plant and installation bulk materials, such as pipes, foundations, supports, and controls, which are crucial for equipment or plant installation and operation due to its distinctive volumetric modelling technology, which sets it apart from other estimating methods. Based on the estimated capital and operating costs, the discounted cash flow rate of return was estimated based on the revenue obtained by selling the products at the highest purity able to be obtained with these separation methods. The price of p-benzoquinone was 165 USD/kg [60] and the price of hydroquinone was 222 USD/kg [61] at a purity of 98%, which is possible using the distillation sequence.
4. Results and Discussion
In this section, the yield from the pyrolysis processes is detailed, followed by an analysis of the outputs. The solvents identified through CAMD are also presented, along with the results of the techno-economic analysis. Finally, the experimental results are provided to validate the overall methodology.
4.1. Pyrolysis Yields
Figure 4 illustrates the averaged product yields from the intermediate pyrolysis tests conducted using the screw-type reactor. Temperature increases resulted in higher rates of dehydration, decarboxylation, and depolymerization reactions, which, in turn, led to a decrease in char yield, from 27.0 wt.% to 17.8 wt.%. The product yields reported are in line with a prior investigation by [24]. The peak total bio-oil yield was observed at 450 °C, reaching 45.2%, a value consistent with similar research on pyrolysis of spent coffee grounds [25]. The non-condensable gas yield rose steadily within the examined temperature range, attributed to the intensified secondary tar cracking reactions [62]. As previously mentioned, pyrolysis oil spontaneously fractionates into a heavy organic fraction, collected at the bottom of the condenser, and a water-rich layer (aqueous phase). The yield of the aqueous fraction of the pyrolysis oil was higher than the yield of organics for all the temperatures explored. The yield from the aqueous phase aligned with the reported ranges in the literature for fast pyrolysis of lignocellulosic biomass, specifically falling within the range of 15–75 wt.% of the total pyrolysis oil [63]. Pyrolysis temperature increase had a slight effect on the organic fraction of the pyrolysis oil yield and remained stable with the temperature change. This is attributable to the higher stability of the organic compounds present in the organic fraction of pyrolysis oil than that abundant in the aqueous layer, which is more susceptible to thermal degradation.
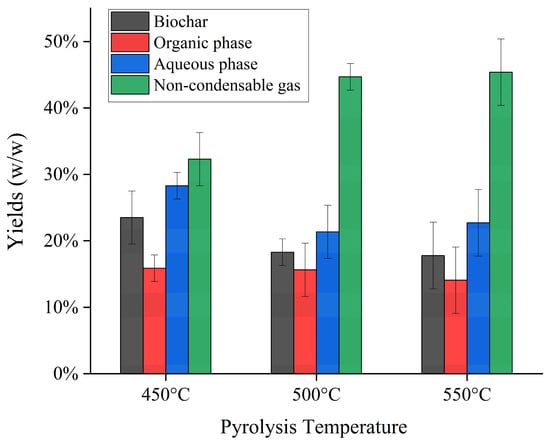
Figure 4.
Product yields of intermediate pyrolysis of SCGs in the temperature range 450–550 °C.
4.2. GC–MS Analysis of Pyrolysis Oil
The results of the GC–MS analysis of the aqueous fraction of pyrolysis oil, obtained at 550 °C, are reported in Table 2. As shown, N-containing compounds (mainly caffeine), fatty acids/esters, and phenols represent the most abundant compounds in terms of peak area percentage. The high peak area of fatty acids and esters is attributed to the high concentration of lipids in the dried feedstock, estimable in the range of 9–17 wt.% [64]. Phenolics’ relatively high abundance was due to the thermal degradation of lignin, particularly abundant in the SCG feedstock [65]. In detail, p-benzoquinone and hydroquinone (1–4 benzenediol) resulted in particularly attractive molecules to valorize, since they are highly consumed for notable industrial applications.
Table 2.
GC–MS analysis of the aqueous phase of pyrolysis oil, obtained at 550 °C of pyrolysis temperature (Classes overall peak area values reported in bold).
Similar results were obtained from the previous analysis of SCGs pyrolysis oil. Ref. [66] performed the quantitative analysis of SCGs pyrolysis oil using a comprehensive two-dimensional gas chromatography (GC × GC/TOF-MS). They found that fatty acids such as palmitic, stearic, oleic, and ethyl linoleate were the most abundant compounds. Moreover, they found a high abundance of caffeine, n-pentadecane, and catechol.
Ref. [67] reported that palmitic, stearic, linoleic, and phenol were the most abundant compounds from the GC–MS analysis of SCGs pyrolysis oil. Ref. [62] investigated the solvent selectivity towards specific organic groups of SCGs aqueous fraction of pyrolysis oil by a two-step liquid–liquid step. They outlined that the first extraction, in chloroform, was rich in caffeine and ketones, and contained residual traces of fatty acids and phenols, while the subsequent extraction, in ethyl acetate, was very abundant and selective towards quinones, especially p-benzoquinone and 1–2 benzenediol (pyrocathecol).
4.3. Results of CAMD
The SolventPro 1.0 software was used to find two pathways to extract the quinone compounds (hydroquinone and para-benzoquinone) from the mixture. The first pathway seeks the extraction of hydroquinone and p-benzoquinone from the aqueous mixture (Solvent A), whereas the second deals with the extraction of the unrequired compounds of caffeine, esters, etc. (Solvent B), leaving behind a mixture of the quinones.
- Solvent A: Extraction of Quinones
Solvent A, based on its higher solubility parameter, has the potential to extract both the hydroquinone and p-benzoquinone molecules from the mixture. A solubility parameter was selected in the range of (23–24) in comparison to that of p-benzoquinone (21.69) and hydroquinone (23.75). The estimated solubility parameter then included both these solvents, but excluded all components in the mixture with a solubility parameter in the range of 20–28 MPa1/2. Viable solutions are included in the Table 3:
Table 3.
List of solvents utilized for extracting the aqueous phase from the organic phase.
Among these solutions, extractions using solvents 1 to 4 were preferred due to their higher boiling point differential from the quinones, which facilitated a cleaner separation of Solvent A from the two quinones. In contrast, solvents 5 to 9 had boiling points that fell between hydroquinone (287.15 °C) and p-benzoquinone (180 °C), thus requiring the addition of another distillation column for effective separation, making them less desirable.
After extraction, the consideration of Solvent A’s preferred boiling point varied according to the composition of hydroquinone to benzoquinone. The variance in the relative composition of one quinone to the other alters the boiling point of the mixture in the distillation column. This compositional variance affected the decision to use solvent solutions 2 to 4 and exempted 1-Propanol due to its lower boiling point, leaving it to be the best selected potential Solvent A.
- Solvent B: Extraction of the Undesired compounds from quinones
Similar to the methods above, Solvent B’s solubility parameter was estimated to include the compounds with majority compositions in the aqueous mixture (caffeine, n-Hexadecenoic acid, 9.12-Octadecadienoic acid, and Levoglucosan), and to thereby exclude p-benzoquinone and hydroquinone. The relevant properties of solvents in this category are shown in Table 4.
Table 4.
List of solvents that exclude target components.
It can be seen that the differences in solubility parameters of solvents in Table 4 are not significantly different from that of hydroquinone. Therefore, it is not realistic to assume that the separation will be sharp between the solvents and the target compounds, which leads to large losses of the target compounds. Therefore, Solvent B was not considered to be of use, as some of the hydroquinone will be removed along with the impurities. Therefore, only the solvents listed under Solvent A were considered for further analysis.
Thus, different candidates for Solvent A were used in the economic analysis to consolidate the most economically feasible outcome or the least costly method. The list of solvents used in each of the simulations, along with their associated costs, are shown in Table 5.
Table 5.
Comparison of Change in Solvent A on Economic Optimization.
The variations in costs arises from the use of different solvents, each with ascending boiling points, which influences their volatility relative to hydroquinone. This variability impacts key design parameters, such as the number of trays, column height, and reflux rate. In selecting Solvent A, solvents 1–4 from Table 5 were compared based on price, while the remaining solvents were excluded due to their boiling point overlap with hydroquinone and the resulting low purity of the extracted quinones. The estimated costs of the separation process were used to estimate the profitability of the complete extraction and solvent recovery processes.
4.4. Experimental Validation of the Methodology
The proposed HPLC protocol provides a robust and precise method for the separation of various species within the samples, as shown in the chromatograms of the samples at different extraction times (Figure 5 and Figure 6). The chromatographic analysis enabled the accurate quantification of hydroquinone and benzoquinone concentrations, ensuring reliable results by effectively separating the chemical species and mitigating the risk of overestimating target compounds. This study investigated different extraction intervals—0, 1, 5, and 24 h—from samples processed at pyrolysis temperatures of 400 °C, 450 °C, and 500 °C (corresponding to extracts E0, E1, E5, and E24, respectively). Peak identification for hydroquinone, p-benzoquinone, catechol, phenol, and o-cresol was conducted by matching retention times with those of reference standards under identical conditions. The quantitative analysis, detailed in Table 6, revealed substantial initial concentrations of hydroquinone and p-benzoquinone in the E0 extracts, with both compounds demonstrating a significant increase in concentration as pyrolysis temperature rises. Hydroquinone concentrations showed an initial surge after one hour of extraction, followed by a decline over the subsequent 5 and 24 h across all samples, notably at 450 °C, 500 °C, and 550 °C. Conversely, the behavior of p-benzoquinone varied with the pyrolysis temperature: samples at 450 °C and 500 °C exhibited a rapid initial decrease in concentration within the first hour post-extraction, whereas at 550 °C, p-benzoquinone mirrored the hydroquinone trend, peaking after one hour before declining thereafter. Further chromatograms of the HPLC analysis of the 1-propanol extracted samples can be found in the Supplementary Materials.
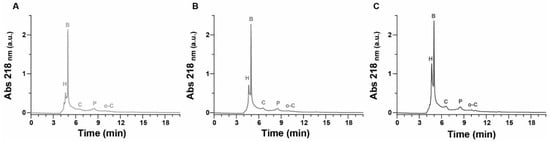
Figure 5.
Chromatograms of extract in 1-propanol at time 0 h (E0). (A) SCGs at 450 °C, diluted 1:100 (v/v) in 1-propanol; (B) SCGs at 500 °C, diluted 1:100 (v/v) in 1-propanol; and (C) SCGs at 550 °C, diluted 1:100 (v/v) in 1-propanol. All samples were treated as described.
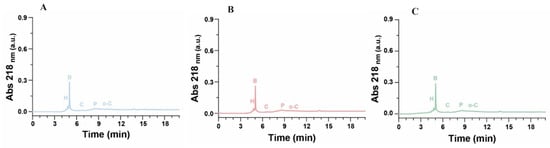
Figure 6.
Chromatograms of extracts at time 1, 5, 24 h. (A–C): Respective SCGs at 450 °C, extracted after one hour; SCGs at 450 °C extracted after 5 h; SCGs at 450 °C, extracted after 24 h.
Table 6.
Comparison of hydroquinone and p-benzoquinone concentrations in the different analyzed samples in function of the extraction time.
4.5. Process Optimization and Economic Analysis
Process optimization used Aspen HYSYS V14. This minimized energy consumption and total annual cost. Energy consumption and TAC are related to flow rate, reflux ratio, and equipment size. Since the process involves highly non-ideal liquid systems, the process was simulated with the UNIQAC model after estimating the binary interaction parameters. Rigorous distillation units were used to ensure that the non-ideal behavior of the system was accounted for during the column sizing. The best solvents from the CAMD search were compared economically using simulation methods to minimize capital and annual operating costs. In this process, quinones decompose well below their normal boiling point. Therefore, the distillation has to be conducted under a vacuum. The cost of the vacuum distillation process was compared with many competing processes such as melt crystallization to confirm that the optimal process was chosen for separation. Certain assumptions of perfect mixing, even heating, and no condenser losses were made during the simulation. It was found that, while the CAPEX was higher for a distillation-based separation process, this additional cost was offset by a significantly lower operating cost than the completing process pathways.
With respective changes in Solvent A, Case 1 was observed as the most economical. Propan-1-ol was also the cheapest solvent with increased usage in industrial SSGs as a green solvent [68] (Kokosa. 2019). However, isopropanol forms an azeotrope with water under the process conditions. The composition of isopropanol in the azeotrope was 87.5% by mass under the operating conditions. Therefore, this azeotrope can be recycled and reused to recover the quinones. In addition, the cost of the products was significantly higher than isopropanol. Based on the revenue, CAPEX and OPEX, the payback period was estimated to be 1.04 years and a DCFRR of 20% can be obtained. Therefore, propane-1-ol selection as the chosen solvent was justified for the separation of benzoquinone and hydroquinone at a larger scale.
5. Conclusions
A sophisticated solvent selection strategy has been devised for the extraction of quinones from bio-oil derived from spent coffee grounds. This approach not only capitalizes on valuable chemical compounds, but also supports a circular economy by repurposing waste. Utilizing computer-aided molecular design (CAMD), various solvents were identified based on their dissolution affinity for quinones, as determined by solubility parameters. The efficacy of the selected solvent was confirmed through experimental validation, demonstrating the successful extraction of the target compounds. Economic viability was assessed using simulation modelling, with propane-1-ol emerging as the preferred mass-separating agent due to its cost-effectiveness, offering lower capital and operating expenses along with a shorter payback period. Further evaluations are necessary, focusing on the recovery of quinones from the distillation process. Additionally, a cradle-to-grave life cycle assessment (LCA) is essential to evaluate the environmental impact of the proposed integrated process.
Supplementary Materials
The following supporting information can be downloaded at: https://www.mdpi.com/article/10.3390/su16177497/s1, Table S1: Retention times of the analyzed standards; Figure S1. A. Chromatograms of hydroquinone, p-benzoquinone, catechol, phenol, and o-cresol (reference standards). B. Cali-bration curve of hydroquinone. C. Calibration curve of p-benzoquinone; Table S2: Comparison of hydroquinone and p-benzoquinone concentrations in the different analyzed samples; Figure S2 Chromatograms of extracts at time 1, 5, 24 h. ABC: Respective SCG 450 °C, SCG 500 °C, SCG 550 °C extracted after one hour (E1); DEF: Respective samples SCG 450 °C, SCG 500 °C, SCG 550 °C extracted after 5 hours (E5); GHI: Respective samples SCG 450 °C, SCG.
Author Contributions
Conceptualization, L.B. and N.G.C.; methodology, N.G.C., A.Q. and L.M.; software, N.G.C. and A.Q.; validation, N.G.C., A.Q., L.M., E.P., P.M. and L.B.; formal analysis, P.M.; investigation, P.M., E.P., R.C., A.Q. and N.G.C.; data curation, A.Q., P.M. and E.P.; writing—original draft preparation, E.P., P.M., N.G.C. and A.Q.; writing—review and editing, L.B., N.G.C., L.M. and R.C.; supervision, L.B. and N.G.C.; funding acquisition, N.G.C., L.B. and L.M. All authors have read and agreed to the published version of the manuscript.
Funding
This research received no external funding.
Institutional Review Board Statement
Not applicable.
Informed Consent Statement
Not applicable.
Data Availability Statement
Further data will be provided upon request by authors.
Acknowledgments
L.B. and P.M. would like to acknowledge their colleagues, Stefano Cordiner and Vincenzo Mulone, for the opportunity to use the shared facility at the SCERG laboratory of the Tor Vergata University of Rome, where the results of the pyrolysis process have been gathered. Moreover, L.B and P.M. would like to thank Salvatore Ricotta (University of Rome ‘Tor Vergata’) for the fundamental technical support to develop the pyrolysis reactor. We would also like to thank the employees of the Coffee Bar of the Engineering Department for supplying us with feedstock. The authors express their gratitude to Rafiqul Gani from PSE for SPEED Company Limited for providing access to SolventPro 1.0 software, which was instrumental in the development of this work.
Conflicts of Interest
The authors declare no conflicts of interest.
References
- Kafková, V.; Kubinec, R.; Mikulec, J.; Variny, M.; Ondrejíčková, P.; Ház, A.; Brisudová, A. Integrated Approach to Spent Coffee Grounds Valorization in Biodiesel Biorefinery. Sustainability 2023, 15, 5612. [Google Scholar] [CrossRef]
- International Coffee Organization. Coffee Report and Outlook. Available online: https://icocoffee.org/documents/cy2022-23/Coffee_Report_and_Outlook_April_2023_-_ICO.pdf (accessed on 24 July 2023).
- Murthy, P.S.; Naidu, M.M. Recovery of Phenolic Antioxidants and Functional Compounds from Coffee Industry By-Products. Food Bioprocess Technol. 2012, 5, 897–903. [Google Scholar] [CrossRef]
- Lozano-Pérez, A.S.; Guerrero-Fajardo, C.A. Liquid Hot Water (LHW) and Hydrothermal Carbonization (HTC) of Coffee Berry Waste: Kinetics, Catalysis, and Optimization for the Synthesis of Platform Chemicals. Sustainability 2024, 16, 2854. [Google Scholar] [CrossRef]
- Massaro Sousa, L.; Ferreira, M.C. Spent coffee grounds as a renewable source of energy: An analysis of bulk powder flowability. Particuology 2019, 43, 92–100. [Google Scholar] [CrossRef]
- Ribeiro, J.P.; Vicente, E.D.; Gomes, A.P.; Nunes, M.I.; Alves, C.; Tarelho, L.A.C. Effect of industrial and domestic ash from biomass combustion, and spent coffee grounds, on soil fertility and plant growth: Experiments at field conditions. Environ. Sci. Pollut. Res. 2017, 24, 15270–15277. [Google Scholar] [CrossRef] [PubMed]
- Vu, D.; Vu, Q.; Huynh, L.; Lin, C.-H.; Alvarez, S.; Vo, X.; Nguyen, T. Evaluation of fatty acids, phenolics and bioactivities of spent coffee grounds prepared from Vietnamese coffee. Int. J. Food Prop. 2021, 24, 1548–1558. [Google Scholar] [CrossRef]
- Qisse, N.; Fattah, G.; Elouardi, M.; Mabrouki, J.; Azzouzi, L.; Ennouari, A.; Belghiti, M.; el Azzouzi, M. Competitive adsorption of Zn in wastewater effluents by NaOH-activated raw coffee grounds derivative and coffee grounds. Desalination Water Treat. 2022, 258, 123–132. [Google Scholar] [CrossRef]
- Getachew, A.; Cho, Y.J.; Chun, B. Effect of Pretreatments on Isolation of Bioactive Polysaccharides from Spent Coffee Grounds Using Subcritical Water. Int. J. Biol. Macromol. 2017, 109, 711–719. [Google Scholar] [CrossRef]
- Liu, K.; Price, G.W. Evaluation of three composting systems for the management of spent coffee grounds. Bioresour. Technol. 2011, 102, 7966–7974. [Google Scholar] [CrossRef] [PubMed]
- Solomakou, N.; Tsafrakidou, P.; Goula, A.M. Valorization of SCG through Extraction of Phenolic Compounds and Synthesis of New Biosorbent. Sustainability 2022, 14, 9358. [Google Scholar] [CrossRef]
- Reza, M.S.; Azad, A.K.; Abu Bakar, M.S.; Karim, M.R.; Sharifpur, M.; Taweekun, J. Evaluation of Thermochemical Characteristics and Pyrolysis of Fish Processing Waste for Renewable Energy Feedstock. Sustainability 2022, 14, 1203. [Google Scholar] [CrossRef]
- Papa, A.A.; Savuto, E.; Di Carlo, A.; Tacconi, A.; Rapagnà, S. Synergic Effects of Bed Materials and Catalytic Filter Candle for the Conversion of Tar during Biomass Steam Gasification. Energies 2023, 16, 595. [Google Scholar] [CrossRef]
- Papa, A.A.; Di Carlo, A.; Bocci, E.; Taglieri, L.; Del Zotto, L.; Gallifuoco, A. Energy Analysis of an Integrated Plant: Fluidized Bed Steam Gasification of Hydrothermally Treated Biomass Coupled to Solid Oxide Fuel Cells. Energies 2021, 14, 7331. [Google Scholar] [CrossRef]
- Volpe, M.; D’Anna, C.; Messineo, S.; Volpe, R.; Messineo, A. Sustainable production of bio-combustibles from pyrolysis of agro-industrial wastes. Sustainability 2014, 6, 7866–7882. [Google Scholar] [CrossRef]
- Mendiara, T.; Navajas, A.; Abad, A.; Pröll, T.; Munárriz, M.; Gandía, L.M.; García-Labiano, F.; de Diego, L.F. Life Cycle Assessment of Wheat Straw Pyrolysis with Volatile Fractions Chemical Looping Combustion. Sustainability 2024, 16, 4013. [Google Scholar] [CrossRef]
- Zhan, W.; Li, K.; Khanna, R.; Konyukhov, Y.; Liang, Z.; Bu, Y.; Sun, Z.; Jiang, C.; Zhang, J. The Catalytic Effect of Pt on Lignin Pyrolysis: A Reactive Molecular Dynamics Study. Sustainability 2024, 16, 3419. [Google Scholar] [CrossRef]
- Marin, F.; Bucura, F.; Niculescu, V.-C.; Roman, A.; Botoran, O.R.; Constantinescu, M.; Spiridon, S.I.; Ionete, E.I.; Oancea, S.; Zaharioiu, A.M. Mesoporous Silica Nanocatalyst-Based Pyrolysis of a By-Product of Paper Manufacturing, Black Liquor. Sustainability 2024, 16, 3429. [Google Scholar] [CrossRef]
- Altıkat, A.; Alma, M.H.; Altıkat, A.; Bilgili, M.E.; Altıkat, S. A Comprehensive Study of Biochar Yield and Quality Concerning Pyrolysis Conditions: A Multifaceted Approach. Sustainability 2024, 16, 937. [Google Scholar] [CrossRef]
- Bridgwater, A.V. Review of fast pyrolysis of biomass and product upgrading: OVERCOMING BARRIERS TO BIOENERGY: OUTCOMES OF THE BIOENERGY NETWORK OF EXCELLENCE 2003–2009. Biomass Bioenergy 2012, 38, 68–94. [Google Scholar] [CrossRef]
- Kim, P.; Weaver, S.; Noh, K.; Labbé, N. Characteristics of Bio-Oils Produced by an Intermediate Semipilot Scale Pyrolysis Auger Reactor Equipped with Multistage Condensers. Energ Fuel 2014, 28, 6966–6973. [Google Scholar] [CrossRef]
- Yang, Y.; Heaven, S.; Venetsaneas, N.; Banks, C.J.; Bridgwater, A.V. Slow pyrolysis of organic fraction of municipal solid waste (OFMSW): Characterisation of products and screening of the aqueous liquid product for anaerobic digestion. Appl. Energy 2018, 213, 158–168. [Google Scholar] [CrossRef]
- Amrullah, A.; Farobie, O.; Bayu, A.; Syaftika, N.; Hartulistiyoso, E.; Moheimani, N.R.; Karnjanakom, S.; Matsumura, Y. Slow Pyrolysis of Ulva lactuca (Chlorophyta) for Sustainable Production of Bio-Oil and Biochar. Sustainability 2022, 14, 3233. [Google Scholar] [CrossRef]
- Oasmaa, A.; Fonts, I.; Pelaez-Samaniego, M.R.; Garcia-Perez, M.E.; Garcia-Perez, M. Pyrolysis Oil Multiphase Behavior and Phase Stability: A Review. Energy Fuel 2016, 30, 6179–6200. [Google Scholar] [CrossRef]
- Bok, J.; Choi, H.; Choi, Y.; Park, H.C.; Kim, S.J. Fast pyrolysis of coffee grounds: Characteristics of product yields and biocrude oil quality. Energy 2012, 47, 17–24. [Google Scholar] [CrossRef]
- Kelkar, S.; Saffron, C.; Chai, L.; Bovee, J.; Stuecken, T.; Garedew, M.; Li, Z.; Kriegel, R. Pyrolysis of spent coffee grounds using a screw-conveyor reactor. Fuel Process. Technol. 2015, 137, 170–178. [Google Scholar] [CrossRef]
- Bartolucci, L.; Cordiner, S.; Mele, P.; Mulone, V. Defatted spent coffee grounds fast pyrolysis polygeneration system: Lipid extraction effect on energy yield and products characteristics. Biomass Bioenergy 2023, 179, 106974. [Google Scholar] [CrossRef]
- Caiardi, F.; Belaud, J.-P.; Vialle, C.; Monlau, F.; Tayibi, S.; Barakat, A.; Oukarroum, A.; Zeroual, Y.; Sablayrolles, C. Waste-to-energy innovative system: Assessment of integrating anaerobic digestion and pyrolysis technologies. Sustain. Prod. Consum. 2022, 31, 657–669. [Google Scholar] [CrossRef]
- Zhao, N.; Liu, Z.; Yu, T.; Yan, F. Spent coffee grounds: Present and future of environmentally friendly applications on industries-A review. Trends Food Sci. Technol. 2024, 143, 104312. [Google Scholar] [CrossRef]
- Gani, R.; Nielsen, B.; Fredenslund, A. A group contribution approach to computer-aided molecular design. AIChE J. 1991, 37, 1318–1332. [Google Scholar] [CrossRef]
- Zuorro, A. Optimization of polyphenol recovery from espresso coffee residues using factorial design and response surface methodology. Sep. Purif. Technol. 2015, 152, 64–69. [Google Scholar] [CrossRef]
- Mussatto, S.I.; Carneiro, L.M.; Silva, J.P.A.; Roberto, I.C.; Teixeira, J.A. A study on chemical constituents and sugars extraction from spent coffee grounds. Carbohydr. Polym. 2011, 83, 368–374. [Google Scholar] [CrossRef]
- Khalifa, M.; Lue, L. A group contribution method for predicting the solubility of mercury. Fluid Phase Equilib. 2017, 432, 76–84. [Google Scholar] [CrossRef]
- Gad, S.C. Hydroquinone. In Encyclopedia of Toxicology, 4th ed.; Academic Press: Cambridge, MA, USA, 2024; pp. 425–430. [Google Scholar] [CrossRef]
- Tey, T.O.; Chen, S.; Cheong, Z.X.; Choong, A.S.X.; Ng, L.Y.; Chemmangattuvalappil, N.G. Synthesis of a sustainable integrated biorefinery to produce value-added chemicals from palm-based biomass via mathematical optimisation. Sustain. Prod. Consum. 2021, 26, 288–315. [Google Scholar] [CrossRef]
- Xu, Y.; Rios, D.C.; Wang, S.; Ham, C.; Choi, J.-H.; Kim, H.; Park, S. Process design and techno-economic analysis for the lignin oil solvent recovery and purification process. J. Clean. Prod. 2024, 434, 139999. [Google Scholar] [CrossRef]
- Austin, N.D.; Sahinidis, N.V.; Trahan, D.W. Computer-aided molecular design: An introduction and review of tools, applications, and solution techniques. Chem. Eng. Res. Des. 2016, 116, 2–26. [Google Scholar] [CrossRef]
- Song, Z.; Zhang, C.; Qi, Z.; Zhou, T.; Sundmacher, K. Computer-aided design of ionic liquids as solvents for extractive desulfurization. AIChE J. 2018, 64, 1013–1025. [Google Scholar] [CrossRef]
- Haghbakhsh, R.; Raeissi, S.; Duarte, A.R.C. Group contribution and atomic contribution models for the prediction of various physical properties of deep eutectic solvents. Sci Rep. 2021, 11, 6684. [Google Scholar] [CrossRef]
- Cignitti, S.; Rodríguez-Donis, I.; Abildskov, J.; You, X.; Shcherbakova, N.; Gerbaud, V. CAMD for entrainer screening of extractive distillation process based on new thermodynamic criteria. Chem. Eng. Res. Des. 2019, 147, 721–733. [Google Scholar] [CrossRef]
- Gani, R. Group contribution-based property estimation methods: Advances and perspectives. Curr. Opin. Chem. Eng. 2019, 23, 184–196. [Google Scholar] [CrossRef]
- Kontogeorgis, G.M.; Gani, R. Computer Aided Property Estimation for Process and Product Design: Computers Aided Chemical Engineering; Elsevier Science & Technology: San Diego, CA, USA, 2004. [Google Scholar]
- Ceriani, R.; Gani, R.; Meirelles, A.J.A. Prediction of heat capacities and heats of vaporization of organic liquids by group contribution methods. Fluid Phase Equilib. 2009, 283, 49–55. [Google Scholar] [CrossRef]
- Poling, B.E.; Prausnitz, J.M.; O’Connell, J.P. Properties of Gases and Liquids, 5th ed.; McGraw-Hill Education: New York, NY, USA, 2001. [Google Scholar]
- Mann, V.; Gani, R.; Venkatasubramanian, V. Group contribution-based property modeling for chemical product design: A perspective in the AI era. Fluid Phase Equilib. 2023, 568, 113734. [Google Scholar] [CrossRef]
- Marrero, J.; Gani, R. Group-contribution based estimation of pure component properties. Fluid Phase Equilib. 2001, 183–184, 183–208. [Google Scholar] [CrossRef]
- Zhang, L.; Cignitti, S.; Gani, R. Generic mathematical programming formulation and solution for computer-aided molecular design. Comput. Chem. Eng. 2015, 78, 79–84. [Google Scholar] [CrossRef]
- Kalakul, S.; Zhang, L.; Fang, Z.; Choudhury, H.A.; Intikhab, S.; Elbashir, N.; Eden, M.R.; Gani, R. Computer aided chemical product design—ProCAPD and tailor-made blended products. Comput. Chem. Eng. 2018, 116, 37–55. [Google Scholar] [CrossRef]
- Bezaze, H.; Meniai, A.H. A predictive approach for thermodynamic modeling of solubility in supercritical fluids using genetic algorithm. Int. J. Hydrog. Energy 2017, 42, 12920–12925. [Google Scholar] [CrossRef]
- Chartier, T.; Delhomme, E.; Baumard, J.F.; Marteau, P.; Subra, P.; Tufeu, R. Solubility, in Supercritical Carbon Dioxide, of Paraffin Waxes Used as Binders for Low-Pressure Injection Molding. Ind. Eng. Chem. Res. 1999, 38, 1904–1910. [Google Scholar] [CrossRef]
- Hildebrand, J.H.; Scott, R.L. Regular Solutions; Prentice-Hall: Hoboken, NJ, USA, 1962. [Google Scholar]
- Ng, L.Y.; Chong, F.K.; Chemmangattuvalappil, N. Challenges and opportunities in computer-aided molecular design. Comput. Chem. Eng. 2015, 81, 115–129. [Google Scholar] [CrossRef]
- Ooi, J.; Ng, D.K.S.; Chemmangattuvalappil, N. Optimal molecular design towards an environmental friendly solvent recovery process. Comput. Chem. Eng. 2018, 117, 391–409. [Google Scholar] [CrossRef]
- Ooi, J.; Ng, D.K.S.; Chemmangattuvalappil, N.G. A Systematic Molecular Design Framework with the Consideration of Competing Solvent Recovery Processes. Ind. Eng. Chem. Res. 2019, 58, 13210–13226. [Google Scholar] [CrossRef]
- Conte, E.; Martinho, A.; Matos, H.A.; Gani, R. Combined Group-Contribution and Atom Connectivity Index-Based Methods for Estimation of Surface Tension and Viscosity. Ind. Eng. Chem. Res. 2008, 47, 7940–7954. [Google Scholar] [CrossRef]
- Hukkerikar, A.S.; Kalakul, S.; Sarup, B.; Young, D.M.; Sin, G.; Gani, R. Estimation of Environment-Related Properties of Chemicals for Design of Sustainable Processes: Development of Group-Contribution+ (GC+) Property Models and Uncertainty Analysis. J. Chem. Inf. Model. 2012, 52, 2823–2839. [Google Scholar] [CrossRef]
- Lee, V.; Ten, J.Y.; Hassim, M.H.; Chemmangattuvalappil, N.G. Design of Solvent Mixtures for Selective Extraction by Quantifying Thermodynamic and Sustainability Aspects. Process Integr. Optim. Sustain. 2020, 4, 297–308. [Google Scholar] [CrossRef]
- Gmehling, J.; Schedemann, A. Selection of Solvents or Solvent Mixtures for Liquid–Liquid Extraction Using Predictive Thermodynamic Models Or Access To The Dortmund Data Bank. Ind. Eng. Chem. Res. 2014, 53, 17794–17805. [Google Scholar] [CrossRef]
- Haydary, J. Economic Evaluation. In Chemical Process Design and Simulation; John Wiley & Sons, Inc.: Hoboken, NJ, USA, 2018; pp. 263–281. [Google Scholar] [CrossRef]
- P-Benzoquinone Pricing Sigma-Aldrich. Available online: https://www.sigmaaldrich.com/MY/en/search/106-51-4?focus=products&page=1&perpage=30&sort=relevance&term=106-51-4&type=product (accessed on 4 August 2023).
- Hydroquinone Pricing Sigma-Aldrich. Available online: https://www.sigmaaldrich.com/MY/en/search/123-31-9?focus=products&page=1&perpage=30&sort=relevance&term=123-31-9&type=product (accessed on 4 August 2023).
- Bartolucci, L.; Cordiner, S.; Di Carlo, A.; Gallifuoco, A.; Mele, P.; Mulone, V. Platform chemicals recovery from spent coffee grounds aqueous-phase pyrolysis oil. Renew. Energy 2024, 220, 119630. [Google Scholar] [CrossRef]
- Abnisa, F.; Wan Daud, W.M.A.; Arami-Niya, A.; Ali, B.S.; Sahu, J.N. Recovery of Liquid Fuel from the Aqueous Phase of Pyrolysis Oil Using Catalytic Conversion. Energ Fuel 2014, 28, 3074–3085. [Google Scholar] [CrossRef]
- Loyao, A.S.; Villasica, S.L.G.; Dela Peña, P.L.L.; Go, A.W. Extraction of lipids from spent coffee grounds with non-polar renewable solvents as alternative. Ind. Crops Prod. 2018, 119, 152–161. [Google Scholar] [CrossRef]
- Atabani, A.E.; Ali, I.; Naqvi, S.R.; Badruddin, I.A.; Aslam, M.; Mahmoud, E.; Almomani, F.; Juchelková, D.; Atelge, M.R.; Khan, T.M.Y. A state-of-the-art review on spent coffee ground (SCG) pyrolysis for future biorefinery. Chemosphere 2022, 286, 131730. [Google Scholar] [CrossRef]
- Primaz, C.T.; Schena, T.; Lazzari, E.; Caramão, E.B.; Jacques, R.A. Influence of the temperature in the yield and composition of the bio-oil from the pyrolysis of spent coffee grounds: Characterization by comprehensive two dimensional gas chromatography. Fuel 2018, 232, 572–580. [Google Scholar] [CrossRef]
- Lazzari, E.; Schena, T.; Marcelo, M.C.A.; Primaz, C.T.; Silva, A.N.; Ferrão, M.F.; Bjerk, T.; Caramão, E.B. Classification of biomass through their pyrolytic bio-oil composition using FTIR and PCA analysis. Ind. Crops Prod. 2018, 111, 856–864. [Google Scholar] [CrossRef]
- Kokosa, J.M. Selecting an extraction solvent for a greener liquid phase microextraction (LPME) mode-based analytical method. TrAC Trends Anal. Chem. 2019, 118, 238–247. [Google Scholar] [CrossRef]
Disclaimer/Publisher’s Note: The statements, opinions and data contained in all publications are solely those of the individual author(s) and contributor(s) and not of MDPI and/or the editor(s). MDPI and/or the editor(s) disclaim responsibility for any injury to people or property resulting from any ideas, methods, instructions or products referred to in the content. |
© 2024 by the authors. Licensee MDPI, Basel, Switzerland. This article is an open access article distributed under the terms and conditions of the Creative Commons Attribution (CC BY) license (https://creativecommons.org/licenses/by/4.0/).