Abstract
Promoting sustainable agriculture is one of the challenges of our century. Thus, this research aimed to estimate the environmental sustainability of hazelnut cultivation in the Campania region (Southern Italy), both in quantitative and economic terms, by estimating the social cost of the pollution. The evaluation of the recovery of pruning residues and shells, from a circular economy perspective, represents the novelty of this paper. The lifecycle assessment methodology was used to analyze and compare twenty-one hazelnut systems that are very different from each other. The results showed that the impacts per kg of unshelled hazelnuts varied among the systems, depending on the impact category considered, and with respect to climate change, the lowest value was 0.32 kg CO2 eq (in BIO4 system), while the highest was 2.48 kg CO2 eq (in INT8 system). Moreover, organic management was more environmentally friendly for almost all impact categories, and ordinary cultivation techniques were the most impactful. Cultivation on embankments or terraced soils had a greater impact when compared to flat soils, especially due to the greater fuel consumption during farm–field transport. Emergency irrigation did not cause an increase in impact if the overall management was sustainable. In economic terms, the total cost of pollution of the agricultural phase varied from a minimum of EUR 0.11 per kg of hazelnuts to a maximum of EUR 0.70. Post-harvest operations up to vacuum packaging did not make any systems more impactful than others since their agricultural management was more sustainable than many others. In accordance with the objectives of the European Green Deal, the recovery of pruning material and shells on farms has proven to be very important for reducing impacts, especially if they are used to replace methane and diesel oil, hence the importance of pursuing this research to make hazelnut cultivation ever more sustainable.
1. Introduction
In Italy, hazelnut production occurs on about 94,500 hectares [1], for a total value of EUR 260 million [2]. Campania is the Italian region with the third-largest hazelnut area (22,120 ha) and the highest production (24,000 tons) [1]. In addition, Campania is the oldest site of hazelnut cultivation in the entire Mediterranean basin [3]; its cultivation has been attested to since at least the 4th–5th century B.C., not so much from historical sources but from archaeological documentation [4]. The first certain evidence of specialized hazelnut cultivation in Italy was found in some contracts between settlers and owners dating back to the late Middle Ages (800–900 A.D.), in which hazelnut groves in Campania are widely spoken of. In other documents dating back to the Norman domination in Campania (around 1030 A.D.), rules for planting hazelnut trees are reported, such as indications for plant spacing and methods of propagation [5]. In particular, the territory within the province of Avellino is the oldest and most important hazelnut cultivation area in Italy. The hazelnut farms in Campania continue to be mainly managed directly by the grower, with a largely family-based workforce, and this situation still allows for cultivation, even in areas such as the Avellino and Salerno provinces, where agricultural operations (especially harvesting) are poorly mechanizable and the remuneration of the work is very low [6]. At the same time, the farms themselves suffer from insufficient generational renewal, mainly due to the low revenues achievable with hazelnut production. However, alongside direct-cultivator farms, there are others with the prevalent employment of workers [7].
In this panorama, ensuring the sustainable management of natural resources is increasingly becoming a strategic priority to safeguard quality production. The integration of economic development with environmental management led to the contemporary concept of sustainability, namely, that found in “The Brundtland Report” [8]. In particular, the connection among the environmental, social, and economic spheres occurred in 1983, when the United Nations founded the World Commission on Environment and Development. Consequently, society (including farms) must decide how to manage the current stock of total available capital (even the natural one) in order to ensure economic activities and opportunities and well-being for future generations, as well [9,10].
In the coming decades, population growth and the reduction in agricultural production caused by the loss of agricultural land and climate change will lead to a continuous increase in the demand for food and energy. On the other hand, conventional agriculture has led to an increasing specialization of agroecosystems, with the consequent loss of biodiversity and traditional genetic resources, as well as a greater dependence on “external” factors, such as fertilizers, plant protection products, and energy from fossil fuels, with consequent damage to the balance of soil, water, and biodiversity. The challenge we face today, in order to feed a constantly growing population, is to promote sustainable agriculture that can play a role in protecting and enhancing the environment [11].
At the same time, one of the problems that farms increasingly have to face is the disposal of growing volumes of vegetable biomass (pruning residues, shells, and waste resulting from the production and transformation processes of horticultural and tree crops). The growing attention of institutions and consumers to environmental issues and the application of existing environmental legislation [12] require the implementation of sustainable solutions for the management of these agricultural byproducts. With reference to pruning residues, the most common practice is to collect and transport them out of the field to be subsequently piled up and burned [13]. However, this practice involves, on the one hand, the loss of organic substance and nutrients which, on the contrary, from a circular economy perspective, could return to the soil by means of simple on-site shredding, and on the other hand, the deterioration of air quality due to the emission of polluting substances (CO2, CH4, N2O, fine dust) and high quantities of fumes that are difficult to disperse with negative repercussions on human health. As for hazelnut shells, they are often considered waste and in the best of cases are disposed of in the organic fraction of solid urban waste. On the contrary, they can be transformed into a valuable resource for generating efficient and sustainable energy [14]. In fact, the calorific value of the shells, obtained from their combustion, is very high and allows the production of heat for domestic heating or industry through electricity or pellets [15]. Farmers are therefore called upon to make an effort to change the management of their crop residues, adopting less impactful practices with high benefits for soil, air, and human health.
Climate change, the degradation of ecosystems, and the overexploitation of natural resources require a drastic and urgent reduction in the pressure of human activities on the environment. Impact estimation methodologies, such as the life cycle assessment (LCA), are valid tools for quantifying environmental sustainability and knowing how to improve the environmental performance of agricultural production [16,17] and waste disposal [18]. Together with voluntary certifications, such as the Environmental Product Declaration (EPD) [19], LCA represents a tool for increasing the competitiveness of the Italian production system in national and international markets, given the growing demand for products with high environmental qualifications [20]. Thus, to identify more sustainable cultivation practices and methods of disposing of agricultural residues, the assessment of the environmental impacts of hazelnut production is essential, as it is for other agri-food production. To this end, to date, several studies have assessed the environmental impact of agricultural crops using the LCA methodology, as reported in Temizyurek-Arslan [21] and Maffia et al. [22], but only a few studies have estimated the environmental impacts of hazelnut production. Indeed, the latter have mainly been performed in Iran [23,24,25] and Italy [26,27,28], as well as one in Spain [29] and one in Turkey [21]. In particular, Nabavi-Pelesaraei et al. [23] investigated the influences of energy inputs and energy forms on output levels and evaluated CO2 emissions for hazelnut production in the Guilan province of Iran; Sabzevari et al. [25] identified the main environmental burdens and suggested some environmental improvement potentials for hazelnut production by applying the LCA method; and Nayeri et al. [24] applied this methodology to hazelnut production in rain-fed farming systems in a forest north of Iran. In Italy, Volpe [26] calculated the carbon footprint of the production of nuts; Coppola et al. [27] evaluated the environmental impact of conventional and organic farming systems of hazelnut production in Viterbo Province; and Biagetti et al. [28], in the same province, assessed the environmental sustainability of hazelnut production on a farm scale and at a territorial level through the ecological footprint methodology. In Türkiye, Temizyurek-Arslan [21] evaluated the environmental impacts, energy use efficiency, and economic performance of hazelnut cultivation in Ordu Province. Finally, Aguilera et al. [29] analyzed the greenhouse gas contribution of 42 pairs of organic and conventional perennial cropping systems, including, among others, tree nuts.
To the best of our knowledge, no author has estimated the environmental impacts of hazelnut production by focusing attention on the recovery of pruning residues and shells and, in particular, how the impacts vary according to the different management systems of these crop residues. Furthermore, no author has ever expressed the impact of hazelnut cultivation through the social cost, i.e., the loss of economic welfare that occurs when one additional kilogram of the pollutant finds its way into the environment [30]. Thus, in order to increase scientific contributions in hazelnut impact assessment, the present research aimed to estimate the environmental sustainability of hazelnut cultivation in the Campania region (Southern Italy), as well as in terms of the social cost of pollution. The novelty of this study was the estimation of impacts, both in quantitative and economic terms, considering the effect of recovering pruning residues and shells.
2. Materials and Methods
The LCA methodology was used to assess the environmental impacts of 21 hazelnut systems according to ISO 14040-44 [31,32]. This methodology was chosen to perform a complete and robust environmental analysis, as the LCA considers the environmental consequences caused by a product or a service on multiple environmental effects. Furthermore, this method was chosen because it not only allows us to quantify the environmental impact of a product but also because it is a strategic tool to direct farmers toward more environmentally sustainable production, processes, and business models.
After describing the analyzed systems, the following four LCA standardized phases were considered: goal and scope definition; life cycle inventory; life cycle impact assessment; and interpretation. Furthermore, we have also added a sensitivity analysis.
2.1. System Description
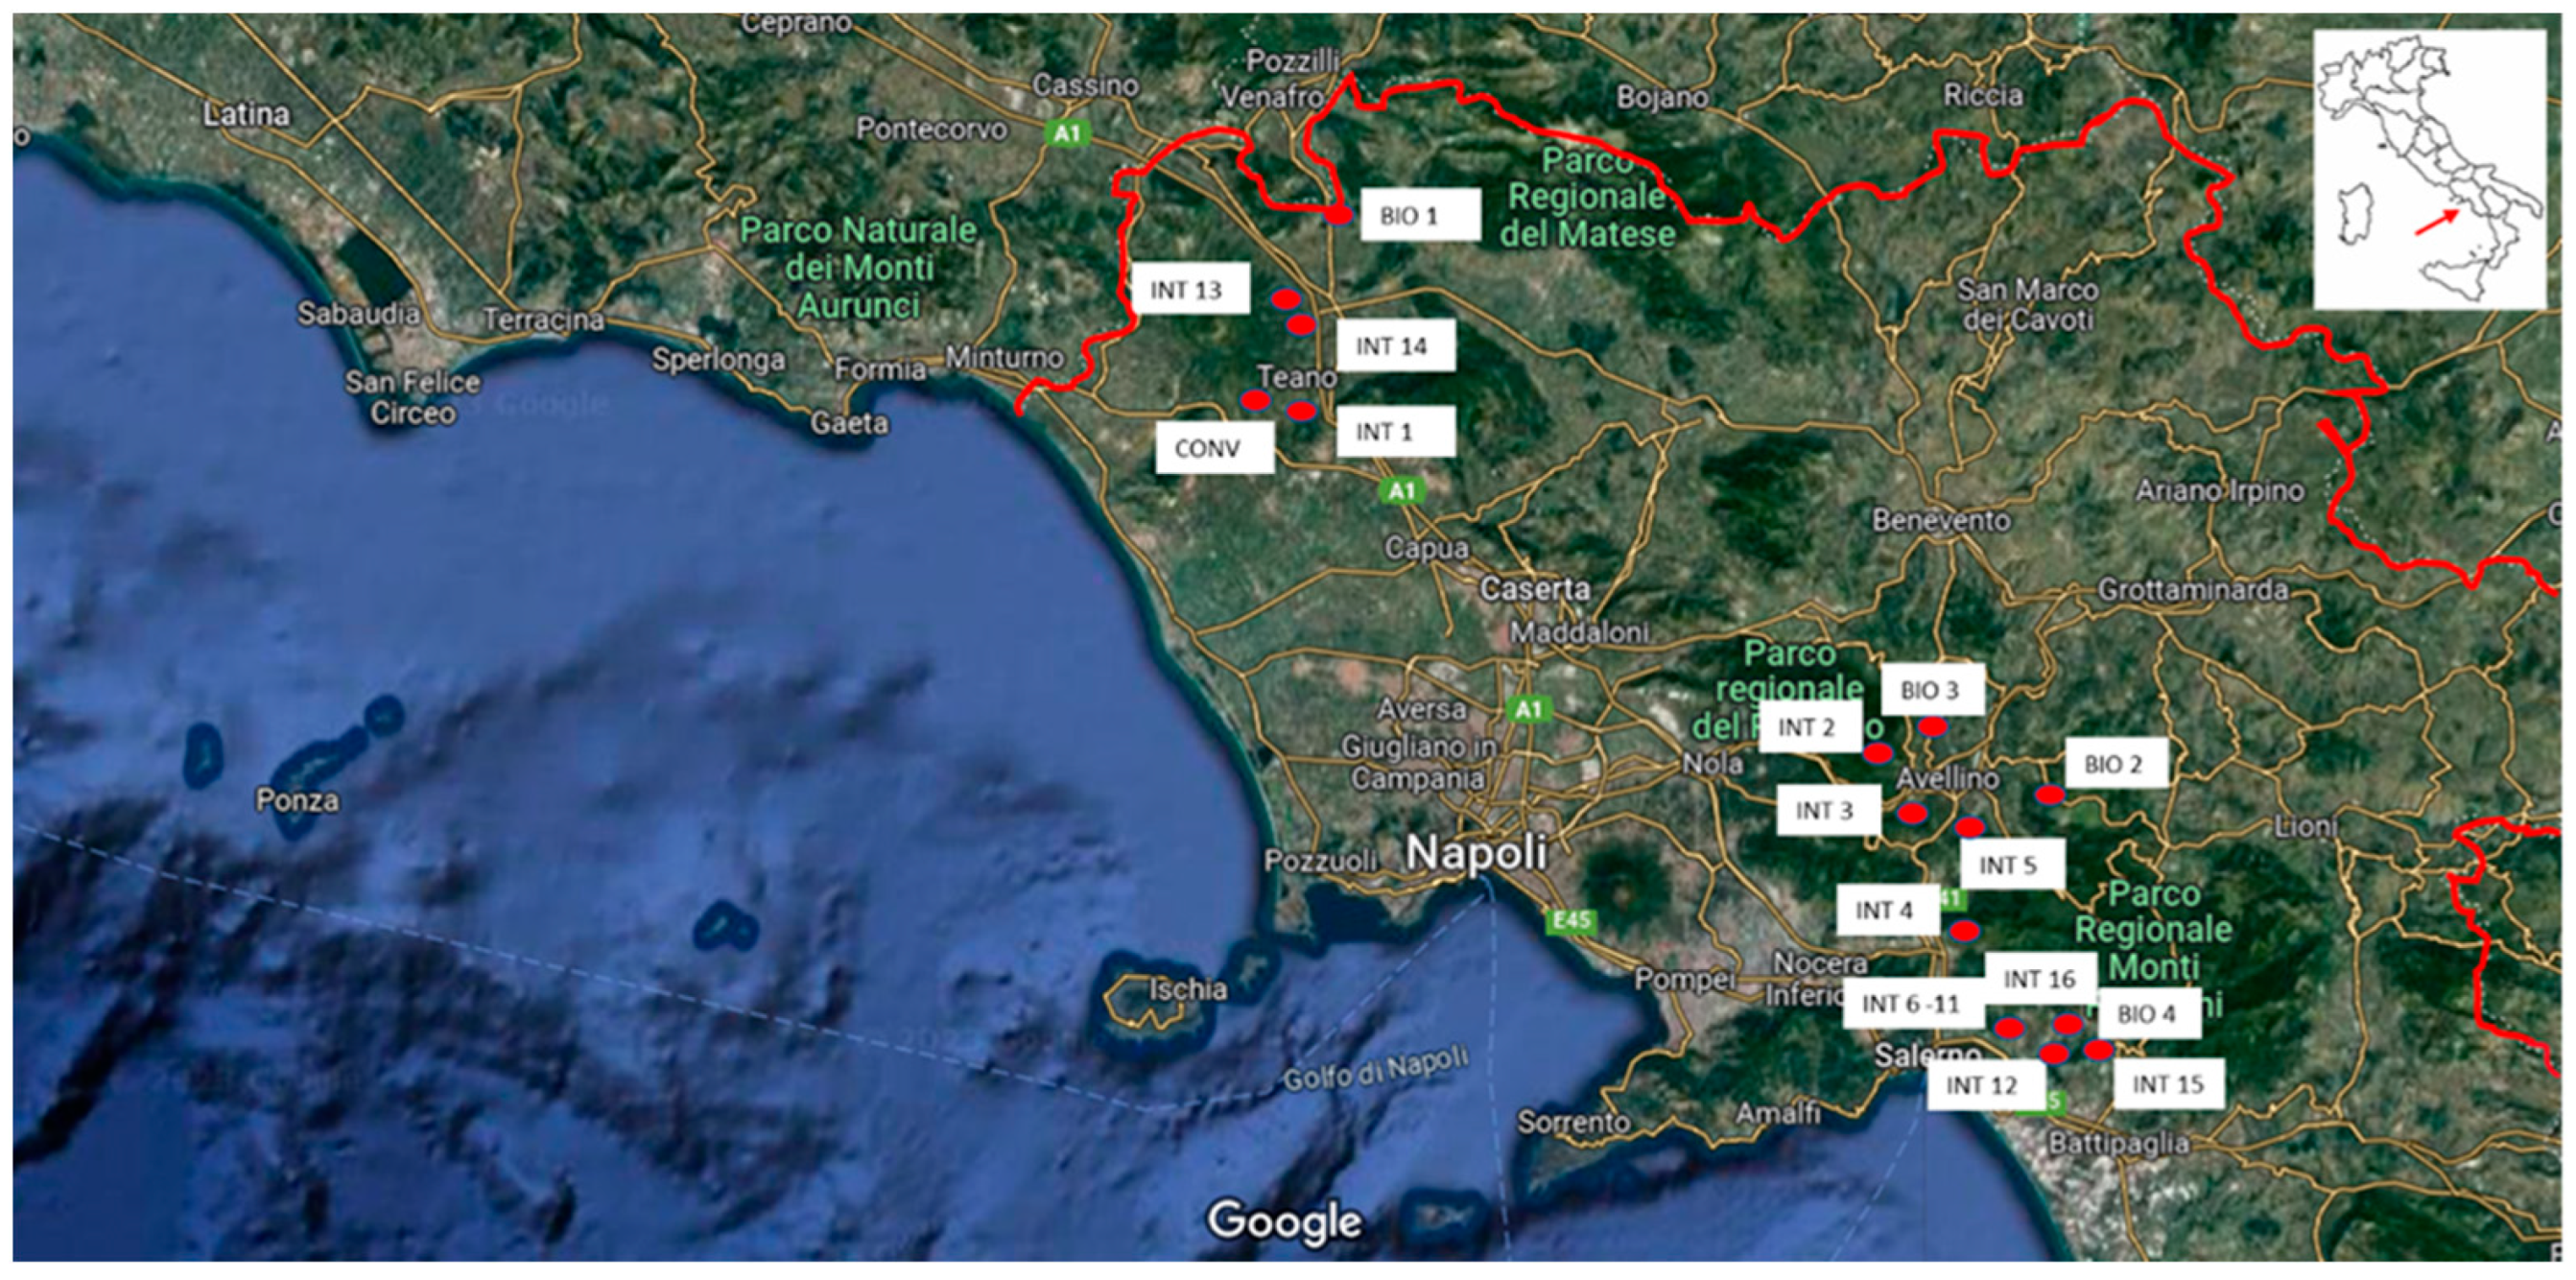
This study was performed in the Avellino, Caserta, and Salerno provinces (Campania region) (Figure 1).
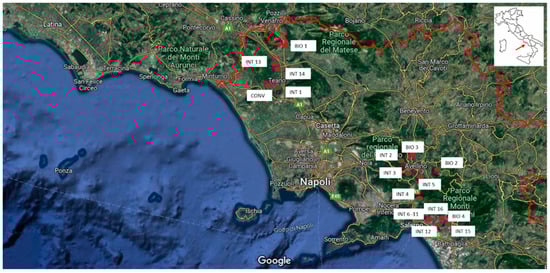
Figure 1.
Study area (Avellino, Caserta, and Salerno provinces, Campania region, Southern Italy) and position of the hazelnut orchard systems under study.
Data were collected from 14 face-to-face interviews with hazelnut growers (some hazelnut systems fell on the same farm, i.e., BIO4 and INT12, from INT6 to INT11, INT15, and INT16) over the last production year (2023) by using a specific collection sheet, consulting growers’ field notebooks and visiting their farms. The 21 analyzed systems were selected without any statistical criteria. The only criteria adopted were the location in the Campania region, one of the regions in which most hazelnuts are cultivated and produced in Italy; economical dimension of the farm (small- and medium-sized farms) [33]; and willingness of the farmers to collaborate in carrying out this study.
The main features of the studied hazelnut systems are reported in Table 1, Table 2, Table 3 and Table 4. Specifically, Table 1 shows that the most cultivated cultivars were Mortarella (M), Tonda di Giffoni (TG), Tonda Gentile Romana (TGR), and San Giovanni (SG); Tonda Bianca (TB) and Tonda Rossa (TR) were also present, albeit in smaller percentages. In thirteen systems, only one type of cultivar was cultivated, while in the others, multiple cultivars were grown together on the same field (a very widespread practice in the Campania region). The age of the trees was variable, as was the training method and planting density. The average hazelnut yield per hectare, which was highly variable between systems, was influenced by several factors, such as the cultivar, age of the trees, and cultivation system (Table 1). It is well known that organic systems have lower production [27].

Table 1.
The main features of the systems analyzed. Part 1. (BIO: organic systems; INT: integrated systems; CONV: system managed according to the ordinary cultivation techniques. TG: Tonda di Giffoni; TB: Tonda Bianca; TR: Tonda Rossa; M: Mortarella; SG: San Giovanni; TGR: Tonda Gentile Romana).
Table 2.
The main features of the systems analyzed. Part 2. (BIO: organic systems; INT: integrated systems; CONV: system managed according to the ordinary cultivation techniques).
Table 3.
Specifications of the cultivation techniques implemented in the analyzed systems. (BIO: organic systems; INT: integrated systems; CONV: system managed according to the ordinary cultivation techniques).
Table 4.
The post-harvest operations implemented in the analyzed systems. (BIO: organic systems; INT: integrated systems; CONV: system managed according to the ordinary cultivation techniques).
Most of the systems (n = 16) were on sandy, loamy soils on terrain that was almost flat or slightly sloping. It was important for the objective of this study to find hazelnut groves grown on terraces (INT8 and INT9) and embankments (INT2 and INT16) of notable hydrogeological value (Table 2) in order to make comparisons with systems grown on flat land. Referring to the cultivation system, the analyzed systems were managed according to the following different cultivation techniques: four were organic [34] (BIO1–BIO4), sixteen were integrated [35] (INT1–INT16), and only one was managed according to the ordinary cultivation techniques (CONV) (Table 2). The pruning method in all the systems analyzed was the same, namely, manual, yet the management of pruning residues was different; in thirteen cases, they were shredded in the field to increase soil organic matter, in seven, they were removed from the field and burned (in BIO2 and from INT13 to INT16, the small branches were burned in the open air, and those that were larger were used as firewood in fireplaces, while in INT2 and INT3, pruning material was burned in biomass plants), and only in one case were they burned in the field (BIO4) (Table 2).
Referring to the agronomic techniques used, only three systems were irrigated (Table 2). In seventeen systems, fertilization was annual and mineral, while in BIO2 and BIO4, it was annual and natural; in BIO1 and BIO3, green manure was practiced. In all cases, weed control occurred through shredding and, in some cases, also with the use of pesticides (glyphosate). Disease control was performed according to the type of cultivation system, and therefore, the use of synthetic products characterized only the integrated and conventional systems. Harrowing and milling were the most frequent soil tillage, but in some systems, tillage was totally absent, especially in terraced or embanked ones (Table 3). Sucker removal was almost always manual, except in one-farm hosting systems INT6 to INT11, while harvesting was always mechanized, except in BIO1, BIO4, and INT12 (Table 3).
Regarding the post-harvest operations, only three analyzed systems sold the hazelnuts as they were immediately after harvesting; four sold them both as they were and after cleaning and drying; nine sold them after having also carried out calibration; two also shelled them; and four also packaged them (Table 4). When present, in twelve systems, the cleaning was electric, in four, it was manual, and in one case, it was mechanical with the use of a diesel-powered machine. In a few systems, the drying was natural in the sun, otherwise, it was electric or mechanical. Calibration and shelling, when present, were always electric (Table 4).
Packaging was carried out only in two farms hosting BIO4 and INT12 and INT15 and INT16 systems, respectively. The packaging methods were different; in BIO4 and INT12, 1 kg paper bags were used for the in-shell hazelnuts, while vacuum-packed plastic bags of 0.150 kg, 0.250 kg, and 1 kg were adopted for the shelled fruit, and in INT15 and INT16, 1 kg recyclable plastic nets were used.
2.2. Goal and Scope Definition
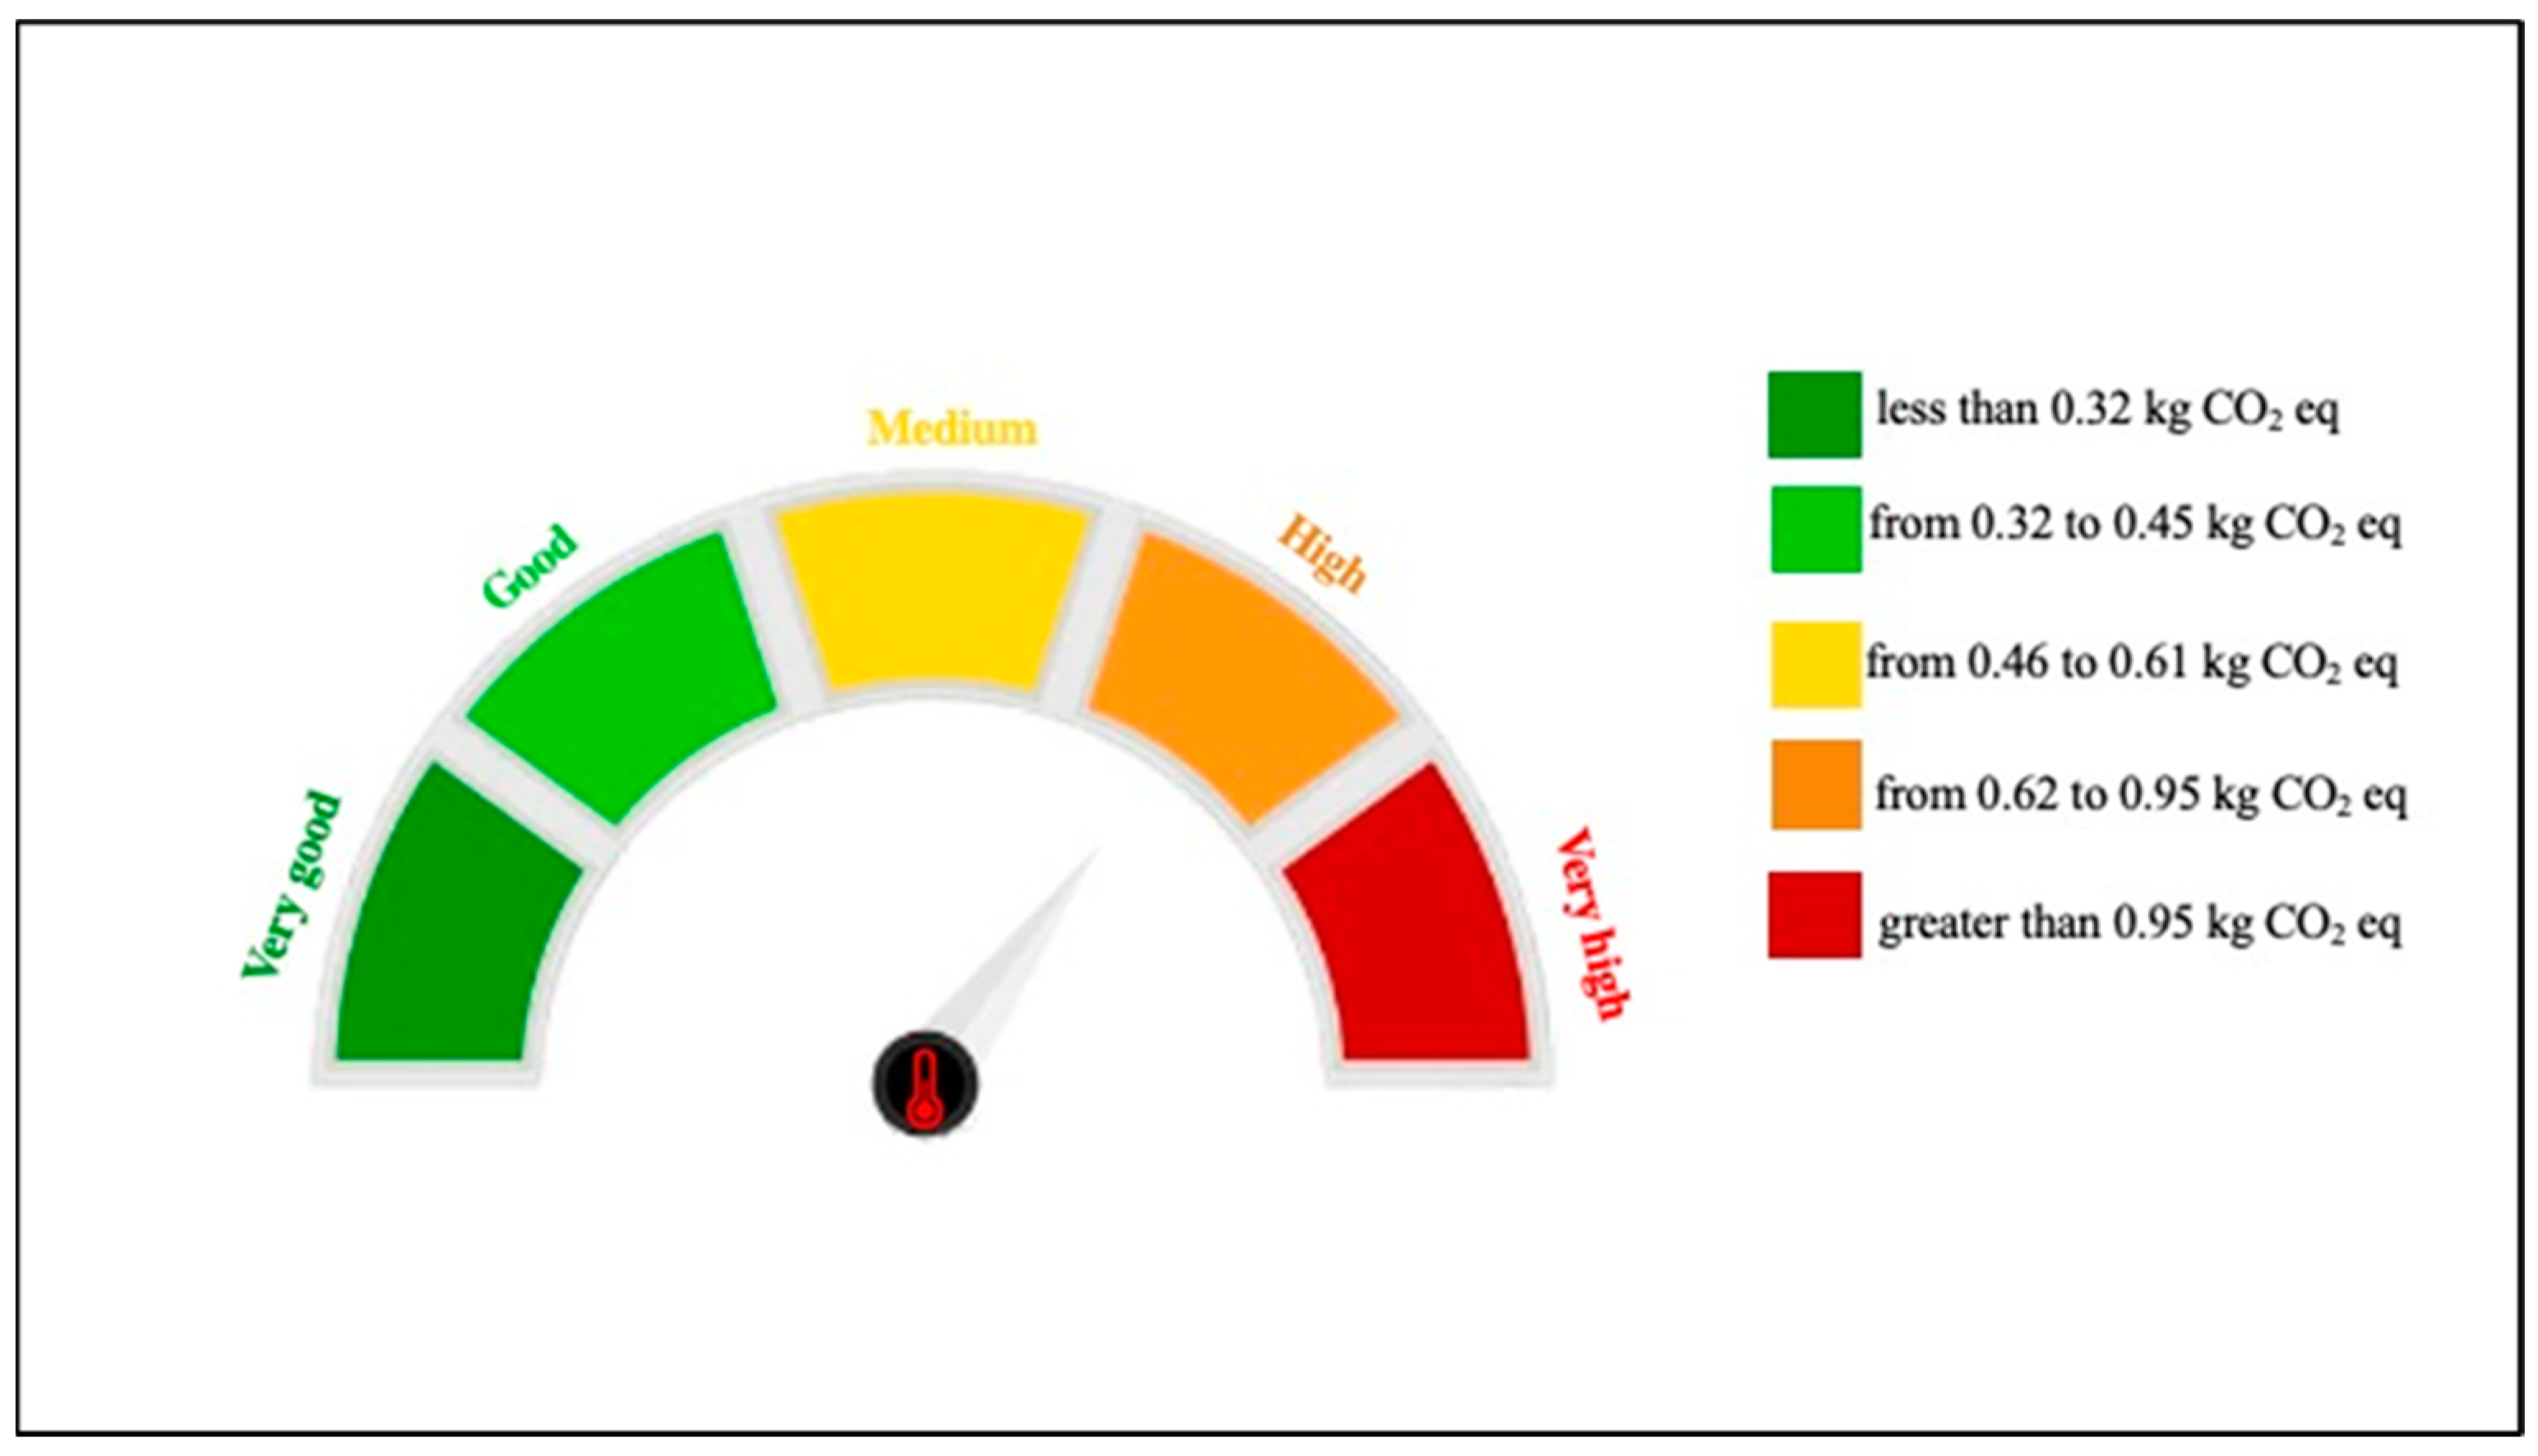
The goal of the present research was to evaluate and compare the environmental impacts of 21 different hazelnut production systems growing in the Campania region. The purpose of this study was to identify the most impactful production phase for each analyzed system and, referring to the agriculture phase, benchmark values of climate change to classify the systems into appropriate comparison/sustainability classes. To this end, the 21 systems were sorted in ascending order based on CO2 eq emissions and divided into four equal parts on the basis of the three position indices called quantiles (25%, 50%, 75%) [36].
The results obtained could be useful, above all, for farmers, farmer associations, and technicians to identify the best hazelnut cultivation techniques and post-harvest management and reduce emissions to make this crop as environmentally sustainable as possible.
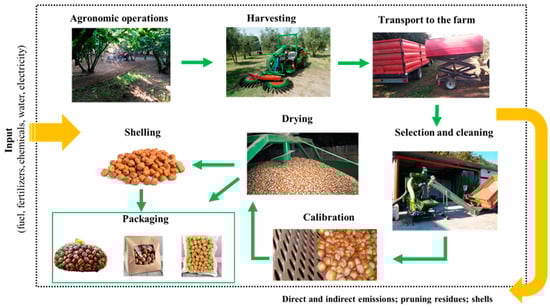
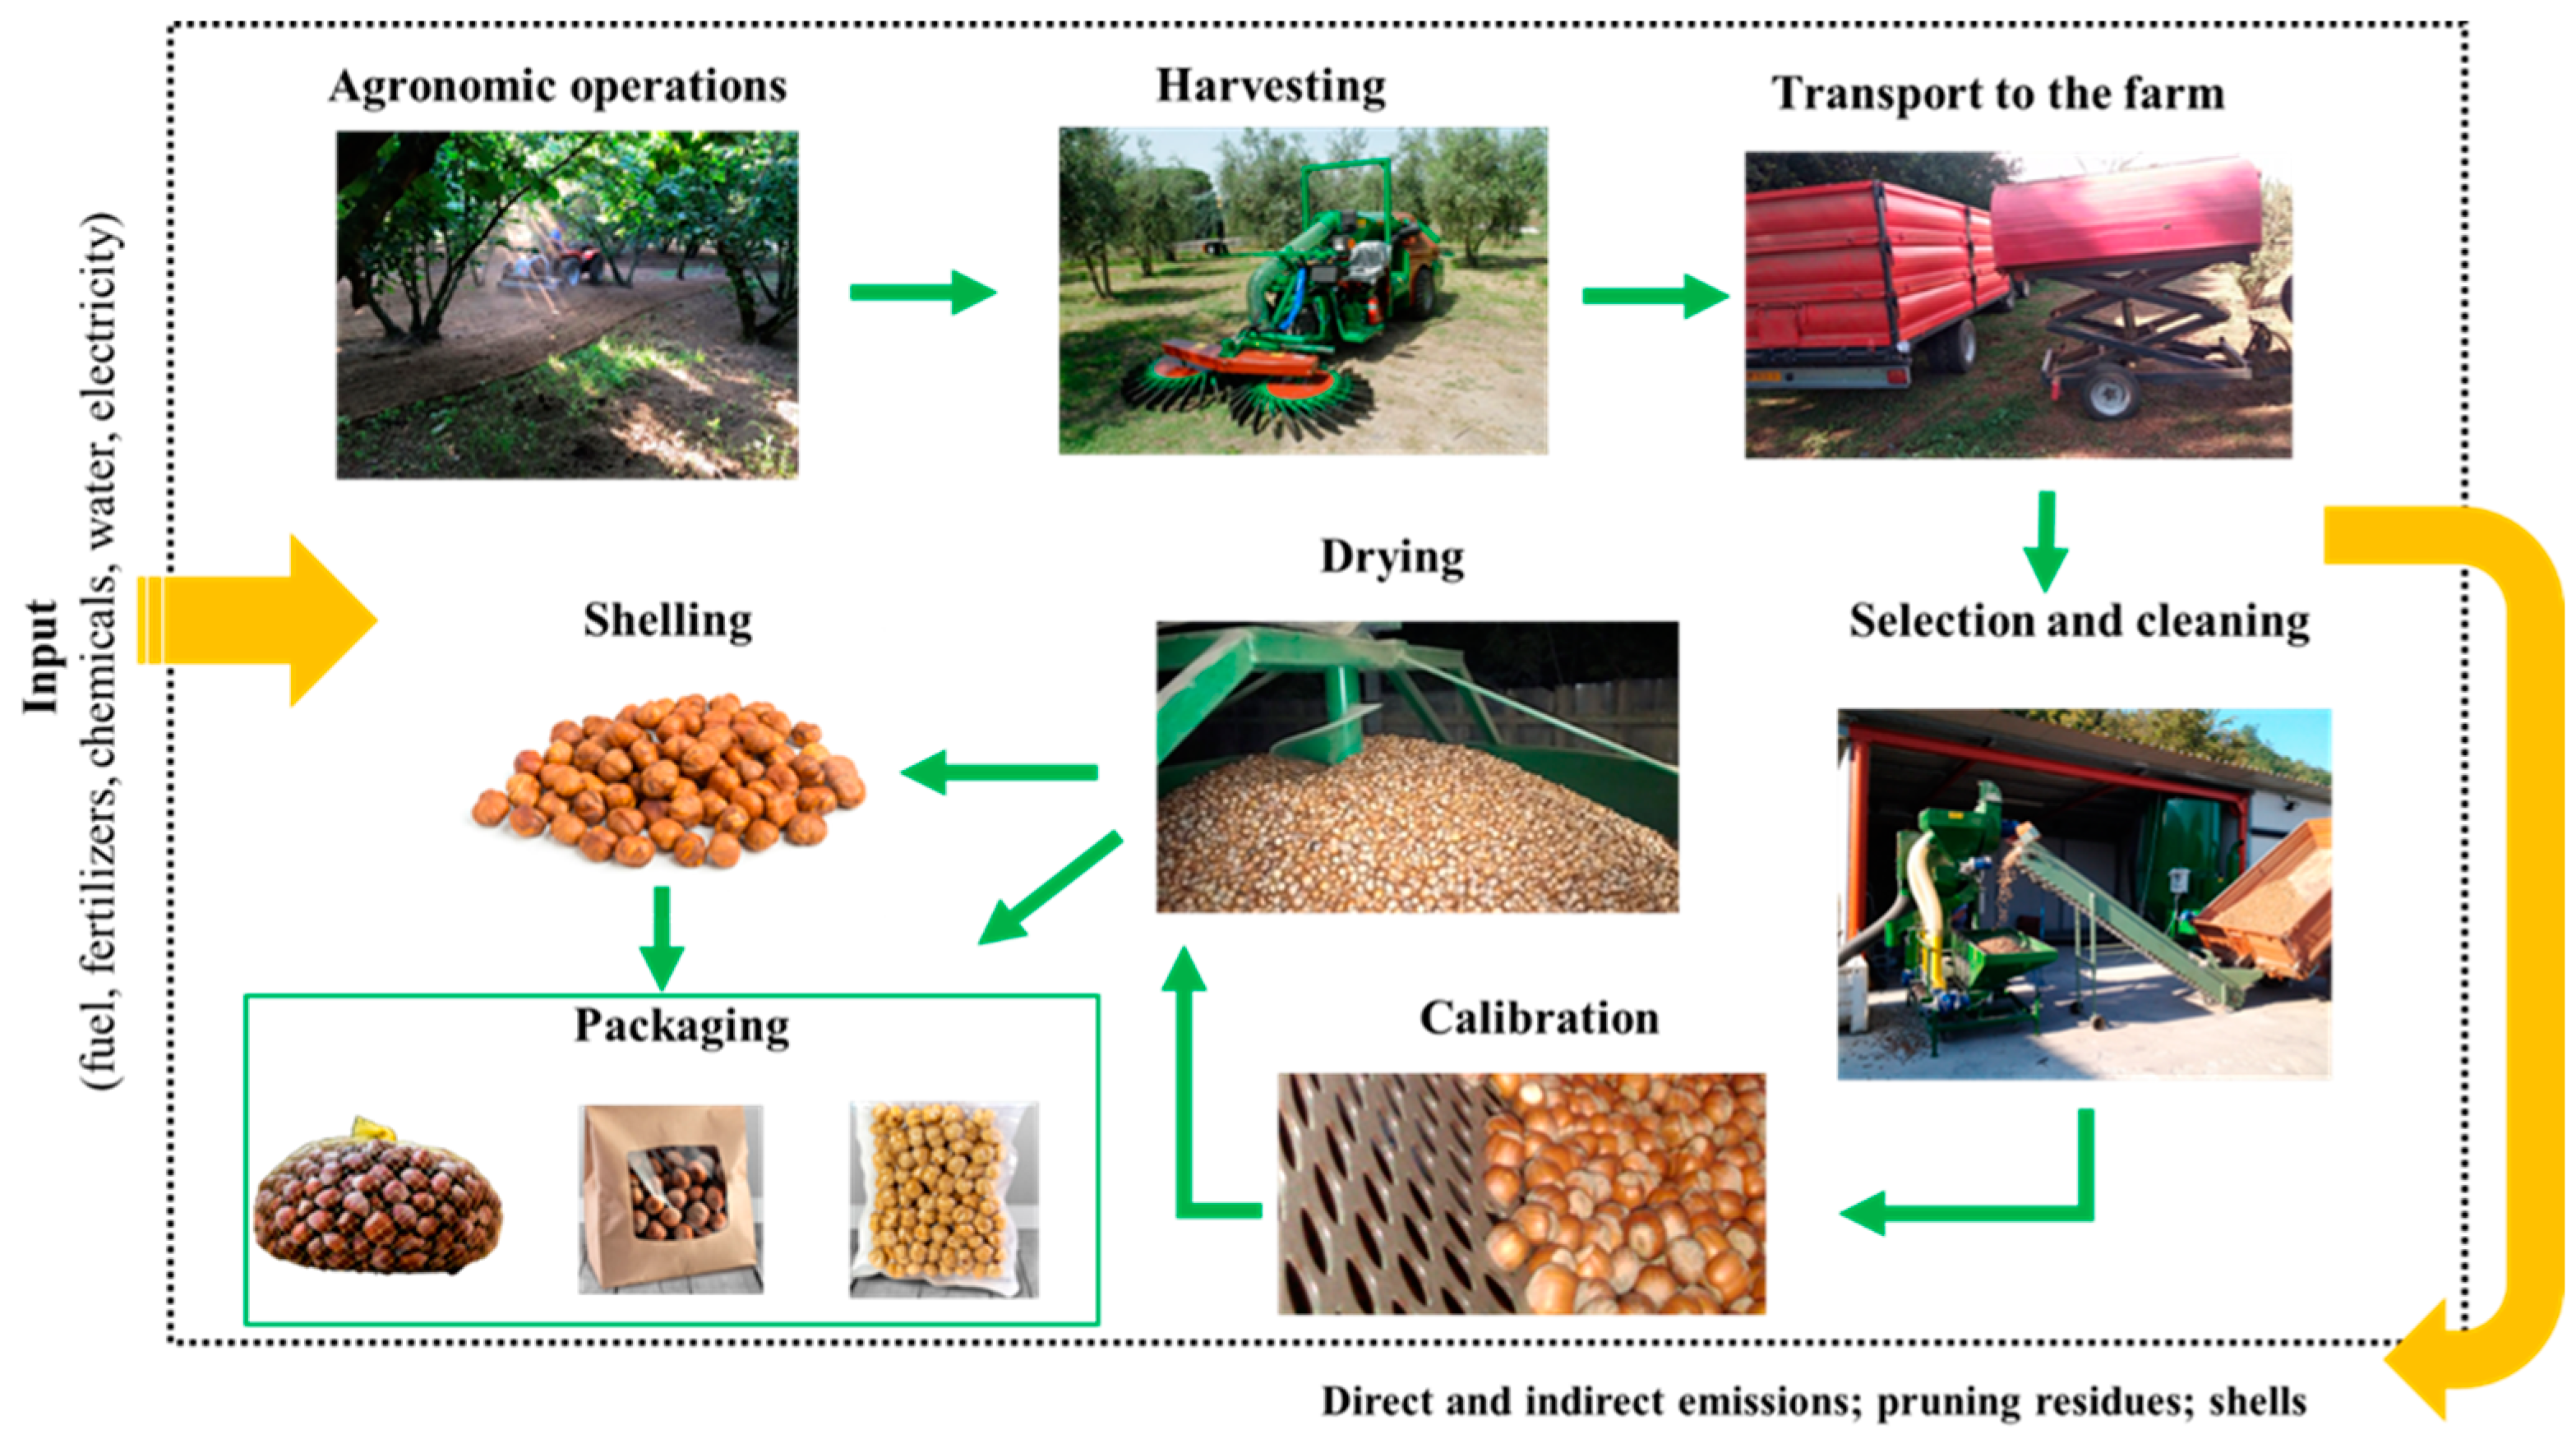
For the development of the assessment, the reference period of the analysis was set to the end of one production cycle, and both the functional unit (FU) and the system boundaries were defined. The FU in LCA studies is the reference according to which all inputs and outputs are processed to allow for comparison between systems or alternatives [32]. The function of the hazelnut systems under study was the production of hazelnuts. Therefore, the basis for the comparison of the different systems, named the FU of the service delivered, was the production of one kilo of unshelled hazelnuts, as also reported in other studies [21,27,28,29]. To better compare the analyzed systems, one hectare of cultivated land was also used as FU. Consequently, to meet the aim of the present research, the system boundaries went from the extraction of raw materials to the farm gate. Specifically, it was a cradle-to-farm gate study that considered, depending on the system analyzed, the agricultural phase, the post-harvest operations, and when present, the subsequent product packaging activities carried out within the farms. Consequently, the analysis considered the different agronomic operations of hazelnut cultivation (soil tillage, mechanized suckering, fertilization, weed control, disease control, irrigation); harvesting and transport to the farm; and when present, cleaning, drying, calibration, storage, and packaging (Figure 2).
2.3. Lifecycle Inventory (LCI)
Data useful for the analysis and associated with the studied systems (quantities of fuel, fertilizers, chemicals, water, energy, and other items) were collected in situ interviewing farmers and are reported in Table 5, Table 6, Table 7 and Table 8. From these, it is possible to note that regarding fertilization, only one system used manure (BIO3), three systems used organic pellets (BIO4, INT15, and INT16), and all the others used mineral fertilizers in quantities varying from 250 kg/hectare to 800 kg/hectare. The most used chemical products (fungicides, herbicides, and insecticides) were the sulfur-based ones, glyphosate, and those containing lambda-cyhalothrin. The systems that used multiple chemical products at the same time were INT1 and CONV. The systems with a greater use of manpower were BIO2 and INT3, while the systems with a greater use of machines were BIO3, INT2, and INT8. Water use was present only in irrigated systems, namely, INT6, INT7, and INT13. On the contrary, electricity consumption was present only in systems with post-harvest operations performed electrically (BIO4, INT12, and INT13) (Table 5, Table 6, Table 7 and Table 8).
Table 5.
Farm inputs (fertilizers) used in the analyzed systems. Values in Kg ha−1 (BIO: organic systems; INT: integrated systems; CONV: system managed according to the ordinary cultivation techniques).
Table 6.
Farm inputs (chemicals) used in the analyzed systems. Values in Kg ha−1. (BIO: organic systems; INT: integrated systems; CONV: system managed according to the ordinary cultivation techniques).
Table 7.
Farm inputs (chemicals) used in the analyzed systems. Values in L ha−1. (BIO: organic systems; INT: integrated systems; CONV: system managed according to the ordinary cultivation techniques).
Table 8.
Farm inputs (other items) used in the analyzed systems. (BIO: organic systems; INT: integrated systems; CONV: system managed according to the ordinary cultivation techniques).
For each operation, direct and indirect emissions were calculated considering the active ingredient of each product used. Specifically, direct emissions from fuel were taken from SimaPro’s LCI databases (Ecoinvent 3; Agri-Footprint 5), while those from nitrogen fertilizers (emissions of ammonia and dinitrogen monoxide), as in other studies [20,22,37,38], were accounted for considering the emission factors proposed by Bouwman [39], Brentrup et al. [40], and IPCC [41]. In particular, in the present study, an entire mineral balance was not undertaken because of the difficulty of deriving exact rates of N released to the air and water, since emission rates can greatly vary depending on soil type, climatic conditions, and agricultural management practices. Referring to synthetic pesticides, direct emissions were estimated considering the amount of each active ingredient and following the methodology suggested by Hauschild [42].
Secondary data, which are useful for estimating indirect emissions, were extrapolated from international databases of scientific importance and reliability, like the Ecoinvent v.3 [43]. In particular, this was performed for the production of diesel, fertilizers, pesticides, electricity, water, and the different types of packaging used in the investigated systems, including the accounting of the resulting emissions, as specified in Pergol et al. [37].
As confirmed by Mohamad et al. [44], LCA databases lack agricultural input information, particularly the complete production process of some fertilizers and pesticides. Thus, some simplifications have been made; in the calculation of the emissions of determinate mineral fertilizers, the quantities relating to the individual active ingredients were used with reference to an equivalent synthetic fertilizer since the specific product distributed was not present in SimaPro. For the same reason, in systems using organic fertilizers, the item “manure” was used; for pelletized fertilizers, the environmental impacts of product pelletization were not accounted for due to the lack of a consolidated technical coefficient of the characterization of emissions [45].
2.4. Life Cycle Impact Assessment
SimaPro 9 software was used to perform the impact assessment according to the environmental prices method developed by CE Delft [30], expressing environmental impacts, depending on the impact category, in kg of substances emitted, m2, and m3, but also in monetary units. This method was chosen because it is based on midpoint-level environmental prices (European ones), and therefore, the values of the environmental themes were used as a weighting set (as opposed to implementing the factors for individual substances). The characterization step was based on the ReCiPe (2008) midpoint hierarchic perspective [46], with the exception of climate change, based on the IPCC 2013 values for a 100-year timeframe [47]. The following impact categories were considered: climate change (CC); ozone depletion (OD); terrestrial acidification (TA); freshwater eutrophication (FEu); marine eutrophication (MEu); human toxicity (HT); photochemical oxidant formation (POF); particulate matter formation (PMF); terrestrial ecotoxicity (TEc); freshwater ecotoxicity (FEc); marine ecotoxicity (MEc); ionizing radiation (IR); agricultural land occupation (ALO); urban land occupation (ULO); natural land transformation (NLT); water depletion (WD); metal depletion (MD); and fossil depletion (FD).
The environmental prices method, after assessing the environmental impacts, expressed the social cost of pollution in EUR per kilogram of pollutant. As reported by de Bruyn et al. [30], by assigning prices to the different pollutants, this method estimated the cost of environmental pollution. The environmental prices were not available for some impact categories (natural land transformation, water, metal, and fossil depletion), so they were not considered in this final step.
2.5. Sensitivity Analysis
The sensitivity analysis was carried out to investigate the effects in terms of an increase/decrease in the impacts of different pruning residue management alternatives and various shell disposal methods. Regarding pruning residues, the following alternatives were tested: (1) shredding in the field; (2) field burning; and (3) collection, removal, and use as firewood in fireplaces/stoves, in 50 kW boilers, and in a 1 MW plant. Referring to the shells, which are normally disposed of as the organic fraction of solid urban waste, the possibility of their use to fuel fireplaces/stoves, 50 kW boilers, and 1 MW plants was evaluated, as well as their use as fuel in the post-harvest operations. For both types of residues, the CO2 eq emissions of the different alternatives were analyzed, and the avoided emissions in terms of pellet, methane, and diesel equivalents saved were calculated using the emission coefficients present in Andreae [48,49] and Ronchini [50].
3. Results
3.1. The Impacts of the Agricultural Phase
Table 9 reports the impacts per kg of unshelled hazelnuts of the different systems relating to the agricultural phase. Environmental impacts varied among the systems, depending on the impact category considered. Indeed, referring to climate change, the lowest value was found in BIO4 (0.32 kg CO2 eq), while the highest was found in INT8 (2.48 kg CO2 eq), 46% of which was due to fertilization. The lowest human toxicity value was recorded in INT14 (0.06 kg 1,4-DB eq), while the highest (0.49 kg 1,4-DB eq), once again, was in INT8 and mainly due to fertilization. For freshwater ecotoxicity, there were several systems in which low values were recorded (0.001 kg 1,4-DB eq), such as BIO2, BIO3, BIO4, INT2, INT3, INT4, INT5, INT12, INT14, INT15, and INT16, while the highest value was recorded in the conventional system (0.07 kg 1,4-DB eq). The latter was almost 80% due to the disease control operation, and a similar value was also found in reference to marine ecotoxicity. With respect to ionizing radiation, the lowest value (0.01 kBq U235 eq) was found in INT4, INT15, and INT16, while the highest (0.11 kBq U235 eq) was found in INT8 and INT9. The lowest value of agricultural land occupation was recorded in INT16 (0.02 m2 yr annual crop land−1), while the highest was recorded in BIO1 (0.37 m2 yr annual crop land−1), essentially due to operations to manage grass cover. At the same time, the lowest value of urban land occupation (0.01 m2 yr annual land−1) was recorded in INT4, INT12, INT15, and INT16, while the highest (0.12 m2 yr annual land−1) was recorded in INT8 and INT9. As is obvious, the water depletion impacts were especially present in the irrigated systems, among which INT13 showed the highest value (0.08 m3) due to greater water consumption. Finally, the highest values of metal and fossil depletion were in INT8 (0.24 kg Fe eq; 0.68 kg oil eq), mainly caused by fertilization and harvesting, while the lowest were in INT4 for metal depletion (0.02 kg Fe eq) and INT14 for fossil depletion (0.09 kg oil eq). From what has been said, it emerges that the most impactful system per kg of unshelled hazelnuts was INT8, whose impacts were due both to the fuel consumed during the fertilization operation and the NPK fertilizer used (Table 9).
Table 9.
The impacts per kg of unshelled hazelnuts of the agricultural phase divided between the different impact categories and the various systems analyzed. (CONV: system managed according to the ordinary cultivation techniques. CC: climate change; OD: ozone depletion; TA: terrestrial acidification; Feu: freshwater eutrophication; Meu: marine eutrophication; HT: human toxicity; POF: photochemical oxidant formation; PMF: particulate matter formation; Tec: terrestrial ecotoxicity; FEc: freshwater ecotoxicity; MEc: marine ecotoxicity; IR: ionizing radiation; ALO: agricultural land occupation; ULO: urban land occupation; NLT: natural land transformation; WD: water depletion; MD: metal depletion; and FD: fossil depletion).
At the same time, these data were not confirmed when the analysis was conducted, considering one hectare of land cultivated for hazelnut production. In fact, the system in which ordinary management techniques (CONV) were implemented was found to have the most impact in relation to almost all impact categories (Table 10).
Table 10.
The impacts per ha of the agricultural phase divided between the different impact categories and the various systems analyzed. (CONV: system managed according to the ordinary cultivation techniques; CC: climate change; OD: ozone depletion; TA: terrestrial acidification; Feu: freshwater eutrophication; Meu: marine eutrophication; HT: human toxicity; POF: photochemical oxidant formation; PMF: particulate matter formation; Tec: terrestrial ecotoxicity; FEc: freshwater ecotoxicity; MEc: marine ecotoxicity; IR: ionizing radiation; ALO: agricultural land occupation; ULO: urban land occupation; NLT: natural land transformation; WD: water depletion; MD: metal depletion; and FD: fossil depletion).
The aggregation of data by cultivation system and the relative averages (Table 11) show that organic management was more environmentally friendly for almost all impact categories, both in reference to 1 kg of hazelnuts produced and one hectare of cultivated land. On the contrary, ordinary cultivation techniques have made the CONV system the most impactful, both per kg of product and per ha, especially when compared with organic management.
Table 11.
Environmental impacts compared between cultivation systems. Average values per kg of unshelled hazelnuts and per hectare (BIO: organic systems; INT: integrated systems; CONV: system managed according to the ordinary cultivation techniques).
Soil management (cultivation on flat or banked/terraced soils; irrigated or non-irrigated fields) can also create differences in impacts between systems. Thus, from our analysis, it emerged that cultivation on embankments or terraced soils had a greater impact when compared to flat soils, especially due to the greater fuel consumption during farm–field transport, while the majority of cultivation operations were manual and not mechanized for steep soils. On the contrary, the comparison between irrigated and non-irrigated systems revealed that the presence of emergency irrigation was not a factor influencing environmental impacts. In fact, per kg of product, the impacts were quite similar both in the presence and in the absence of irrigation, while at the hectare level, the management of irrigated fields was a little more sustainable than that of non-irrigated ones for almost all impact categories, except, obviously, for water depletion (Table 12). But it must be said that these data are not very truthful and should be better investigated, given the difference between the number of non-irrigated and irrigated systems (18 and 3, respectively).
Table 12.
Environmental impacts compared between soil management type. Average values per kg of unshelled hazelnuts and per hectare (CC: climate change; OD: ozone depletion; TA: terrestrial acidification; Feu: freshwater eutrophication; Meu: marine eutrophication; HT: human toxicity; POF: photochemical oxidant formation; PMF: particulate matter formation; Tec: terrestrial ecotoxicity; FEc: freshwater ecotoxicity; MEc: marine ecotoxicity; IR: ionizing radiation; ALO: agricultural land occupation; ULO: urban land occupation; NLT: natural land transformation; WD: water depletion; MD: metal depletion; and FD: fossil depletion).
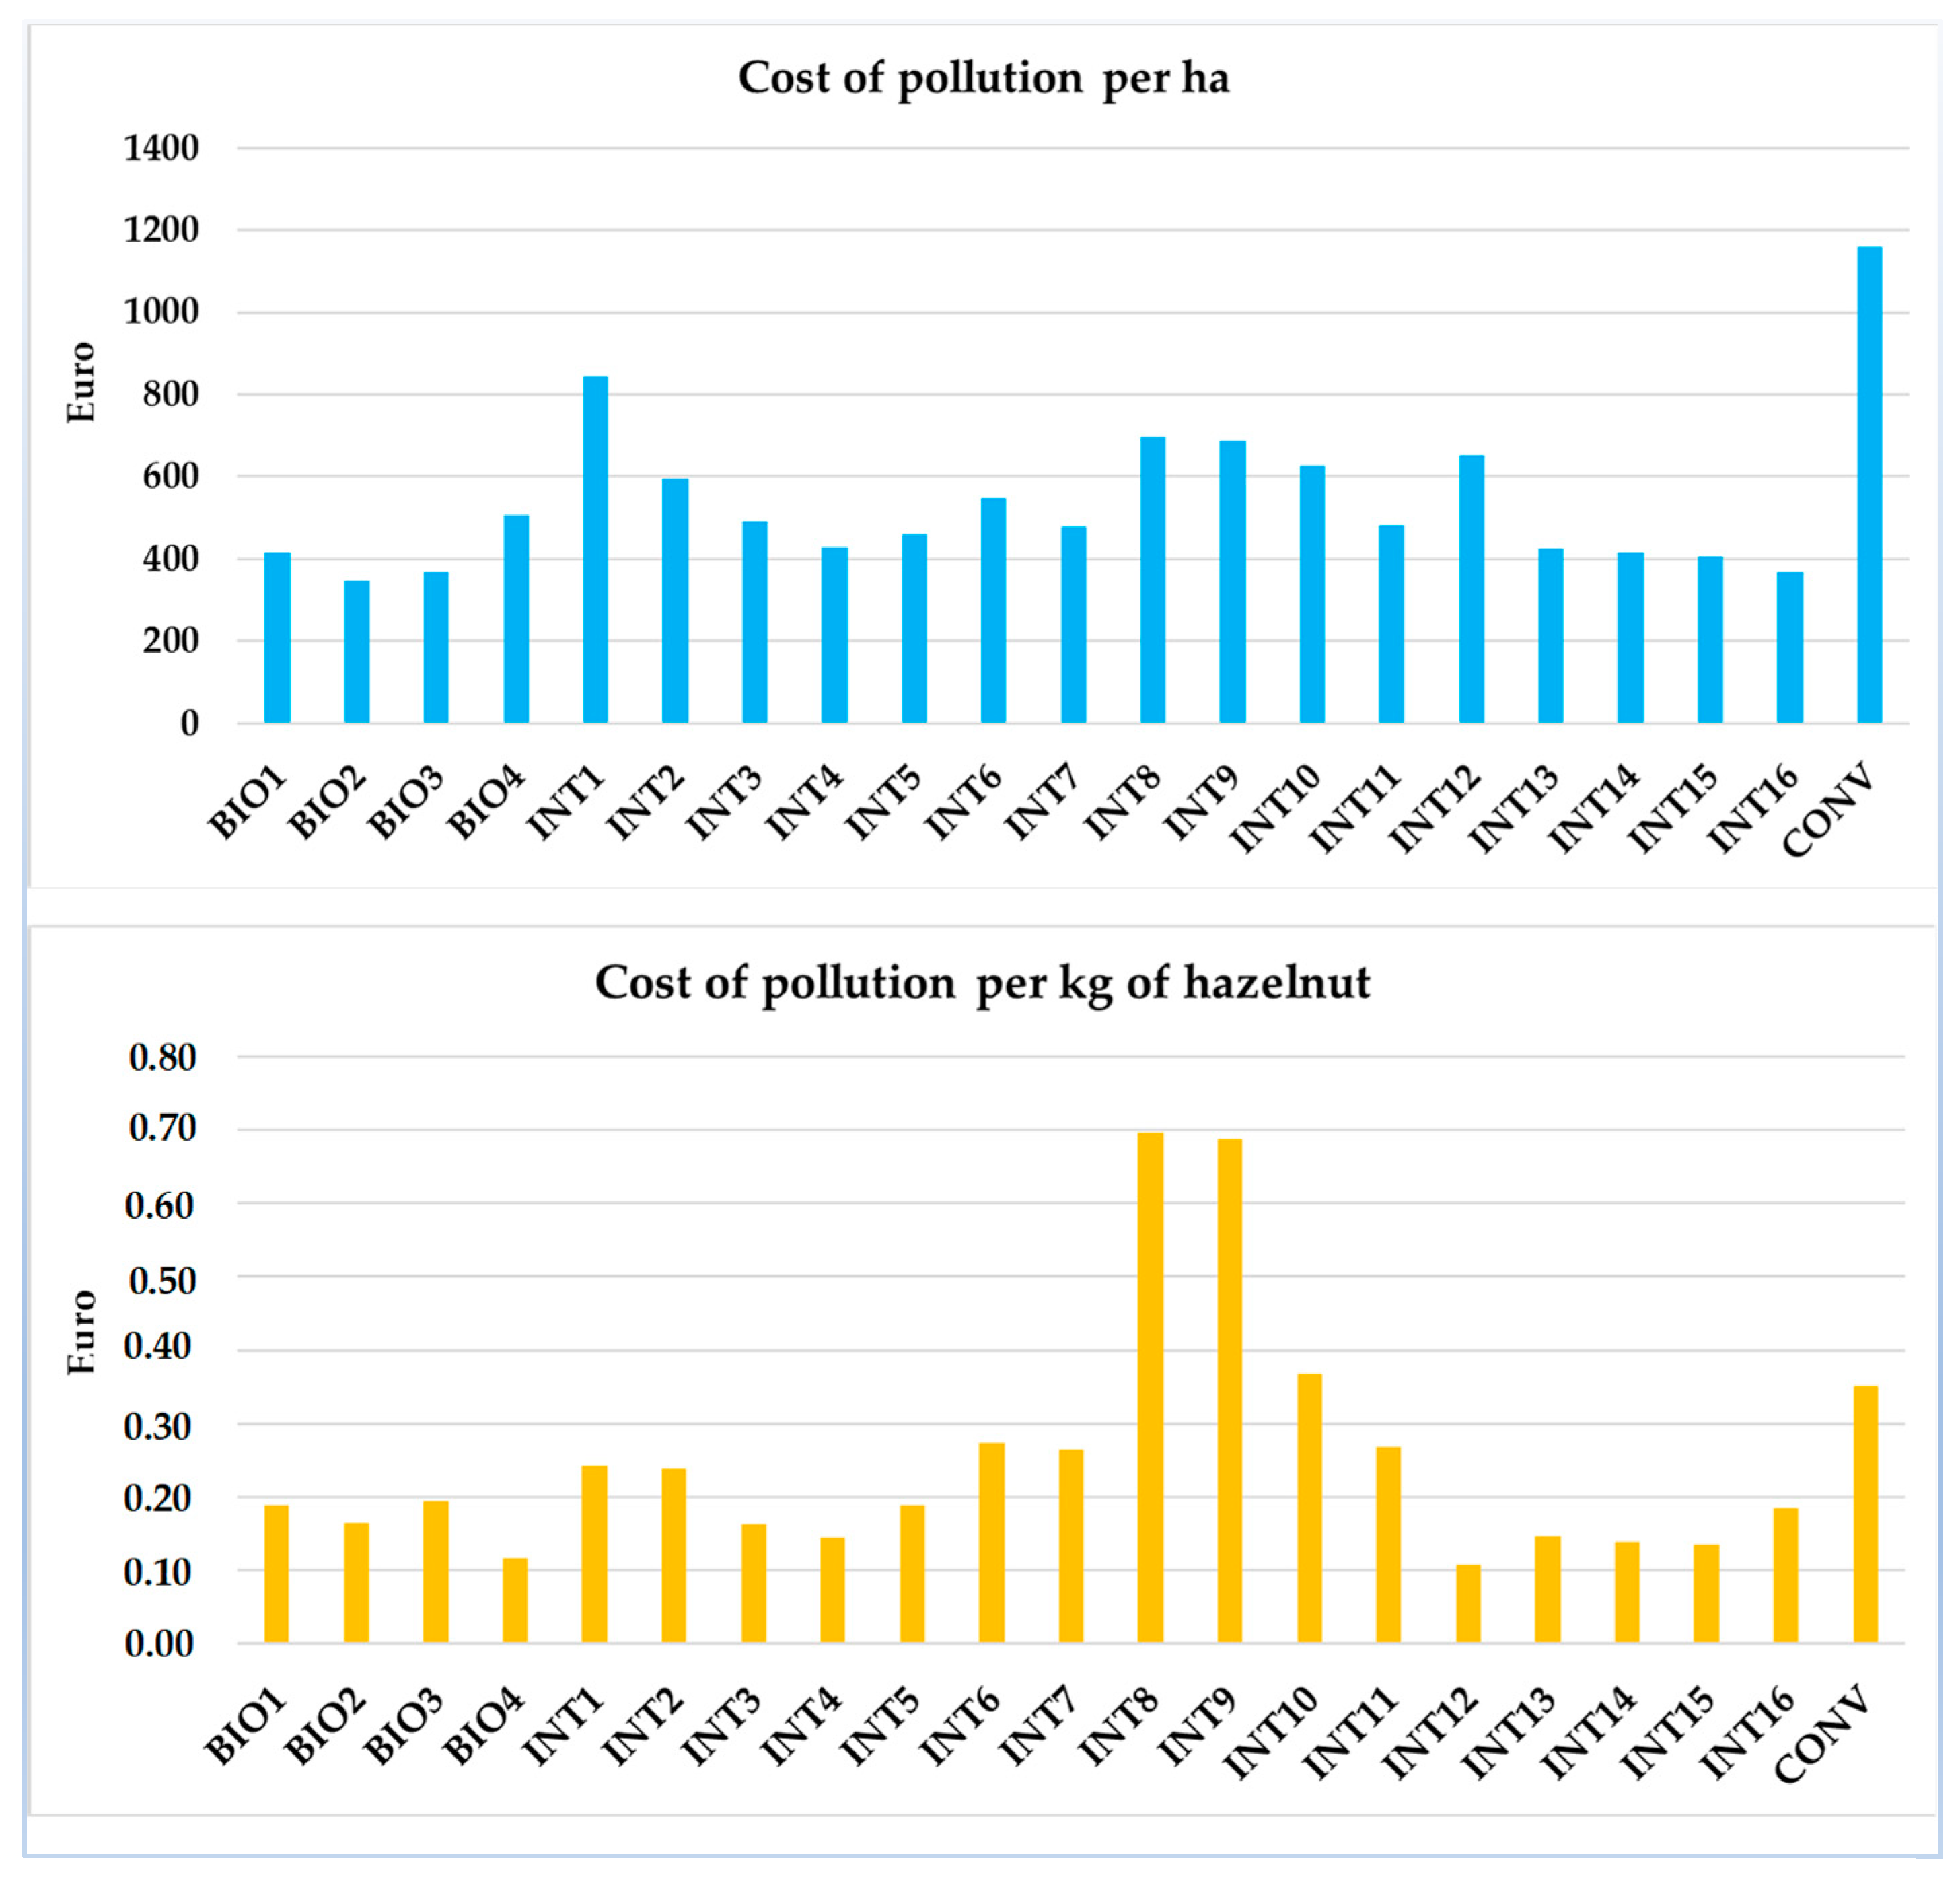
In economic terms, the total cost of pollution varied from a minimum of EUR 0.11 per kg of hazelnuts produced to a maximum of EUR 0.70, identifying the INT12 system as the least expensive in terms of impacts and INT8 and INT9 as the most environmentally expensive. In reference to one cultivated hectare, the environmental costs ranged from a minimum of EUR 345 (in BIO2) to a maximum of EUR 1161 (in CONV), confirming that ordinary management was the most impactful and, therefore, the most expensive from a social point of view (Figure 3).

Figure 3.
Cost of pollution per kg of unshelled hazelnut and per hectare (BIO: organic systems; INT: integrated systems; CONV: system managed according to the ordinary cultivation techniques).
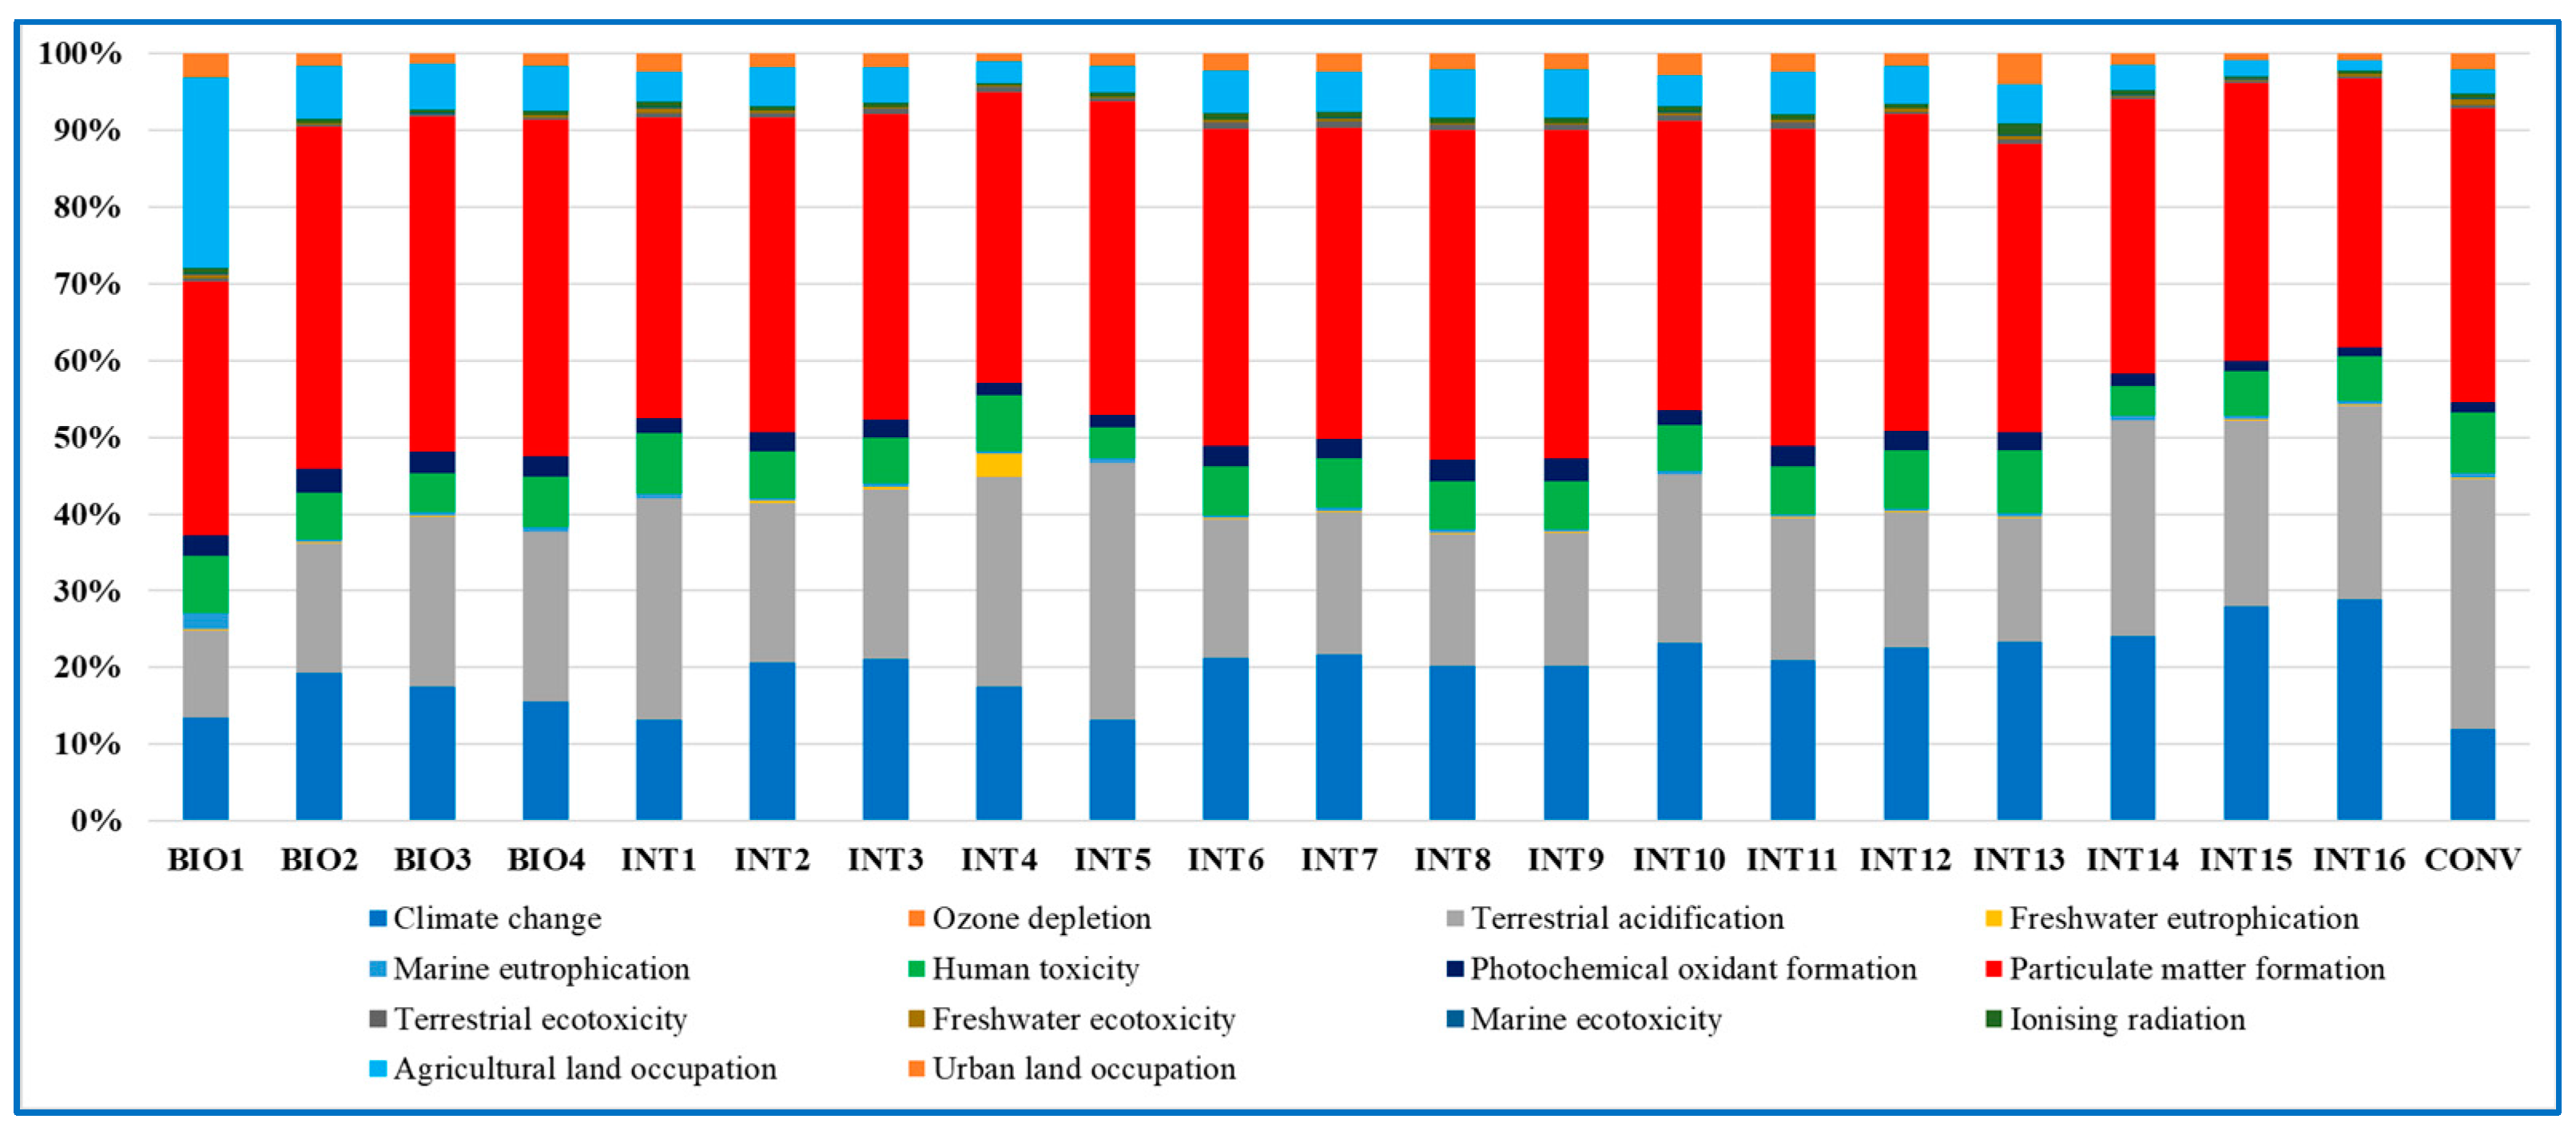
These pollution costs, borne by society, were essentially due to the following impact categories: particulate matter formation, terrestrial acidification, and climate change, which together, depending on the system considered, represented more than 80% of the cost of the impact. At the same time, this was not true for BIO1, in which 25% of the total impact was given by agricultural land occupation (Figure 4).

Figure 4.
Cost of pollution per impact categories (BIO: organic systems; INT: integrated systems; CONV: system managed according to the ordinary cultivation techniques).
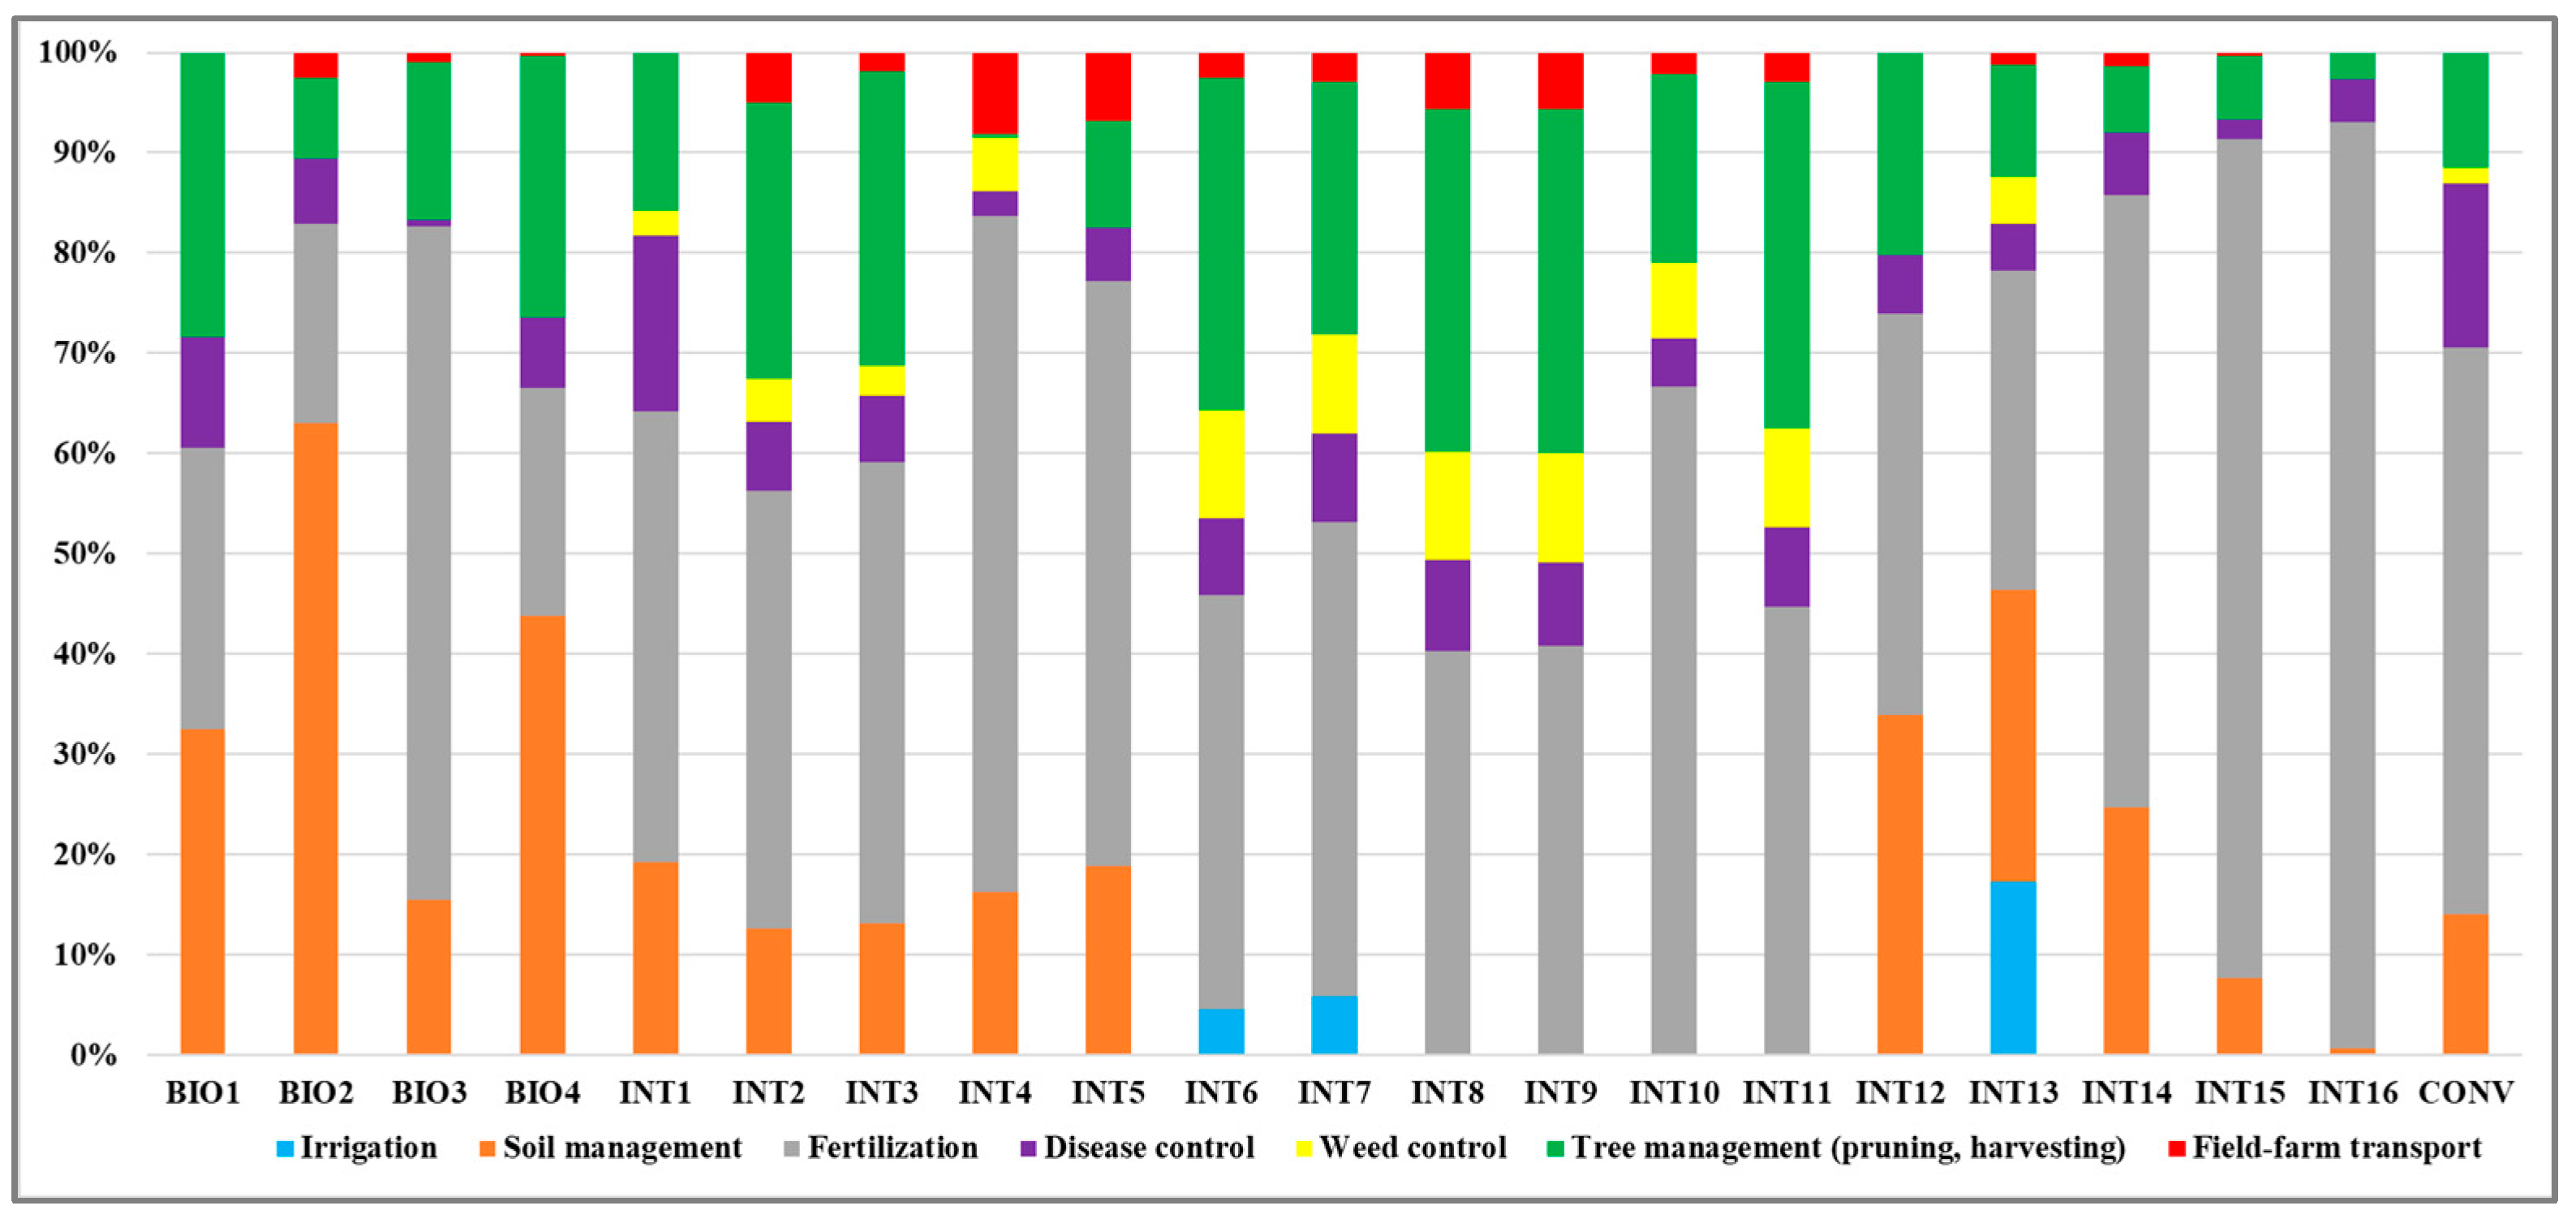
To understand the impact of the different cultivation operations on the cost of pollution, data were aggregated based on the following items: irrigation, soil management, fertilization, disease control, weed control, tree management (pruning and harvesting), and field–farm transport. The operations most responsible for the environmental costs in the different systems analyzed were fertilization, with a percentage weight varying from 20% (in BIO2) to 92% (in INT16), soil management, with a zero percentage weight in INT6–INT11 because no operation was carried out, but which represented 63% in BIO2, tree management, and above all, harvesting, which in some cases, constituted up to 35% of environmental costs (Figure 5).
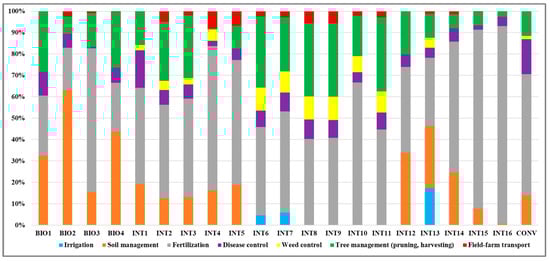
Figure 5.
Contribution of the cultivation operations on the cost of pollution (BIO: organic systems; INT: integrated systems; CONV: system managed according to the ordinary cultivation techniques).
The Focus on the Climate Change
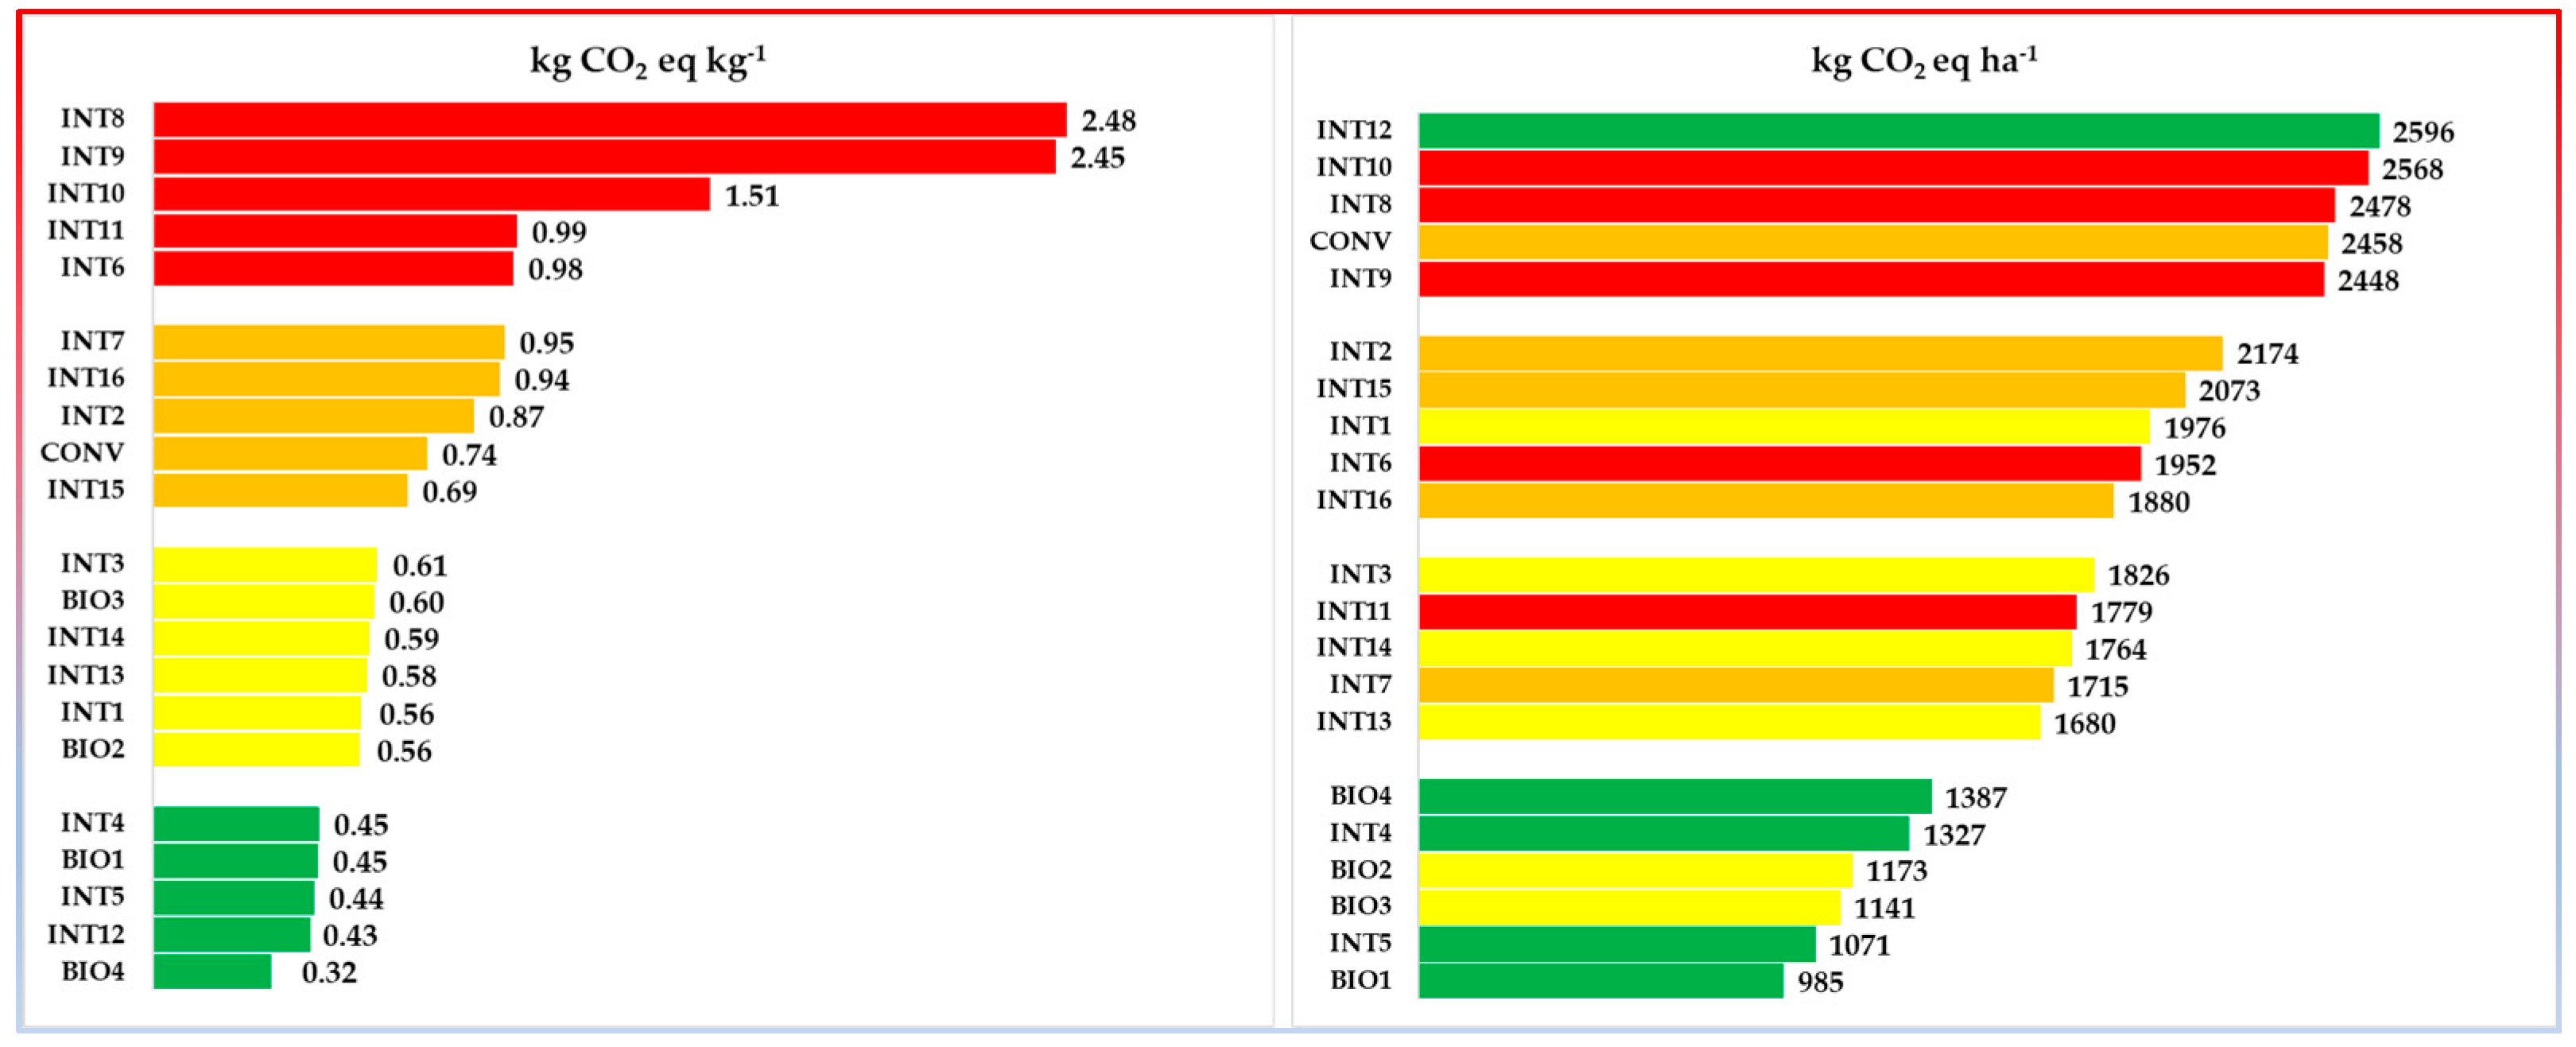
To better compare the different systems analyzed and try to classify them into sustainability classes, a focus was placed on the impact category “climate change”, one of the issues most felt by public opinion. Thus, the subdivision of data relating to the CO2 eq emissions of the different systems analyzed into four quantiles (Figure 6) made it possible to identify some “comparison classes” per kg of unshelled hazelnuts, as reported in Figure 7, to identify the most sustainable systems.
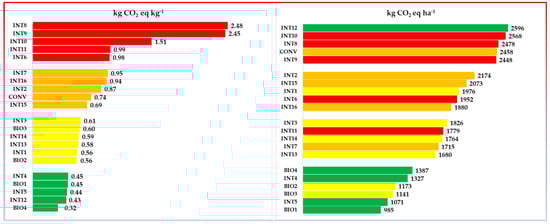
Figure 6.
The focus on climate change. Emission values per both functional units (kg of unshelled hazelnuts and hectare). (BIO: organic systems; INT: integrated systems; CONV: system managed according to the ordinary cultivation techniques).
Figure 7.
Comparison/sustainability classes per kg of unshelled hazelnuts.
Consequently, according to this distribution, the most sustainable systems per kg of product were BIO4, INT12, INT5, BIO1, and INT4. On the contrary, the least sustainable ones were those belonging to the fifth class (greater than 0.95), namely, INT6, INT11, INT10, INT9, and INT8 (Figure 6). None of this is confirmed at the hectare level; in fact, the distribution of data per hectare shows how systems that had been considered to have little impact per kg of product (such as INT12), essentially because they were very productive, were among those with the most impact per hectare, and, vice versa, systems considered to have an average impact per kg of product, such as BIO2 and BIO3, fell into the second sustainability class at the hectare level because they were not very productive. At this point, we must ask ourselves whether the choice of a product FU is truly descriptive of the system being analyzed or whether, perhaps, it is better to evaluate other more objective FUs. Furthermore, we must ask ourselves whether it is right to talk about sustainability classes referring only to CO2 eq emissions, as happens for other agricultural production [51], or whether it is better to also consider other impact categories and quantify sustainability in a different way.
Despite the fact that it is difficult to compare the results of different studies due to the subjectivity that characterizes the choice of the boundaries of analysis, their level of detail [28], and the impact assessment method used [52], our findings are in line with those found in the available literature [21,23,25,27], and in some cases, even lower, especially at the hectare level, for example, if compared with the results of the study by Nayeri et al. [24].
3.2. The Impacts of the Post-Harvest Operations
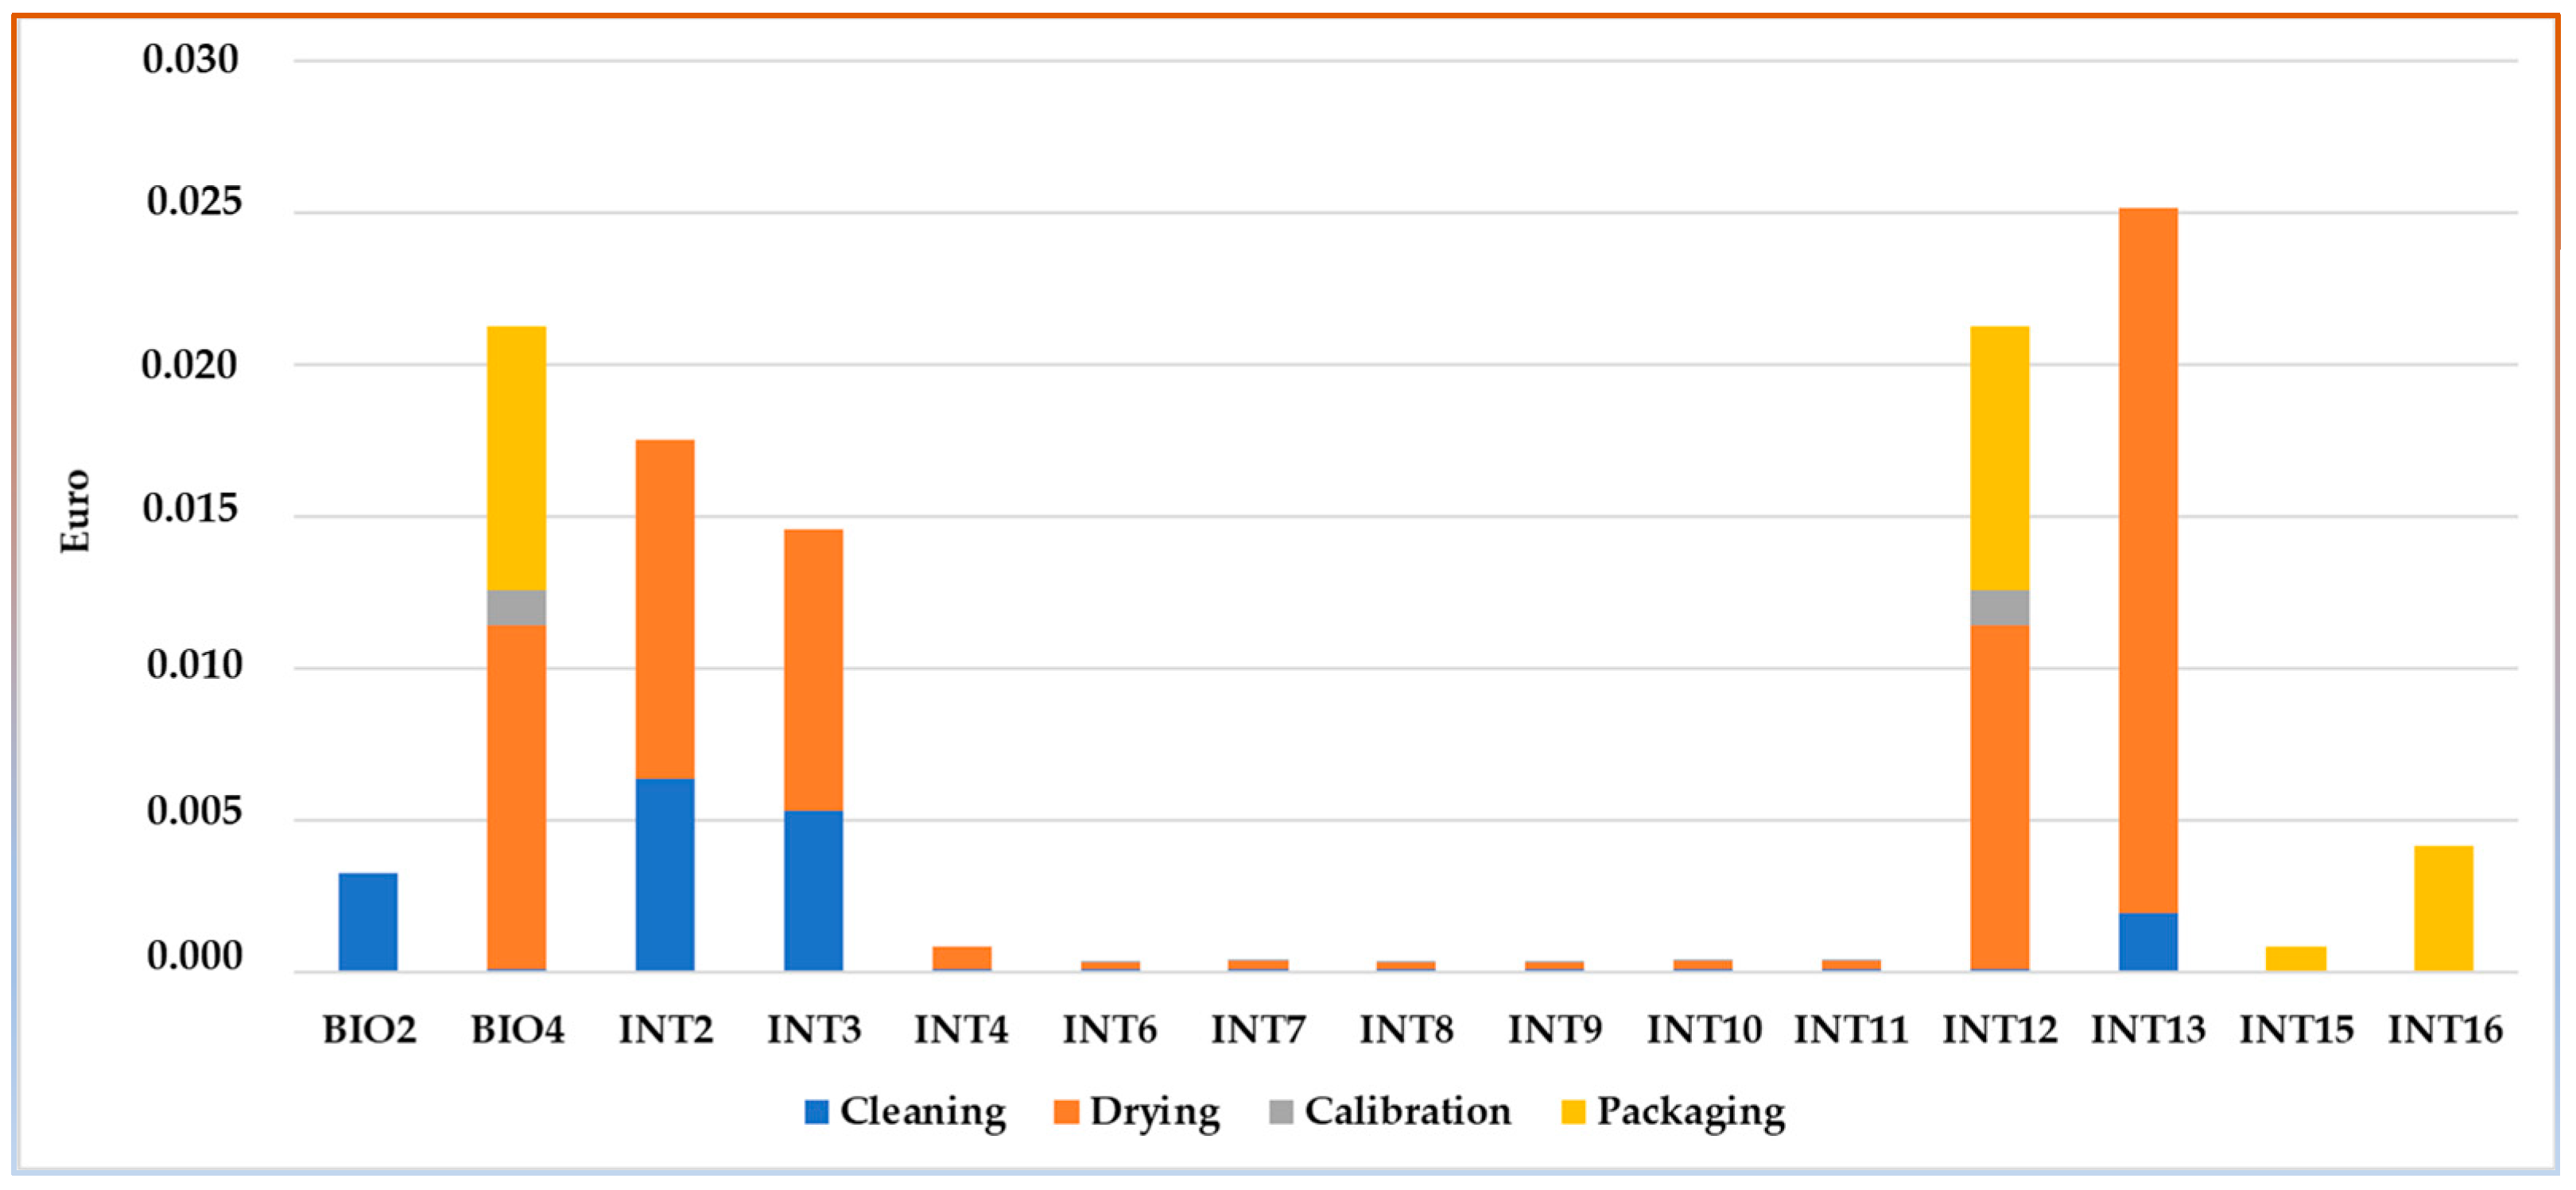
As reported in Table 4, not all the systems analyzed carried out post-harvest operations; in fact, three sold the hazelnuts as soon as they were harvested, while for the others, although they sold part of the hazelnuts as they were, the bulk of the production was at least cleaned and dried. When delivering hazelnuts in the shell, the most impactful post-harvest operations were drying, cleaning, and when present, packaging (Figure 8).
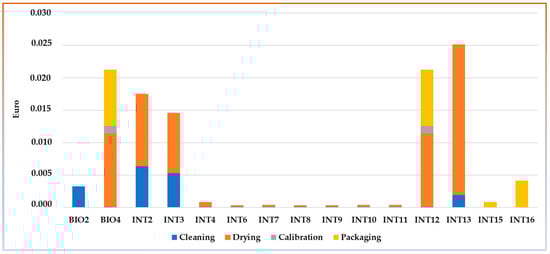
Figure 8.
Environmental cost per kg of hazelnuts of the post-harvest operations distinguished among the systems that carried them out (BIO: organic systems; INT: integrated systems; CONV: system managed according to the ordinary cultivation techniques).
In economic terms, the cost of the impact of drying varied from a minimum of EUR 0.0002 (INT6) and EUR 0.023 (INT13) per kg of unshelled hazelnuts (Figure 8), essentially due to climate change, terrestrial acidification, and particulate matter formation. The environmental cost of cleaning, however, varied from EUR 0.00008 in INT6, INT8, and INT9 to EUR 0.006 in INT2, which was also due to climate change, terrestrial acidification, and particulate matter formation.
Regarding packaging, only two of the farms analyzed sold unshelled hazelnuts in packs; the farm hosting BIO4 and INT12 systems packaged them in 1 kg paper bags, and the farm hosting INT15 and INT16 systems packaged them in 1 kg plastic nets. As can be seen in Figure 8, which presents a weighing of the environmental impacts in economic terms, packaging in paper bags had a greater impact than nets, which in unit terms were equal to 0.01 kg CO2 eq, 0.003 kg 1,4-DB eq, 0.002 kBq U235 eq, 0.05 m2 yr annual land−1, and 0.005 kg oil eq.
For completeness, Table 13 shows the environmental impacts of shelling, peeling, roasting, and packaging (with an attached comparison between packaging types) estimated for the farm that hosted BIO4 and INT12 systems, which were the only ones that also implemented these operations in addition to those seen previously. Of the operations analyzed, peeling and roasting were those that mainly caused CC, HT, FEc, MEc, IR, LO, NLT, WD, MD, and FD; instead, shelling mainly caused OD, TA, FEu, MEu, POF, PMF, and TEc. Regarding the packaging format of shelled, peeled, and toasted hazelnuts, the comparison of the impact analysis showed that the use of 0.150 kg plastic bags had more impact; on the contrary, the use of 0.250 kg plastic bags allowed for a reduction in impacts of 20%, while those of 1 kg allowed for a reduction of 75% (Table 13).
Table 13.
Environmental impacts of shelling, peeling, roasting, and packaging, with a comparison between packaging types. Average values per kg of unshelled hazelnuts (CC: climate change; OD: ozone depletion; TA: terrestrial acidification; Feu: freshwater eutrophication; Meu: marine eutrophication; HT: human toxicity; POF: photochemical oxidant formation; PMF: particulate matter formation; Tec: terrestrial ecotoxicity; FEc: freshwater ecotoxicity; MEc: marine ecotoxicity; IR: ionizing radiation; ALO: agricultural land occupation; ULO: urban land occupation; NLT: natural land transformation; WD: water depletion; MD: metal depletion; and FD: fossil depletion).
In economic terms, shelling, peeling, roasting and vacuum packaging entailed an environmental cost of EUR 0.07, referring to 1 kg of unshelled hazelnuts, to which EUR 0.001, EUR 0.004, or EUR 0.005 had to be added, depending on the packaging format used (0.150, 0.250, or 1 kg plastic bags).
3.3. The Life Cycle Comparison in Economic Terms
This subparagraph reports the total impacts in economic terms of the systems analyzed based on their system boundary and therefore on the operations they performed in addition to agricultural ones. As can be seen in Figure 9, the environmental cost per kg of product varied from a minimum of EUR 0.14 in the INT15 and INT14 systems to a maximum of EUR 0.70 in the INT8 system. Figure 9 clearly shows the weight of agricultural operations (essentially fertilization, soil management, and harvesting, as fully specified in Section 3.1) compared to post-harvest operations and how systems with sustainable management, while carrying out various post-harvest operations up to vacuum packaging in order to obtain a higher selling price (INT12 and BIO4), remain less impactful than many other systems.
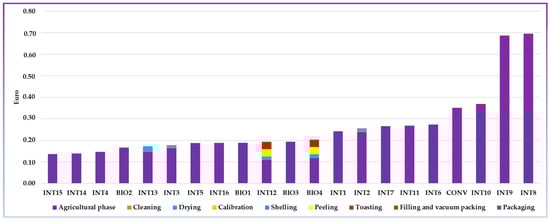
Figure 9.
Total environmental cost distinguished by system and by operations carried out according to system boundaries of each analyzed system (BIO: organic systems; INT: integrated systems; CONV: system managed according to the ordinary cultivation techniques).
3.4. The Recovery of Pruning Material and Shells
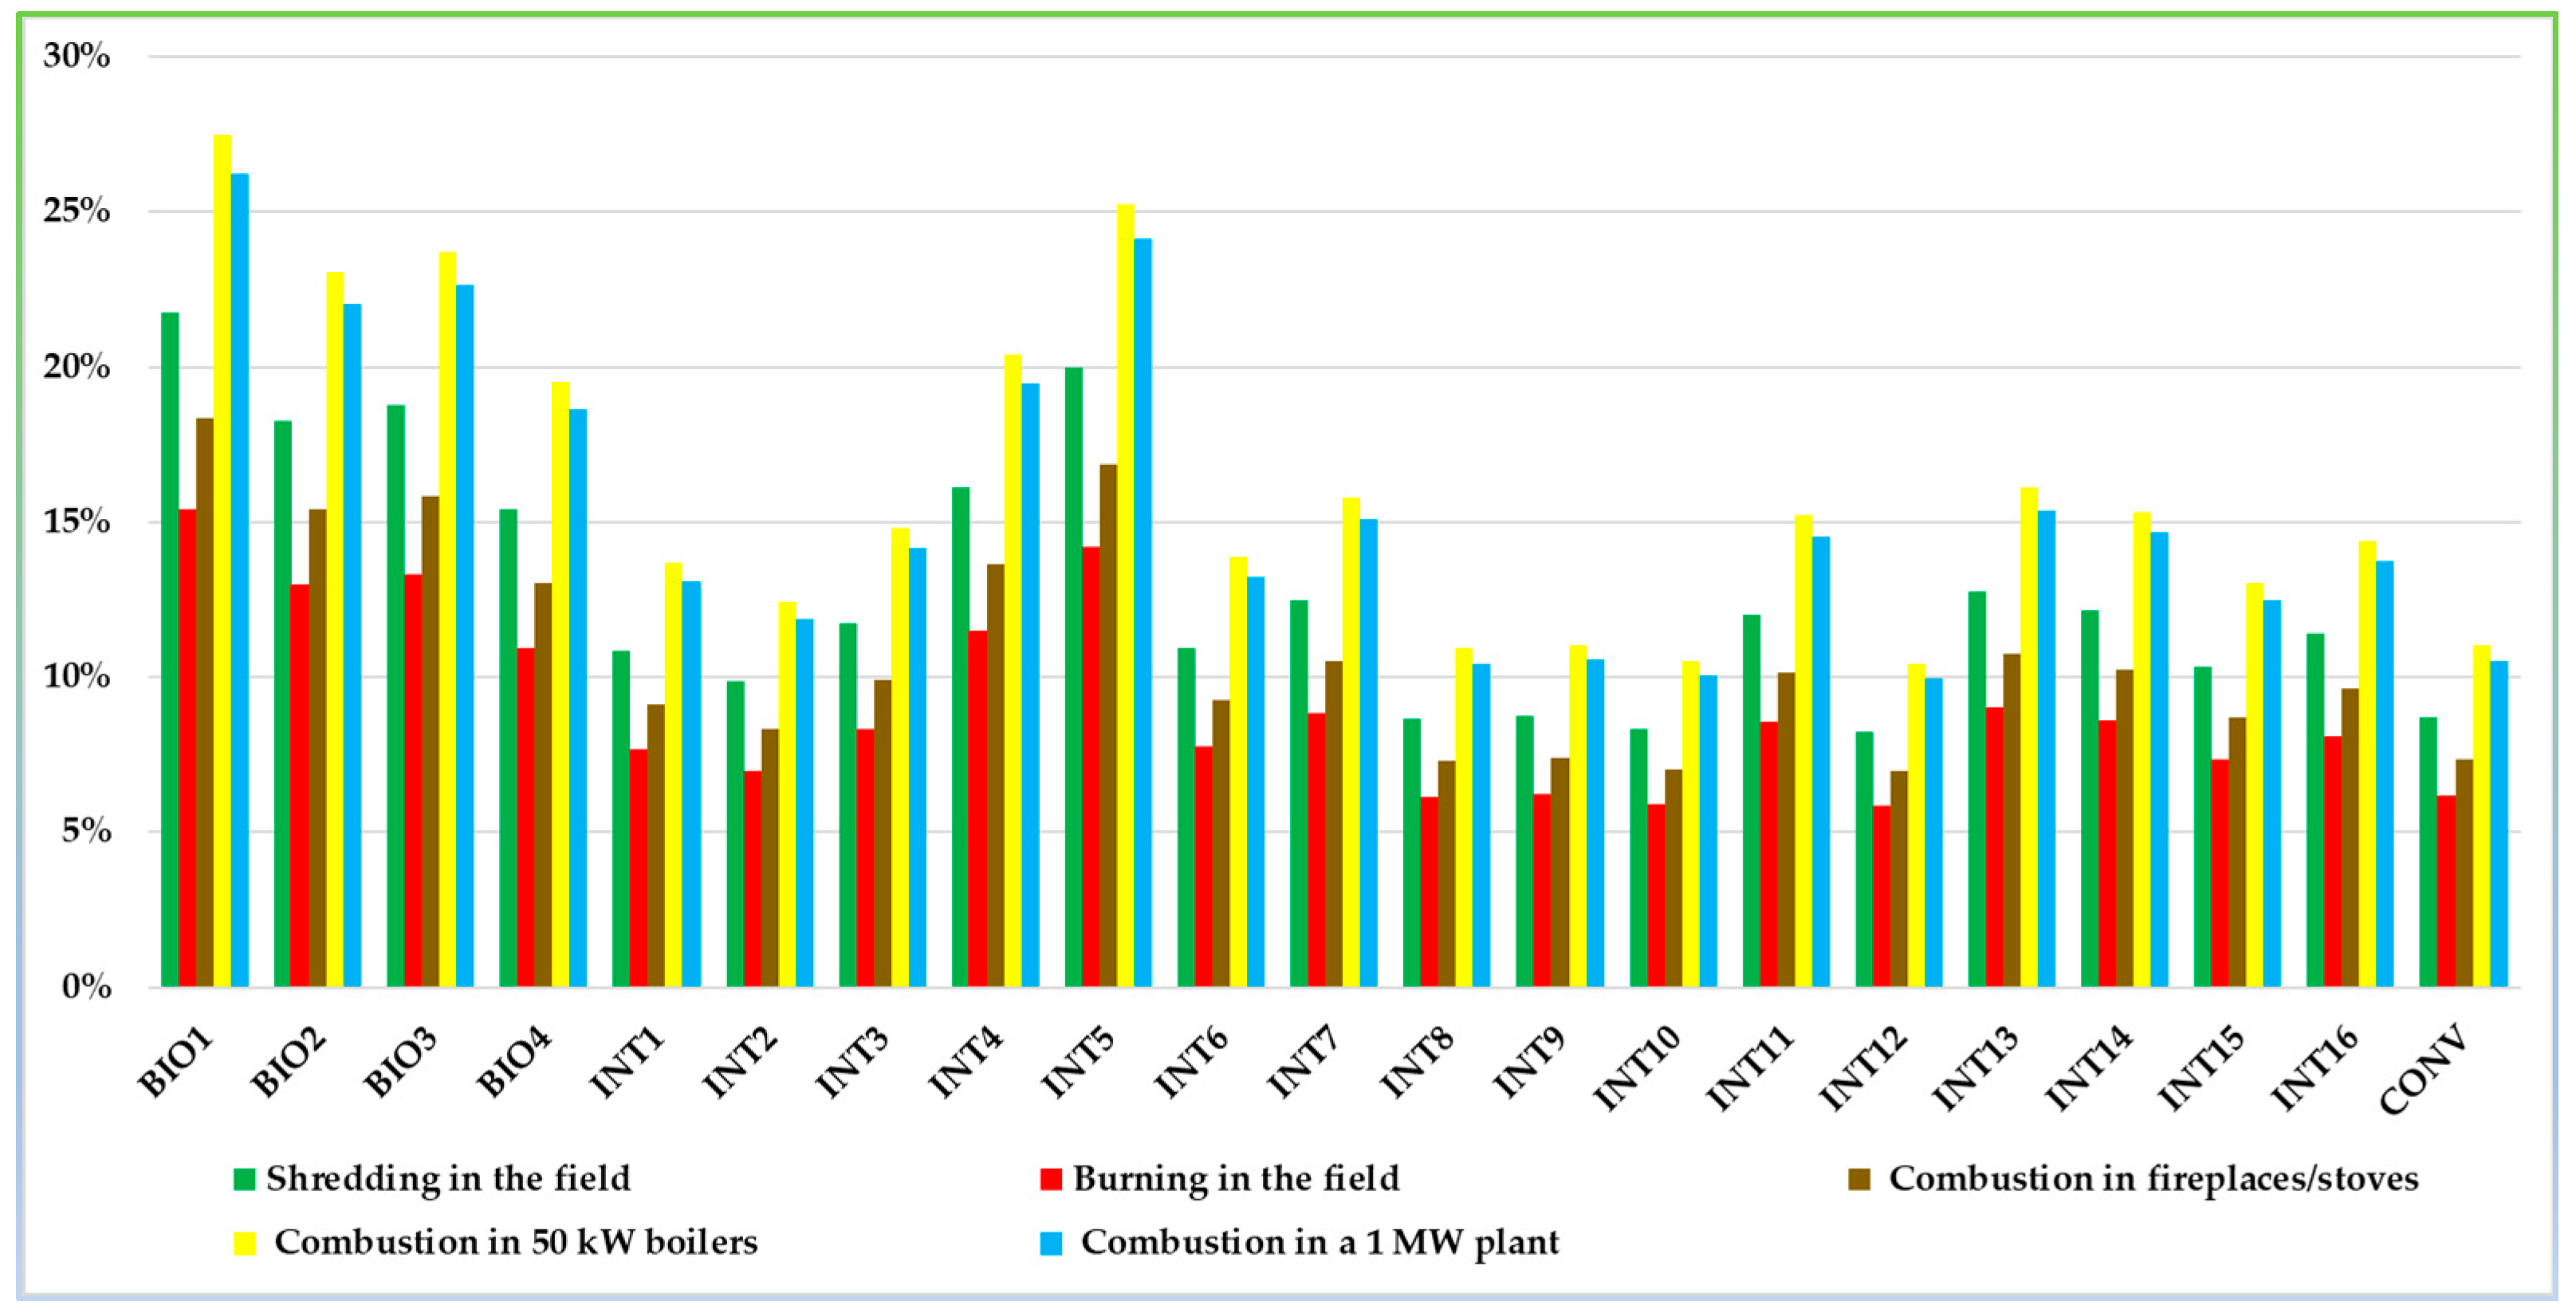
A sensitivity analysis was carried out to evaluate the effects of different management alternatives of hazelnut residues on environmental impact. In reference to pruning residues, the results, as reported in Figure 10, highlight that the environmental impact can vary considerably depending on the disposal method.

Figure 10.
Percentage increase in environmental impacts (kg of CO2 eq) in reference to different alternatives to dispose pruning residues without considering avoided emissions (BIO: organic systems; INT: integrated systems; CONV: system managed according to the ordinary cultivation techniques).
In all the systems analyzed, the disposal alternative that, per FU, increased the impact the most was combustion in 50 kW boilers, followed by combustion in a 1 MW plant. Contrary to what one might expect, the burning of such residues in the field was found to increase the impacts the least (from a minimum of 6% to a maximum of 15%). At the same time, however, considering the avoided emissions due to the use of pruning residues to replace pellets, methane, and diesel oil in residential heating, the analysis carried out showed that combustion in fireplaces/stoves, 50 kW boilers, or a 1 MW plant was the more sustainable choice, compared to shredding or to burning in the field. Furthermore, if in the replacement of pellets with pruning residue, there were increases in impacts (even if small), in the replacement of methane and diesel oil, there were significant decreases, even as much as 100% (Table 14).
Table 14.
Percentage variation in environmental impacts in reference to different alternatives to dispose of pruning residues, taking into account the avoided emissions of the different fuels considered (A: combustion in fireplaces/stoves; B: combustion in 50 kW boilers; C: combustion in a 1 MW plant; BIO: organic systems; INT: integrated systems; CONV: system managed according to the ordinary cultivation techniques).
Another important biomass, which is usually disposed of in the humid fraction or burned, are the shells, which represent 57% of hazelnut production and which, if used to replace pellets, methane, and diesel oil in residential heating, would allow for a further reduction in impact. In particular, the joint use of these two agricultural residues (pruning material and shells) would allow the CO2 eq emissions of the systems analyzed to be completely reduced if they are used to replace methane or diesel. This is true for all systems, except for the INT12 system, in which the use of these residues would allow emissions to be reduced by up to a maximum of 95% if they were used to replace methane. At the same time, the comparison with pellets showed little significant reduction in emissions, if we consider combustion in fireplaces/stoves, and slight increases (variable from 2% to 14%) in reference to combustion in 50 kW boilers (Table 15).
Table 15.
Percentage variation in environmental impacts in reference to different alternatives to dispose of residues (pruning material and shells), considering the avoided emissions of the different fuels considered.
From a circular economy perspective, both pruning residues and shells could be used as fuel in post-harvest operations (cleaning, drying, calibration, shelling, toasting, and peeling). In this case, an average saving of 0.28 kg of CO2 eq per kg of toasted hazelnuts could be reached due to the exclusion of transport impacts, since these biomasses would be reused on the same farm.
4. Discussion
In the last twenty years, the agricultural scenario has changed profoundly. On the innovation side, after the first steps in the 1980s and 1990s, which saw the birth of precision agriculture (Agriculture 3.0) with monitoring through special microprocessors and using global positioning technology, Agriculture 4.0 has taken over, which uses the most advanced digital technologies with the aim of building an increasingly sustainable agricultural model from an environmental, economic, and social point of view [53].
On the political side, Agenda 2000 first, and the Fischler Reform (2003) later, revolutionized the European Union’s support for the agricultural sector; the Common Agricultural Policy (CAP) has become more oriented toward consumer interests and product quality, leaving farmers free to produce what the market demands. In line with the Europe 2020 Strategy, the CAP 2014–2020 attempted to jointly pursue the following two macro-objectives: the competitiveness of agricultural businesses, through market orientation and income support, and the remuneration of public goods, through the strengthening of the conditionality of the first pillar and the environmental component in rural development policy. The objective was the gradual transition from undifferentiated income support to support for the production of environmental goods [54,55]. Greening was the real novelty of the CAP 2014–2020 [56].
The current CAP programming period (2023–2027) is seeking to ensure a sustainable future for European farmers, provide more targeted support for smaller farms, and provide more flexibility for EU countries to adapt measures to local conditions. Through its ten key objectives, it is a key tool for achieving the objectives of the Farm to Fork Strategy and the Biodiversity Strategy, as agriculture and rural areas are at the heart of the European Green Deal [57].
The present research, with the estimation of the environmental impacts of hazelnut cultivation in the Campania region in quantitative and economic terms to identify the most sustainable management techniques, fits perfectly into this context of profound changes. Indeed, the results showed that organic management was more environmentally friendly for almost all impact categories, while ordinary cultivation techniques have made the CONV system the most impactful. At the same time, from an ecological transition perspective, field management according to the principles of integrated agriculture has also proven to be a valid alternative in several analyzed systems. In fact, it is a production strategy based on the principles of awareness and analysis, guaranteed and maintained through technical preparation, the constant updating of skills, the technical adequacy of the tools, and “integrated” intervention strategies (which combine prevention, monitoring, and targeted intervention). Integrated agriculture is recognized as the only production management capable of reconciling consumers and the environment. In this sense, the meaning of the term “integrated” combines the concepts of sustainability and safety, hence the need to extend research on the estimation of environmental impacts of hazelnut cultivation in order to make farms operating in this sector truly sustainable and in line with the objectives of the Green Deal (first of all climate neutrality by 2050).
Cultivation on embankments or terraced soils, which are very widespread growing conditions in inland areas of the Campania region, had a greater impact when compared to flat soils, especially due to the greater fuel consumption during farm–field transport. At the same time, emergency irrigation did not cause an increase in impact if the overall management was sustainable. Among the systems grown in these conditions, INT8 was the most impactful system per kg of unshelled hazelnuts, whose impacts were due both to the fuel consumed during the fertilization operation and the NPK fertilizer used.
In economic terms, the total cost of pollution in the agricultural phase varied from a minimum of EUR 0.11 per kg of hazelnuts produced to a maximum of EUR 0.70; this environmental cost, considerably lower than that of other land uses, is necessary to ensure hazelnut cultivation survival. At the same time, the operations most responsible for the environmental costs in the different systems analyzed were fertilization, soil management, and harvesting, hence the need to find more environmentally friendly solutions in terms of inputs to be used and agricultural machinery efficiency. Satellite guidance technologies, precision in cultivation operations, and data management for the reduction of synthetic products and waste are the most widespread solutions now and could be widely applied in systems that make extensive use of fertilizers and other chemical products.
Carrying out post-harvest operations up to vacuum packaging, as occurred in the farm hosting INT12 and BIO4 systems, did not make these systems more impactful than others, since their agricultural management was more sustainable than many others.
Referring to the classification of hazelnut systems into comparison/sustainability classes (probably more objective if based on the cultivated hectare), these last can represent the basis for defining general guidelines and provide useful indications for the development of reward and subsidy policies in favor of the less impactful systems, in line with the 2023–2027 CAP programming period, that aim to support virtuous farms. At the same time, it is necessary to broaden the sample base, especially by analyzing more systems managed according to ordinary techniques, other irrigated systems, and other systems that carry out post-harvest operations on farms.
Another aim of this study was to understand how the impacts of hazelnut production varied with the utilized disposal method for pruning residues and shells. Thus, from a lifecycle perspective, the recovery of these residues on farms has proven to be very interesting in reducing impacts, especially if they are used to replace methane and diesel oil. Consequently, the diffusion of this practice would be very useful to make hazelnut-producing farms more sustainable and active protagonists of the green transition supported by the European Green Deal, which among other things, aims to transform the EU into a fair and prosperous society with a modern and competitive economy. At the same time, the impacts of transporting these materials to the different plants must be accounted for and considered. Indeed, the transport of biomass to the energy conversion plant often poses critical issues for containing supply costs and fossil CO2 emissions into the atmosphere. It is always advisable to use efficient means and establish a correct relationship between the quantity of biomass transported and the travel distance. As a matter of fact, poorly managed transport would have a negative impact on the greenhouse gas emission balance linked to the production of energy from these renewable sources for excess CO2 emissions due to transport. Consequently, in short supply chains, the efficiency of the supply system also must still be carefully evaluated, as it can have a strong impact on the environmental sustainability of the entire supply chain [58].
Limitations of This Study
The comparison/sustainability classes identified were influenced by the small size of the sample, especially in reference to systems managed according to ordinary techniques and irrigated ones.
Not considering the transport of agricultural residues (pruning materials and shells) in the environmental sustainability analysis represented another limitation of this study.
5. Final Considerations
In inland areas, hazelnut cultivation has an important role, as it protects territories from erosion, supports the economy of rural districts, and stimulates the development of close supply chain relationships, with positive effects on employment levels, hence the need to extend this research and strengthen it by integrating an environmental analysis with economic, structural, and social studies to analyze the economic and social impacts that this crop has on the territory. Furthermore, it will also be important to analyze the different ecosystem services that the hazelnut provides in order to estimate its total economic value.
Author Contributions
M.P.: conceptualization; data curation; methodology; software; supervision; writing—original draft. A.M.: data curation; formal analysis; methodology; software; writing—review and editing. A.P.: investigation; methodology. A.M.P.: validation; visualization; writing—review and editing. G.A.: data curation; methodology; visualization; writing—review and editing. G.C.: conceptualization; funding acquisition; project administration; resources; supervision; validation; visualization; writing—review and editing. All authors have read and agreed to the published version of the manuscript.
Funding
This research was funded by the MIPAAF Project “Modelli Circolari—Modelli di sistemi circolari multifunzionali per produzioni tipiche” and by the European Commission Project “TIOT GIFF—Applicazioni di tecnologie IOT per la valorizzazione della filiera della nocciola di Giffoni IGP nelle colline salernitane”.
Institutional Review Board Statement
Not applicable.
Informed Consent Statement
Not applicable.
Data Availability Statement
No new data were created.
Acknowledgments
We are grateful to the interviewed farmers for giving us access to their field data.
Conflicts of Interest
Author Assunta Maria Palese was employed by the company Ages s.r.l. s. The remaining authors declare that the research was conducted in the absence of any commercial or financial relationships that could be construed as a potential conflict of interest.
References
- ISTAT. Censimento Agricoltura. 2020. Available online: https://www.istat.it/it/censimenti/agricoltura/7-censimento-generale (accessed on 16 June 2024).
- ISMEA. Scheda di Settore FRUTTA IN GUSCIO. 2023. Available online: https://www.ismeamercati.it/flex/files/1/9/b/D.3bedcea68fee89d3d71f/2023_04_Scheda_Frutta_Guscio.pdf (accessed on 20 June 2024).
- Trotter, A. Le principali varietà di noccioli (Corylus) coltivati in Campania. In Annali Della Sperimentazione Agraria, Nuova Serie, Vol. 3; Libreria Internazionale: Roma, Italy, 1949. [Google Scholar]
- AA.VV. Cenni storici sulla coltura del nocciuolo in Irpinia. In Proceedings of the Convegno Internazionale sul Nocciuolo, Avellino, Italy, 15–16 June 1983. [Google Scholar]
- Trotter, A. Contributo alla storia colturale del nocciuolo nella Campania. In Proceedings of the Atti Congresso di Arboricoltura meridionale, Napoli, Italy, 16–20 September 1921. [Google Scholar]
- Tosco, D. Il Nocciolo in Campania Aspetti Organizzativi, Tecnici ed Economici. 2011. Available online: http://www.agricoltura.regione.campania.it/pubblicazioni/nocciolo_in_campania.html (accessed on 5 June 2024).
- AA.VV. Allegato Tecnico del Piano Corilicolo Nazionale—2022/2025 Gruppo 1 “Commercializzazione, Problematiche Economiche e Organizzative delle Aziende”, Sottogruppo 2.1 “Meccanizzazione-Post-Raccolta, Fonti Rinnovabili, Agricoltura Digitale”, Valutazione Della Sostenibilità, Ambientale, Economica e Sociale. 2021. Available online: https://nocciolare.it/wp-content/uploads/2022/11/AllegatoTecnicoPIANOSETTORECORILICOLO-1.pdf (accessed on 10 May 2024).
- The World Commission on Human and Environment Development. Our Common Future; Oxford University Press: New York, NY, USA, 1987. [Google Scholar]
- Manioudis, M.; Meramveliotakis, G. Broad strokes towards a grand theory in the analysis of sustainable development: A return to the classical political economy. New Political Econ. 2022, 27, 866–878. [Google Scholar] [CrossRef]
- Meramveliotakis, G.; Manioudis, M. History, Knowledge, and Sustainable Economic Development: The Contribution of John Stuart Mill’s Grand Stage Theory. Sustainability 2021, 13, 1468. [Google Scholar] [CrossRef]
- Bevivino, A.; Rapagnani, M.R.; Petta, L.; Sporcati, A.R. Agricoltura e Ambiente, la Qualità dei Suoli, Pesticidi e Contaminanti. FOCUS ENEA. 2020. Available online: https://www.eai.enea.it/archivio/coltivare-la-sostenibilita/agricoltura-e-ambiente-la-qualita-dei-suoli-pesticidi-e-contaminanti.html?tmpl=component&print=1&layout=default (accessed on 10 June 2024).
- Presidenza del Consiglio dei Ministri. Italian Legislative Decree 152/2006. Available online: https://www.normattiva.it/uri-res/N2Ls?urn:nir:stato:decreto.legislativo:2006;152 (accessed on 1 June 2024).
- Pari, L.; Suardi, A.; Santangelo, E.; García-Galindo, D.; Scarfone, A.; Alfano, V. Current and Innovative technologies for pruning harvesting: A review. Biomass Bioenergy 2017, 107, 398–410. [Google Scholar] [CrossRef]
- Solís, A.; Rocha, S.; König, M.; Adam, R.; Garcés, H.O.; Candia, O.; Muñoz, R.; Azócar, L. Preliminary assessment of hazelnut shell biomass as a raw material for pellet production. Fuel 2023, 333, 126517. [Google Scholar] [CrossRef]
- Chen, A.; Liu, X.; Zhang, H.; Wu, H.; Xu, D.; Li, B.; Zhao, C. Influence of pyrolysis temperature on bio-oil produced from hazelnut shells: Physico-chemical properties and antioxidant activity of wood vinegar and tar fraction. J. Renew. Sustain. Energy 2021, 13, 043102. [Google Scholar] [CrossRef]
- Nemecek, T.; Roesch, A.; Bystricky, M.; Jeanneret, P.; Lansche, J.; Stüssi, M.; Gaillard, G. Swiss Agricultural Life Cycle Assessment: A method to assess the emissions and environmental impacts of agricultural systems and products. Int. J. Life Cycle Assess. 2024, 29, 433–455. [Google Scholar] [CrossRef]
- Burke, D.T.; Hynds, P.; Priyadarshini, A. Quantifying farm-to-fork greenhouse gas emissions for five dietary patterns across Europe and North America: A pooled analysis from 2009 to 2020. Resour. Environ. Sustain. 2023, 12, 100108. [Google Scholar] [CrossRef]
- Mulya, K.S.; Zhou, J.; Phuang, Z.X.; Laner, D.; Woon, K.S. A systematic review of life cycle assessment of solid waste management: Methodological trends and prospects. Sci. Total Environ. 2022, 831, 154903. [Google Scholar] [CrossRef] [PubMed]
- Ibáñez-Forés, V.; Pacheco-Blanco, B.; Capuz-Rizo, S.F.; Bovea, M.D. Environmental Product Declarations: Exploring their evolution and the factors affecting their demand in Europe. J. Clean. Prod. 2016, 116, 157–169. [Google Scholar] [CrossRef]
- Pergola, M.; Maffia, A.; Carlucci, G.; Persiani, A.; Palese, A.M.; Zaccardelli, M.; Altieri, G.; Celano, G. An Environmental and Economic Analysis of Strawberry Production in Southern Italy. Agriculture 2023, 13, 1705. [Google Scholar] [CrossRef]
- Temizyurek-Arslan, M. Evaluation of hazelnut production in Türkiye in environment, energy and economy using life cycle assessment approach. Sci. Total Environ. 2023, 892, 164468. [Google Scholar] [CrossRef]
- Maffia, A.; Pergola, M.; Palese, A.M.; Celano, G. Environmental impact assessment of organic vs. integrated olive-oil systems in Mediterranean context. Agronomy 2020, 10, 416. [Google Scholar] [CrossRef]
- Nabavi-Pelesaraei, A.; Sadeghzadeh, A.; Payman, M.H.; Mobtaker, H.G. An analysis of energy use, CO2 emissions and relation between energy inputs and yield of hazelnut production in Guilan province of Iran. Int. J. Adv. Biol. Biomed. Res. 2013, 1, 1601–1613. [Google Scholar]
- Nayeri, M.; Firouzan, A.H.; Azarpour, E. Greenhouse gas emissions for hazelnut production in forest north of Iran. Adv. Environ. Biol. 2014, 8, 289–293. [Google Scholar]
- Sabzevari, A.; Kouchaki-Penchah, H.; Nabavi-Pelesaraei, A. Investigation of life cycle assessment of hazelnut production in Guilan province of IR Iran based on orchards size levels. Biol. Forum. Res. Trend 2015, 7, 807–813. [Google Scholar]
- Volpe, R.; Messineo, S.; Volpe, M.; Messineo, A. Carbon Footprint of Tree Nuts Based Consumer Products. Sustainability 2015, 7, 14917–14934. [Google Scholar] [CrossRef]
- Coppola, G.; Costantini, M.; Fusi, A.; Ruiz-Garcia, L.; Bacenetti, J. Comparative life cycle assessment of conventional and organic hazelnuts production systems in Central Italy. Sci. Total Environ. 2022, 826, 154107. [Google Scholar] [CrossRef] [PubMed]
- Biagetti, E.; Pancino, B.; Martella, A.; La Porta, I.M.; Cicatiello, C.; De Gregorio, T.; Franco, S. Is Hazelnut Farming Sustainable? An Analysis in the Specialized Production Area of Viterbo. Sustainability 2023, 15, 10702. [Google Scholar] [CrossRef]
- Aguilera, E.; Guzmán, G.; Alonso, A. Greenhouse gas emissions from conventional and organic cropping systems in Spain. II. Fruit tree orchards. Agron. Sustain. Dev. 2014, 35, 725–737. [Google Scholar] [CrossRef]
- de Bruyn, S.; Bijleveld, M.; de Graaff, L.; Schep, E.; Schroten, A.; Vergeer, R.; Ahdour, S. Environmental Prices Handbook, EU28 Version; Publication Code: 18.7N54.125; CE Delft: Delft, The Netherlands, 2018; Available online: https://cedelft.eu/publications/environmental-prices-handbook-eu28-version/ (accessed on 10 May 2023).
- EN ISO 14040; Environmental Management, Life Cycle Assessment—Principles and Framework. International Organization for Standardization (ISO): Geneva, Switzerland, 2006.
- EN ISO 14044; Environmental Management, Life Cycle Assessment—Requirements and Guidelines. International Organization for Standardization (ISO): Geneva, Switzerland, 2006.
- Medici, M.; Canavari, M.; Castellini, A. Exploring the economic, social, and environmental dimensions of community-supported agriculture in Italy. J. Clean. Prod. 2021, 316, 128233. [Google Scholar] [CrossRef]
- European Commission. Commission Regulation (EC) No 889/2008 of 5 September 2008 Laying Down Detailed Rules for the Implementation of Council Regulation (EC) No 834/2007 on Organic Production and Labelling of Organic Products with Regard to Organic Production, Labelling and Control. 2008. Available online: https://eur-lex.europa.eu/eli/reg/2008/889/oj (accessed on 5 May 2024).
- MATTM—Ministero delle Politiche. Agricole Alimentari e Forestali, Gruppo Difesa Integrata; Decree of Ministry of Agricultural, Food and Forestry Policies, No. 2722; Istituto Superiore per la Protezione e la Ricerca Ambientale: Rome, Italy, 2008. Available online: https://www.mase.gov.it/sites/default/files/archivio/allegati/vari/manuale_difesa_integrata_2015.pdf (accessed on 9 September 2023).
- Piccolo, D. Statistica per le Decisioni; Il Mulino: Bologna, Italy, 2020. [Google Scholar]
- Pergola, M.; Persiani, A.; Pastore, V.; Palese, A.M.; Arous, A.; Celano, G. A comprehensive life cycle assessment (LCA) of three apricot orchard systems located in Metapontino area (Southern Italy). J. Clean. Prod. 2017, 142, 4059–4071. [Google Scholar] [CrossRef]
- Maffia, A.; Palese, A.M.; Pergola, M.; Altieri, G.; Celano, G. The Olive-Oil Chain of Salerno Province (Southern Italy): A Life Cycle Sustainability Framework. Horticulturae 2022, 8, 1054. [Google Scholar] [CrossRef]
- Bouwman, A.E. Compilation of a Global Inventory of Emissions of Nitrous Oxide. Ph.D. Thesis, University of Wageningen, Wageningen, The Netherlands, 1995. [Google Scholar]
- Brentrup, F.; Küsters, J.; Lammel, J.; Kuhlmamm, H. Methods to estimate on field nitrogen emissions from crop production as an input to LCA studies in the agricultural sector. Int. J. Life Cycle Assess. 2000, 5, 349–357. [Google Scholar] [CrossRef]
- IPCC: Intergovernmental Panel on Climate Change. Guidelines for National Greenhouse Gas Inventories, vol. 11. Agriculture, Forestry and Other Land Use, USA. 2006. Available online: https://www.ipcc.ch/site/assets/uploads/2018/02/ipcc_wg3_ar5_chapter11.pdf (accessed on 18 September 2023).
- Hauschild, M.Z. Estimating pesticide emissions for LCA of agricultural products. In Agricultural Data for Life Cycle Assessments; Weidema, B.P., Meeusen, M.J.G., Eds.; LCA Net Food: The Hague, The Netherlands, 2000; Volume 2, pp. 64–79. [Google Scholar]
- Ecoinvent Version 3. 2013. Available online: https://support.ecoinvent.org/ecoinvent-version-3.0 (accessed on 20 December 2023).
- Mohamad, R.S.; Verrastro, V.; Al Bitar, L.; Roma, R.; Moretti, M.; Al Chami, Z. Effect of different agricultural practices on carbon emission and carbon stock in organic and conventional olive systems. Soil. Res. 2017, 54, 173–181. [Google Scholar] [CrossRef]
- Montemayor, E.; Andrade, E.P.; Bonmati, A.; Antòn, A. Critical analysis of life cycle inventory datasets for organic crop production systems. Int. J. Life Cycle Assess. 2022, 27, 543–563. [Google Scholar] [CrossRef]
- Huijbregts, M.A.J.; Steinmann, Z.J.N.; Elshout, P.M.F.; Stam, G.; Verones, F.; Vieira, M.; Zijp, M.; Hollander, A.; van Zelm, R. ReCiPe2016: A harmonized life cycle impact assessment method at midpoint and endpoint level. Int. J. Life Cycle Asses. 2017, 22, 138–147. [Google Scholar] [CrossRef]
- IPCC. Climate Change 2013: The Physical Science Basis; Contribution of Working Group I to the Fifth Assessment Report of the Intergovernmental Panel on Climate Change; Cambridge University Press: Cambridge, UK, 2013. [Google Scholar]
- Andreae, M.O. Emission of trace gases and aerosols from biomass burning—An updated assessment. Atmos. Chem. Phys. 2019, 19, 8523–8546. [Google Scholar] [CrossRef]
- Andreae, M.O. Biomass Burning Emission Factors. 2021. Available online: https://edmond.mpdl.mpg.de/imeji/collection/op2vVE8m0us_gcGC (accessed on 15 May 2024).
- Ronchini, O. Impatto ambientale, sociale ed economico degli impianti a biomassa: Confronto tra impianti e metodologie di analisi differenti. Tesi di laurea in Valorizzazione delle risorse primarie e secondarie LS. Alma Mater Studiurum Università degli studi di Bologna. A.A. 2009–2010. Available online: https://amslaurea.unibo.it/1677/1/ronchini_ornella_tesi.pdf.pdf (accessed on 15 May 2024).
- D’Ammaro, D.; Capri, E.; Valentino, F.; Grillo, S.; Fiorini, E.; Lamastra, L. Benchmarking of carbon footprint data from the Italian wine sector: A comprehensive and extended analysis. Sci. Total Environ. 2021, 77920, 146416. [Google Scholar] [CrossRef]
- Pergola, M.; Palese, A.M.; Persiani, A.; De Francesco, P.; Cirillo, C.; Giacca, G.M.; Maffia, A.; Celano, G. Mediterranean Cropping Systems: The Importance of Their Economic and Environmental Sustainability. Adv. Environ. Eng. Res. 2021, 2, 4. [Google Scholar] [CrossRef]
- Salvaterra, M. Le Nuove Tecnologie Nell’agricoltura e le Opportunità per L’innovazione. Agraria.org. 2024. Available online: https://www.rivistadiagraria.org/news/le-nuove-tecnologie-nellagricoltura-le-opportunita-linnovazione/ (accessed on 18 June 2024).
- Bureau, J.C.; Mahé, L.P. Cap payments after 2013 and rural public goods. Quest. Agrar.—Riv. dell’Associazione Rossi-Doria 2009, 4. [Google Scholar] [CrossRef]
- Zahrnt, V.; Public Money for Public Goods: Winners and Losers from Cap Reform. European Centre for International Political Economy. 2009. Available online: http://www.jstor.org/stable/resrep00114. (accessed on 9 July 2024).
- Frascarelli, A. L’evoluzione della Pac e le imprese agricole: Sessant’anni di adattamento. Agriregionieuropa 2017, 50. Available online: https://agriregionieuropa.univpm.it/it/content/article/31/50/levoluzione-della-pac-e-le-imprese-agricole-sessantanni-di-adattamento (accessed on 1 June 2024).
- European Commission. La Politica Agricola Comune: 2023–2027. 2020. Available online: https://agriculture.ec.europa.eu/common-agricultural-policy/cap-overview/cap-2023-27_it (accessed on 5 May 2024).
- A.A.V.V. Progetto Biomasse Enama. Parte 1 Biomasse ed Energia—Capitolo 1 Caratteristiche Tecniche delle Biomasse e dei Biocombustibili. 2008. Available online: https://www.progettobiomasse.it/it/pdf/studio/p1c1.pdf (accessed on 10 July 2024).

Disclaimer/Publisher’s Note: The statements, opinions and data contained in all publications are solely those of the individual author(s) and contributor(s) and not of MDPI and/or the editor(s). MDPI and/or the editor(s) disclaim responsibility for any injury to people or property resulting from any ideas, methods, instructions or products referred to in the content. |
© 2024 by the authors. Licensee MDPI, Basel, Switzerland. This article is an open access article distributed under the terms and conditions of the Creative Commons Attribution (CC BY) license (https://creativecommons.org/licenses/by/4.0/).