Article

Analysis of Synergistic Drivers of CO2 and NOX Emissions from Thermal Power Generating Units in Beijing–Tianjin–Hebei Region, 2010–2020

1
College of Chemistry, Zhengzhou University, Zhengzhou 450001, China
2
Research Center for Emission Trading and Reduction, Chinese Academy of Environmental Planning, Beijing 100012, China
3
Zhejiang Ecological Environment Low-Carbon Development Center, Hangzhou 310007, China
4
Chinese Research Academy of Environmental Sciences, Beijing 100012, China
5
Eco-Environment Low Carbon Development Center of Inner Mongolia, Hohhot 010011, China
*
Authors to whom correspondence should be addressed.
Sustainability 2024, 16(17), 7554; https://doi.org/10.3390/su16177554 (registering DOI)
Submission received: 2 July 2024 / Revised: 16 August 2024 / Accepted: 21 August 2024 / Published: 31 August 2024

Abstract

:
Synergistic control of the emissions of air pollutants and CO2 is critical to the dual challenges of air quality improvement and climate change in China. Based on the emission inventories of thermal power units in Beijing, Tianjin, and Hebei, this study analyzes the CO2 and NOX emission characteristics of these units, and identifies and quantifies the synergistic drivers affecting these emission trends. The inventory data show that, between 2010 and 2020, NOX emissions were reduced by 86.1%, while CO2 emissions were reduced by only 29.8%. Although significant progress has been made in reducing NOX emissions through measures such as end-of-pipe treatment, controlling CO2 emissions remains a difficult task. The index decomposition analysis reveals that economic growth is the main driver of CO2 and NOX emission growth, energy intensity reduction is the main driver of CO2 emission reduction, and end-of-pipe treatment is the main driver of NOX emission reduction. Currently, coal occupies about 87% of the energy consumption of thermal power units in the Beijing–Tianjin–Hebei region, and remains the main type of energy for synergistic emissions, and the potential for emission reduction in the energy structure remains huge. For NOX emissions, it is expected that 90% of the reduction potential can be achieved through energy restructuring and end-of-pipe treatment. In conclusion, this high-precision unit-by-unit emission study confirms the effectiveness of the control policy for thermal power units in the region and provides some scientific reference for future policy formulation.

1. Introduction

China faces the dual challenges of improving air quality and addressing climate change [1,2,3]. The thermal power sector is an important emitter of CO2 and air pollutants in China [4,5]. Due to the application of large-scale desulphurization and dust removal facilities, SO2 and particulate matter in the thermal power generation industry have been significantly controlled [6,7,8], but CO2 and NOX emissions are still high [9]. Of these, the NOX emission load is huge, active, and characterized by the cross-regional transmission of environmental impacts [10], and is also a key precursor leading to PM2.5 and O3 pollution [11,12], which is a serious threat to human health [13]. According to data from the National Pollution Source Census, coal-fired power plants, as China’s largest energy-consuming sector [14], accounted for about 47% of the country’s total NOX emissions in 2010, and about 42.5% of the country’s total CO2 emissions in 2020. Therefore, it is important to carry out long time-series NOX and CO2 emission characterization and driver analysis in the power sector to synergistically address climate change and air quality improvement. The Beijing–Tianjin–Hebei region, with its high energy consumption, high population density, and long heating season, is the most polluted region in China, and is also the key urban agglomeration area for air pollution prevention and control in China. The pollutant emission intensity per unit area in the Beijing–Tianjin–Hebei region is close to four times the national average [15]. Therefore, identifying and quantifying the synergistic drivers of historical CO2 and NOX emission reductions from thermal power generation in the Beijing–Tianjin–Hebei region will not only be valuable for the subsequent in-depth treatment and reduction of pollutants and CO2 emissions from China’s power plants, but will also provide a reference for the region to sustainably improve its air quality and to contribute to the realization of the goals of a “Beautiful China” and a “Dual-Carbon” approach.
Highly precise emission inventories of coal-fired power plants are the basis for assessing the effectiveness of pollution reduction and carbon control. There are few studies of CO2 and NOX emissions based on unit-level long time series. Mostly single pollutants are studied on a national or regional scale using provincial macro-measurements of energy consumption [16]. By assessing facility-level synergies at specific source locations in China, Wang Pu et al. [17] found significant spatial differences in the synergies of emission reductions in China’s coal and power sectors, and suggested that emission reduction measures should be tailored to local conditions and precise policies should be formulated in relation to carbon pricing. By combining information on China’s power plants from 2010–2015, Tong dan et al. [18] found that NOX emissions decreased by 45% while CO2 emissions increased by 15%, and explored various emission reduction pathways for power plants from a macro perspective. Zhang Hongyu et al. [19] used the Kaya equation and LMDI decomposition to analyze the evolution of Beijing’s electricity carbon emissions and the factors affecting them, and found that Beijing’s thermal power carbon emissions showed an overall decreasing trend and the source of emissions shifted from raw coal to natural gas. Although the above studies provide information and direction for the development of carbon emission reduction programs for the electric power industry at the macro level, the summarized results do not quantify the contribution of synergistic emission reduction drivers in specific regions, and there is a lack of synergistic emission analyses for a specific type of air pollutant and CO2, which makes it difficult to translate into specific implementable policies. Although population growth and economic growth are widely regarded as key factors contributing to CO2 emissions, the uneven development across different regions in China results in varying impacts on carbon emissions. In addition, there are even fewer studies on the estimation of bottom-up synergistic emissions of CO2 and NOX and the quantification of the contribution of the synergistic emission factors of the two on the basis of thermal power generating units. To address this gap, we developed an interdisciplinary approach to assess the synergistic benefits of site-specific unit-level emissions.
Structural Decomposition Analysis (SDA) [20,21] and Exponential Decomposition Analysis (IDA) [22] are commonly used to study the drivers of CO2 emissions. SDA is generally supported by input–output table data, which have a large time horizon and are not conducive to in-depth research. IDA is based on aggregated data from various industries and is more suitable for time-series analysis [23]. Currently, the Log Mean Divisia Index (LMDI) has become the most popular method in IDA because it has no unexplained residuals, the mathematical feature that ensures the independence of the decomposition results, avoids potential problems such as multiple covariance and endogeneity issues, and can deal with zero and negative values [24]. Therefore, the LMDI method has been widely used in decomposition analysis for changes in CO2 emissions. To address the issue of synergistic emission of CO2 and NOX from thermal power units, we collected data on the basic information, activity level, and control technology of each thermal power unit in Beijing–Tianjin–Hebei region thermal power plants from 2010 to 2020, based on which we established a methodology for calculating the emission of CO2 and NOX from coal-fired power plants and compiled an emission inventory of CO2 and NOX. Finally, the Log Mean Divisia Index (LMDI) was applied to decompose the CO2 emissions and NOX emissions of the power plant, and the emission contribution rate of each influencing factor was calculated, evaluating the effect of the CO2 and NOX of thermal power units influenced by five factors, namely, emission coefficients (end-of-pipe treatment), energy structure, energy intensity, per capita GDP, and population. It also identifies the synergistic drivers of emissions by studying the drivers in different years and between different fuel types, with a view to better providing certain references for the policy-making authorities and effective information for the formulation of the next policy measures for emission reduction in China’s power sector.

2. Materials and Methods

2.1. Methodology for Calculation of Emission Inventories

Based on the basic information, process type, activity level, emission factors, end-of-pipe treatment, and other data of each thermal power unit in the Beijing–Tianjin–Hebei region from 2010 to 2020, an emission database covering all coal-fired units in the region (including stand-alone thermal power plant units, purely condensing coal-fired power generating units in captive power plants, and combined heat and power generating units) has been set up by adopting a bottom-up approach. Detailed NOX and CO2 emission inventories were prepared by measuring CO2 and NOX emissions on a unit-by-unit basis (472 coal-fired units in service in 2010 and 328 coal-fired units in service in 2020). To ensure a comprehensive understanding of CO2 and NOX emission trends, different fuel types were analyzed. Thermal power unit CO2 and NOX emissions were measured mainly based on coal consumption, emission coefficients, and end-of-pipe treatment.

2.1.1. Calculation of CO2 Emissions

Due to the lack of official data on CO2 emissions, we account for CO2 emissions from thermal power generating units in the Beijing–Tianjin–Hebei region through unit energy consumption data combined with the “Technical Guidelines for Converged Emission Inventories of Air Pollutants and Greenhouse Gases” (2024) [25]. The formula is shown below:
C = i F C i × E F i
where i is the type of energy; FC (expressed in terms of standard coal consumption) is the energy consumption in 104 t; and EF is the CO2 emission coefficients in 104 t of CO2/104 t of energy, i.e., the amount of CO2 produced by combustion of a unit of energy. The energy consumption of thermal power units in the Beijing–Tianjin–Hebei region is mainly based on coal and natural gas, supplemented by oil. In order to facilitate the calculation, and taking into account the limited availability of energy, the energy is divided into 17 categories, as shown in Table 1.
Since EF is usually expressed in terms of carbon content per unit of calorific value, it is necessary to convert different types of energy consumption into calorific units, taking into account the carbon content and carbon oxidation rate, and subsequently determining the EF by the following equation:
E F i = N C V i × C C i × O F i × 44 12
NCV denotes the average low-level heating value of fossil fuels (PJ/104 t, PJ/108 m3); CC denotes the carbon content per unit calorific value of fossil fuels (t C/TJ); OF denotes the carbon oxidation rate of fossil fuels (%) (the percentage of carbon in the fuel that is completely oxidized during combustion; since different types of fuels are burned in different ways, research data are preferred, and where research data are difficult to obtain, the values recommended in this guide are used); and 44/12 denotes the ratio of the molecular mass of carbon in CO2.

2.1.2. Calculation of NOX Emissions

Measured according to energy consumption, NOX removal rate, denitrification efficiency, and in conjunction with the Technical Guidelines for Convergence of Air Pollutant and Greenhouse Gas Emission Inventories (2024). The formula for measuring NOX emissions from coal-fired units is as follows:
E i = M i × p f i × ( 1 ξ i ) × ( 1 η i ) × 10
where i denotes the ith unit; M denotes the coal consumption of the unit during the accounting period (104 t); pf denotes the unit’s pollution production intensity kg/t; ξ denotes the NOX removal efficiency improved after the low-NOX combustion retrofit relative to the pre-low-NOX combustion; and ξ is determined by the following equation:
ξ i = C p r e - r e m o d e l i n g C a f t e r   r e m o d e l i n g C p r e - r e m o d e l i n g
In the formula, C p r e - r e m o d e l i n g indicates the average NOX concentration before the unit undergoes low-NOX combustion technology retrofit, mg/Nm3; C a f t e r   r e m o d e l i n g denotes the average concentration of NOX after the unit undergoes low-NOX combustion technological transformation; and η denotes the comprehensive denitrification efficiency of the unit after the denitrification facilities have been stably operated during the accounting period.

2.2. Driver Decomposition Methods

Considering the possible correlations among the driving factors, we used the Log Mean Divisia Index (LMDI) to decompose the effects of each factor on the emission trends of CO2 and NOX in the Beijing–Tianjin–Hebei region.
Many factors such as the level of economic development, energy consumption, end-of-pipe treatment, etc. will have a large impact on CO2 and NOX emissions from power plants. Therefore, in order to better understand the variables of CO2 and NOX emissions, we take 2010 as the base period and, based on the energy consumption of thermal power generating units in the Beijing–Tianjin–Hebei region from 2010 to 2020, we decompose the CO2 and NOX emissions into five factors, namely, emission coefficients, energy structures, energy intensity, per capita GDP, and population [26], and analyze the impacts of carbon emissions as well as NOX emissions on thermal power generating units in the Beijing–Tianjin–Hebei region in terms of these five dimensions, based on the Log Mean Divisia Index (LMDI) aspects to analyze the impact of carbon emission as well as NOX emission from thermal power generating units. The decomposition formula for total emissions is as follows:
C i t = i C i t E i t × E i t E t × E t G t × G t P t × P t = i E F i t × E S i t × E I t × A t × P t
where i denotes the type of energy; t denotes the year; C denotes the total carbon emissions or total NOX emissions (unit: 104 t); E is the energy consumption; E i t and E t are the consumption of the ith type of energy and the total energy consumption (unit: 104 t); G is the gross domestic product (unit: CNY 104); P represents the total population (unit: 104 people); EF represents the emission coefficients (end-of-pipe treatment); ES = E i /E is the energy structure influence factor; EI = E/G is the energy intensity influence factor; A is the per capita GDP influence factor; and P is the population influence factor. Since the EF for CO2 is relatively consistent between two neighboring years, its effect is negligible. However, for NOX emissions, the EF responds to the impact of end-of-pipe treatment. In order to calculate the difference between carbon emissions as well as NOX emissions in two consecutive years, the decomposition and summation equations are obtained as follows:
Δ C t , t 1 = C t C t 1 = C E F + C E S + C E I + C A + C P
where C E F represents CO2 emission efficiency or the NOX end-of-pipe treatment; C E S represents the change in CO2 and NOX emissions due to energy structure; C E I represents the change in CO2 and NOX emissions due to energy intensity; C A represents changes in CO2 and NOX emissions due to per capita GDP; and C p represents changes in CO2 and NOX emissions due to population. Based on the LMDI summation equation, the cumulative emission reduction effect of each factor on CO2 and NOX was calculated as follows:
C X = i C i t C i t 1 ln C i t ln C i t 1 × ln X i t X i t 1
where X represents the individual influencing factors.

2.3. Data Acquisition

Based on the basic information of each unit in the 2010–2020 total emission reduction data of the Beijing–Tianjin–Hebei region, and combined with the on-site research in previous years, this database is established, as shown in Table 2 and Table 3. GDP and population data are obtained from the “Statistical Yearbook” [27]. In addition, energy consumption data were converted to coal equivalent to facilitate comparison between different energies.

3. Results

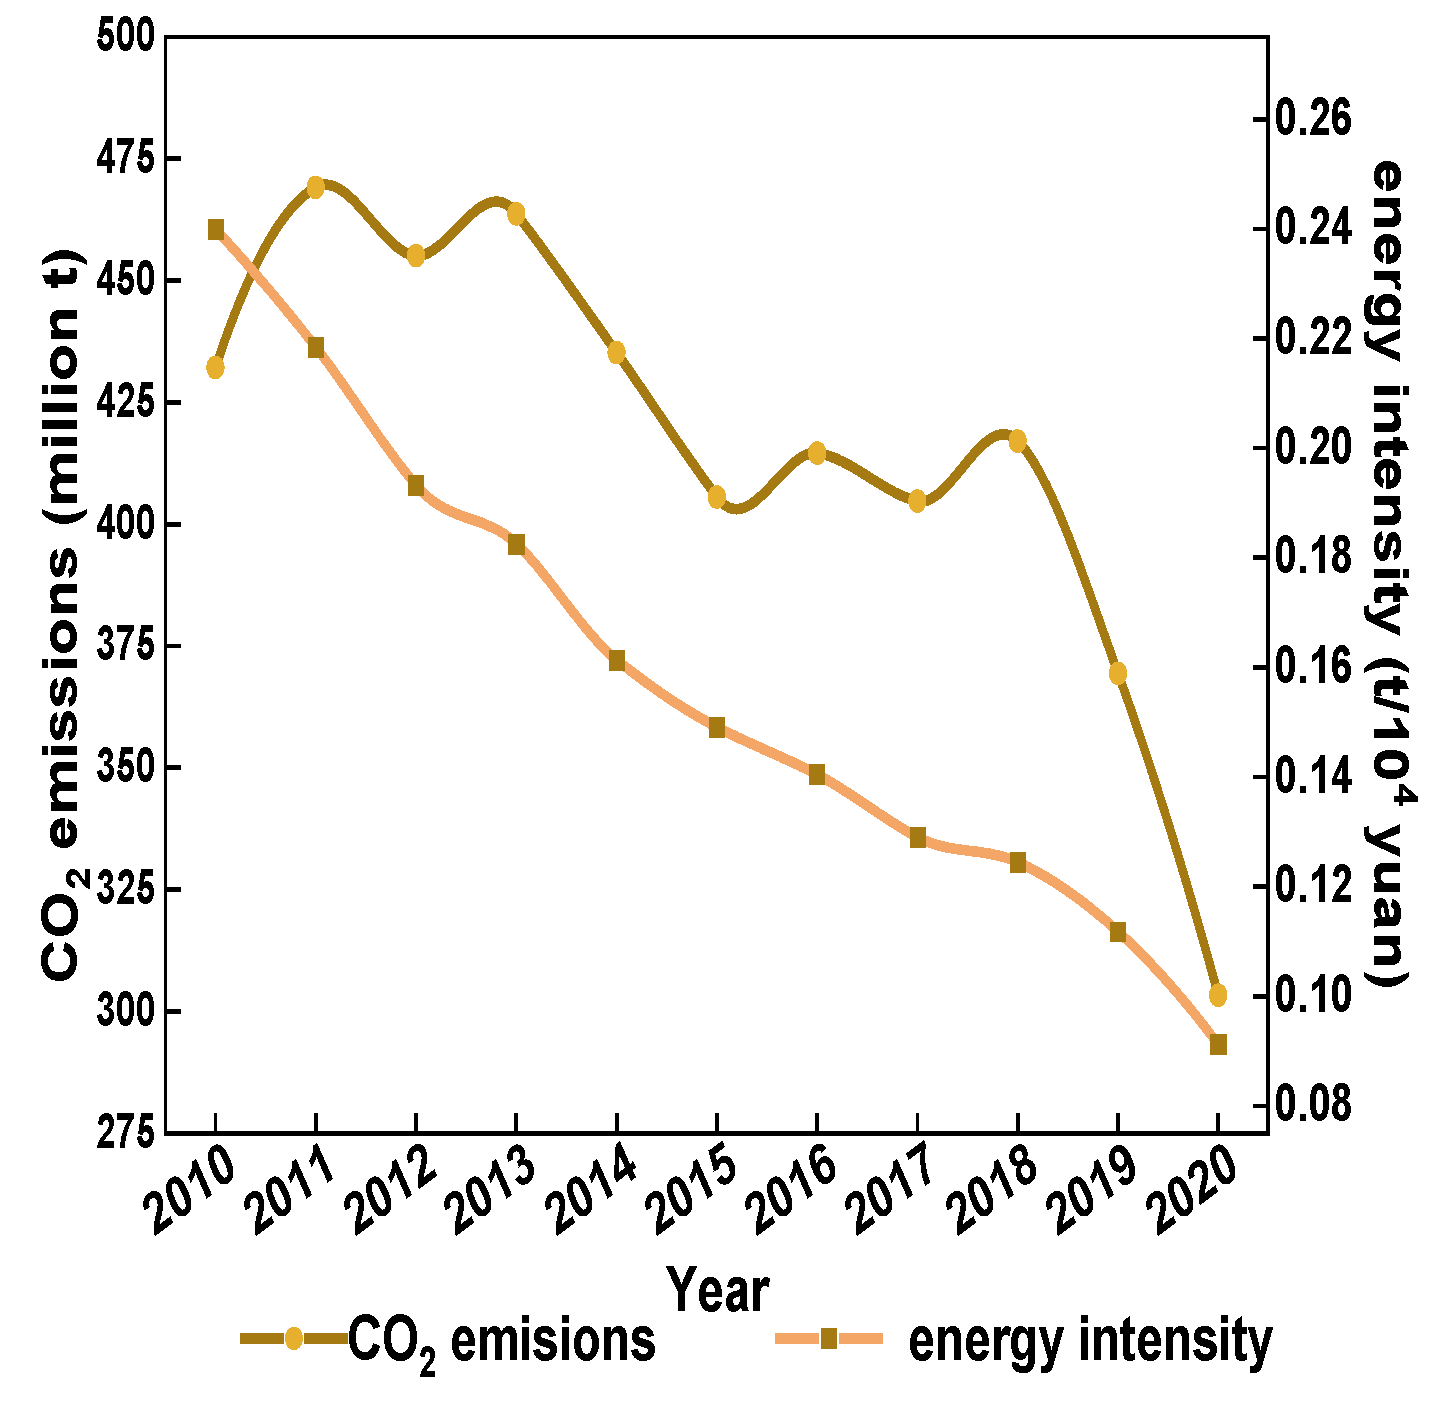
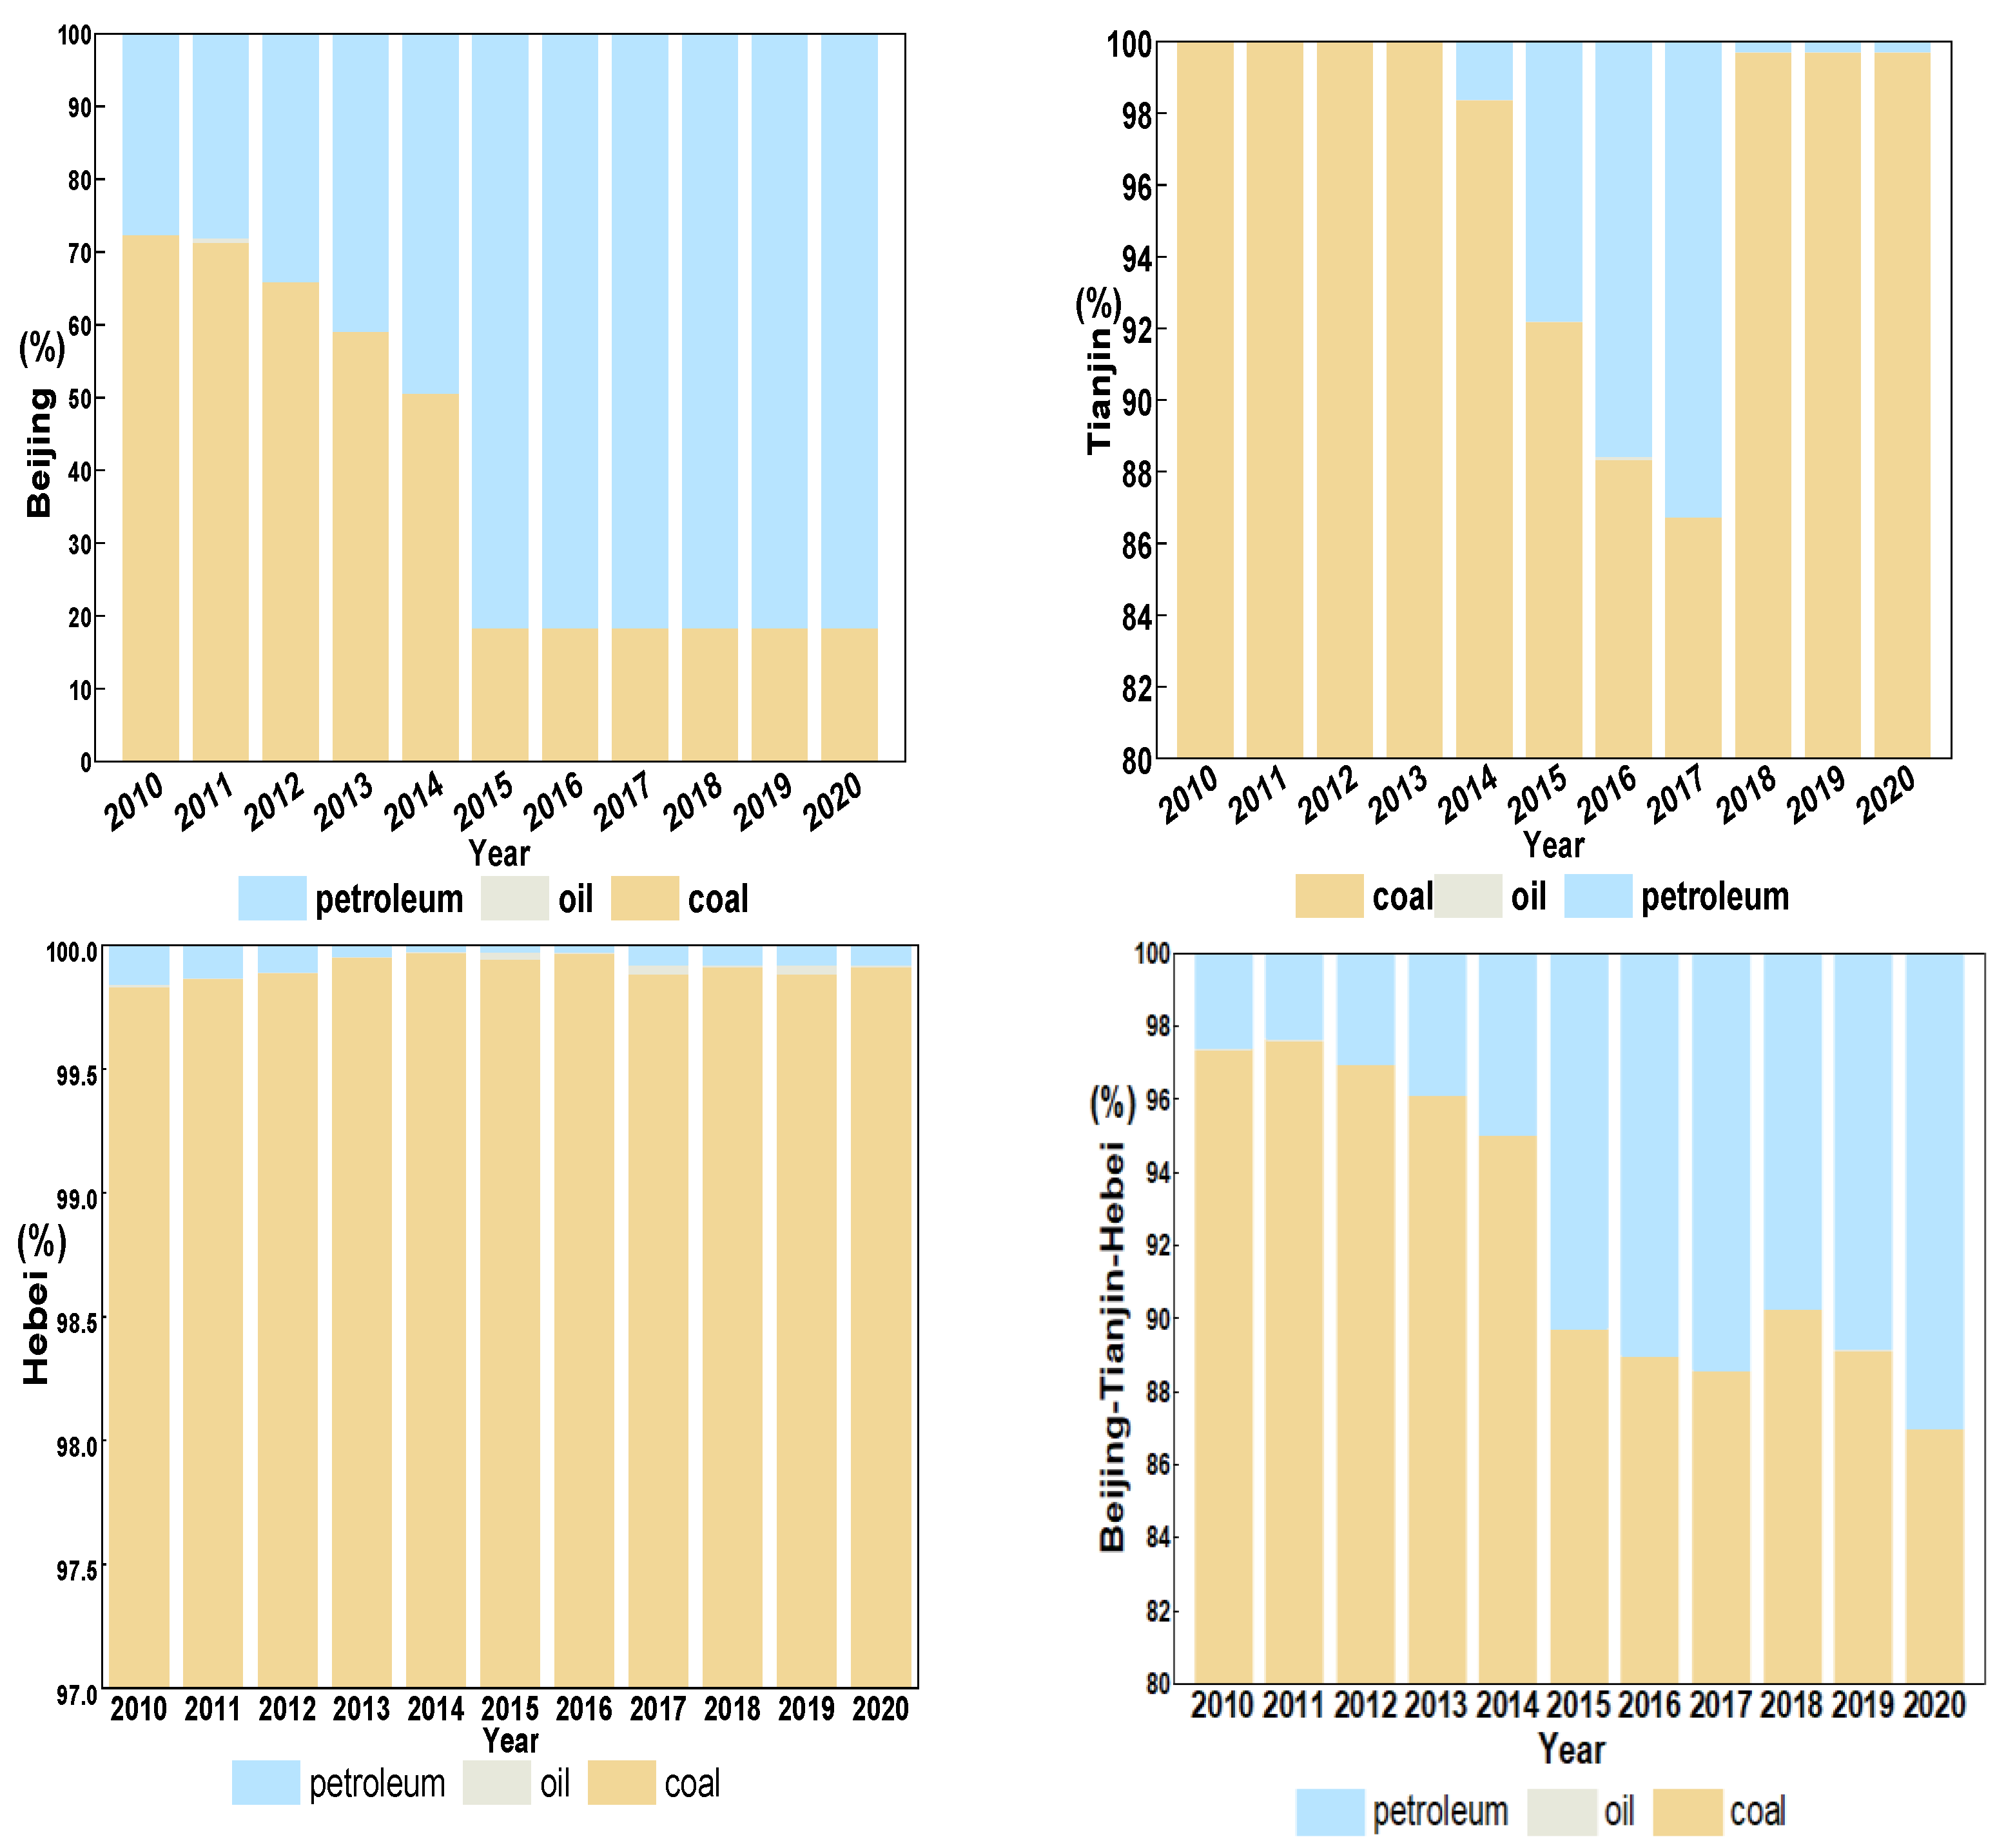
3.1. Trends in CO2 and NOX Emissions

In this study, a comprehensive emission database of all coal-fired units in the Beijing–Tianjin–Hebei region was established, and long time-series CO2 and NOX emission inventories were compiled for about 200 power plants and nearly 500 units in the region for the period 2010–2020. Figure 1 summarizes the annual installed capacity of thermal power units in the Beijing–Tianjin–Hebei region, the capacity of denitrification units, energy use, power generation, and emissions from 2010 to 2020.
As shown in Figure 1a,e, there were 472 thermal power units in the Beijing–Tianjin–Hebei region in 2010, with a total installed capacity of 5289.8 × 104 KW and a total generating capacity of 2764.9 hundred million kwh. With the increasing demand for power generation, the installed capacity of thermal power units is growing at an average rate of 2.2% per year, while the installed capacity of denitrification is also increasing continuously. By 2020, there will be 328 thermal power units in the Beijing–Tianjin–Hebei region, with a total installed capacity of 6454.7 × 104 KW and a generating capacity of 2580.3 hundred million kwh. This changing trend is mainly due to the fact that the Beijing–Tianjin–Hebei region is one of the largest and most dynamic economic regions in northern China, with rapid economic development and increasing population concentration, leading to a huge demand for energy consumption. But coal consumption decreased from 105 million t in 2010 to 79 million t in 2020, a 25% reduction (as shown in Figure 1b). This trend is mainly due to the implementation of a series of clean energy transformation policies in the Beijing–Tianjin–Hebei region around 2010, such as the “coal-to-gas-to-electricity” policy, as well as the development of hydropower and solar power. The implementation of these policies has not only reduced coal consumption but had also led to a reduction in standard coal consumption for thermal power generation. The amount of standard coal consumed by thermal power units in the Beijing–Tianjin–Hebei region for power generation had decreased from 376.5 g/kwh in 2010 to 295.7 g/kwh in 2020, which is still 3.3% lower than the amount of standard coal consumed by thermal power plants of 6000 kw and above nationwide for power generation in 2020. As shown in Figure 1b, the amount of standard coal consumed for power generation in the Beijing–Tianjin–Hebei region has been reduced by 21.5% over the past 10 years. However, it increased by 9 million t, 3 million t, 3 million t, and 2 million t in 2011, 2013, 2016, and 2018, respectively. It is worth mentioning that Beijing, as the capital of China, enforces more stringent environmental requirements and standards [28]. According to the “Beijing Electricity Development Plan for the Eleventh Five-Year Plan Period” [29], between 2010 and 2020, Beijing’s energy structure of power generation has undergone significant restructuring. By the end of the 11th Five-Year Plan period, compared with the end of 2005, the proportion of installed power generation from coal-fired power plants had decreased to 41.68%, the proportion of installed power generation from new and renewable energy power plants had increased by 6.25%, the proportion of natural gas had increased from zero in 2005 to 28.22%, and the scale of green power transferred from outside had increased from 45 hundred million kwh in 2015 to 145.6 hundred million kwh in 2020. This indicates that Beijing is actively expanding its sources of renewable energy and reducing its dependence on fossil fuels [30]. As a result, Beijing’s standard coal consumption for power generation in 2020 will only be 289.6 g/kwh. CO2 emissions from thermal power units in the Beijing–Tianjin–Hebei region did not change much, with an overall decreasing trend from 0.432 billion t in 2010 to 0.303 billion t in 2020, a decrease of 29.8%, reaching a peak of 0.469 billion t in 2011. In the time series, CO2 emission trends are similar to energy consumption trends. However, per capita GDP has been increasing year by year over the past 10 years, from CNY 41,900 in 2010 to CNY 78,300, with an average annual growth rate of 6.55%. In contrast to CO2 emissions, NOX emissions are significantly lower. As shown in Figure 1d, total NOX emissions peaked in 2011 and then declined every year. From 2010 to 2020, NOX emissions were reduced by 80.2 × 10⁴ t, a reduction of 86.1%. The maximum annual reduction of 23.5 × 10⁴ t was reached during 2013–2014. This is due to the fact that less action was taken on NOX emissions before 2010, and that a 10% reduction in NOX emissions was set for the first time during the 12th Five-Year Plan [31]. Moreover, the implementation of “Ten Articles of the Atmosphere”, “Three-Year Action Plan for Winning the Battle for the Blue Sky”, and related supporting measures has led to significant NOX emission reduction in the Beijing–Tianjin–Hebei region, with an ultra-low emission retrofit contributing to 40% of the NOX emission reduction. The “Upgrading and Action Plan for Energy Saving and Emission Reduction of Coal Power (2014–2020)” [32] even limits NOX emission concentration to 50 mg/m3. The proportion of installed denitrification capacity has increased from 17.2% to 99.8% in this decade, which is also an important reason for the reduction in NOX emissions in the 12th Five-Year Plan. Despite a 6.7% reduction in power generation, coal consumption was reduced by 33% as older units were phased out and new units were built. This shows that the new units have higher combustion technology and proves the necessity and science of retiring old units to build new ones [33]. During the period 2010–2020, the economy of the Beijing–Tianjin–Hebei region was developed, but the emission of CO2 and NOX from thermal power units was effectively controlled. Thanks to the 12th Five-Year Plan and 13th Five-Year Plan, the Beijing–Tianjin–Hebei region has changed its development model and implemented measures for economic restructuring and energy restructuring [34].

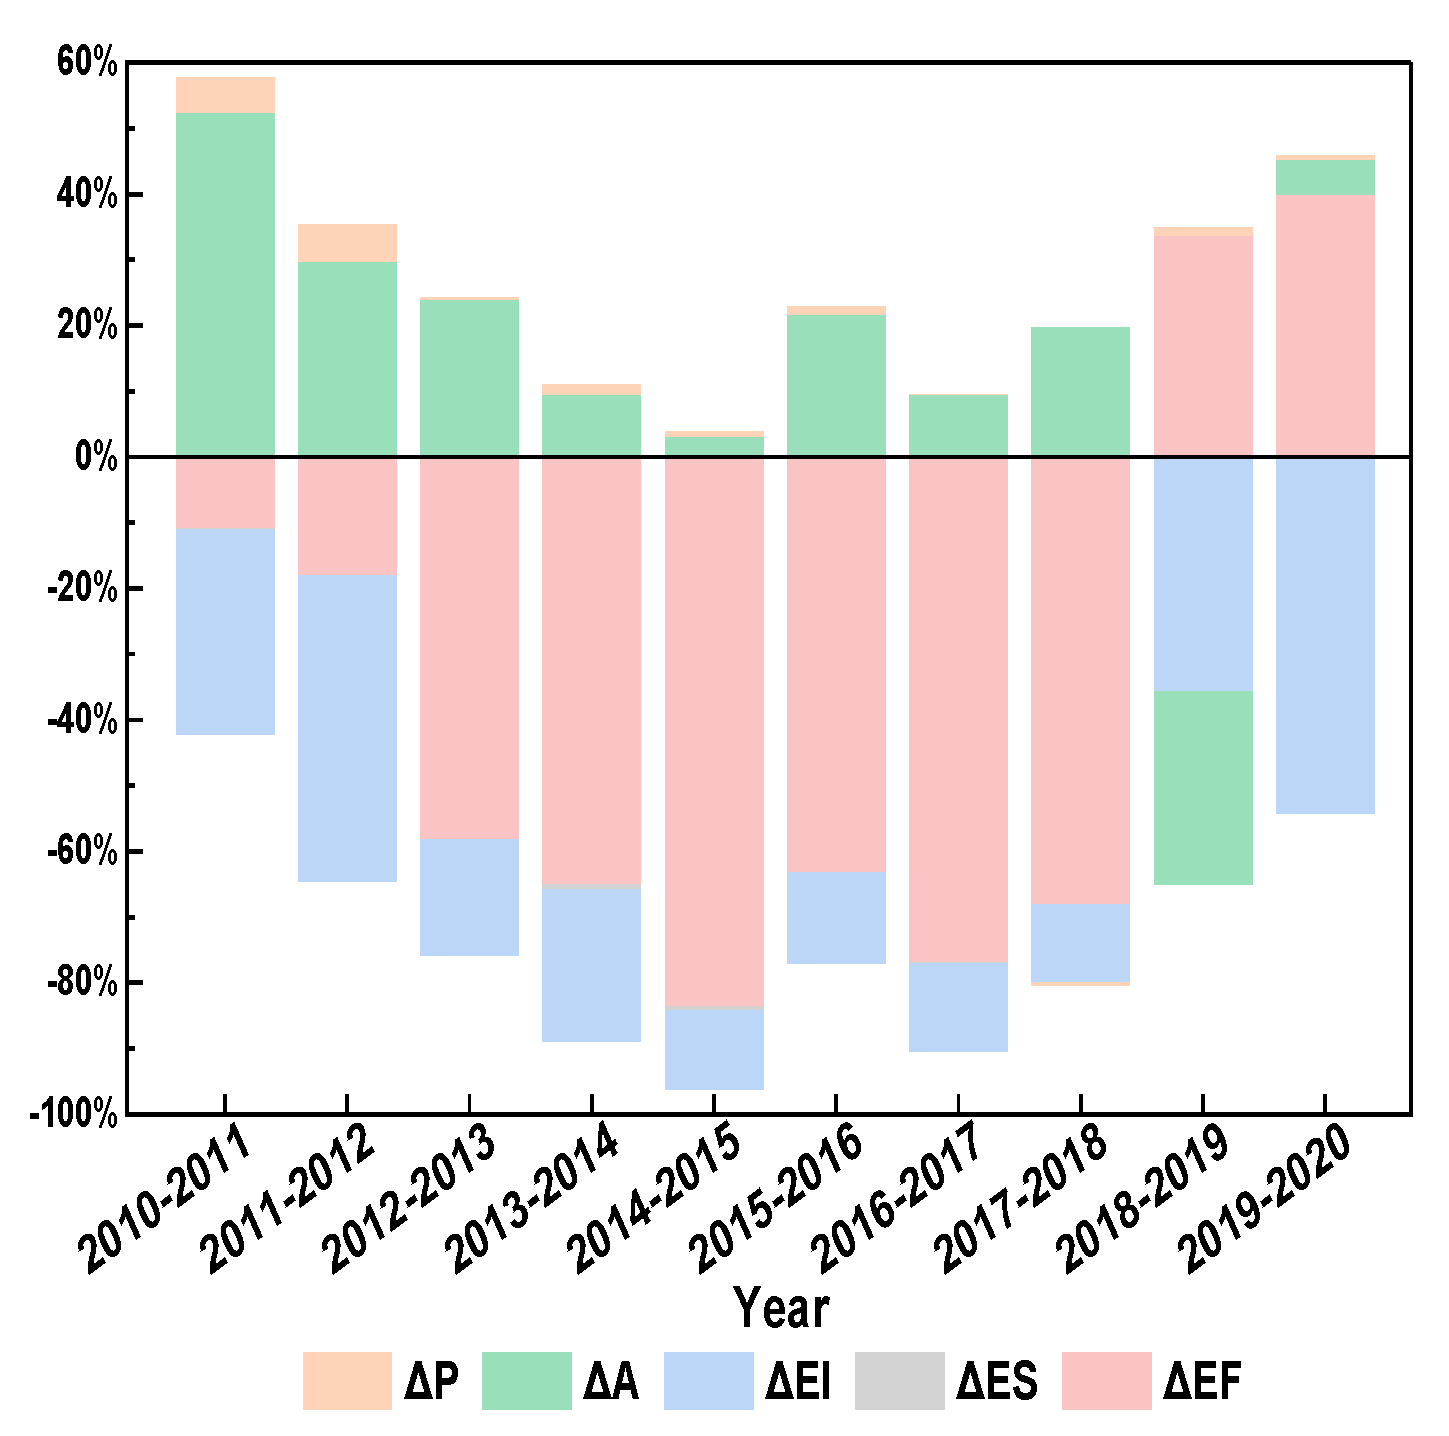
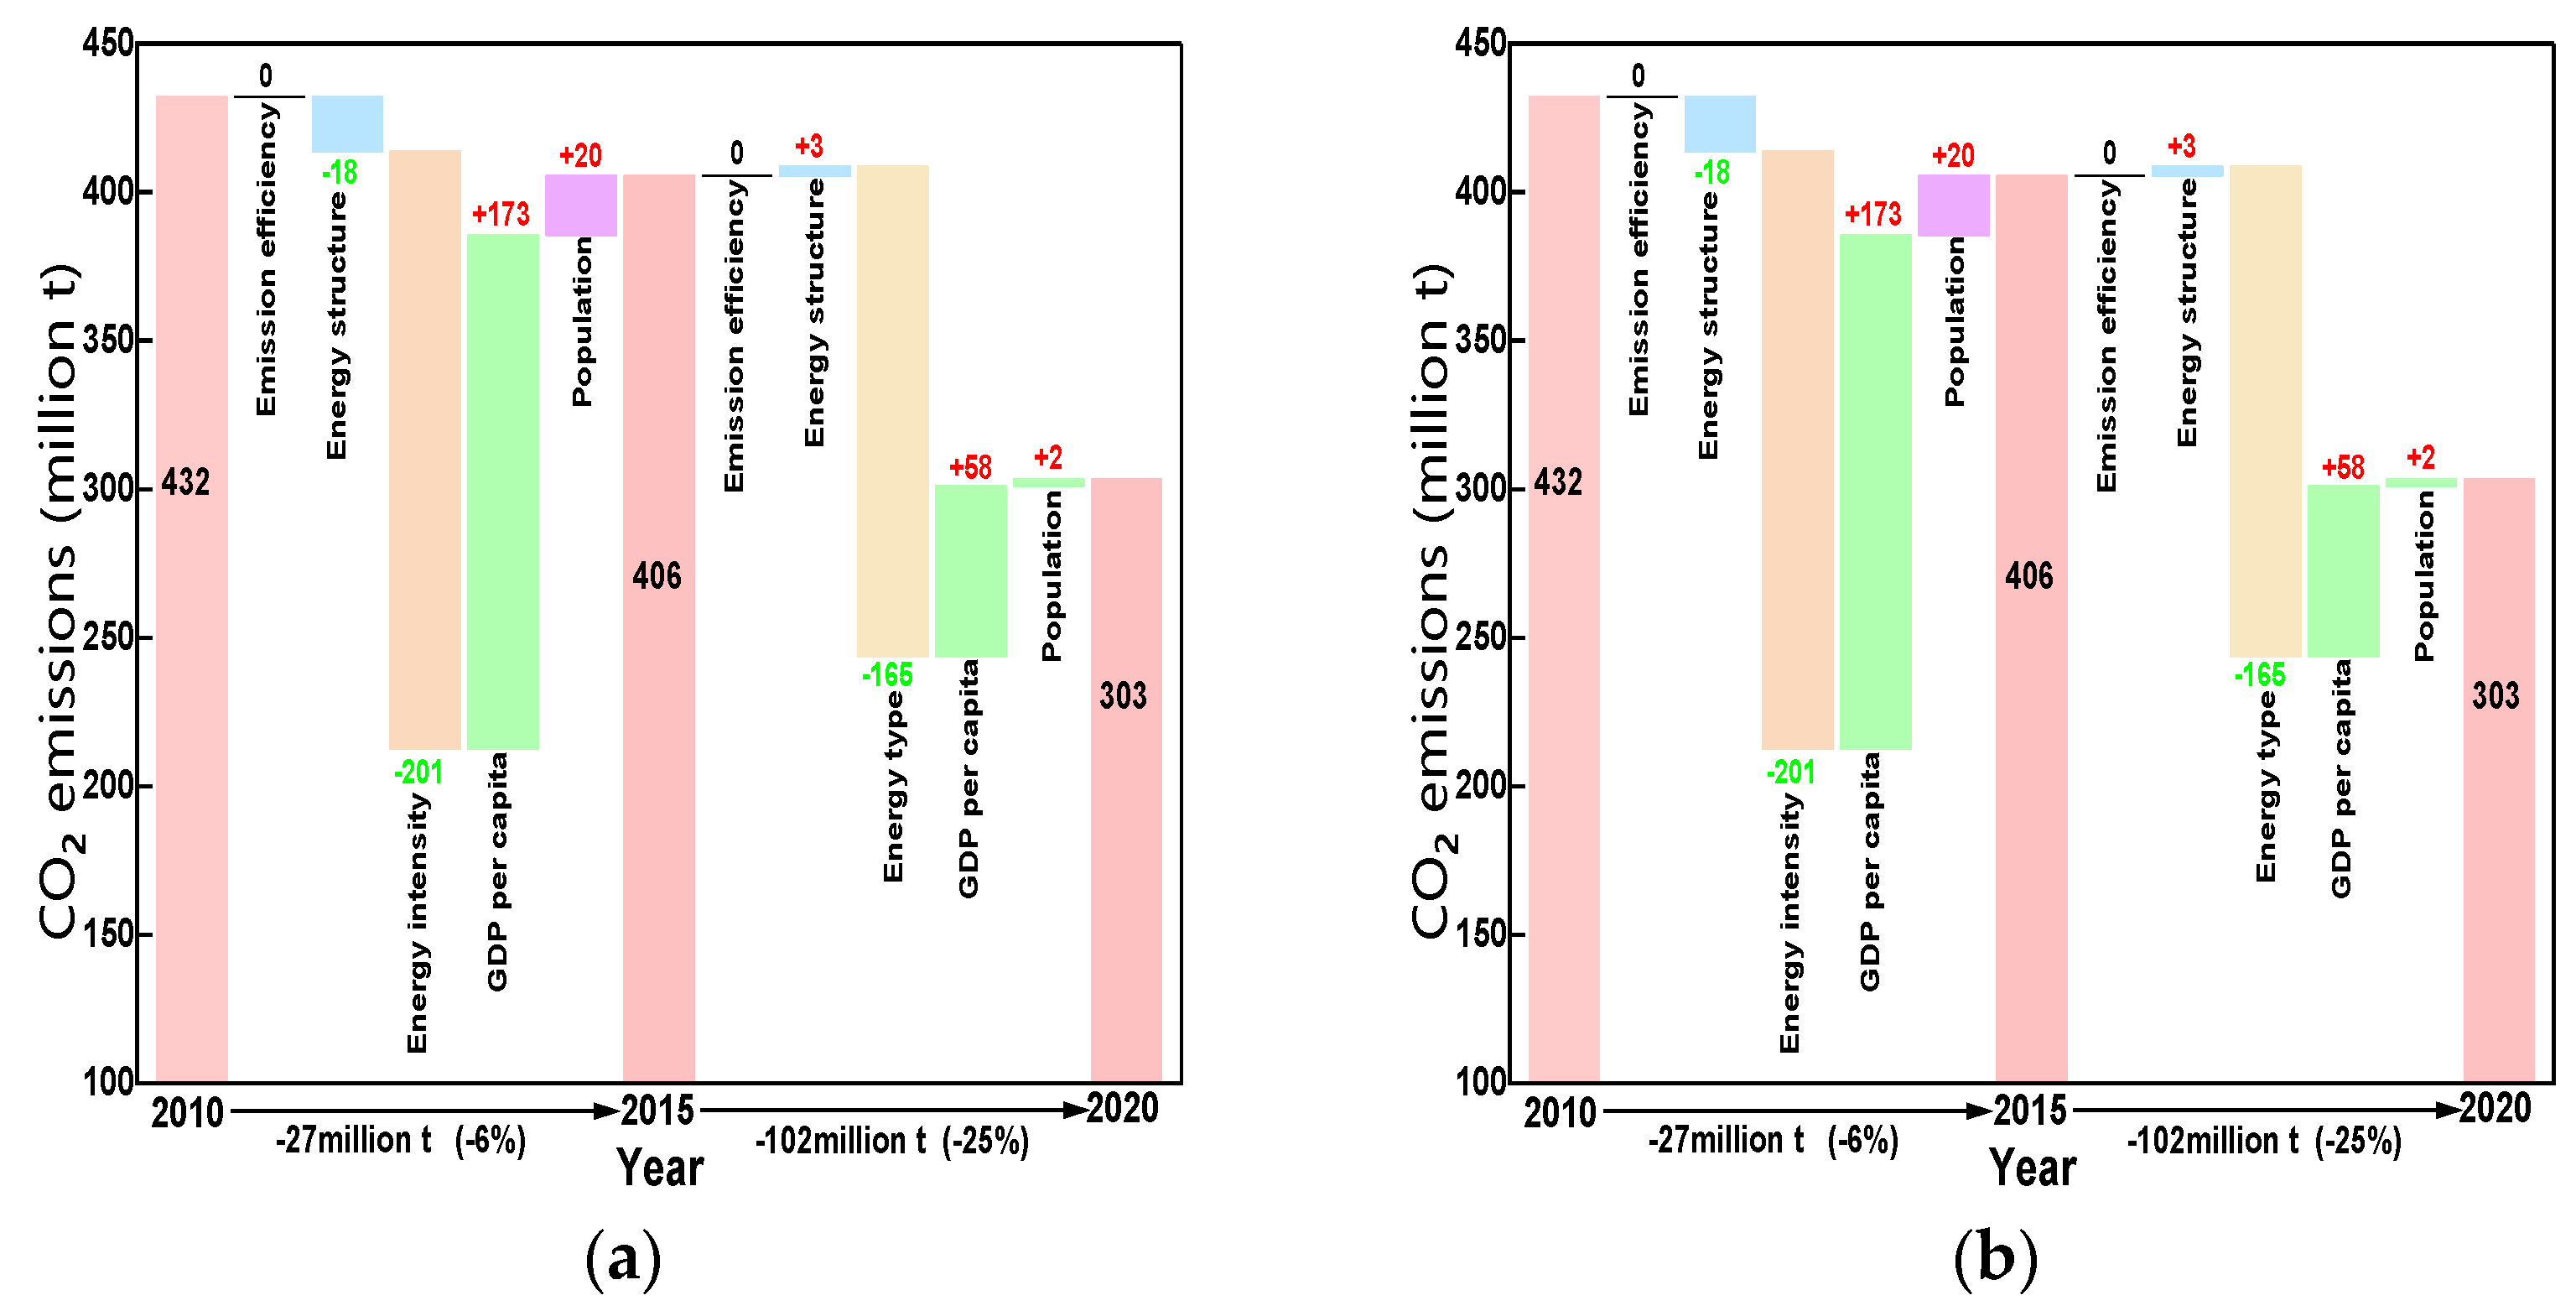
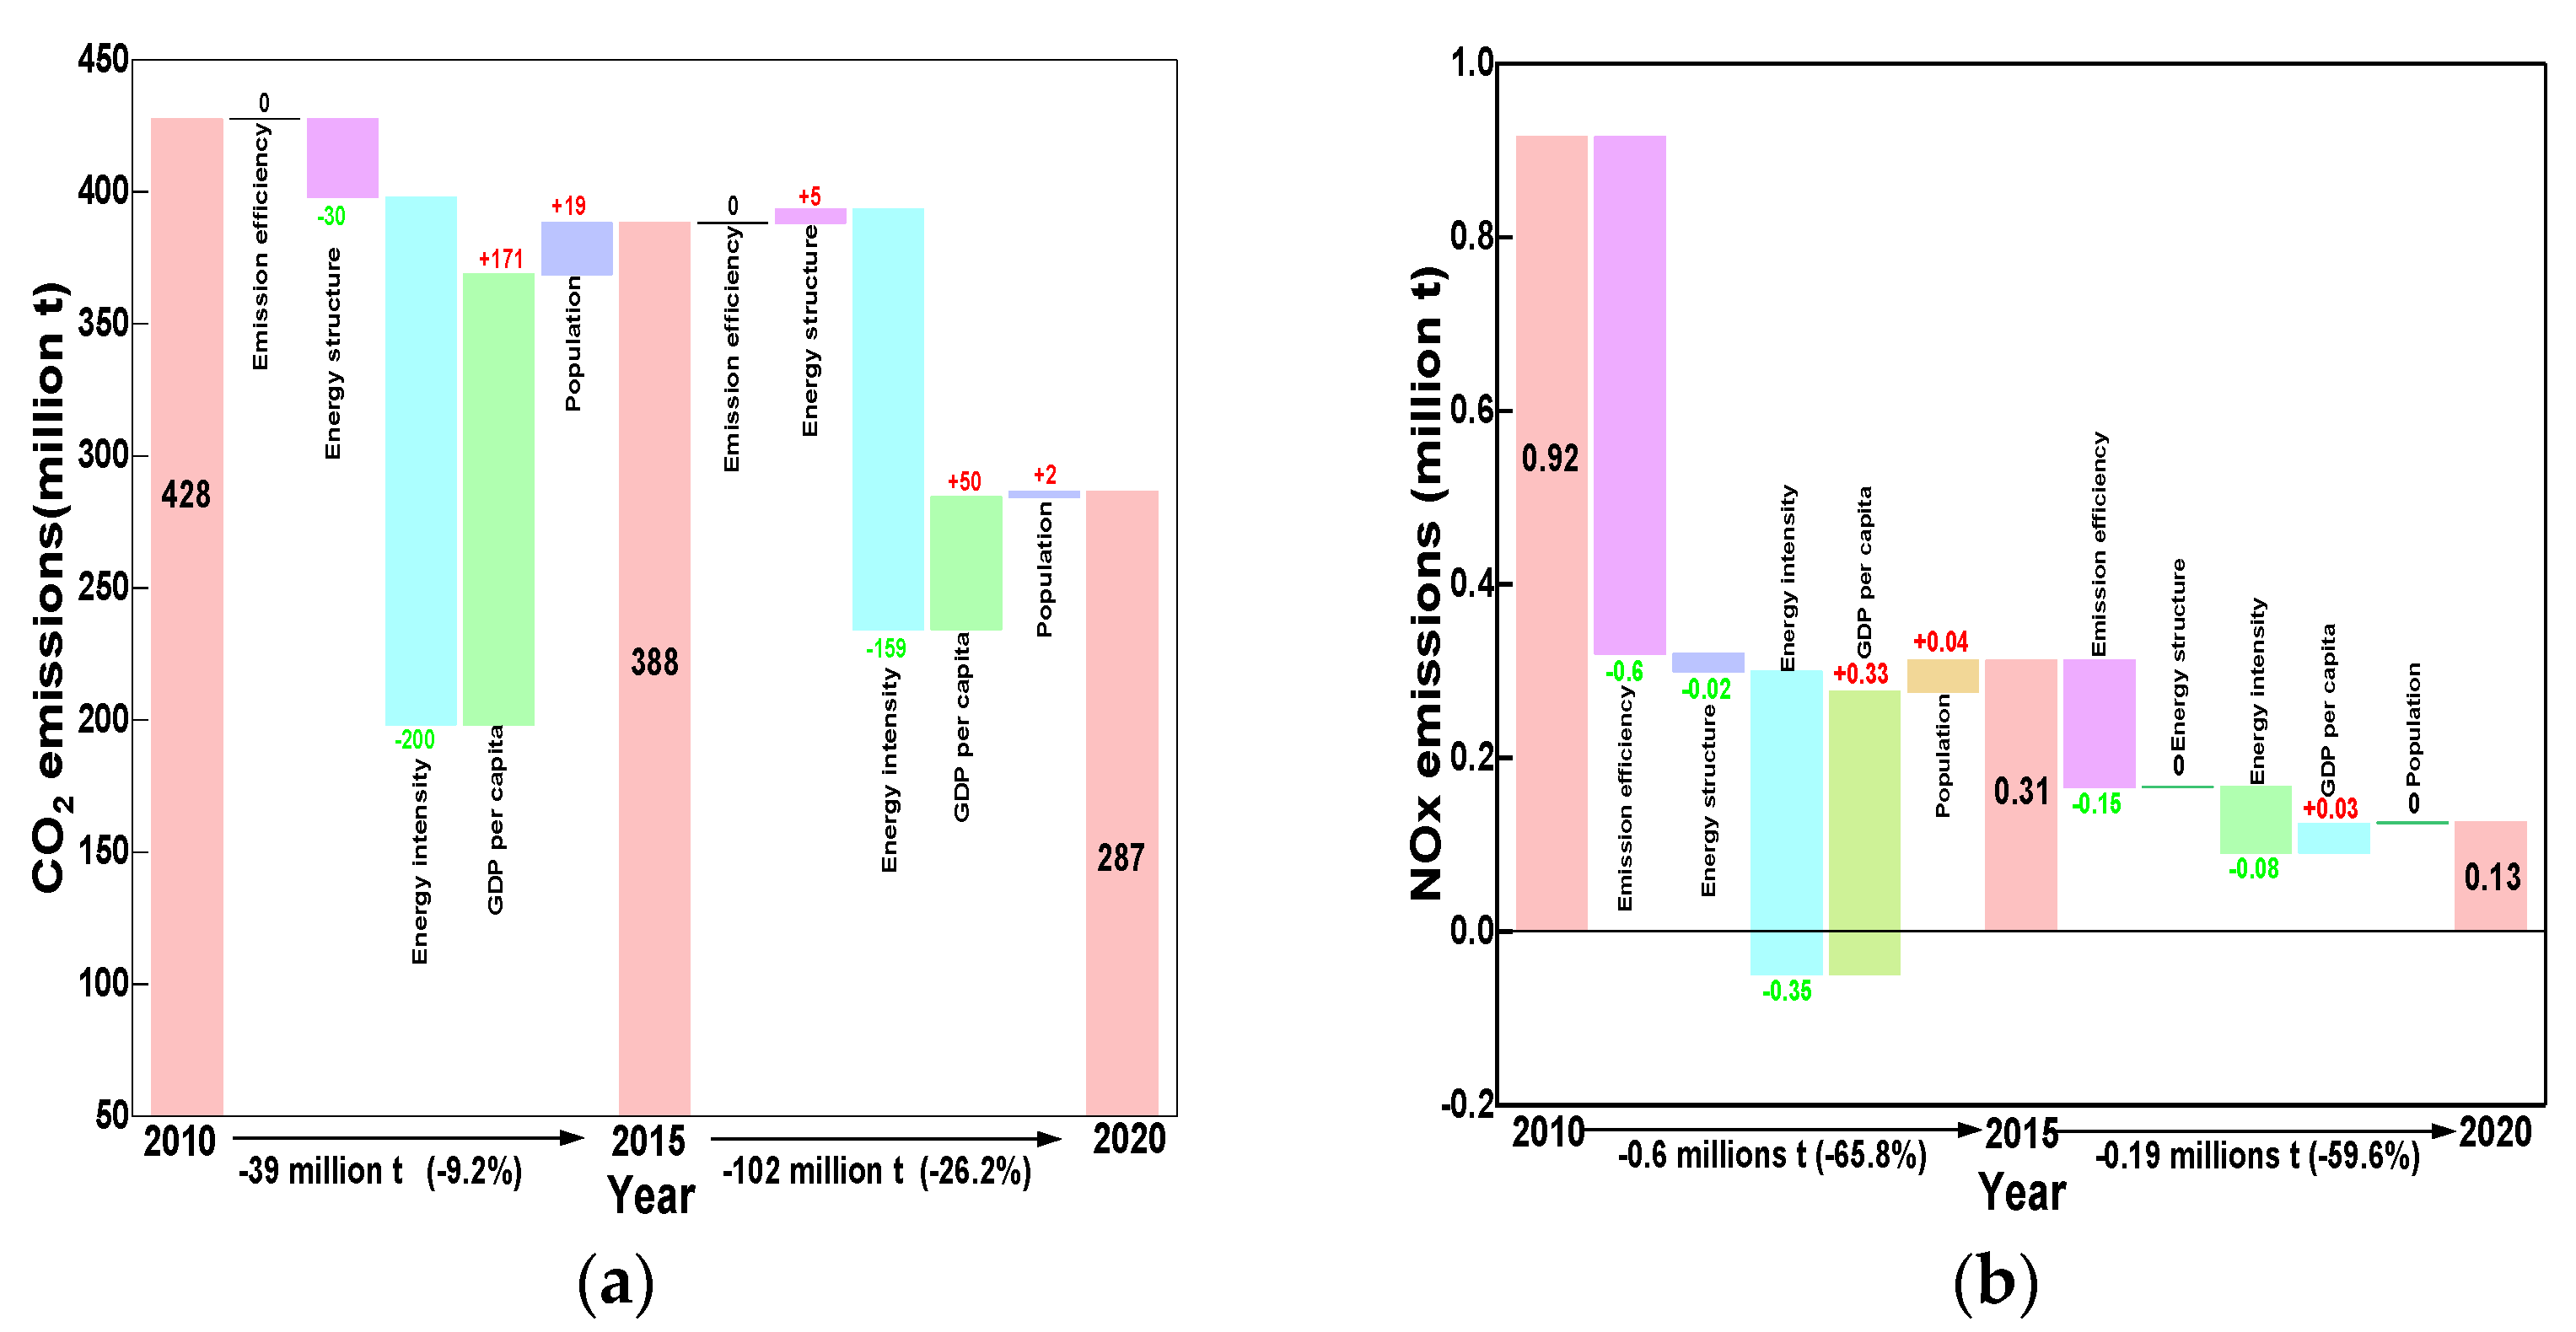
3.2. Analysis of CO2 and NOX Emission Drivers

We assessed the impact of emission coefficients (end-of-pipe treatment), energy structure, energy intensity, per capita GDP, and population on the CO2 and NOX emissions associated with the energy consumption of thermal power units from 2010 to 2020 by means of LMDI decomposition analysis. From the decomposition results, a positive number indicates that the factor contributes to CO2 and NOX emissions, and a negative number indicates that the factor favors the reduction of CO2 and NOX emissions. During the 10-year period, the cumulative CO2 emissions in the Beijing–Tianjin–Hebei region were reduced by 12,880.3 × 104 t and NOX emissions by 80.2 × 10⁴ t. The effect of the CO2 emission coefficients is negligible due to their relative consistency between two adjacent years. Per capita GDP and population are positively correlated with CO2 emissions, while energy structure and energy intensity have a negative impact on CO2 emissions. The order of magnitude of the contribution of each factor to CO2 emissions is per capita GDP, energy intensity, population, and energy structure. Per capita GDP, an important indicator of economic growth, is the main driver of the increase in CO2 emissions from thermal power units in the Beijing–Tianjin–Hebei region, which reached 23,070 × 104 t. At the same time energy intensity is the main reason for the decrease in CO2, with a reduction of 36,689 × 104 t.
Among the factors affecting NOX emissions, per capita GDP and population were positively correlated, while emission coefficients, energy structure, and energy intensity were negatively correlated on NOX emissions. The order of magnitude of the contribution of each factor to NOX emissions is per capita GDP, emission coefficients (end-of-pipe treatment), energy intensity, population, and energy structure. Unlike CO2 emissions, the emission coefficients of NOX are important indicators of end-of-pipe treatment. Per capita GDP was the main driver of the increase in NOX emissions from thermal power units in the Beijing–Tianjin–Hebei region, which reached 36.7 × 10⁴ t. Meanwhile, end-of-pipe management and energy intensity were the main drivers of the decrease in NOX emissions, which decreased by 77.3 × 10⁴ t and 43.3 × 10⁴ t, respectively.
Thus, per capita GDP is the main synergistic driver leading to an increase in CO2 and NOX emissions from thermal power units in the Beijing–Tianjin–Hebei region, while energy intensity is the main synergistic driver leading to a decrease in emissions. To combat climate change and improve air quality, the Beijing–Tianjin–Hebei region has stepped up its efforts to save energy and reduce emissions. For example, it has implemented a comprehensive work program for energy conservation and emission reduction in the 13th Five-Year Plan, and has promoted the improvement of energy efficiency in key industries and the control of total coal consumption [35]. These initiatives all contribute to reducing energy consumption and pollutant emissions, thereby reducing energy intensity. Among them, technological progress is a key factor in reducing energy intensity. During this period, Beijing–Tianjin–Hebei region enterprises adopted more advanced production processes and equipment, the industrial structure was continuously optimized and upgraded, high-energy-consuming enterprises were eliminated or reformed, and the proportion of new industries and service industries increased [36]. At the same time, with the government proposing energy restructuring policies such as “coal to gas”, the Beijing–Tianjin–Hebei region is making great efforts to develop clean energy technologies and reduce the proportion of traditional energy sources. The development of smart grids has also improved the efficiency of energy transmission and distribution in the power system. In addition, China has been conducting carbon emission trading pilot projects in seven provinces and cities, including Beijing, since 2013, with the aim of utilizing market mechanisms to prompt enterprises to reduce greenhouse gas emissions. The carbon emission trading policy is an important means of promoting emission reduction through market mechanisms, and such a policy may have an impact on energy intensity reduction in the Beijing–Tianjin–Hebei region.
To further understand the influence and change process of these five factors on CO2 and NOX emissions from thermal power units, Figure 2 and Figure 3 show the contribution of several decomposition factors to CO2 and NOX emissions. On this basis, the effects of each factor on CO2 and NOX emissions from thermal power units in Beijing–Tianjin–Hebei region are discussed in detail.
In Table 4 and Table 5, ΔC represents the sum of the driving factors; C E F represents CO2 emission efficiency or the NOX end-of-pipe treatment; C E S represents the change in CO2 and NOX emissions due to energy structure; C E I represents the change in CO2 and NOX emissions due to energy intensity; C A represents changes in CO2 and NOX emissions due to per capita GDP; and C p represents changes in CO2 and NOX emissions due to population.
The overall efficiency of energy consumption and economic development is usually measured by the indicator of energy intensity, which is the amount of energy consumed to generate a unit of GDP. As shown by the contribution of the decomposition factors (Figure 2), the contribution of energy intensity to CO2 emissions is the most significant in the period 2010–2020, reaching an average of 52.1% per year, and even 90.2% in 2019–2020. This point suggests that energy intensity is the dominant factor in reducing CO2 emissions for thermal power units in the Beijing–Tianjin–Hebei region. Energy intensity is also the second largest contributor to NOX emission reductions, averaging 26% per year. This result is mainly attributed to the success of the Beijing–Tianjin–Hebei region in reducing energy intensity and reducing emissions by improving energy efficiency and promoting the optimization of the energy structure during the period 2010–2020. In this process, the government’s green development policies, industrial restructuring, environmental protection regulations, and synergistic energy development planning play an important role. As shown in Figure 4, the energy intensity of the Beijing–Tianjin–Hebei region shows a continuous downward trend during the period of 2010–2020, with a cumulative reduction of 37.9% and 38.9% during the 12th and 13th Five-Year Plan periods, respectively. According to the “12th Five-Year Plan” energy-saving targets announced by the Development and Reform Commission, Beijing and Hebei have been assessed as having exceeded their targets. During the “13th Five-Year Plan” period, the target of eliminating outdated production capacity was completed three years ahead of schedule, and the installed capacity structure was further optimized. These measures have had a positive impact on reducing CO2 emissions. These energy-saving policies not only meet the need to reduce carbon emissions, but also drive down the energy intensity of thermal power units in the Beijing–Tianjin–Hebei region, laying a solid foundation for a greener and more sustainable future. Although both the 12th Five-Year Plan and the 13th Five-Year Plan address the reduction in the energy intensity of thermal power units, the 13th Five-Year Plan emphasizes more environmental protection and energy efficiency initiatives, and further strengthens the restructuring of the thermal power industry, such as optimizing the structure of thermal power units and increasing the proportion of cogeneration units. At the same time, the 13th Five-Year Plan also eliminated a number of backward production capacities and encouraged the development of more efficient supercritical and ultra-supercritical generating units. These measures not only reduce energy intensity but also promote environmental protection and sustainable development.
Between 2010 and 2020, the Beijing–Tianjin–Hebei region thermal power units reduced CO2 emissions by 1535.8 × 104 t and NOX by 0.36 × 10⁴ t due to the energy structure adjustment. It was found that energy restructuring did not make a significant contribution to CO2 and NOX reduction. While Beijing’s coal use for thermal power units has dropped from 72% to 18%, Tianjin and Hebei’s use of coal in 2020 will be 99.7% and 99.9%, respectively. As a result, the share of coal use in the Beijing–Tianjin–Hebei region, although on a downward trend over the 10-year period, remains high, accounting for 87% in 2020. As shown in Figure 5, Beijing’s share of coal shows a downward trend year by year, from 685.78 × 10⁴ tons in 2010 to 227.79 × 10⁴ tons in 2020, a reduction of 66.8%. Between 2013 and 2017, Beijing’s four major coal-fired power plants have completed their conversion to natural gas, a move that has significantly reduced CO2 emissions. The natural gas supply is also ensured through price subsidies and the construction of natural gas pipelines. Tianjin’s share of coal declined by 13% from 2013 to 2017. This is because Tianjin’s energy structure changed between 2014 and 2017, with coal consumption growing at a slower rate than other energy types and natural gas consumption expanding sharply. Changes in the energy structure may be the result of policy guidance and industrial restructuring aimed at reducing coal consumption and increasing the proportion of clean energy, but it rose to 99.7% in 2018 and remained stable. Coal prices are likely to decline after 2018, making thermal power generation less costly and thus improving its competitiveness. At the same time, considering the security and stability of the energy supply, the policy allows or encourages a moderate increase in coal consumption, so Tianjin needs to maintain a certain amount of coal production capacity and inventory. And Hebei’s share of coal has always been higher, all around 99%. Therefore, adjusting the energy structure has a huge potential for CO2 and NOX emission reduction, especially in Tianjin and Hebei, and it is more important to promote energy structure adjustment to reduce CO2 and NOX emissions, and to actively develop clean energy while ensuring energy security and economic development.

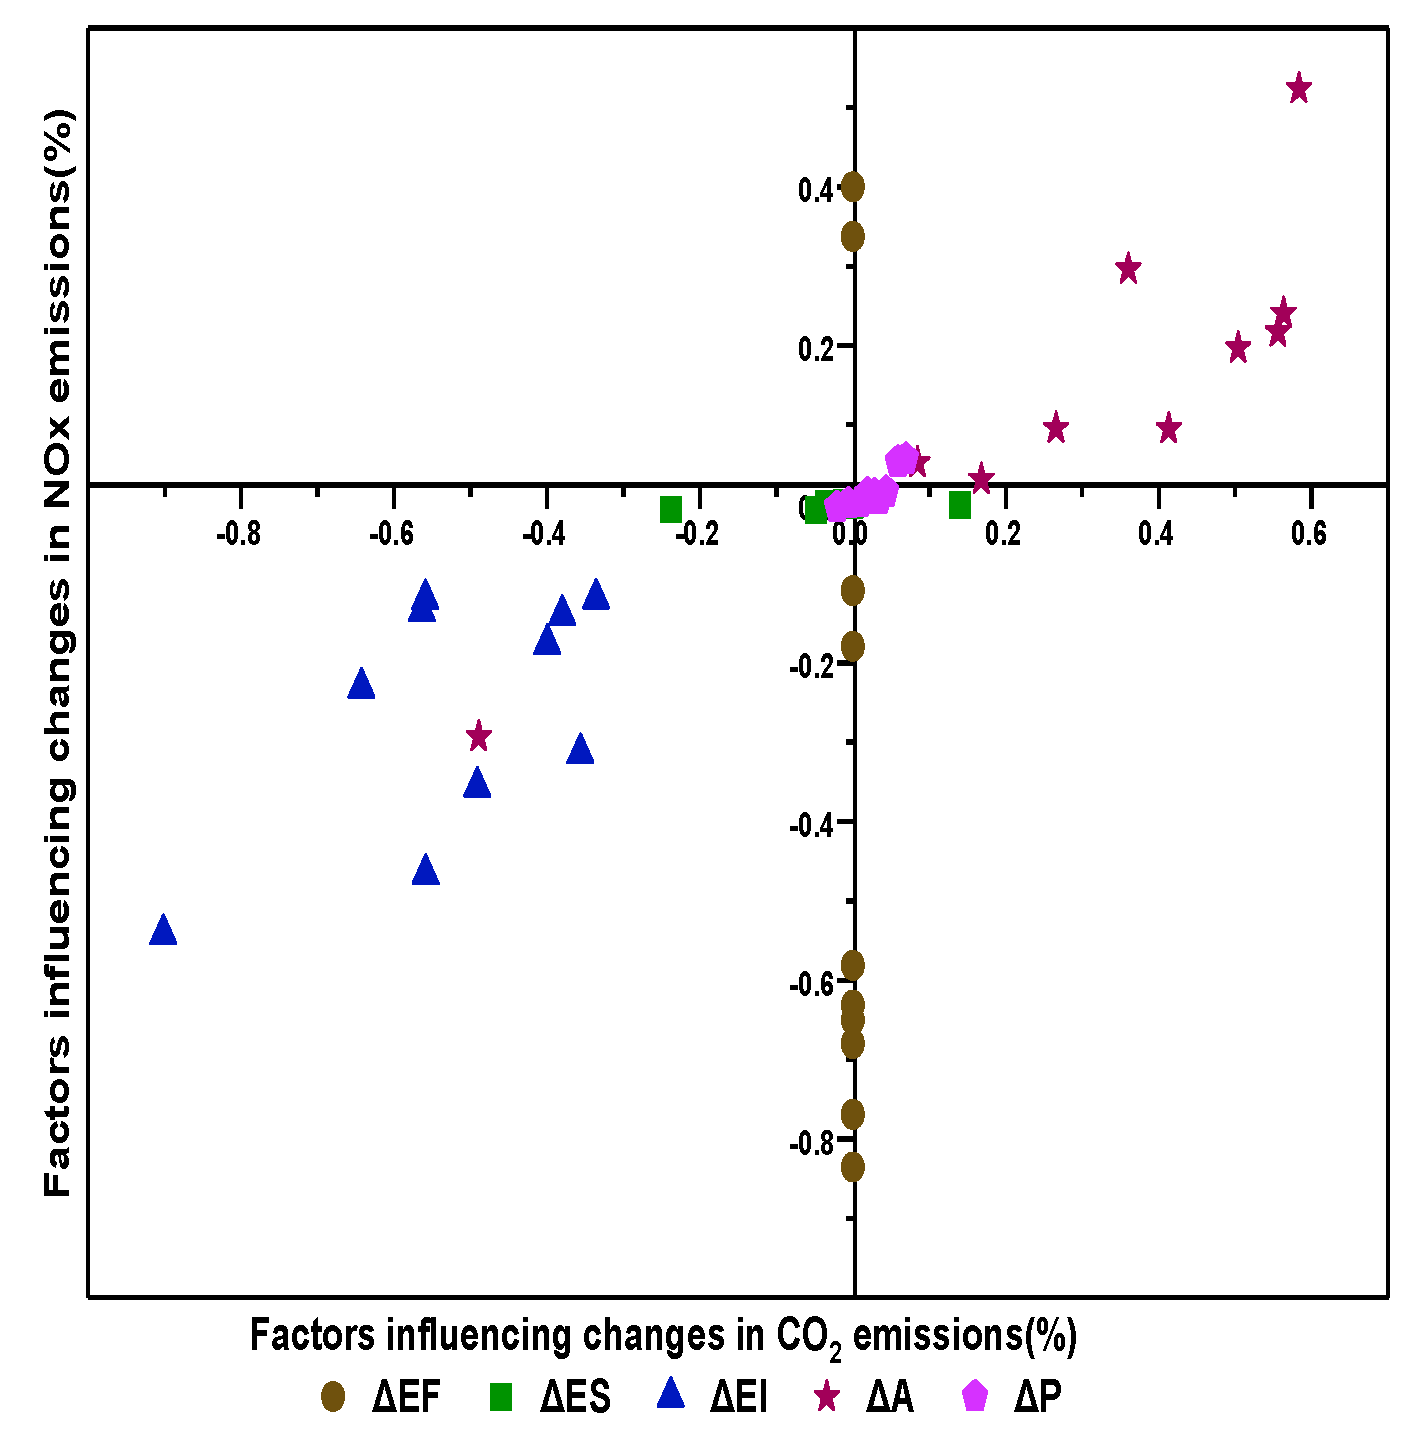
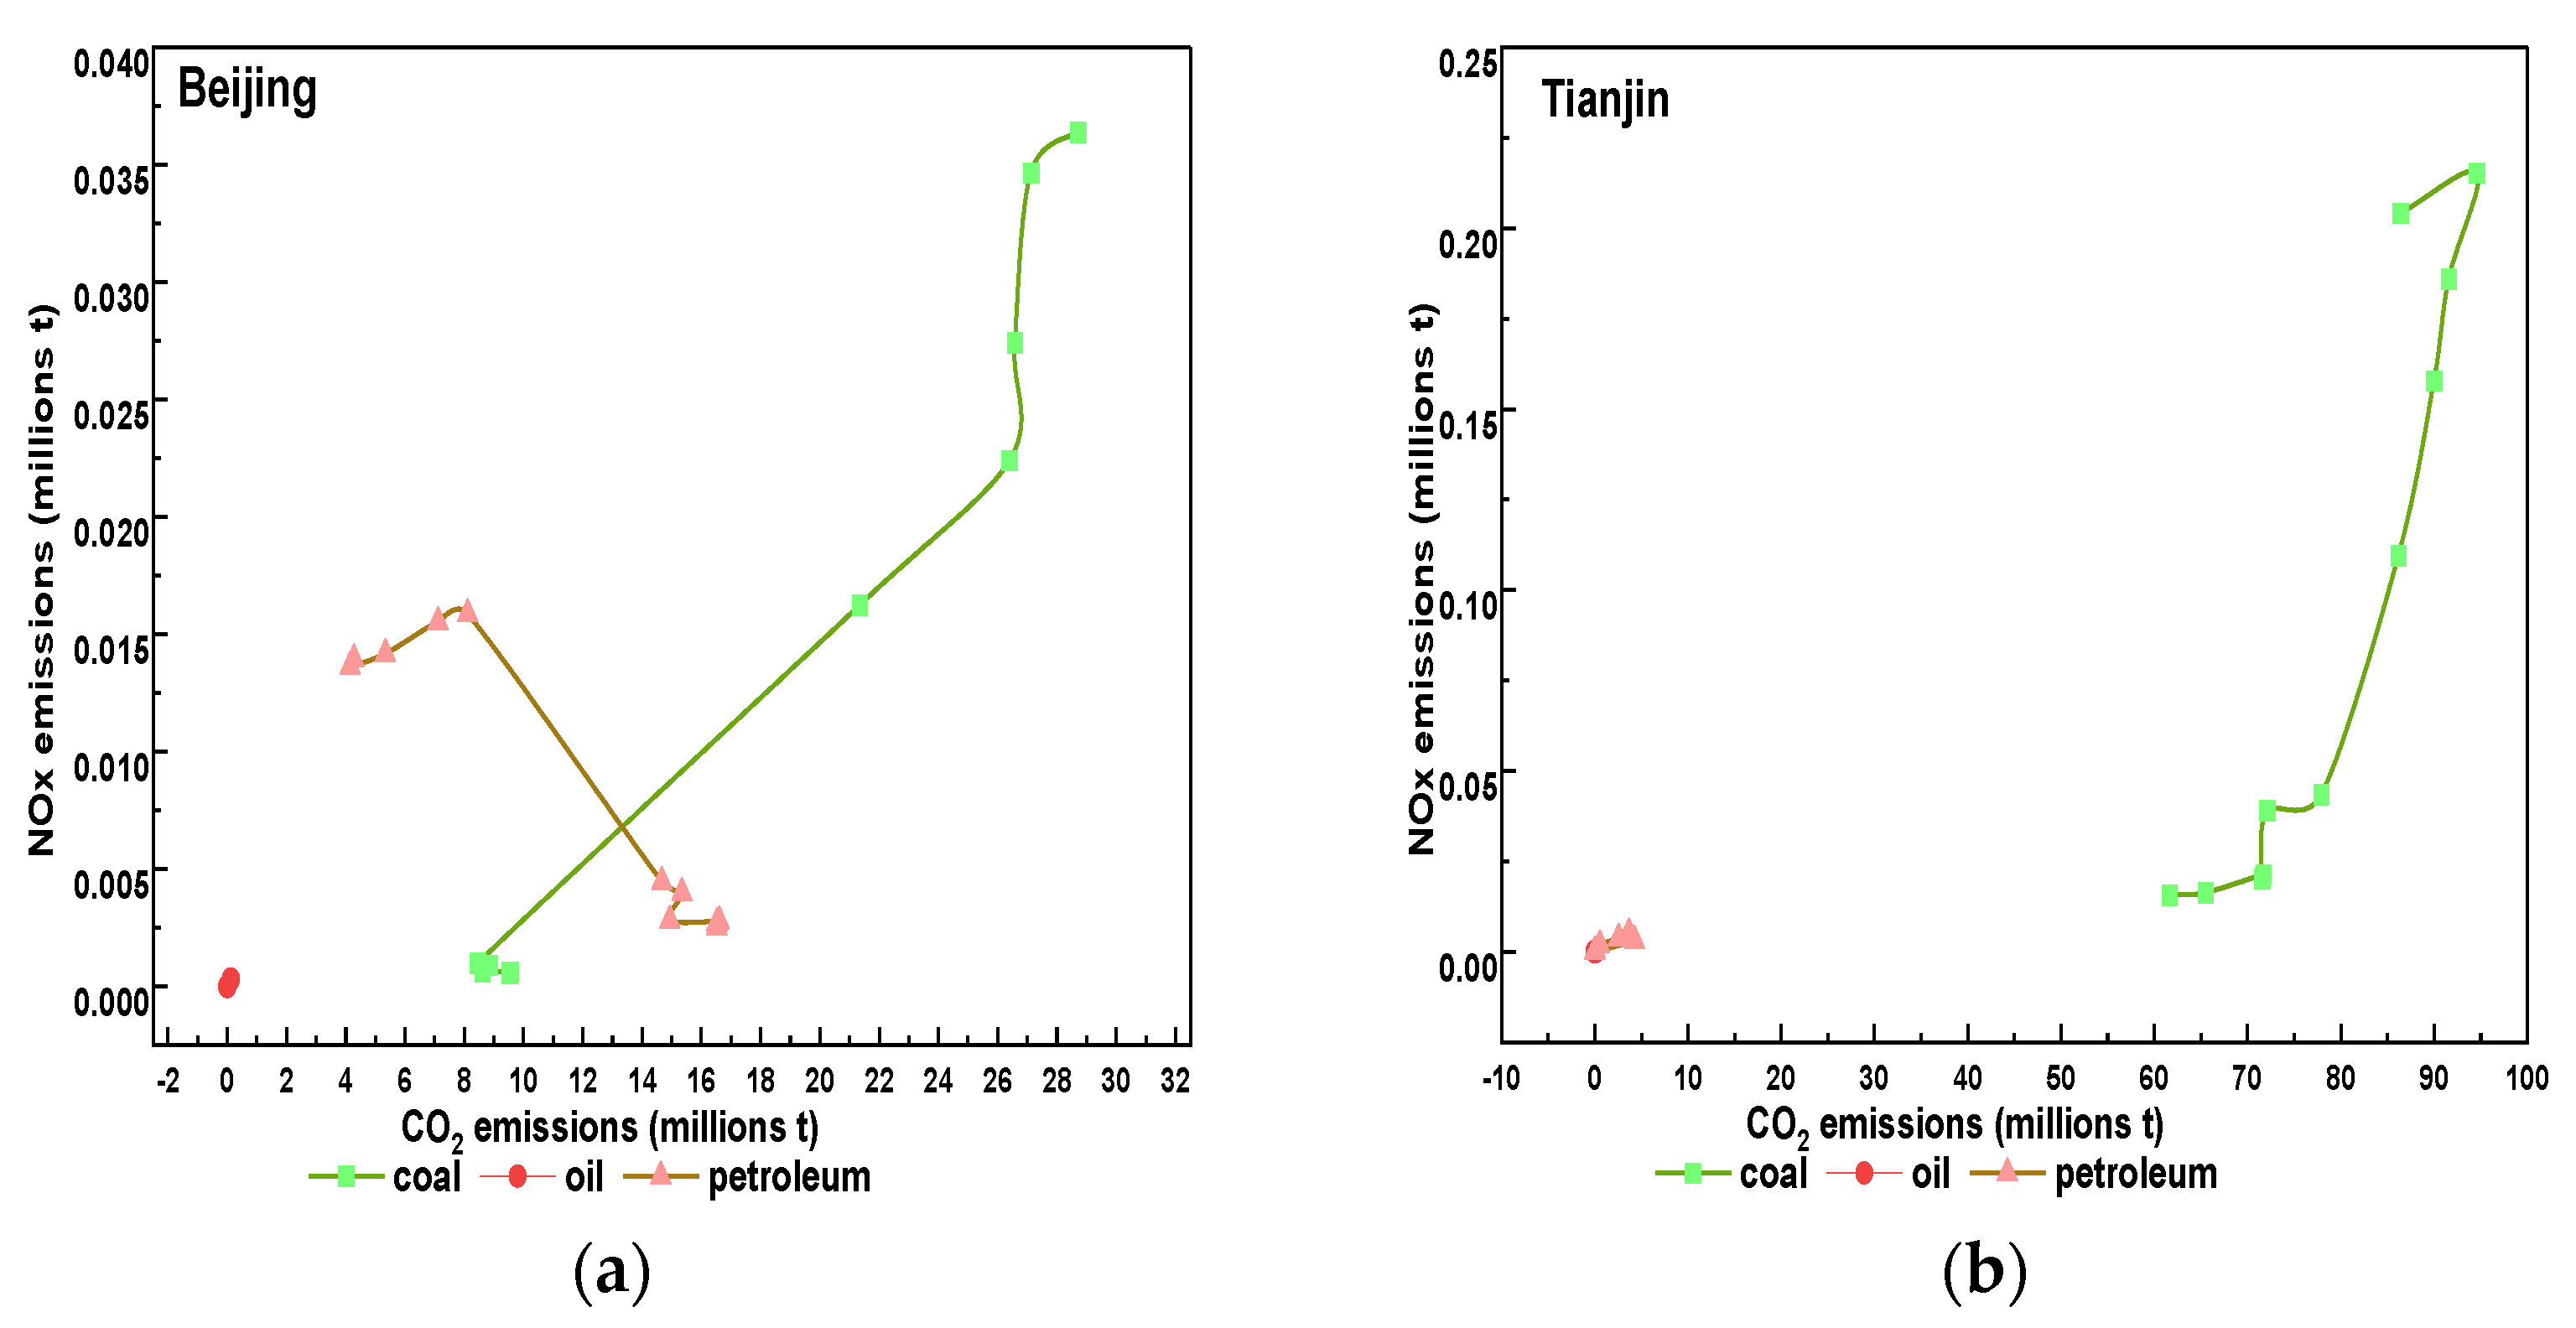
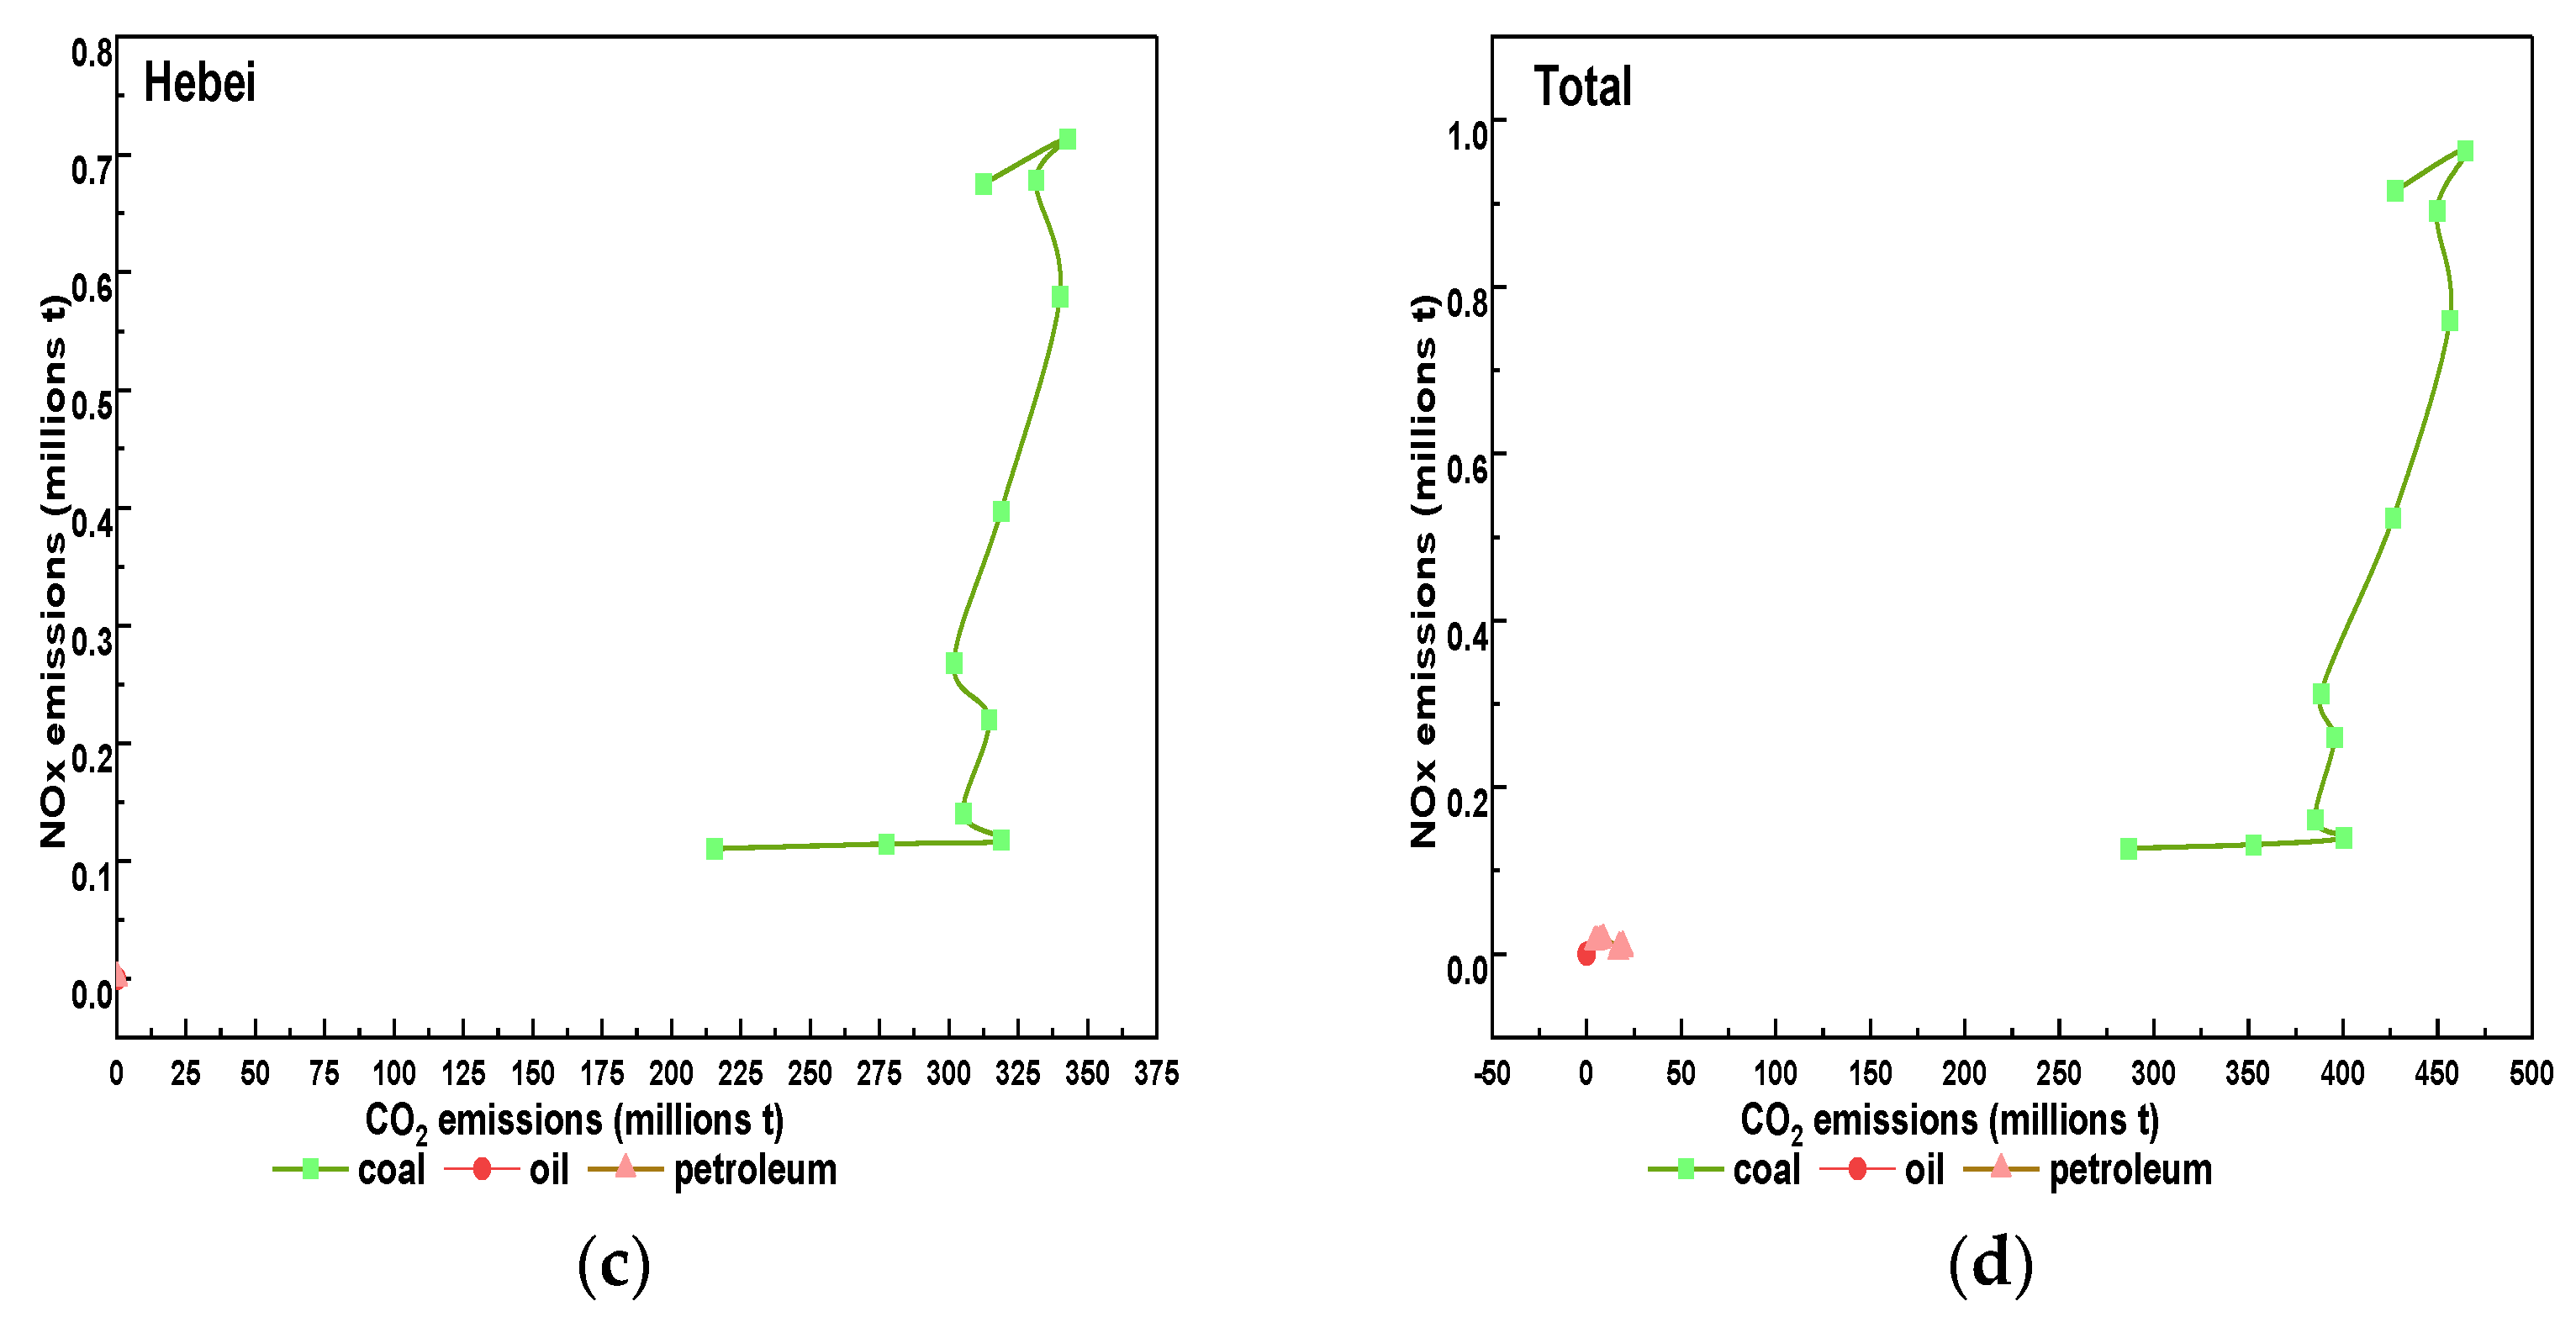
3.3. Analysis of Synergistic Drivers of CO2 and NOX Emissions

As shown in Figure 6 and Figure 7a, from 2010 to 2020, the low-carbon policy reduces CO2 emissions from thermal power units in the Beijing–Tianjin–Hebei region. Despite a 22% increase in installed capacity, the associated CO2 emissions decreased by 30%, from 0.432 billion t in 2010 to 0.303 billion t. The most effective measure to reduce CO2 emissions is the reduction of energy intensity, which has led to an 84.8% reduction in CO2 emissions without the influence of other factors. For the energy mix, CO2 emissions reduced by about 1842 × 104 t in the period 2010–2015, but increased by 312 × 104 t in 2015–2020. This phenomenon is mainly due to the fact that coal consumption by thermal power units in Tianjin accounted for 99.7% of total energy consumption during 2017–2018, contributing 99.2% of CO2 emissions due to the region’s energy structure in the year. This is closely related to Tianjin’s high-carbon energy structure as the most prominent industrial base in northern China. It also reflects the potential of energy restructuring for future emission reductions. As shown in Figure 6 and Figure 7b, end-of-pipe treatment plays a crucial role in NOX reduction. The two most effective factors for reducing NOX emissions are end-of-pipe treatment and energy intensity reduction. Without the influence of other factors, end-of-pipe treatment and energy intensity reduction reduce NOX emissions by 82.9% and 46.4%, respectively, 38.4% less than the CO2-related energy intensity reduction ratio. Although energy restructuring has a smaller impact on NOX emissions than other factors, it synergistically reduces CO2 emissions, reinforcing the advantages of restructuring the energy structure. Together, Figure 7a,b and the last figure show the synergistic effect of each factor on CO2 and NOX emissions from thermal power units in the Beijing–Tianjin–Hebei region. Economic growth drives increased synergistic trends in CO2 and NOX, and the most effective synergistic mitigation measure is energy intensity reduction.
The trend in emissions due to coal consumption by thermal power units in the Beijing–Tianjin–Hebei region is generally consistent with the trend in overall energy emissions from power plants. NOX emissions decreased by 86% and CO2 emissions decreased by 33%. Figure 8a,b show the synergistic effects of CO2 and NOX emission factors due to the coal consumption of thermal power units in the Beijing–Tianjin–Hebei region from 2010 to 2020. Per capita GDP (economic growth) and population are the main drivers of increased emissions. Without the influence of other factors, an increase in per capita GDP (economic growth) and population would result in a 52% and 39% increase in CO2 and NOX emissions. Conversely, reducing energy intensity leads to a downward trend in CO2 and NOX emissions. The end-of-pipe treatment led to a significant reduction in NOX emissions. Unaffected by other factors, the reduction in energy intensity led to an 84% decrease in CO2 emissions, while end-of-pipe treatment led to an 81% decrease in NOX emissions. The share of coal in the total energy for power generation in the Beijing–Tianjin–Hebei region declined from 97% in 2010 to 87% in 2020. This shows that China’s energy structure is moving in the direction of cleaner and more diversified energy, with the proportion of non-fossil energy sources increasing year by year. Although the decline in the share of coal reflects China’s progress in energy restructuring, 87% is still high. Consideration could be given to strengthening the development of clean energy to further promote the optimization of the energy structure and reduce reliance on coal, while continuing to vigorously develop clean energy sources such as wind power, solar power, and hydropower. Overall energy consumption could be reduced by improving energy consumption and energy efficiency measures. For the use of coal, priority should be given to the adoption of clean and efficient utilization technologies, such as supercritical power generation technology. As shown in Figure 9, there is a general positive correlation between CO2 emissions and NOX emissions resulting from coal usage. However, in Figure 9a, the CO2 and NOX emissions associated with petroleum in Beijing exhibit a certain negative correlation. As CO2 emissions increase, NOX emissions show a decreasing trend. This indicates that end-of-pipe treatment plays a crucial role in NOX reduction during the adjustment of the energy structure.

4. Conclusions

An in-depth understanding of the synergistic drivers of NOX and CO2 emissions from thermal power plants is of great significance to the realization of the vision of “Beautiful China” and the strategic goal of “Carbon Peak and Carbon Neutrality”. The detailed NOX and CO2 emission inventories of the Beijing–Tianjin–Hebei region were compiled and analyzed in depth by using the Log Mean Divisia Index (LMDI). Synergistic trends between emission changes are revealed and key synergistic factors influencing these trends are identified.
The analysis results show that the implementation of the policy effectively reduces NOX emissions, but the effect on CO2 reduction is not obvious. Economic growth is a key driver of increased emissions, while reductions in energy intensity are a key synergistic mitigating factor. However, reductions in energy intensity have a more significant effect on reducing CO2 emissions, because reductions in energy consumption directly reduce CO2 production. For NOX emissions, although reductions in energy intensity also contribute to emission reductions, their effect is 38.4% smaller than the reduction in CO2 because NOX emissions are mainly influenced by other factors (e.g., combustion technology and control measures). The Beijing–Tianjin–Hebei region is located in China’s “Capital Economic Circle”, which is an important engine for economic development in the northern region, and therefore may hinder emission reduction in the future economic growth process. However, we find that the potential to reduce emissions from the energy structure is still huge. Therefore, the pressure to reduce emissions brought about by the process of economic growth can be offset by implementing more effective and sustained synergistic emission reduction measures through energy restructuring. The economy, as an important development goal, should be shifted towards sustainable development while maintaining reasonable economic growth and reducing the CO2 emissions and pollutant emissions resulting from economic development.
Future synergistic emission reduction efforts can learn from the experience of past policy implementation in order to optimize and avoid past shortcomings. An in-depth analysis of different energy types and their emission reduction control measures can provide guidance for future policy formulation. The study analysis shows that reducing energy intensity plays a significant role in controlling the growth of NOX and CO2 emissions. This finding implies that emission reduction measures that have been proven to be effective, such as the implementation of more stringent emission standards and lower standard coal consumption requirements, should be consistently applied to both coal and gas-fired units.
In addition, the analysis for coal-fired emissions reveals that the energy structure of thermal power units in the Beijing–Tianjin–Hebei region is still coal-biased, especially in Hebei and Tianjin. Although the share of coal in total energy for power generation has declined by 10 percent, the potential for energy restructuring remains huge. Therefore, in order to achieve strong control of emissions, multifaceted policies need to be designed that go beyond the traditional means of control. For example, studies have shown that the use of natural gas as a substitute for coal is an effective synergistic control strategy. Beijing has achieved significant results in reducing NOX and CO2 emissions through this pathway. At the same time, several studies have assessed the potential benefits of reducing emissions from coal-fired power generation in China and have confirmed that reducing the demand for coal-fired power can radically reduce CO2 and NOX emissions. In addition, the structural optimization of gensets can improve energy efficiency and significantly reduce CO2 and NOX emissions, which can simultaneously improve air quality and climate benefits. And end-of-pipe treatment will continue to reduce NOX emission levels. Widespread adoption of more advanced control measures can reduce CO2 and NOX emissions from thermal power units, but cannot completely eliminate emissions. It also demonstrates the future competitiveness of clean energy and the necessity to work towards replacing coal-fired power generation with clean and renewable energy.

Author Contributions

Conceptualization, C.J.; Methodology, Y.W. and H.Z.; Validation, H.Z. and Q.G.; Formal analysis, Z.Y. and J.Y.; Investigation, Y.W. and Z.Y.; Resources, S.R. and C.J.; Data curation, Y.W.; Writing—original draft, Y.W.; Writing—review & editing, C.J.; Visualization, Y.W.; Supervision, S.R. and C.J.; Project administration, Z.D.; Funding acquisition, S.R. All authors have read and agreed to the published version of the manuscript.

Funding

This research received no external funding.

Data Availability Statement

The data presented in this study are available on request from the corresponding author.

Conflicts of Interest

The authors declare no conflict of interest.

References

  1. Shi, Q.; Zheng, B.; Zheng, Y.; Tong, D.; Liu, Y.; Ma, H.; Hong, C.; Geng, G.; Guan, D.; He, K. Co-benefits of CO2 emission reduction from China’s clean air actions between 2013–2020. Nat. Commun. 2022, 13, 5061. [Google Scholar] [CrossRef] [PubMed]
  2. Tang, R.; Zhao, J.; Liu, Y.; Huang, X.; Zhang, Y.; Zhou, D.; Ding, A.; Nielsen, C.P.; Wang, H. Air quality and health co-benefits of China’s carbon dioxide emissions peaking before 2030. Nat. Commun. 2022, 13, 1008. [Google Scholar] [CrossRef]
  3. Yue, H.; He, C.; Huang, Q.; Yin, D.; Bryan, B.A. Stronger policy required to substantially reduce deaths from PM2.5 pollution in China. Nat. Commun. 2020, 11, 1462. [Google Scholar] [CrossRef] [PubMed]
  4. Davidson, M.R.; Zhang, D.; Xiong, W.; Zhang, X.; Karplus, V.J. Modelling the potential for wind energy integration on China’s coal-heavy electricity grid. Nat. Energy 2016, 1, 16086. [Google Scholar] [CrossRef]
  5. Zhao, Y.; Zhang, J.; Nielsen, C.P. The effects of recent control policies on trends in emissions of anthropogenic atmospheric pollutants and CO2 in China. Atmos. Chem. Phys. 2013, 13, 487–508. [Google Scholar] [CrossRef]
  6. Zhao, Y.; Wang, S.; Duan, L.; Lei, Y.; Cao, P.; Hao, J. Primary air pollutant emissions of coal-fired power plants in China: Current status and future prediction. Atmos. Environ. 2008, 42, 8442–8452. [Google Scholar] [CrossRef]
  7. Liu, F.; Zhang, Q.; Tong, D.; Zheng, B.; Li, M.; Huo, H.; He, K.B. High-resolution inventory of technologies, activities, and emissions of coal-fired power plants in China from 1990 to 2010. Atmos. Chem. Phys. 2015, 15, 13299–13317. [Google Scholar] [CrossRef]
  8. Zhang, Q.; He, K.; Huo, H. Cleaning China’s air. Nature 2012, 484, 161–162. [Google Scholar] [CrossRef] [PubMed]
  9. Wang, S.W.; Zhang, Q.; Streets, D.G.; He, K.B.; Martin, R.V.; Lamsal, L.N.; Chen, D.; Lei, Y.; Lu, Z. Growth in NOX emissions from power plants in China: Bottom-up estimates and satellite observations. Atmos. Chem. Phys. 2012, 12, 4429–4447. [Google Scholar] [CrossRef]
  10. Liu, Z.; Lei, Y.; Xue, W.; Liu, X.; Jiang, Y.; Shi, X.; Zheng, Y.; Zhang, Q.; Wang, J. Mitigating China’s Ozone Pollution with More Balanced Health Benefits. Environ. Sci. Technol. 2022, 56, 7647–7656. [Google Scholar] [CrossRef]
  11. Yang, Y.; Liu, X.; Zheng, J.; Tan, Q.; Feng, M.; Qu, Y.; An, J.; Cheng, N. Characteristics of one-year observation of VOCs, NOX, and O3 at an urban site in Wuhan, China. J. Environ. Sci. 2018, 79, 297–310. [Google Scholar] [CrossRef] [PubMed]
  12. Song, Z.; Yu, S.; Chen, X.; Li, M.; Li, P.; Hu, K.; Liang, S.; Chen, J.; Rosenfeld, D.; Seinfeld, J.H. Significant reductions of urban daytime ozone by extremely high concentration NOX from ship’s emissions: A case study. Atmos. Pollut. Res. 2024, 15. [Google Scholar] [CrossRef]
  13. Zhang, W.; Zhao, J.; Zhang, Z.; Liu, M.; Li, R.; Xue, W.; Xing, J.; Cai, B.; Jiang, L.; Zhang, J. The economy–employment–environmental health transfer and embedded inequities of China’s capital metropolitan area: A mixed-methods study. Lancet Planet. Health 2023, 7, e912–e924. [Google Scholar] [CrossRef] [PubMed]
  14. Shan, Y.; Guan, D.; Zheng, H.; Ou, J.; Li, Y.; Meng, J.; Mi, Z.; Liu, Z.; Zhang, Q. China CO2 emission accounts 1997–2015. Sci. Data 2017, 5, 170201. [Google Scholar] [CrossRef]
  15. Min, B.S. Regional cooperation for control of transboundary air pollution in East Asia. J. Asian Econ. 2001, 12, 137–153. [Google Scholar]
  16. Chang, K.M.; Hess, J.J.; Balbus, J.M.; Buonocore, J.J.; A Cleveland, D.; Grabow, M.L.; Neff, R.; Saari, R.K.; Tessum, C.W.; Wilkinson, P.; et al. Ancillary health effects of climate mitigation scenarios as drivers of policy uptake: A review of air quality, transportation and diet co-benefits modeling studies. Environ. Res. Lett. 2017, 12, 113001. [Google Scholar] [CrossRef]
  17. Wang, P.; Lin, C.-K.; Wang, Y.; Liu, D.; Song, D.; Wu, T. Location-specific co-benefits of carbon emissions reduction from coal-fired power plants in China. Nat. Commun. 2021, 12, 6948. [Google Scholar] [CrossRef]
  18. Tong, D.; Zhang, Q.; Liu, F.; Geng, G.; Zheng, Y.; Xue, T.; Hong, C.; Wu, R.; Qin, Y.; Zhao, H.; et al. Current Emissions and Future Mitigation Pathways of Coal-Fired Power Plants in China from 2010 to 2030. Environ. Sci. Technol. 2018, 52, 12905–12914. [Google Scholar] [CrossRef]
  19. Zhang, H.; Chen, B.; Deng, H.; Du, H.; Yang, R.; Ju, L.; Liu, S. Analysis on the evolution law and influencing factors of Beijing’s power generation carbon emissions. Energy Rep. 2022, 8, 1689–1697. [Google Scholar] [CrossRef]
  20. Wang, H.; Ang, B.; Su, B. Assessing drivers of economy-wide energy use and emissions: IDA versus SDA. Energy Policy 2017, 107, 585–599. [Google Scholar] [CrossRef]
  21. Wei, W.; Zhang, P.; Yao, M.; Xue, M.; Miao, J.; Liu, B.; Wang, F. Multi-scope electricity-related carbon emissions accounting: A case study of Shanghai. J. Clean. Prod. 2020, 252, 119789. [Google Scholar] [CrossRef]
  22. Wang, H.; Ang, B. Assessing the role of international trade in global CO2 emissions: An index decomposition analysis approach. Appl. Energy 2018, 218, 146–158. [Google Scholar] [CrossRef]
  23. Wang, Y.; Zhao, H.; Li, L.; Liu, Z.; Liang, S. Carbon dioxide emission drivers for a typical metropolis using input–output structural decomposition analysis. Energy Policy 2013, 58, 312–318. [Google Scholar] [CrossRef]
  24. Ang, B.W. The LMDI approach to decomposition analysis: A practical guide. Energy Policy 2005, 33, 867–871. [Google Scholar] [CrossRef]
  25. Inventory of Emissions from the Fusion of Air Pollutants and Greenhouse Gases Preparation of Technical Guidelines (for Trial Implementation) 2024.01. Available online: https://www.mee.gov.cn/xxgk2018/xxgk/xxgk06/202401/W020240130539574113045.pdf (accessed on 1 July 2024).
  26. Miao, Y.; Lu, H.; Cui, S.; Zhang, X.; Zhang, Y.; Song, X.; Cheng, H. CO2 emissions change in Tianjin: The driving factors and the role of CCS. Appl. Energy 2024, 353, 122122. [Google Scholar] [CrossRef]
  27. Statistical Yearbook (2010–2020). Beijing, China, 2020. Available online: https://www.stats.gov.cn/sj/ndsj/ (accessed on 1 July 2024).
  28. Wang, Z.; Yin, F.; Zhang, Y.; Zhang, X. An empirical research on the influencing factors of regional CO2 emissions: Evidence from Beijing city, China. Appl. Energy 2012, 100, 277–284. [Google Scholar] [CrossRef]
  29. Beijing Electricity Development Plan for the Eleventh Five-Year Plan Period. Available online: https://fgw.beijing.gov.cn/fgwzwgk/zcgk/ghjhwb/wnjh/202003/t20200331_2638481.htm (accessed on 1 July 2024).
  30. Zhang, X. The application prospect of CCUS in China under the target of carbon neutrality. China Sustain. Trib. 2020, 12, 22–24. [Google Scholar]
  31. The 12th Five-Year Plan. Available online: https://www.ndrc.gov.cn/fggz/fzzlgh/gjfzgh/201109/P020191029595702423333.pdf (accessed on 1 July 2024).
  32. Upgrading and Action Plan for Energy Saving and Emission Reduction of Coal Power (2014–2020). Available online: https://www.mee.gov.cn/gkml/hbb/gwy/201409/t20140925_289556.htm (accessed on 1 July 2024).
  33. Qu, J.-B.; Wang, P.; Bo, X.; Xue, X.; Dong, G.; Cui, L.; Kang, M.; Wang, T.; Tang, L.; Zhu, F. Inventory and distribution char-acteristics of China’s thermal power emissions under ultra-low reconstruction. Huan Jing ke Xue Huanjing Kexue 2020, 41, 3969–3975. [Google Scholar]
  34. Bianchi, P.; De Propris, L.; Labory, S. People-centred policies for a just transition (digital, green and skills). Contemp. Soc. Sci. 2024, 19, 2351479. [Google Scholar] [CrossRef]
  35. Lu, J.; Wang, X.; Liu, L. Industrial structure upgrading effect of low carbon city policy: Quasi-natural experimental research based on low-carbon city pilot. J. Xi’an Jiaotong Univ. (Soc. Sci.) 2020, 40, 104–115. [Google Scholar]
  36. Forsten, K.R. Transmission efficiency initiative: Contributing to a lower carbon future. In Proceedings of the IEEE PES T&D 2010, New Orleans, LA, USA, 19–22 April 2010; pp. 1–6. [Google Scholar]
Figure 1. Installed capacity of thermal power units, installed capacity of denitrification, coal equivalent, power generation, and CO2 and NOX emissions in Beijing–Tianjin–Hebei region. (a) Installed capacity of thermal power units. (b) Coal-equivalent installed capacity of denitrification. (c) CO2 emissions. (d) NOX emissions. (e) Number of units, generating capacity.
Sustainability 16 07554 g001
Figure 2. Contribution rate of each influencing factor of CO2 emission from thermal power units in Beijing–Tianjin–Hebei region, 2010–2020.
Sustainability 16 07554 g002
Figure 3. Contribution rate of each influencing factor of NOX emission from thermal power units in Beijing–Tianjin–Hebei region, 2010–2020.
Sustainability 16 07554 g003
Figure 4. Energy intensity and CO2 emissions of thermal power units in Beijing–Tianjin–Hebei region, 2010–2020.
Sustainability 16 07554 g004
Figure 5. Analysis of the energy structure of thermal units in the Beijing–Tianjin–Hebei region, 2010–2020.
Sustainability 16 07554 g005
Figure 6. Synergistic effects of different factors on CO2 and NOX emissions from thermal power units in Beijing–Tianjin–Hebei region (symbols located in the first and third quadrants indicate synergistic growth and synergistic reduction of NOX and CO2 emissions).
Sustainability 16 07554 g006
Figure 7. Different drivers of CO2 and NOX emissions from thermal power units in Beijing–Tianjin–Hebei region, 2010–2020.
Sustainability 16 07554 g007
Figure 8. Different drivers of coal combustion emissions from thermal power units in Beijing–Tianjin–Hebei region, 2010–2020.
Sustainability 16 07554 g008
Figure 9. Synergistic trend of fuel types for CO2 and NOX emissions from thermal power units in Beijing–Tianjin–Hebei region, 2010–2020.
Sustainability 16 07554 g009aSustainability 16 07554 g009b
Table 1. Energy emission coefficients.
Type of EnergyAverage Low-Level Heat GenerationCarbon Emission FactorsCarbon Content per Unit Calorific ValueCarbon Oxidation Rate
GJ/t (GJ/m3)t C/GJt C/GJ
raw coal20.9340.0910.0260.94
Other coal washing8.3630.0840.0250.9
waste rock (in coal mining)8.3740.0960.0270.98
Other coking products37.6340.1010.0300.93
petroleum coke35.5300.0990.0280.98
crude oil41.8160.0720.0200.98
diesel fuel42.7050.0730.0200.98
fuel oil41.8680.0760.0210.98
gasoline43.0700.0700.0200.98
diesel43.0700.0680.0190.98
Other petroleum products41.0310.0720.0200.98
petroleum0.0360.0560.0150.99
coke oven gas0.0170.0440.0120.99
blast furnace gas0.0030.2570.0710.99
converter gas0.0080.1800.0500.99
refinery dry gas0.0040.0650.0180.98
Other gas0.0050.0440.0120.99
Table 2. Number of power plants, 2010–2020.
YearBeijingTianjinHebei
2010721182
20111819165
20121120197
20131020197
20141024194
20151325195
20161424169
20171525153
20181720147
20191526105
2020152686
Table 3. Number of units, 2010–2020.
YearBeijingTianjinHebei
20102265385
20115164403
20123166448
20133166449
20143763441
20154866452
20165461395
20175862308
20187851321
20198770215
20208771170
Table 4. Decomposition results of CO2 emission influencing factors of thermal power units in Beijing–Tianjin–Hebei region, 2010–2020.
Year   ( t i t i + 1 ) ΔCΔCEFΔCESΔCEIΔCAΔCP
2010–20113696.270.00−14.22−4615.767563.11763.14
2011–2012−1387.150.00−114.20−5517.023558.49685.58
2012–2013855.600.00−165.06−2360.833328.9452.55
2013–2014−2901.100.00−366.00−4889.642024.38330.16
2014–2015−2964.480.00−1188.03−2788.70839.09173.15
2015–2016900.450.00−191.60−2034.232976.80149.47
2016–2017−983.700.00−95.75−3198.492345.53−34.99
2017–20181234.250.00599.97−1441.712164.51−88.53
2018–2019−4772.410.00−4.18−2435.86−2426.4294.04
2019–2020−6600.540.003.26−7406.31695.39107.12
Total−12,922.820.00−1535.80−36,688.5523,069.832231.70
Table 5. Decomposition results of NOX emission influencing factors of thermal power units in Beijing–Tianjin–Hebei region, 2010–2020.
Year   ( t i t i + 1 ) ΔCΔCEFΔCESΔCEIΔCAΔCP
2010–20114.757−3.356−0.000−9.64716.1131.647
2011–2012−7.152−4.4080.029−11.4487.2751.400
2012–2013−13.086−14.768−0.002−4.4726.1060.051
2013–2014−23.672−19.793−0.219−7.0392.9100.469
2014–2015−21.999−19.899−0.162−2.8470.7470.163
2015–2016−5.197−6.0560.002−1.3372.0810.112
2016–2017−10.148−9.651−0.003−1.6921.1930.005
2017–2018−2.481−2.782−0.003−0.4860.805−0.015
2018–2019−0.8420.944−0.003−0.997−0.8200.035
2019–2020−0.5082.4320.003−3.2950.3180.033
Total−80.328−77.337−0.359−43.26136.7293.900
Disclaimer/Publisher’s Note: The statements, opinions and data contained in all publications are solely those of the individual author(s) and contributor(s) and not of MDPI and/or the editor(s). MDPI and/or the editor(s) disclaim responsibility for any injury to people or property resulting from any ideas, methods, instructions or products referred to in the content.

