Abstract
In recent years, investing based on ESG performance has become a mainstream investment strategy in the market. In this context, this study selected A-share listed companies from 2010 to 2022 as samples and adopted a panel fixed-effect model to empirically test the impact and mechanism of ESG performance on continuous innovation. The research showed that ESG performance could significantly promote corporate continuous innovation. The mechanism tests found it worked mainly through the channels of alleviating financing constraints, increasing social trust, reducing agency costs, focusing on human capital, and enhancing social capital. Heterogeneity tests found that this effect was more significant for state-owned enterprises, weak marketization, and epidemic shocks. Further research showed that ESG exhibited a more significant level of sustained innovation in the growth and maturity stages. And ESG performance had a significant contribution to corporate innovation resilience. The conclusions of this study enrich the research in the field of ESG performance and corporate continuous innovation and provide empirical evidence for strengthening sustainable development strategies.
1. Introduction
With the popularization of the concept of sustainable development in the economic, social, and environmental fields, the tendency to invest in ESG performance as a new sustainable development concept has become clearer. In addition to focusing on the financial performance of enterprises, ESG performance comprehensively and objectively evaluates enterprises in terms of non-financial factors, such as environmental protection, social responsibility, and corporate governance. The goal is to realize the concept of sustainable development that unifies economic value and social value. Therefore, ESG performance has become the focus of attention of enterprises and investors [1]. ESG was first proposed by the United Nations Global Compact in 2004. By the end of 2022, more than 90 countries and 5311 organizations around the world had joined the UN Principles for Responsible Investment (UN PRI). Among them were 123 organizations in mainland China, which made China one of the fastest-growing countries in terms of the number of signatories in the past three years. ESG-themed financial products, such as ESG funds, ESG bonds, and ESG insurance, have become the new favorites of current financial products. By the end of 2022, there were 624 ESG public funds in China, with a total scale of about CNY 518.2 billion (data source: Report on ESG Actions of Chinese Listed Companies (2022–2023)). ESG performance is getting more and more attention.
Enterprises are the backbone of high-quality socio-economic development. ESG factors are becoming increasingly important in corporate strategic decision making. This trend is closely linked to society’s expectations of corporate social responsibility and investors’ focus on sustainability performance. Enterprises can effectively improve their market reputation [2], reduce their corporate risks [3], improve their investment efficiency [4], enhance their corporate value [5], and strengthen their sustainable development by strengthening their ESG performance. At the same time, it also enables enterprises to respond positively to the expectations of the state and society and strike a balance between economic and social values. ESG performance helps stakeholders to assess the risk and growth of companies. Nowadays, ESG performance has become an important index for assessing corporate value, and it is highly likely to change the mode of corporate evaluation and social development in the future. Therefore, it is of practical significance to study the ESG concept.
The current downward pressure on the economy has intensified, and it is therefore necessary to carry out continuous innovation in all areas by fully activating the role of innovation as the first driving force, continuously shaping new dynamics and new advantages in development, and driving high-quality development with scientific and technological innovation. Continuous innovation refers to the continuous alternation of new and old technological systems, and then the process of continuously generating new innovative projects and realizing the economic benefits of innovation [6]. It emphasizes the continuity in innovation inputs, outputs, and processes. At the microlevel, it refers to the enterprise’s current innovation and still has the ability to innovate in the future [7]. Continuous innovation has a cumulative effect over time. Jelinek et al. [8] proposed the term “innovation marathon”. Short-lived innovation outputs do not provide firms with lasting advantages. Once there is no sustained innovation output, the stage-by-stage advantage from innovation disappears [9]. According to Le Bas and Scellato [10], the competitive advantage of a firm depends mainly on its ability to innovate over a longer period. Differences in sustained innovation between firms result in larger differences in profitability. The continuous innovation of an enterprise requires its ability to identify problems, update solutions, and innovate continuously in an ever-changing environment. This is the key to the vitality and vigor of an enterprise in an increasingly competitive market and is the soul that promotes the high-quality and sustainable development of an enterprise. Therefore, does good ESG performance as a symptom of high-quality development significantly contribute to corporate continuous innovation? Research on this question is particularly important.
In view of this, this study took China’s A-share listed companies from 2010 to 2022 as research samples to investigate the impact and mechanism of ESG performance on enterprises’ continuous innovation. Furthermore, the existence of heterogeneous effects was investigated in terms of the equity of firms, the degree of marketization, and external shocks. On this basis, we explored the role of ESG performance of different life cycles in corporate continuous innovation.
The contribution of this paper is mainly reflected in the following. First, it expands the research perspective on innovation. Most of the previous studies focused on the factors that affected innovation input and innovation output, which ignored the important position of continuous innovation in the long-term value of enterprises. Continuous innovation is conducive to cracking the current bottlenecks in economic development, thus making up for the short term of high-quality development, and has far-reaching significance in promoting the sustained and rapid development of China’s economy. Second, it complements the economic consequences of ESG performance in China. Currently, China is still in the exploration stage of ESG performance. Previous research mainly focused on analyzing the impact of ESG performance on the short-term performance of enterprises. Meanwhile, continuous innovation is an important part of the long-term development of enterprises, which is in line with the ESG concept. This study examined the new contexts that affect corporate continuous innovation from an ESG perspective and examined the underlying mechanisms from the perspectives of financing constraints, social trust, agency costs, human capital, and social capital. It proved to be prospective and instructive for enhancing the disclosure of China’s future ESG performance. Third, at present, China’s ESG information disclosure standards are missing and ESG investment regulation is absent. This study analyzed China’s characteristic market, especially for different types of enterprises and degree of marketization. It provides a basis for relevant government departments to formulate ESG disclosure content, disclosure rules, and evaluation systems applicable to Chinese scenarios.
2. Literature Review and Research Hypothesis
2.1. Literature Review
In recent years, the concept of ESG has received sustained attention from domestic and foreign scholars. It mainly includes the study of factors that affect ESG performance and the economic consequences of ESG performance. In the study of the economic consequences of ESG performance, studies mainly explored the relationship between corporate ESG performance and investment and financing. ESG performance plays a significant role in easing financing constraints [11], reducing corporate financing costs [12,13], improving corporate investment efficiency [4], enhancing sustainability performances [14], and promoting a sustainable growth rate [15]. In addition, other studies found that ESG performance has a positive impact on firms, including suppressing corporate risks [3,16], boosting the labor income share [17], promoting green innovation in firms [18], improving earnings sustainability [19], lowering audit fees [20], and enhancing firms’ voice in the supply chain [21]. ESG performance serves as a signaling mechanism to convey to the public the mechanism of an enterprise’s role in the environment, society, corporate governance, and other aspects. It reduces information asymmetry, helps investors effectively identify risks and opportunities that cannot be recognized by traditional financial indicators, and more accurately assesses the sustainability and value of the enterprise. The better the ESG performance, the better it reflects the long-term value of the company.
Current research on enterprise innovation mainly focuses on the innovation input and innovation output of enterprises, while there are relatively few studies on the continuous innovation of enterprises. In the early stage, some scholars mainly studied the influence mechanism of continuous innovation from the perspectives of system, organization, and management [6,22]. Later, empirical analysis was applied to explore the factors that affect firms’ continuous innovation from different perspectives. It was found that the internal organizational structure factors, such as easing financing constraints [23], the diversification strategy for technology [24], and strong control of the general manager [25], play a role in promoting continuous innovation. Other scholars looked at the economic consequences of continued innovation. He et al. [26] found an inverted U-shaped relationship between continuous innovation and firm performance. Yao et al. [27] found that continuous innovation in firms contributes to the high-quality development of distressed firms. Xu et al. [27] found that a firm’s combination of knowledge from multiple sources is a key factor for continuous innovation. Ye et al. [28] found that OFDI has a facilitating effect on continuous innovation from the analysis of national factors.
It is worth noting that although scholars have studied continuous innovation from different perspectives and produced richer results, the role played by ESG concepts in continuous innovation is more worthy of in-depth study in the important context of sustainable development. Previous studies investigated the impact of ESG performance on firm innovation [27,29,30]. They found that ESG performance significantly improves the innovation input, innovation output, and innovation quality of enterprises through easing financing constraints, improving employee efficiency, and enhancing social capital acquisition ability. Few studies explored the relationship between ESG performance and continuous innovation. Continuous innovation is extremely closely related to the three dimensions of ESG performance in decision making, which is a comprehensive reflection of environmental protection aspects, including green innovation and quality enhancement; social responsibility to suppliers, consumers, government, and employees; and corporate governance aspects, such as board structure and internal control. Continuous corporate innovation largely reflects the results of the impact of ESG performance on corporate sustainable behavior. Especially in developing countries, the study has important theoretical and practical significance in terms of the channels through which practicing ESG concepts will affect corporate continuous innovation.
2.2. Research Hypotheses
2.2.1. ESG Performance and Corporate Continuous Innovation
In the uncertain market competition environment, continuous innovation is of great value to enterprises and is an important means for enterprises to achieve endogenous growth. However, in the governance model of separation of ownership and control, information asymmetry often leads to different degrees of principal–agent problems between managers and owners. Continuous innovation usually has the characteristics of a long cycle, high costs, and strong uncertainty [31]. Managers tend to reduce such investments in order to protect their reputation or to emphasize short-term profits [29]. Similarly, external investors are unable to effectively monitor corporate behavior due to information asymmetry, and thus, tend to invest in short-cycle, low-risk projects.
The ESG concept can break this dilemma. Within the limited focus of investors, ESG performance has become an important factor when making decisions. ESG disclosure alleviates the degree of information asymmetry between internal and external enterprises to a certain extent [27,32]. Investors can judge the sustainability of a company through its public ESG performance. Companies with better ESG performance are more likely to achieve sustainable earnings and stable financial performance. Usually, investors assign higher valuations, and the positive impact on business performance is favored by long-term investors [12]. On the other hand, companies with environmental, social, and other issues are assigned lower valuations. This concern invariably generates external pressure on corporate managers. When ESG performance fails to meet expectations, investors will question the ability of corporate management. Through their voice or exit approach, they force management to invest resources to improve corporate ESG performance [29]. Continuous innovation is an extremely relevant reflection of a firm’s ESG performance over the long term. It reflects the market’s ability to allocate resources to sustainable development.
According to resource dependence theory and stakeholder theory, ESG plays a key role in the allocation of enterprise resources and influences the investment of enterprises in innovation. Enterprises with good ESG performance usually have a more reasonable strategic structure and are supported by investors, creditors, and other stakeholders, which reduces the uncertainty caused by insufficient resource allocation and promotes corporate continuous innovation [33,34]. In addition, enterprises with good ESG performance can reduce the social resistance and operating costs in operation through releasing positive signals and positive feedback from the market [5], and enhance the ability to continuously innovate. Reputation theory further states that enterprises with good ESG performance can effectively enhance their corporate image. It releases signals to the outside that it has long-term development prospects, such as protecting the ecological environment, undertaking social responsibility, improving internal governance, and operating well [35]. It also attracts talent and capital [36], and has more opportunities to cooperate with other enterprises and resist innovation risks, and thus, enhances the sustained innovation ability of the enterprise. In summary, the following hypothesis is proposed:
Hypothesis 1.
ESG performance can promote corporate continuous innovation.
2.2.2. ESG Performance, Financing Constraints, and Corporate Continuous Innovation
Enterprise innovation is different from other investment activities in the form of a one-time investment since it is a continuous investment and accumulation process. Once funding is interrupted in the innovation process, the project often stops and faces huge losses. Therefore, financing constraints are one of the main obstacles to sustained innovation, and the ESG concept provides a solution to this problem. On the one hand, the good ESG performance of enterprises sends a signal to the outside world that the current and future long-term development is positive. It helps to attract investors and reduces the risk inherent to investments. It eases financing constraints through lower financing costs and reduces the lack of motivation for continuous innovation due to a shortage of capital [13]. On the other hand, ESG disclosure provides stakeholders with new perspectives on the current state of business and sustainable development. Dhaliwal et al. [37] found that enterprises with outstanding non-financial performance can obtain lower financing costs and wider financing channels. In addition, the government will encourage enterprises to innovate through fiscal and tax policies, such as capital investment, subsidies, discount loans, and the pre-tax deduction of research and development expenses, which further release positive signals to the outside world [38]. At present, financial institutions have successively launched green loans, including environmental protection loans, energy-saving and emission reduction loans, clean energy loans, and other innovative green financial products, which further increase the source of funds for enterprises with good ESG performance and provide financial support for the continuous innovation of enterprises. Thus, good ESG performance can alleviate financing constraints, which, in turn, accelerates continuous corporate innovation. In summary, the following hypothesis is proposed:
Hypothesis 2.
ESG performance promotes corporate continuous innovation by alleviating financing constraints.
2.2.3. ESG Performance, Social Trust, and Corporate Continuous Innovation
Trust is a prerequisite for the orderly operation of a “relational” society. It helps to improve the trust between enterprises and their internal efficiency, and promotes the circulation of internal and external resources. It further promotes continuous innovation [39]. Social trust, as a key social capital, is regarded as an important factor in promoting regional economic development, in addition to physical and human capital [40]. Regions with a high level of social trust curb government crowding out of corporate profits, improve the efficiency of government regulation, increase the expected return on corporate innovation, and incentivize sustained innovation. The implementation of the ESG concept positively affects the level of social trust in the region and becomes a powerful tool for building social trust. ESG implementation not only makes stakeholders more willing to trust enterprises that actively undertake social responsibility but also enhances customer and employee loyalty; increases investor trust; and establishes extensive cooperative relationships with suppliers, customers, and partners [29]. It also enhances the reputation of the region in which the enterprise is located through the trust relationship established with stakeholders, promotes the flow of and access to resources, and then promotes continuous innovation. In addition, the ESG concept emphasizes long-term sustainability rather than short-term profits. Enterprises are strongly motivated to fulfill their social responsibilities and value environmental protection [27]. This encourages the public to believe in the possibility of sustainable development, which, in turn, makes it more likely that companies will build stable relationships within the region and enhance social acceptance. For irresponsible enterprises, “voting with feet” makes enterprises withdraw from the region. In this way, the level of social trust in the regions where companies with good ESG performance are located increases. Therefore, the following hypothesis is proposed:
Hypothesis 3.
ESG performance promotes corporate continuous innovation by enhancing the level of social trust.
2.2.4. ESG Performance, Agency Costs, and Corporate Continuous Innovation
Continuous innovation is usually accompanied by a long cycle and high risk. Due to the principal–agent problem, management is more inclined to invest in short-term projects with fast performance improvement and neglect long-term innovation investment, or even conceal inside information, which exacerbates the opportunistic behavior of managers and inhibits continuous innovation. Good ESG performance can mitigate this dilemma [41]. Firms with good ESG performance actively undertake environmental responsibilities, fulfill social obligations, and strengthen internal governance and external interactions, which reduces managerial opportunistic behavior and agency costs. In addition, complete information disclosure reduces information asymmetry, lowers monitoring and constraint costs, and improves the principal–agent relationship. Based on the reputation mechanism, management is linked to corporate reputation. Management’s behavior tends to be more consistent with the long-term interests of the enterprise, avoiding inefficient investment for private interests [4], and focusing resources on continuous innovation. The convergence of interests makes the management reduce the agency cost, improve the efficiency of internal capital operation, reduce the cost of rent seeking and on-the-job consumption, and provide more funds for the continuous innovation of the enterprise [42], which ultimately enhances the continuous innovation of the enterprise. Therefore, good ESG performance can reduce agency costs and inhibit the crowding-out effect of management on continuous innovation, thus improving the firm’s capacity for continuous innovation. This leads to the following hypothesis:
Hypothesis 4.
ESG performance promotes corporate continuous innovation by reducing agency costs.
2.2.5. ESG Performance, Human Capital, and Corporate Continuous Innovation
Continuous innovation depends not only on access to information and resources but also on the knowledge level and innovation ability of core employees. Companies with good ESG performance have a responsible image and attract high-quality people with the same values and responsibility, including senior executives, independent directors, and R&D personnel, and enhance the level of human capital of the company. An enterprise’s advantage in talent competition not only improves employee stability and loyalty and reduces internal inefficient behavior but also stimulates management’s motivation to innovate and accelerates continuous innovation [43]. According to Schumpeter, innovation first depends on the leader’s willpower. The level of corporate innovation depends to a certain extent on the cognition of managers. Managers take great risks in allocating innovation resources and pursuing long-term returns by sacrificing current gains. Manso’s [44] study stated that increasing the level of innovation requires tolerance for early failure [44]. Regulations such as long-term compensation plans and employee security guarantees in ESG concepts enhance employees’ sense of belonging and growth motivation, stimulate employee enthusiasm, and avoid hasty behavior, and thus, promote continuous innovation. In addition, good ESG performance helps to build an innovative corporate culture, increase employee satisfaction and engagement, and enhance employee cohesion. As a result, companies with good ESG performance are increasingly focusing on human capital to drive continuous innovation. This leads to the following hypothesis:
Hypothesis 5.
ESG performance promotes corporate continuous innovation by focusing on human capital investment.
2.2.6. ESG Performance, Social Capital, and Corporate Continuous Innovation
Social capital refers to the ability of an enterprise to access resources and benefit from them through social relationships [45]. While the definition of social capital is broad, this study focused on the network of relationships embedded in the social structure that helps firms to improve their absorptive capacity [46]. Firms are usually unable to sustain innovation on their own with their own resources, and tapping into and efficiently utilizing resources becomes critical. The support of strong social network relationships is indispensable in this process. Social networks can provide enterprises with rich information and resources. Gulati et al. [47] pointed out that the difficulty of replicating and endemicity of social relationship networks gives firms a unique competitive advantage in competition. When companies practice ESG concepts, the positive signals released can attract potential partners and form synergistic groups with shareholders, suppliers, customers, competitors, financial institutions, scientific research institutions, environmental groups, etc., and gain more support from social capital [27,48]. Zhang et al. [49] believed that the ESG concept facilitates the accumulation of social capital and the establishment of business cooperation networks. The more relationship networks and resource paths are available to firms with good ESG performance, the more heterogeneous information and resources are enriched. At the same time, the greater the ability of centrally located firms to control external innovation resources [49,50], the lower the cost required to acquire resources [51]. As a result, ESG advantages make it easier for firms to establish investment, financing, and cooperation relationships and form close social networks. This not only attracts customers, suppliers, and increased services that can be guaranteed for them but also strengthens communication and cooperation with financial institutions, upstream and downstream supply chains, etc., to obtain value-added network services. In addition, it attracts more shareholders to invest [49], which, in turn, incentivizes companies to continue to innovate [52]. In summary, the following hypothesis was formulated:
Hypothesis 6.
ESG performance promotes corporate continuous innovation by increasing social capital.
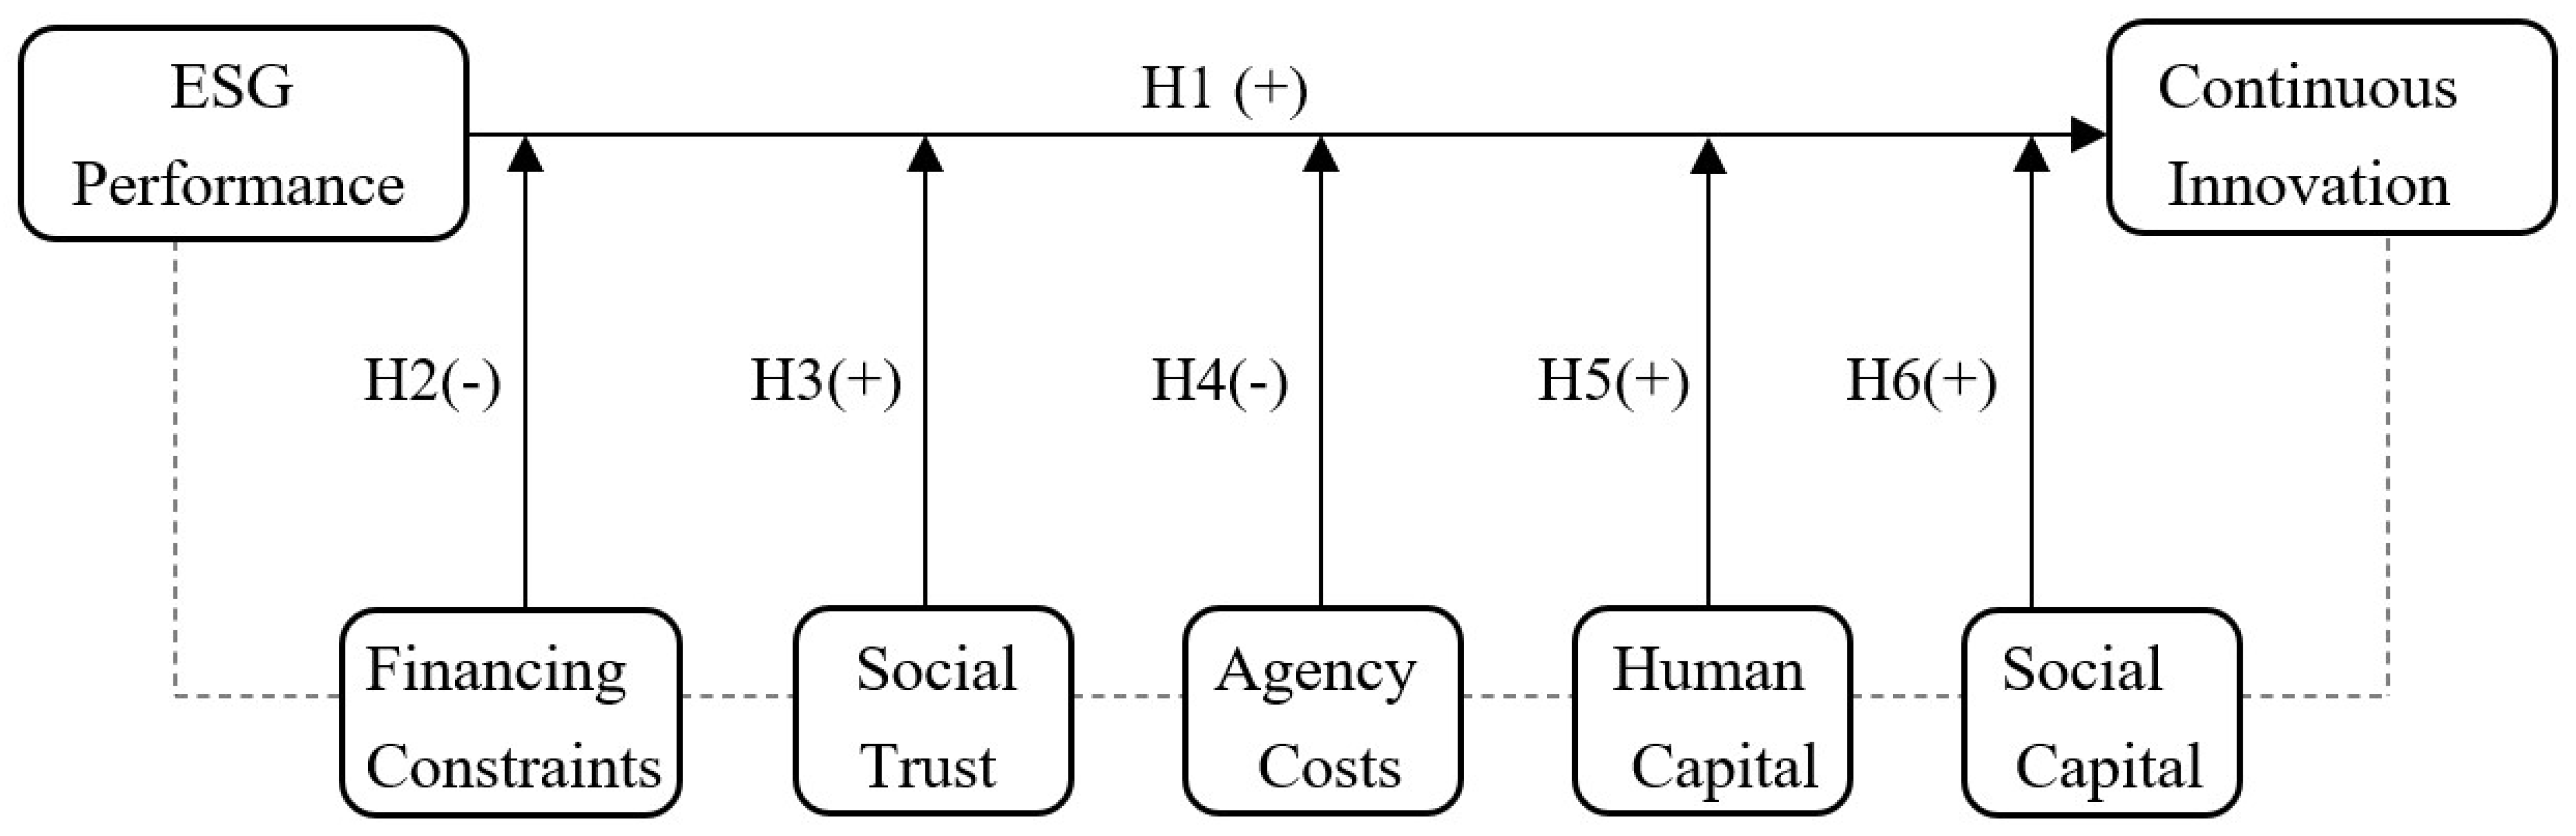
The theoretical model of this research is shown in Figure 1.
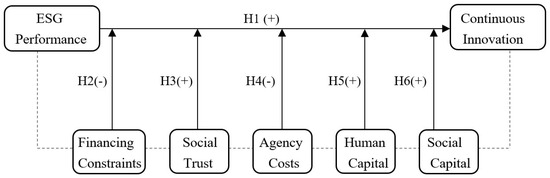
Figure 1.
Theoretical framework. Note: [+] positive relationship, [−] negative relationship.
3. Research Design
3.1. Sample Selection
This study selected the listed companies of Shanghai and Shenzhen A-share companies from 2010 to 2022 as the initial sample. Even though the initial stage of ESG development in China can be traced back to 2005, it entered the promotion stage in 2010 with the issuance of the Guidance on Promoting Social Responsibility Information Disclosure, which required listed companies to disclose social responsibility information in accordance with regulation. In 2010, ESG entered the mainstream financial practice. Therefore, this study started the research from 2010. Furthermore, this study excluded special types of companies, such as ST, *ST, and the financial industry. ST (companies that suffered losses for two consecutive years, with net assets below stock par value) and ST* (losses for three consecutive years subject to delisting risk warning) companies are specifically treated because of their poor financial condition or other material risks, and their financial data and business performance may differ significantly from those of other companies. The business models and financial structures of financial companies differ significantly from those of companies in other industries, and their financial statements and business data are not universally representative. To ensure the relevance and validity of the analysis, these companies needed to be excluded. The samples with missing data were excluded, and the main continuous variables were shrink-tailed at the 1% level in order to exclude the influence of outliers. The final main regression test included 27,094 data. The relevant data of listed companies were from the China Stock Market and Accounting Research Database (CSMAR) (http://data.csmar.com (accessed on 20 August 2024)), and the data of innovation patents were from the China Research Data Service Platform (CNRDS) (https://www.cnrds.com (accessed on 20 August 2024)).
3.2. Variable Definitions
3.2.1. Dependent Variable
Continuous innovation (OIP): Referring to the methods of Triguero et al. [53] and He et al. [26], continuous innovation was measured by the dimensions of innovation output (patent applications). The product of the chain growth rate of innovation output (patent applications) and the size of output were used to measure continuous innovation. Values were divided by 100 to avoid the effect of the scale. The methodology reduced the impact of the “intermittent” nature of patenting and the size of patent applications through chain growth rates when measuring continuous innovation.
where , , and are the number of patent applications filed by the firm in years t, , and .
3.2.2. Independent Variable
ESG performance (ESG): There are currently a range of metrics to measure ESG ratings, including CNRDS, Bloomberg, and the China Sino-Securities Index (CSI). Any indicator to quantify ESG ratings needs to cope with incomplete and opaque data and methods. In this study, we drew on the methodology of Xie et al. [54] and Fang et al. [29] and choose a representative CSI ESG rating to measure ESG performance. The reasons were as follows: First, the calculation was quantitatively based. CSI ESG rating draws on the development experience of mainstream ESG systems in foreign countries and combines with the characteristics of the domestic market to construct a three-level indicator evaluation system. It integrates traditional and other data that covers public disclosure data of listed companies, social responsibility reports, sustainability reports, data from regulators’ websites, and news media reports. Second, the data are updated in a timely manner. CSI ESG indicators use a combination of quarterly periodic evaluation and dynamic tracking for data adjustment, which is highly timely. Third, CSI ESG indicators cover all A-share listed companies, which is highly representative. The CSI ESG rating data are from the Wind Financial Information Terminal. The index is categorized into nine grades: AAA, AA, A, BBB, BB, B, CCC, CC, and C. This study assigned values from 9 to 1 from high to low.
3.2.3. Control Variables
Referring to Eliwa et al. [12] and Raimo et al. [13], the following control variables were selected in this study: the proportion of the first shareholder’s shareholding (Big1), the proportion of independent directors (Indep), the ratio of the net cash flow from operations to the total assets (Cashassets), Tobin’s Q value (Tobinq), the return on net assets (Roe), the number of employees (Staff), the number of executives (Executives), and the year of incorporation (Fage).
Based on this, the descriptions of the variables are summarized in Table 1.

Table 1.
Descriptions of variables.
3.3. Model Setup
Drawing on the approach of Li et al. [55], in order to verify the relationship between the ESG performance and corporate continuous innovation, this study constructed the following model:
In the model, the subscript i represents the individual sample, and t represents the year. The dependent variable OIP represents the corporate continuous innovation. The independent variable ESG represents the ESG performance. Controls represent the control variables. We also controlled for firm and year fixed effects. Additionally, to control for estimation bias due to possible heteroskedasticity and time-series correlation of the error terms, the estimated standard errors were clustered at the firm level. If the coefficient was significantly greater than 0, the proposed Hypothesis 1 was supported.
3.4. Descriptive Statistics
Based on the above main variables, descriptive statistics were constructed and analyzed in Table 2. Among them, the mean and standard deviation of ESG were 4.194 and 1.061, which indicates that there was still a lot of room for progress in ESG. This indicates that the average rating of firms was low, while there were large variations within firms and there was still a lot of room for improvement. The mean value of the number of continuous innovations (OIP) of firms was 1.556, with a standard deviation of 3.876 and the median and maximum values of 0.3836 and 28.92, respectively. This suggests that firms were generally low in continuous innovations and the differences between firms were much larger than the differences between ESG performances. Firms need to emphasize their ability to continuously innovate. The descriptive statistics of the control variables were generally consistent with previous studies.
Table 2.
Descriptive statistics of the main variables.
3.5. Correlation Test
Table 3 reports the Pearson correlation test. The coefficient between ESG and OIP was 0.085, which was significant at the 1% level and initially verified that the firm ESG performance could promote continuous innovation. The correlation coefficients between the other main variables were below 0.5, which proved that there was no serious covariance in the sample.
Table 3.
Correlation analysis.
4. Empirical Results and Analysis
4.1. Benchmark Regression Results
Table 4 reports the results of the benchmark regressions of firms’ ESG ratings on continuous innovation. Column 1 does not include the control variables and fixed effects. Column 2 does not include the control variables but includes yearly and industry-fixed effects. Column 3 adds the control variables and includes yearly and industry fixed effects. Table 4 shows that the coefficients on the variable ESG were significantly positive at the 1% level regardless of whether the control variables were added and whether the year and industry were fixed. The better the firm’s ESG performance, the stronger the firm’s ability to sustain innovation. Hypothesis 1 was verified.
Table 4.
Benchmark regression results.
4.2. Endogeneity Tests
To enhance the reliability of the results and mitigate possible endogeneity problems in the model, this study used lagged independent variables, instrumental variables method, propensity-score-matching method, and the addition of omitted variables method to conduct endogeneity tests.
4.2.1. Lagging Independent Variables
The endogeneity problem caused by two-way causality can be alleviated to a certain extent by lagging the independent variables by one, two, and three periods. From the analysis of the benchmark regression test, it can be seen that the better the ESG performance of the firm, the stronger the continuous innovation ability. However, there may be a situation where a firm’s strong sustained innovation ability leads to a firm’s good ESG performance, which generates the endogeneity problem due to reverse causation. Therefore, this study conducted a regression test with lag one (L.ESG), lag two (L2.ESG), and lag three (L3.ESG) of ESG as independent variables. In Table 5, the coefficients were 0.1257, 0.1310, and 0.0797, respectively, and all were significantly positively correlated at the 1% level. Preliminarily, endogeneity problems were ruled out and the benchmark regression effect remained significant.
Table 5.
Lagging independent variables.
4.2.2. Instrumental Variables Method
To further solve the endogeneity problem using the instrumental variables method, currently, it is common to use the average ESG rating of a company’s region or industry over the same period as an instrumental variable for a company’s ESG performance [20,56], which is controversial. Drawing on the methodology of Xie et al. [54], this study used the number of shares of firms held by ESG-themed public equity funds (fundnum) as an instrumental variable for ESG performance (data sources: China Responsible Investment Report 2022; this report contains detailed disclosure of ESG funds as of 31 December 2022, where the themes include ESG Preferred, ESG Excluded, Green Low Carbon Preferred, Energy Saving and Environmental Protection Sector, and Corporate Governance Preferred). First, the ESG performance is relevant to ESG public equity funds. ESG-themed public funds will emphasize the firm’s ESG performance in which they hold shares. Public equity fund managers usually enhance communication with shareholders to promote the ability of companies to emphasize ESG performance. Second, ESG funds are usually exogenous. It is mainly the fund company that decides on matters such as its establishment, size, shareholding, and share. It will not have a direct correlation to the continuous innovation of enterprises. Therefore, ESG-themed public funds also satisfy the exogeneity requirement. Table 6 shows that the coefficient on the instrumental variable fundnum in the first stage regression was significantly positive at the 1% level. This means that ESG-themed public funds were significantly positively associated with ESG performance. The estimated coefficients on ESG performance in the second-stage regression results were also significantly positively correlated at the 1% level. This means that the baseline regression test remained significant after controlling for potential endogeneity issues through the instrumental variable. Hypothesis 1 was further tested.
Table 6.
Instrumental variables method.
4.2.3. Propensity-Score-Matching Method (PSM)
To mitigate possible model-setting bias, the entire sample was first divided into experimental and control groups using the median ESG rating as a benchmark. When the ESG rating was greater than the median, this was defined as a better ESG performance and set as the experimenter. Take 1 at this point and 0 otherwise. Subsequently, based on the propensity scores estimated from the control variables, the closest match method was applied to match according to a 1:1 ratio, and the propensity scores were computed using the logit model. Matching started from the individual with the smallest difference in propensity scores between the two groups. Finally, the matched samples were regressed. Column (1) of Table 7 shows that the ESG performance remained significantly and positively correlated with continuous innovation.
Table 7.
PSM method and addition of omitted variables.
4.2.4. Adding Omitted Variables
In addition to the firm’s internal factors, industry factors and the external environment may affect the firm’s continuous innovation. Therefore, to alleviate the endogeneity problem that arises from omitted variables, this study drew on the methodology of Song et al. [20]. The industry factors of institutional investor shareholding and industry competitiveness and the macroeconomic level factors of GDP growth rate and urban unemployment rate were added to the benchmark regression model. Column (2) of Table 7 shows that the results remained significant.
4.3. Robustness Tests
4.3.1. Replacement of Dependent Variables
The relationship between ESG performance and firms’ continuous innovation was re-tested using the ratio of incremental intangible assets to total assets (Inv) to measure the firms’ continuous innovation. The results are shown in column (1) of Table 8, where the results remained significantly positively correlated.
Table 8.
Robustness tests.
4.3.2. Replacement of Independent Variables
- (1)
- The nine ratings classified by the CSI ESG rating were based on the disclosure scores. Here, the independent variables were re-tested by replacing the ESG score (ESG1), as shown in column (2) of Table 8, and the results were still significantly positively correlated.
- (2)
- Different third-party ESG rating agencies have different evaluation systems, which results in different ESG ratings. To avoid the inconsistency of ESG performance due to different ESG ratings, this study used the Bloomberg ESG score (ESG2) as an independent variable. Bloomberg statistics on the ESG ratings of Chinese listed companies have fewer sample observations. This study used the currently existing Bloomberg ESG rating data as an independent variable for robustness testing, as shown in column (3) of Table 8, and the results remained significant.
5. Further Discussion
5.1. Mechanism Tests
5.1.1. Alleviating Financing Constraints
Drawing on Hadlock et al. [57], this study used the SA index and the SA index of the previous period to measure financing constraints. Where the SA index was negative, the larger the value, the smaller the financing constraint. The results, as shown in columns (1) and (2) of Table 9, were both significant. The firms with good ESG performance could effectively alleviate financing constraints. Hypothesis 2 was verified.
Table 9.
Mechanism tests.
5.1.2. Increase Social Trust
To test hypothesis 3, this study drew on the methodology of Li et al. [40]. The measure of “creditworthiness by region” (Credit) was chosen. It was confirmed that the change process of trust is very slow and does not change over a long period, and it is often used as a substitute for panel data studies in empirical analysis. Column (3) of Table 9 shows that the companies with a good ESG performance could contribute to the level of social trust in their region. Hypothesis 3 was verified.
5.1.3. Reducing Agency Costs
Referring to Ang et al. [58], this study adopted the operating expense ratio (AC1) as an indicator of agency costs. The operating expense ratio is equal to the ratio of the sum of administrative expenses and selling expenses to operating income. Drawing on Ang et al. [58], we used the administrative expense ratio (AC2) to measure the agency cost of the firm, where the administrative expense ratio is equal to the ratio of administrative expenses to operating income. Columns (4) and (5) of Table 9 show that the firms with good ESG performance significantly reduced their agency costs, and thus, Hypothesis 4 was verified.
5.1.4. Valuing Human Capital
Drawing on the methodology of Wu et al. [59], this study used the average compensation of the top three executives of the enterprise (Salary1), and the average compensation of the executives (Salary2) for the measurement. Columns (6) and (7) of Table 9 show that the ESG performance was significantly associated with the level of executive compensation. Hypothesis 5 was validated.
5.1.5. Increasing Social Capital
Corporate social capital currently lacks a unified measurement method. This study measured it from the perspective of social relationship networks. Shareholders are the most important stakeholders. We used shareholder networks to measure social capital, degree centrality (degree), and eigenvector centrality (eigenvector) as the measurement indexes. Columns (8) and (9) of Table 9 show that the firms with good ESG performance could significantly improve their position in the shareholder network and increase social capital. Hypothesis 6 was verified.
5.2. Heterogeneity Tests
5.2.1. Nature of Equity
The nature of equity may have an impact on the relationship between the firms’ ESG performance and continuous innovation. State-owned enterprises assume more social functions, are subject to more government regulation, and have both economic and political roles. State-owned enterprises are an important way for the government to promote high-quality development. In contrast, non-state-owned enterprises are more concerned with their own economic interests. State-owned enterprises have advantages in terms of associated transactions, financial subsidies, external financing, etc., and there is a soft budget constraint. As a result, financing constraints are small, funds tend to be more abundant, and required resources are easily available. However, state-owned enterprises tend to have relatively more serious principal–agent problems. Management is reluctant to participate in high-risk innovative projects, even if there are high returns. However, ESG performance can effectively improve the governance model of state-owned enterprises, which makes management more willing to take risks. In recent years, the assessment of government officials no longer involves a single economic indicator, but a comprehensive indicator of the economic and social environment. This provides an environment for continuous innovation. Therefore, this study expected that the better the ESG performance in state-owned enterprises, the more significant the advancement of the firms’ continuous innovation.
To test the role of the nature of equity on ESG performance and firms’ continuous innovation, where the nature of equity was 0 for SOEs and 1 for private. The regression of the interaction term between the ESG performance and the nature of equity was added to Equation (2):
Column (1) of Table 10 shows that the cross-multiplier term was significantly negative at the 5% level. This indicates that the positive effect of the firms’ ESG performance on continuous innovation was more significant in state-owned enterprises. Because of the fierce market competition, private enterprises themselves have a high willingness to innovate, and ESG has a limited impact on the level of innovation. Comparatively, ESG can improve the principal–agent problem of state-owned enterprises, and the assessment of government officials includes comprehensive social and economic indicators. The better the ESG performance of state-owned enterprises, the better it can create an environment of social innovation for enterprises and promote the continuous innovation of state-owned enterprises.
Table 10.
Heterogeneity tests.
5.2.2. Degree of Marketization
The level of marketization varies significantly between regions in China. The degree of marketization may affect the relationship between the ESG performance and firms’ continuous innovation. Regions with a high degree of marketization usually have a higher level of economic development, better institutions, an easier ability to attract talent, less financing constraints, and enterprises that can access more resources to promote continuous innovation. Regions with a lower degree of marketization may have a legal system that is insufficient to protect stakeholder rights and interests, as well as limited resources. Companies with better ESG performance can make up for this shortcoming and inflow of high-quality talent and capital. There is a certain degree of substitution between ESG performance and the degree of marketization. This study measured the degree of marketization using the “government-market relationship” index from the China Marketization Index Database. Since the index ends in 2019, this study calculated the 2020–2022 marketization index based on the moving average growth rate of the 2017–2019 marketization index.
To test the role of the degree of marketization on ESG performance and firms’ continuous innovation, an interaction term regression between ESG and the degree of marketization was added to Equation (2):
Column (2) of Table 10 shows that the cross-multiplication term was significantly negative at the 1% level. The role of ESG performance on the firms’ continuous innovation was more significant in regions with weak marketization. Because firms in highly market-oriented regions focus on continuous innovation to capture the market, ESG has a limited impact on them. In contrast, ESG can compensate for the shortcomings of firms in regions with low marketization, and the better the ESG performance, the more incentives firms have to promote continuous innovation.
5.2.3. Impact of Major Public Health Events
Enterprise innovation usually requires a large amount of capital, a long period, high risk, and a continuous flow of funds to invest in the project. It is also easy to lose the initial investment in the event of a severe external shock. The sudden outbreak of COVID-19 at the end of 2019 created serious challenges for business operations. Many businesses stopped work and production, which left continued innovation severely impacted. The global economy is facing uncertainty. Based on stakeholder theory, in the face of external shocks, such as major health events, companies with good ESG performance are more likely to receive moral and material support from stakeholders since it is more helpful for the acquisition of resources and enhances the ability to cope with external shocks. As can be seen from Table 11, firms’ continuous innovation in the 3 years before the epidemic (2017–2019), the median and the 75% quartile continuously increased, and the average value showed an overall upward trend. In the 3 years of the epidemic (2020–2022), the mean, median, and 75% quartile continuously decreased. Therefore, is ESG performance beneficial in mitigating the challenges of companies that have been put on hold from sustaining innovation due to the shock of a major health event? The variable Covid was set to take 1 for observations in 2020–2022 and 0 for the rest. The regression of the interaction terms between ESG performance and Covid was added to Equation (2):
Table 11.
Statistics on continuous innovation in enterprises.
Column (3) of Table 10 shows that the coefficient of the cross-multiplier term was significantly positive at the 1% level. The ESG performance mitigated the negative impact of the firms’ continuous innovation due to the epidemic. Before the epidemic, the external influence on enterprise innovation was relatively small, and it was usually carried out in an orderly manner according to enterprise plans. When the epidemic occurred, the pace of the whole society slowed down, and the financing constraints of enterprises increased. Enterprises with good ESG performance can help to accumulate social and moral capital, enhance the willingness of stakeholders to cooperate in times of crisis, improve the ability to access resources, and provide favorable conditions for sustained innovation.
5.3. Extensive Research
5.3.1. Life-Cycle-Based Test
ESG performance examines a company’s medium- to long-term growth potential, which has a lasting impact on the company. It is easy to overlook the effect of the time dimension in research, with heterogeneity arising from different firm life cycles. It has been shown that firms’ innovation input decreases with life age and that firms in the growth period are more likely to innovate than those in the maturity period [60]. It was also found through patent data that firms’ innovation output decreases with the firm’s age [61]. It can be seen that innovation is very closely related to the life cycle. Start-ups and growing companies usually enter the market with new technologies and products. During the growth period, to improve market recognition and position in the same industry, or even to form a new industry, they usually focus on innovation inputs and outputs to strengthen the continuous innovation of the enterprise. As an enterprise develops through its life cycle, when it enters the maturity stage, it usually has more experience in production, is better financed, has abundant cash flow, and can continue to carry out innovative activities. The innovation is often a further transformation of the original product, optimization, and new products based on the original product, which thus enhances the enterprise’s ability to continue to innovate. During the decline period, the enterprise’s internal organizational structure tends to be rigid, operating income declines, capital flows are poor, the response to the market is not sensitive enough, and production equipment tends to age. The innovation ability declines and the level of innovation output is low. Based on this, this study investigated the relationship between ESG performance and continuous innovation in different life cycle stages of enterprises.
Drawing on the methodology of Dickinson [62] and Xiao et al. [23]. This study utilized the statement of cash flows to determine the stage of the life cycle in which it was located by the positive and negative combinations of net operating cash flows, net investing cash flows, and net financing cash flows. This method is less subjective and more reliable. The life cycle was divided into three stages, growth, maturity, and decline. The specific division criteria are shown in Table 12, and then the test was carried out by stages, and it was found that the ESG performance of enterprises in different life cycles was positively related to continuous innovation. The results were more significant in the growth and maturity periods in Table 13. Therefore, the ESG performance played an important role in the different life cycle stages of enterprises.
Table 12.
Segmentation of the enterprise life cycle.
Table 13.
Tests for different life cycle stages of a firm.
5.3.2. Impact of ESG Performance on Innovation Resilience
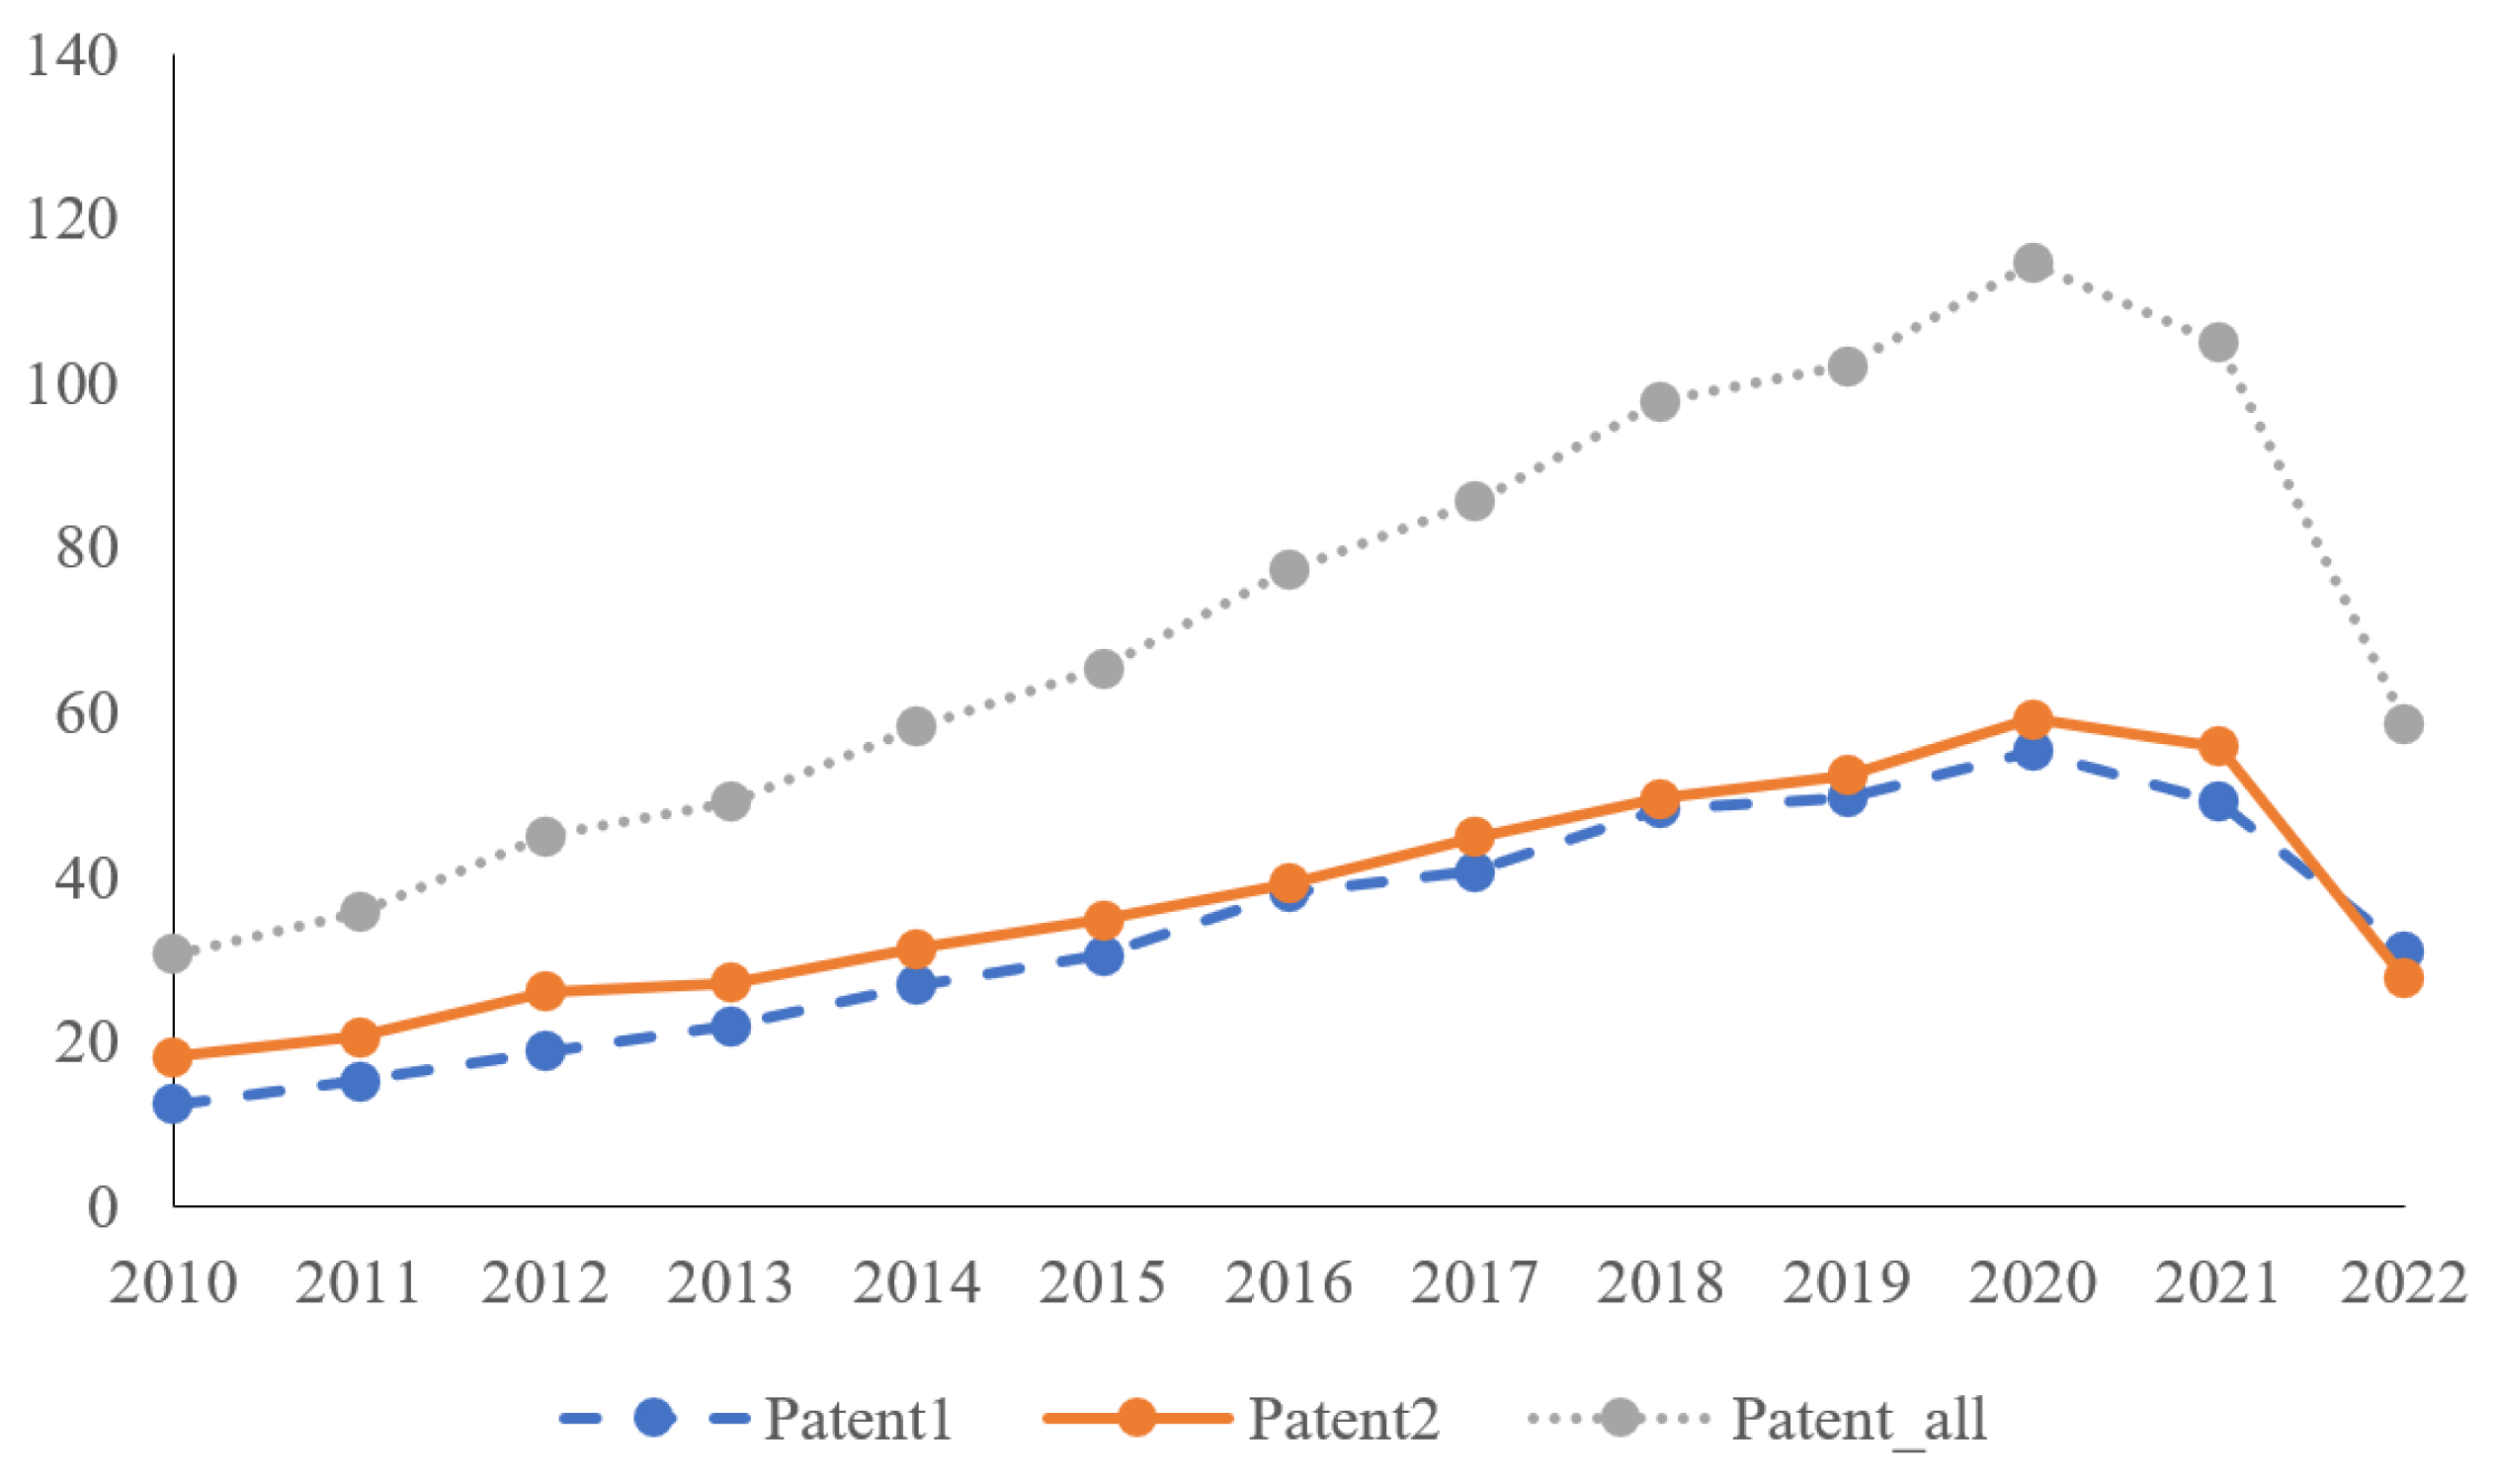
Along with the impact of COVID-19, the downward pressure on the global economy has increased. The ability and motivation of enterprises to innovate show certain vulnerabilities. Figure 2 demonstrates the average of the number of invention patents, the number of non-invention patents (the sum of utility model patents and design patents), and the total number of patents by year. Table 11 shows the sustained innovation capacity of enterprises. All of them can see the impact on the firms’ innovation under major health events. Therefore, effective external shocks are particularly important.
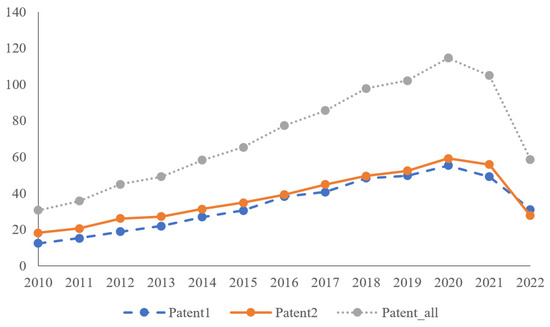
Figure 2.
Average patent applications 2010–2022.
A firm’s innovation resilience is its ability to adapt, adjust, and innovate quickly when disturbed by external changes, pressures, and uncertainties. It involves many influencing factors. In this study, we decomposed the firm’s innovation resilience in terms of continuity, flexibility, and creativity. It was further assessed using the core variables innovation input, innovation output, innovation authorization, and innovation efficiency indicators. Specifically, this study used research and development investment (R&D), the number of invention patents (Patent 1), non-invention patents (the sum of utility model patents and design patents, Patent 2), the total number of patent applications (the sum of invention patents and non-invention patents, Patent_all), the number of patents licensed (the same as the above classification methods, Applied1, Applied2, and Applied_all; these were lagged by one period due to the long granting cycle), and innovation efficiency (Eff1, Eff2, and Eff_all, with the same classification method as above) were studied separately. The results in Table 14 and Table 15 show that all were significantly positively correlated at the 1% level. This indicates that ESG performance was significantly and positively related to input, output, efficiency, and persistence of corporate innovation.
Table 14.
Studies related to ESG performance and innovation inputs and outputs.
Table 15.
ESG performance and innovation efficiency study.
6. Conclusions and Implications
6.1. Research Conclusions
As the main force to promote ESG development, enterprises should take ESG construction as an endogenous driving force, actively practice ESG concepts, and better play an important role in promoting high-quality economic development. Therefore, this study took A-share listed companies from 2010 to 2022 as a sample to examine the impact and mechanism of ESG performance on enterprises’ continuous innovation. First, it was found that ESG performance had a driving effect on firms’ continuous innovation. The findings remained significant through robustness tests, such as replacing core variables, instrumental variable method, and propensity score matching method. Second, the mechanism analysis found that it worked mainly through the channels of alleviating financing constraints, increasing social trust, reducing agency costs, focusing on human capital, and enhancing social capital. Third, the role was more significant in state-owned enterprises, low marketization, and epidemic shocks. Fourth, according to the research of enterprises in different life cycle stages, it was found that the relationship between ESG performance and continuous innovation was more obvious in the growth and maturity stages. Finally, the ESG performance had a positive effect on innovation input, innovation output, and innovation efficiency.
6.2. Policy Suggestions and Managerial Implications
The research in this study produced the following insights. First, we need to strengthen the leading role of government departments in the construction of ESG systems. The government can gradually promote the transition of the corporate disclosure mechanism to ESG from encouraging to obligating disclosure of ESG-related information. At present, ESG disclosure standards at the national level are imperfect, the supervision mechanism is missing, and there are more ESG rating agencies. Each organization has different indicator standards and evaluation methods. Enterprises are also unclear about the evaluation system. In addition, some of the information is highly motivated and lacks substantive and effective content. The relevant regulatory authorities should take into account national conditions, establish ESG concepts and evaluation systems through policy and regulatory guidance, improve specific details of ESG ratings, and promote the formulation of ESG information disclosure guidance documents. Second, for external investors, ESG performance should be included as an important consideration in investment decisions. Especially in the context of sustainable development, external investors, as external supervisors, can effectively push enterprises to actively fulfill their social responsibilities, improve corporate governance, and urge them to shape their internal operation and management systems. Third, enterprises, on the one hand, should pay full attention to the role played by ESG and avoid short-sighted behavior. ESG disclosure is not an additional task. Actively disclosing information related to ESG ratings and enhancing information transparency is of great significance to their sustainable development. At the same time, we learn ESG architecture indicators from professional organizations, and the new era is combined with digital transformation to build a more reasonable indicator system. On the other hand, the current economic downward pressure has increased, and the only hedge against it is continuous innovation. Improving ESG performance can strengthen stakeholders’ attention and incentivize enterprises to continue innovation. This will help enterprises to maintain their advantages in the changing external environment. Strengthening the concept of continuous innovation can enhance the core competitiveness of enterprises and ultimately enable them to realize sustainable development.
6.3. Limitations and Future Research
First, this study focused on the impact and mechanism of ESG performance on continuous innovation, without further analyzing the role and contribution of environmental (E), social (S), and governance (G) factors to continuous innovation. Future research could delve into different factors to assess how and to what extent each dimension affects continuous innovation. Second, the late introduction of ESG concepts into China has led to inconsistencies in the evaluation criteria of different organizations. The use of CSI ESG rating data in this study may introduce sample selection bias. In future research, with the improvement of data, more accurate analysis can be conducted using ESG ratings from more institutions. Third, this study focused on the problem of the continuous innovation of enterprises and did not deeply study the economic value brought about by continuous innovation. Future research can further investigate the economic consequences.
Author Contributions
Conceptualization, L.R. and Y.C.; methodology, L.R.; software, L.R.; validation, L.R.; formal analysis, L.R.; investigation, L.R.; resources, L.R.; data curation, L.R.; writing—original draft preparation, L.R.; writing—review and editing, L.R. and Y.C.; visualization, L.R.; supervision, L.R. and Y.C.; funding acquisition, Y.C. All authors read and agreed to the published version of this manuscript.
Funding
This research was funded by the National Social Science Fund of China (grant no. 18BGL008).
Institutional Review Board Statement
Not applicable.
Informed Consent Statement
Not applicable.
Data Availability Statement
Data are contained within the article.
Conflicts of Interest
The authors declare no conflicts of interest.
References
- Avramov, D.; Cheng, S.; Lioui, A.; Tarelli, A. Sustainable investing with ESG rating uncertainty. J. Financ. Econ. 2022, 145, 642–664. [Google Scholar] [CrossRef]
- Meng, T.; Yahya, M.H.D.H.; Ashhari, Z.M.; Yu, D. ESG performance, investor attention, and company reputation: Threshold model analysis based on panel data from listed companies in China. Heliyon 2023, 9, e20974. [Google Scholar] [CrossRef] [PubMed]
- He, F.; Ding, C.; Yue, W.; Liu, G. ESG performance and corporate risk-taking: Evidence from China. Int. Rev. Financ. Anal. 2023, 87, 102550. [Google Scholar] [CrossRef]
- Lian, Y.; Weng, X. ESG performance and investment efficiency. Financ. Res. Lett. 2024, 62, 105084. [Google Scholar] [CrossRef]
- Wong, W.C.; Batten, J.A.; Mohamed-Arshad, S.B.; Nordin, S.; Adzis, A.A.; Ahmad, A.H. Does ESG certification add firm value? Financ. Res. Lett. 2021, 39, 101593. [Google Scholar] [CrossRef]
- Xiang, G.; Wu, Y. Enterprise’s sustainable innovation in China: Practice and theoretical research. Chin. Manag. Stud. 2012, 6, 92–107. [Google Scholar] [CrossRef]
- Roper, S.; Hewitt-Dundas, N. Innovation persistence: Survey and case-study evidence. Res. Policy 2008, 37, 149–162. [Google Scholar] [CrossRef]
- Jelinek, M.; Schoonhoven, C.B. The Innovation Marathon: Lessons from High Technology Firms; Wiley-Blackwell: Hoboken, NJ, USA, 1990. [Google Scholar]
- Tavassoli, S.; Karlsson, C. Persistence of various types of innovation analyzed and explained. Res. Policy 2015, 44, 1887–1901. [Google Scholar] [CrossRef]
- Le Bas, C.; Scellato, G. Firm innovation persistence: A fresh look at the frameworks of analysis. Econ. Innov. New Technol. 2014, 23, 423–446. [Google Scholar] [CrossRef]
- Bai, X.; Han, J.; Ma, Y.; Zhang, W. ESG performance, institutional investors’ preference and financing constraints: Empirical evidence from China. Borsa Istanb. Rev. 2022, 22, S157–S168. [Google Scholar] [CrossRef]
- Eliwa, Y.; Aboud, A.; Saleh, A. ESG practices and the cost of debt: Evidence from EU countries. Crit. Perspect. Accoun. 2021, 79, 102097. [Google Scholar] [CrossRef]
- Raimo, N.; Caragnano, A.; Zito, M.; Vitolla, F.; Mariani, M. Extending the benefits of ESG disclosure: The effect on the cost of debt financing. Corp. Soc. Responsib. Environ. Manag. 2021, 28, 1412–1421. [Google Scholar] [CrossRef]
- Rajesh, R.; Rajendran, C. Relating environmental, social, and governance scores and sustainability performances of firms: An empirical analysis. Bus. Strateg. Environ. 2020, 29, 1247–1267. [Google Scholar] [CrossRef]
- Lin, Z. Does ESG performance indicate corporate economic sustainability? Evidence based on the sustainable growth rate. Borsa Istanb. Rev. 2024, 24, 485–493. [Google Scholar] [CrossRef]
- Yuan, X.; Li, Z.; Xu, J.; Shang, L. ESG disclosure and corporate financial irregularities–Evidence from Chinese listed firms. J. Clean. Prod. 2022, 332, 129992. [Google Scholar] [CrossRef]
- Zhao, S.; Chen, Y. ESG rating and labor income share: Firm-level evidence. Financ. Res. Lett. 2024, 63, 105361. [Google Scholar] [CrossRef]
- Long, H.; Feng, G.F.; Gong, Q.; Chang, C.P. ESG performance and green innovation: An investigation based on quantile regression. Bus. Strateg. Environ. 2023, 32, 5102–5118. [Google Scholar] [CrossRef]
- Lee, P.S.; Liu, Y.Y. The impact of environmental, social, and governance performance on the duration of earnings sustainability: A survival analysis. Appl. Econ. Lett. 2024, 1–8. [Google Scholar] [CrossRef]
- Song, K.; Xu, L.; Li, Z.; Wang, F. ESG investment and bank liquidity creation: The moderating effect of economic policy uncertainty. J. Financ. Res. 2022, 65, 61–79. [Google Scholar]
- Tsang, Y.P.; Fan, Y.; Feng, Z.; Li, Y. Examining supply chain vulnerability via an analysis of ESG-Prioritized firms amid the Russian-Ukrainian conflict. J. Clean. Prod. 2024, 434, 139754. [Google Scholar] [CrossRef]
- Ganter, A.; Hecker, A. Persistence of innovation: Discriminating between types of innovation and sources of state dependence. Res. Policy 2013, 42, 1431–1445. [Google Scholar] [CrossRef]
- Xiao, Z.; Lin, L. Financialization, life cycle and persistent innovation: An empirical research based on the industrial difference. J. Financ. Econ. 2019, 45, 43–57. [Google Scholar]
- He, Y.; Zhou, H.; Ding, J. Research on the impact of technological diversification on the persistence of innovation at firm-level. Stud. Sci. Sci. 2017, 35, 1896–1909. [Google Scholar]
- Pan, Z.; Li, Y.; Li, J. CEO’s power, chairman/CEO dyad characteristics and innovation sustainability. Bus. Manag. J. 2017, 39, 82–99. [Google Scholar]
- He, Y.; Zhang, S. A research on the effect of technological innovation persistence on firm’s performance. Sci. Res. Manag. 2017, 38, 1. [Google Scholar]
- Yao, S.; Duan, H. Persistent innovation and high-quality development of financially distressed enterprises. Sci. Res. Manag. 2023, 44, 44. [Google Scholar]
- Ye, Y.; Zhao, S. The Effect of Outward FDI on Capabilities of Sustained Innovation: Evidence from China. Sustainability 2023, 15, 4196. [Google Scholar] [CrossRef]
- Fang, X.; Hu, D. Corporate ESG performance and innovation-evidence from A-share listed companies. Econ. Res. J. 2023, 2, 91–106. [Google Scholar]
- Li, Y.; Li, S. ESG performance and innovation quality. Int. Rev. Econ. Financ. 2024, 92, 1361–1373. [Google Scholar] [CrossRef]
- Braganza, A.; Awazu, Y.; Desouza, K.C. Sustaining Innovation is Challenge for Incumbents. Res. Manag. 2009, 52, 46–56. [Google Scholar] [CrossRef]
- Li, Z.; Feng, L. Corporate ESG Performance and Commercial Credit Acquisition. J. Financ. Econ. 2022, 48, 151–165. [Google Scholar]
- Lo, K.Y.; Kwan, C.L. The effect of environmental, social, governance and sustainability initiatives on stock value—Examining market response to initiatives undertaken by listed companies. Corp. Soc. Responsib. Environ. Manag. 2017, 24, 606–619. [Google Scholar] [CrossRef]
- Rui, Z.; Lu, Y. Stakeholder pressure, corporate environmental ethics and green innovation. Asian J. Technol. Innov. 2021, 29, 70–86. [Google Scholar] [CrossRef]
- Tan, Y.; Zhu, Z. The effect of ESG rating events on corporate green innovation in China: The mediating role of financial constraints and managers’ environmental awareness. Technol. Soc. 2022, 68, 101906. [Google Scholar] [CrossRef]
- Peng, H.; Tan, H.; Zhang, Y. Human capital, financial constraints, and innovation investment persistence. Asian J. Technol. Innov. 2020, 28, 453–475. [Google Scholar] [CrossRef]
- Dhaliwal, D.S.; Li, O.Z.; Tsang, A.; Yang, Y.G. Voluntary nonfinancial disclosure and the cost of equity capital: The initiation of corporate social responsibility reporting. Account. Rev. 2011, 86, 59–100. [Google Scholar] [CrossRef]
- Xu, J.; Xiao, H. The impact of government subsidies on the persistence of firm innovation: Evidence from China. Appl. Econ. 2023, 1–16. [Google Scholar] [CrossRef]
- El Ghoul, S.; Gong, Z.J.; Guedhami, O.; Hou, F.; Tong, W.H. Social trust and firm innovation. J. Int. Financ. Mark. Institutions Money 2023, 84, 101745. [Google Scholar] [CrossRef]
- Li, S.; Li, J.; Zhang, Y. Social Trust. Commercial credit financing and enterprise innovation. J. Nankai Econ. Res. 2020, 3, 81–102. [Google Scholar]
- He, F.; Du, H.; Yu, B. Corporate ESG performance and manager misconduct: Evidence from China. Int. Rev. Financ. Anal. 2022, 82, 102201. [Google Scholar] [CrossRef]
- Bu, J.; Cuervo-Cazurra, A. Informality costs: Informal entrepreneurship and innovation in emerging economies. Strateg. Entrep. J. 2020, 14, 329–368. [Google Scholar] [CrossRef]
- Cheng, Y.-J.; Lang, X.; Wang, X.-N. Empirical Study of Influencing Factors of Continuous Improvements. In Proceedings of the Management Science and Engineering, 2006. ICMSE ’06, Lille, France, 5–7 October 2006. [Google Scholar]
- Manso, G. Motivating innovation. J. Financ. 2011, 66, 1823–1860. [Google Scholar] [CrossRef]
- Bosma, N.; Van Praag, M.; Thurik, R.; De Wit, G. The value of human and social capital investments for the business performance of startups. Small Bus. Econ. 2004, 23, 227–236. [Google Scholar] [CrossRef]
- Gu, F.F.; Hung, K.; Tse, D.K. When does guanxi matter? Issues of capitalization and its dark sides. J. Mark. 2008, 72, 12–28. [Google Scholar] [CrossRef]
- Gulati, R.; Nohria, N.; Zaheer, A. Strategic networks. Strateg. Manag. J. 2000, 21, 203–215. [Google Scholar] [CrossRef]
- Zahid, R.A.; Saleem, A.; Maqsood, U.S.; Sági, J. Moderating role of audit quality in ESG performance and capital financing dynamics: Insights in China. Environ. Dev. Sustain. 2024, 26, 12031–12060. [Google Scholar] [CrossRef]
- Zhang, D.; Lucey, B.M. Sustainable behaviors and firm performance: The role of financial constraints’ alleviation. Econ. Anal. Policy 2022, 74, 220–233. [Google Scholar] [CrossRef]
- Iurkov, V.; Benito, G.R. Domestic alliance networks and regional strategies of MNEs: A structural embeddedness perspective. J. Int. Bus. Stud. 2018, 49, 1033–1059. [Google Scholar] [CrossRef]
- Zhao, T.; Xiao, M.; Zhang, B. Corporate social network, ownership structure, and corporate financing constraints: Evidence from China. Int. Rev. Econ. Financ. 2023, 88, 1547–1564. [Google Scholar] [CrossRef]
- Hasan, I.; Hoi, C.K.S.; Wu, Q.; Zhang, H. Is social capital associated with corporate innovation? Evidence from publicly listed firms in the US. J. Corp. Financ. 2020, 62, 101623. [Google Scholar] [CrossRef]
- Triguero, A.; Córcoles, D. Understanding innovation: An analysis of persistence for Spanish manufacturing firms. Res. Policy 2013, 42, 340–352. [Google Scholar] [CrossRef]
- Xie, H.; Lyu, X. Responsible multinational investment: ESG and Chinese OFDI. Econ. Res. J. 2022, 57, 83–99. [Google Scholar]
- Li, J.; Lian, G.; Xu, A. How do ESG affect the spillover of green innovation among peer firms? Mechanism discussion and performance study. J. Bus. Res. 2023, 158, 113648. [Google Scholar] [CrossRef]
- Breuer, W.; Müller, T.; Rosenbach, D.; Salzmann, A. Corporate social responsibility, investor protection, and cost of equity: A cross-country comparison. J. Bank Financ. 2018, 96, 34–55. [Google Scholar] [CrossRef]
- Hadlock, C.J.; Pierce, J.R. New evidence on measuring financial constraints: Moving beyond the KZ index. Rev. Financ. Stud. 2010, 23, 1909–1940. [Google Scholar] [CrossRef]
- Ang, J.S.; Cole, R.A.; Lin, J.W. Agency costs and ownership structure. J. Financ. 2000, 55, 81–106. [Google Scholar] [CrossRef]
- Wu, Y.; Liu, X. Human capital and R&D activity: Evidence from Chinese private enterprises. China Econ. Quart 2009, 4, 1567–1590. [Google Scholar]
- Huergo, E.; Jaumandreu, J. How does probability of innovation change with firm age? Small Bus. Econ. 2004, 22, 193–207. [Google Scholar] [CrossRef]
- Balasubramanian, N.; Lee, J. Firm age and innovation. Ind. Corp. Change 2008, 17, 1019–1047. [Google Scholar] [CrossRef]
- Dickinson, V. Cash flow patterns as a proxy for firm life cycle. Account. Rev. 2011, 86, 1969–1994. [Google Scholar] [CrossRef]
Disclaimer/Publisher’s Note: The statements, opinions and data contained in all publications are solely those of the individual author(s) and contributor(s) and not of MDPI and/or the editor(s). MDPI and/or the editor(s) disclaim responsibility for any injury to people or property resulting from any ideas, methods, instructions or products referred to in the content. |
© 2024 by the authors. Licensee MDPI, Basel, Switzerland. This article is an open access article distributed under the terms and conditions of the Creative Commons Attribution (CC BY) license (https://creativecommons.org/licenses/by/4.0/).