Article

Environmental Decentralization, Digital Financial Inclusion, and the Green Transformation of Industries in Resource-Based Cities in China

1
School of Economics and Management, Hefei University, Hefei 230601, China
2
Key Laboratory of Financial Big Data, Hefei University, Hefei 230601, China
3
Hefei Binhu Financial Town Management Co., Ltd., Master of Finance Joint Training Demonstration Base, Hefei University, Hefei 230601, China
*
Author to whom correspondence should be addressed.
Sustainability 2024, 16(17), 7564; https://doi.org/10.3390/su16177564 (registering DOI)
Submission received: 16 June 2024 / Revised: 6 August 2024 / Accepted: 29 August 2024 / Published: 1 September 2024

Abstract

:
In the digital era, digital financial inclusion plays a pivotal role in facilitating green industrial transformation and green development in resource-based cities. In this study, we conduct an in-depth analysis of environmental decentralization and digital financial inclusion and their mechanism of influence on the industrial green transformation of resource-based cities, utilizing panel data from resource-based cities in China between 2011 and 2022, in order to perform empirical tests using fixed effects and threshold models. The results indicate that environmental decentralization can advance the green transformation of industries, and that, under the influence of digital financial inclusion, environmental decentralization has a significant reverse impact on the green transformation of industries of resource-based cities in China. Furthermore, different levels of digital financial inclusion contribute to varying effects of environmental decentralization on the green transformation of industries. Additionally, the impact of environmental decentralization on the green transformation of industries differs among various types of resource-based cities in China. Therefore, we should continuously optimize the management system of environmental decentralization, improve the digital financial inclusion service system, fully leverage the advantages of digital financial inclusion, accurately grasp and scientifically utilize the driving principles of environmental decentralization, and implement measures in different cities according to the situation, in order to advance the green transformation of industries in resource-based cities in China.

1. Introduction

A resource-based city is a particular type of industrial city that thrives on indigenous natural resources. Initially, most resource-based cities experience rapid industrial economic development by leveraging their natural resource endowment for productivity. However, with the excessive and intensive exploitation of resources, some resource-based cities are facing issues such as the imminent depletion of resources, degradation of the ecological environment, economic structure imbalances, and the obstruction of industrial upgrading, falling into the economic predicament of the “resource curse”. Huainan City is one of China’s 1.3 billion-ton coal bases, with a mining area of 1571 square kilometers. The proven coal resource reserves exceed 15.3 billion tons, accounting for 19% of the national coal resource reserves. Since its establishment, Huainan City has produced more than 1.8 billion tons of raw coal and generated more than 800 billion kilowatt-hours of electricity. The contribution rate of the coal industry to economic growth has reached 53.2%. However, Huainan City has encountered a series of severe and complex problems in the process of developing a coal resource-based economy. Since coal seam mining will cause ground subsidence, which will seriously damage the local ecological balance, the production and processing of coal will easily cause many issues such as air pollution, water pollution, and industrial solid waste pollution. Thus, this has caused a serious impact on the ecological environment of Huainan City. Affected by the increasing downward pressure on the economy and the sharp decline in coal prices, the total industrial output value and corporate income of Huainan City’s coal resource-based industries have dropped significantly, and coal production has decreased, seriously affecting employment, investment, and household consumption. It negatively impacts the economic growth of Huainan City [1].
The “resource curse” of resource-based cities is reflected in the excessive consumption and dependence of the leading industries in resource-based cities on natural resources, which forms a resource-dependent industrial development model and leads to “path locking”. This leads to a heavy dependence on the industrial structure of resource-based cities and a low industrial added value. The development of resource-based industries suppresses the development of other industries, and the burden of transformation is heavy. Because resource-based industries have the characteristics of “high pollution, high energy consumption and high emissions”, the problems of environmental pollution, ecological damage, and resource waste in resource-based cities are more prominent. At the same time, the cost of environmental pollution control and ecological protection in resource-based cities is relatively high, and the ability for sustainable development is relatively weak. To solve the adverse effects of the “resource curse”, it is imperative to strengthen the environmental governance of resource-based cities and promote the green transformation of industries [2,3]. Due to the long-term and excessive exploitation of natural resources, the ecology of resource-based cities has also been seriously damaged. Problems such as surface subsidence, vegetation destruction, and serious pollution of soil and water bodies occur. Therefore, it is necessary to increase investment in ecological restoration funds. In the process of development, resource-based industries are also facing the dilemma of serious environmental pollution and high energy consumption. It is essential to increase investments in energy-saving and environmental protection transformation, to introduce green production facilities and technologies, and to realize the transformation of production mode from pollution-intensive to clean and technology-intensive [4,5]. However, resource-based cities face greater financing constraints in environmental protection and industrial green transformation. Strengthening financial support can solve this problem, especially through the development of digital financial inclusion. With its digital and inclusive advantages, it can improve the efficiency of green financing, broaden financing channels, reduce financing costs, and provide environmental protection for resource-based cities [6].
Environmental decentralization, as a specialized form of environmental governance, seeks to optimize the allocation of environmental management authority across various tiers of government [7]. Its characteristics are as follows: local governments have greater autonomy in environmental protection affairs, which facilitates local coordination of all forces and promotes the effective allocation of resources within their jurisdiction. Moreover, local governments have more cost advantages and information advantages than the central government in environmental governance issues. Additionally, local governments have a large number of environmental protection system staff, which can leverage the advantages of human capital, form a strict environmental supervision network, and improve the quality of environmental public services. This can enhance the effectiveness of environmental management and sustain environmental quality within regions, as well as incentivize the green transformation of industries in resource-based cities by stimulating the “innovation compensation effect” of enterprises. This approach facilitates a synergistic and mutually beneficial relationship between ecological conservation and economic development [8].
However, resource-based enterprises need a large amount of capital investment to promote green transformation in the short term, such as improving production facilities and technologies, introducing technical personnel, establishing green supply chains, etc. Currently, enterprises are facing greater financial pressure and need multi-party financing to raise funds. They may encounter multiple restrictions and obstacles in seeking financing, and they urgently need the support of financial services [9]. Digital financial inclusion is the result of the deep integration of a new generation of information technology and inclusive finance services. It has the characteristics of sharing, convenience, and low threshold. With its advantages such as liquidity, affordability, creditworthiness, and convenience, as well as the breadth of coverage and depth of utilization, it can break through the bottleneck of traditional financing, effectively broaden financing channels, reduce financing costs, improve financing efficiency, and meet diversified financing needs, effectively solving the problem of difficult and expensive financing for resource-based enterprises. In addition, digital inclusive financing also plays a unique role in improving the technological development and innovation capabilities of resource-based enterprises, improving industrial operation efficiency and management quality, enhancing corporate risk-taking capabilities, and optimizing the business environment [10,11,12]. Therefore, the development of digital financial inclusion is conducive to solving the financing constraints of resource-based enterprises and plays an important financial support role in the process of forcing the green transformation of resource-based industries in China through the implementation of environmental decentralization.
Resource-based cities account for about 42.7% of all types of cities, and they are predominantly concentrated in western and central China. Non-resource-based cities account for about 57.3% of all types of cities. Table A1 in the Appendix A sections show the list of resource-based cities in China. Resource-based industries are industries based on and reliant on resource development and utilization, including the coal industry, petroleum industry, copper industry, iron industry, etc. [13]. These are the research subjects of this study of industrial green transformation. Non-resource-based industries refer to industries that do not rely on the mining and processing of non-renewable energy and mineral resources, but they rely on technological leadership as factors for development. Specifically, the chemical industry, electronic information, new energy, biotechnology, modern producer services, and other industries [14]; these industries are not the research subjects of this study. China attaches great importance to green development, and has introduced and revised a string of environmental policies and regulations, including the Law of River Chief System, the Law of Forest Chief System, the Regulation of Enterprise Environmental Information Disclosure, and the Guideline on Green Finance for Banking and Insurance, and has implemented decentralized environmental management systems, including the River System, the Forest Chief System, and so on since 2011.
The River Chief System and Forest Chief System focus on key and difficult issues in ecological environment protection, resource development, and utilization, and establish a long-term responsibility system of territorial responsibility, departmental coordination, global coverage, and source governance. As of 2022, China has established nearly 1.3 million river chiefs at all levels and nearly 1.2 million forest chiefs at all levels. The number of people employed in urban units in China’s environmental and public facilities management industry has increased from 69,000 in 2011 to 286,000 in 2022, with an average annual growth rate of 13.7%. They are mainly distributed in environmental administrative departments, environmental monitoring sites, and environmental supervision agencies, forming a strict environmental supervision network. The implementation of the River Chief System and the Forest Chief System closely combines water control and forest control with green and low-carbon transformation. By strictly controlling pollution sources, eliminating backward and excess production capacity, and switching economic growth momentum, ecological efficiency is continuously improved, and synergy in pollution reduction and carbon reduction is promoted [15]. Environmental governance and economic green transformation have achieved significant results. According to official statistics, China emitted 22.18 million tons of SO2 in 2011, but the amount declined to 2.44 million tons in 2022. China’s industrial wastewater treatment capacity increased from 113.03 million cubic meters per day in 2011 to 216 million cubic meters per day in 2022, and the amount of comprehensively utilized industrial solid waste increased from 196.99 million tons in 2011 to 237.03 million tons in 2022. The quality of the ecological environment has improved significantly. By 2022, China’s digital economy increased to CNY 50,200 billion, accounting for around 41.5% of the GDP, the size of the fintech market exceeded CNY 542.3 billion, the balance of loans to inclusive enterprises reached CNY 23.8 trillion, the coverage rate of basic financial services exceeded 99.6%, and digital financial inclusion has flourished. From 2011 to 2023, the energy consumption per unit of value added in China’s industrial units of designated size decreased by around 16%, and the growth rate of green industry revenue remained above 13%. In 2023, the proportions of clean energy in total energy production and consumption increased by 11.1% and 11%, respectively, compared to those in 2011. Comprehensive advancements in industrial green transformation are underway.
This study utilizes the panel data of resource-based cities in China from 2011 to 2022 as a sample. We scientifically calculate indicators such as industrial green transformation, environmental decentralization, and digital financial inclusion in resource-based cities in China, deeply analyze the impact mechanism of the joint effects of environmental decentralization and digital financial inclusion on the industrial green transformation of resource-based cities, and conduct empirical tests on the data. This is completed while accounting for the differences in the degree of environmental decentralization and the different levels of development of digital financial inclusion. We use environmental decentralization and digital financial inclusion as threshold variables to explore the nonlinear impact of environmental decentralization and digital financial inclusion on the industrial green transformation of resource-based cities in China. Additionally, we also discuss the heterogeneity of the comprehensive effects of environmental decentralization and digital financial inclusion on the green transformation of industries of various resource-based cities in China [16]. Through our research, we found that environmental decentralization can advance the green transformation of industries in resource-based cities in China, and under the action of digital financial inclusion, environmental decentralization has a crucial reverse impact on the green transformation of industries in resource-based cities in China. This extends an innovative path for resolving the dilemma of industrial green transformation of resource-based cities in China, and supporting the “win-win” scenario of ecological preservation and high-quality economic development [17].

2. Literature Review and Comments

2.1. The Effect of Environmental Decentralization on the Green Transformation of Industries

Certain researchers argue that environmental decentralization does not facilitate the green transformation of industries [18]. For instance, Rexhäuser et al. [19] argued that such decentralization has amplified the production burden on corporations in the short term and reduced their investments in production technology innovation [20,21]. Subsequently, Li et al. [22] found that decentralization can initiate a detrimental cycle of “pollution for growth” among local authorities, which inhibits the green transformation of industries. Likewise, Van et al. [23] posited that ignoring the atmosphere for short-run economic growth will not only reduce urban environmental quality but also impede the green transformation of industries [16]. However, several researchers suggest that moderate decentralization of the environment is beneficial to promoting industrial green transformation. In addition, Turner et al. [24] emphasized that environmental decentralization has a positive impact on enterprise innovation, which helps improve product added value and market competitiveness. Moreover, Wang et al. [25] suggested that environmental decentralization increases market competition, leading to the optimization of production factor allocation and the promotion of industrial structure optimization and upgrading. Liu et al. [26] concluded that adopting moderate environmental decentralization not only controls ecological pollution but also optimizes resource utilization, which does not facilitate the promotion of the green transformation of industries [27]. In addition, other researchers have indicated that environmental decentralization has a nonlinear effect on industrial green transformation. Yang et al. [28] highlighted that environmental decentralization has an inverted U-shaped influence on both industrial structure upgrading and optimization. Furthermore, Akalin et al. [29] argued that enhancing environmental decentralization will have a threshold impact on urban industrial efficiency, and this threshold impact shows significant heterogeneity among cities of different sizes.

2.2. The Effect of Digital Financial Inclusion on the Green Transformation of Industries

Some scholars suggest that digital financial inclusion can not only alleviate the plight of conventional financial industries but also have a profound effect on the development and operation mode of other industrial sectors [30]. Lee et al. [31] highlighted that digital finance can facilitate loans, payments, and investments through digital technology, which can significantly mitigate financial exclusion. In addition, it can also overcome the limitations of space and time, and lower the threshold of financial services, thus promoting industrial green transformation. Mukalayi et al. [32] argued that digital financial inclusion has a noticeable “incentive effect” on technological innovation within enterprises and it can support the technological innovation of firms by alleviating financial mismatches [33,34]. Syed et al. [35] demonstrated that digital financial inclusion can indirectly enhance regional innovation performance by fostering industrial agglomeration, strengthening agglomeration economies of scale, and producing diverse knowledge spillover effects. However, some scholars believe that over-financialization will lead to a shift from the real economy to a virtual economy and create economic bubbles, hence obstructing industrial upgrading. Xuan et al. [36] showed that digital financial inclusion exerts a threshold influence and demonstrates an inverted U-shaped trend with industrial structure upgrading.

2.3. Measurement and Evaluation of the Green Transformation of Industries in Resource-Based Cities

The green transformation of resource-based cities, as distinct industrial cities, has attracted substantial attention. Li et al. [37] measured the changing characteristics of industrial green development in resource-based cities in China using the extended STIRPAT model and found that it has a greater impact on China’s central region, followed by the eastern and western regions. Guo et al. [38] calculated and analyzed the transformation efficiency of China’s resource-based cities by using the DID model. The results indicate that the environmental protection tax in the eastern region has a more noticeable impact on resource-based cities compared to the western and central regions. In contrast, the impact on resource-based cities is less in the regeneration phase than in other phases. Zhao et al. [39] utilized positional entropy and entropy weight models to calculate related indicators and construct a spatial synchronization equation model. Based on the GS3SLS technique, it was found that the transformation performance of renewable resource-based cities was the highest, while that of declining resource-based cities was the weakest. Tang et al. [40] conducted an empirical study on ecological resilience using the SDM model and entropy weight TOPSIS and noted that the ecological resilience of resource-based cities demonstrated a distinct upward trend, progressing step-by-step from east to west [41]. Parallel to this, a prominent positive association was revealed between the ecological resilience of resource-based cities and a club aggregation phenomenon characterized by high ecological resilience and low ecological resilience [40]. Meanwhile, Anser et al. [42] confirmed that urbanization level, industrial structure, technological innovation ability, and cleaner production level were all significant factors influencing the green transformation of industries in resource-based cities, while the influencing factors in different areas and different development phases have their distinctive characteristics [43].
The existing studies mainly focused on the connection between both environmental decentralization and digital financial inclusion on the green transformation of industries, and on measuring and evaluating the green transformation of industries in resource-based cities. However, there has been no research combining environmental decentralization, digital financial inclusion, and the green transformation of industries in resource-based cities that explores the role of digital financial inclusion as an innovative action mechanism. Based on panel data from resource-based cities in China from 2011 to 2020, in this study, we investigate the combined impacts of environmental decentralization and digital financial inclusion on the green transformation of industries and explore the influence of environmental decentralization on the green transformation of industries in resource-based cities in China under various levels of digital financial inclusion.

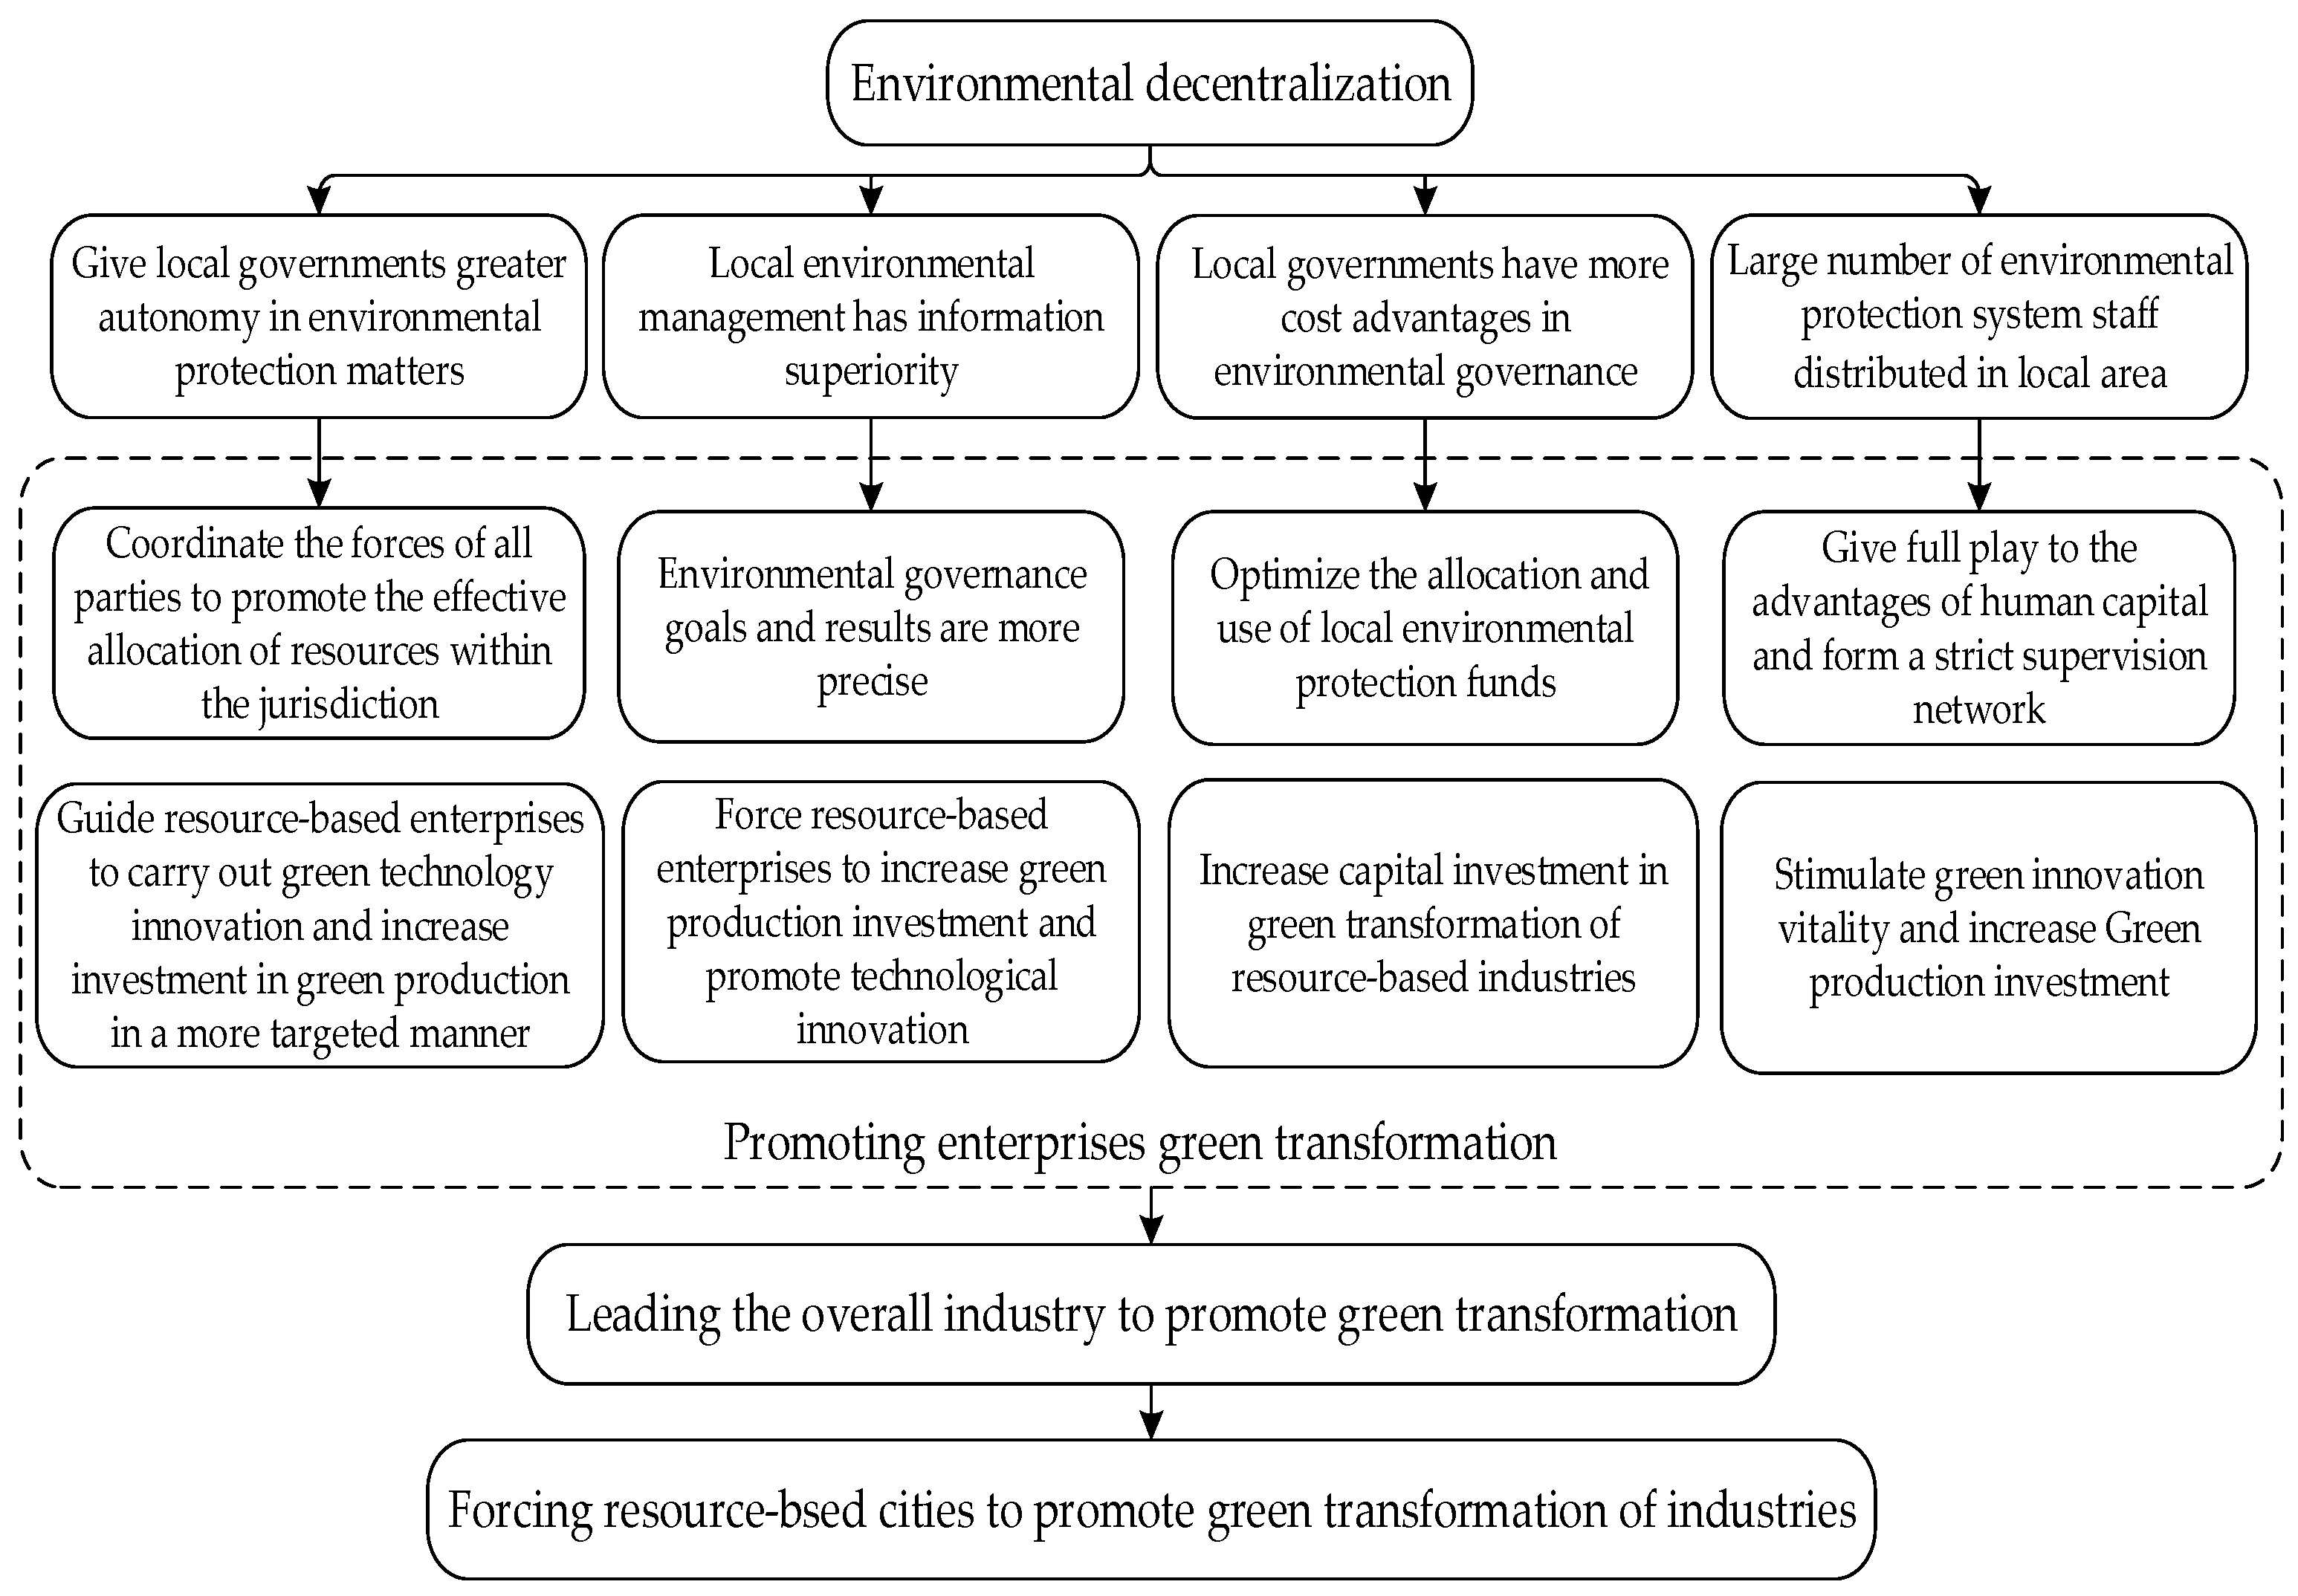
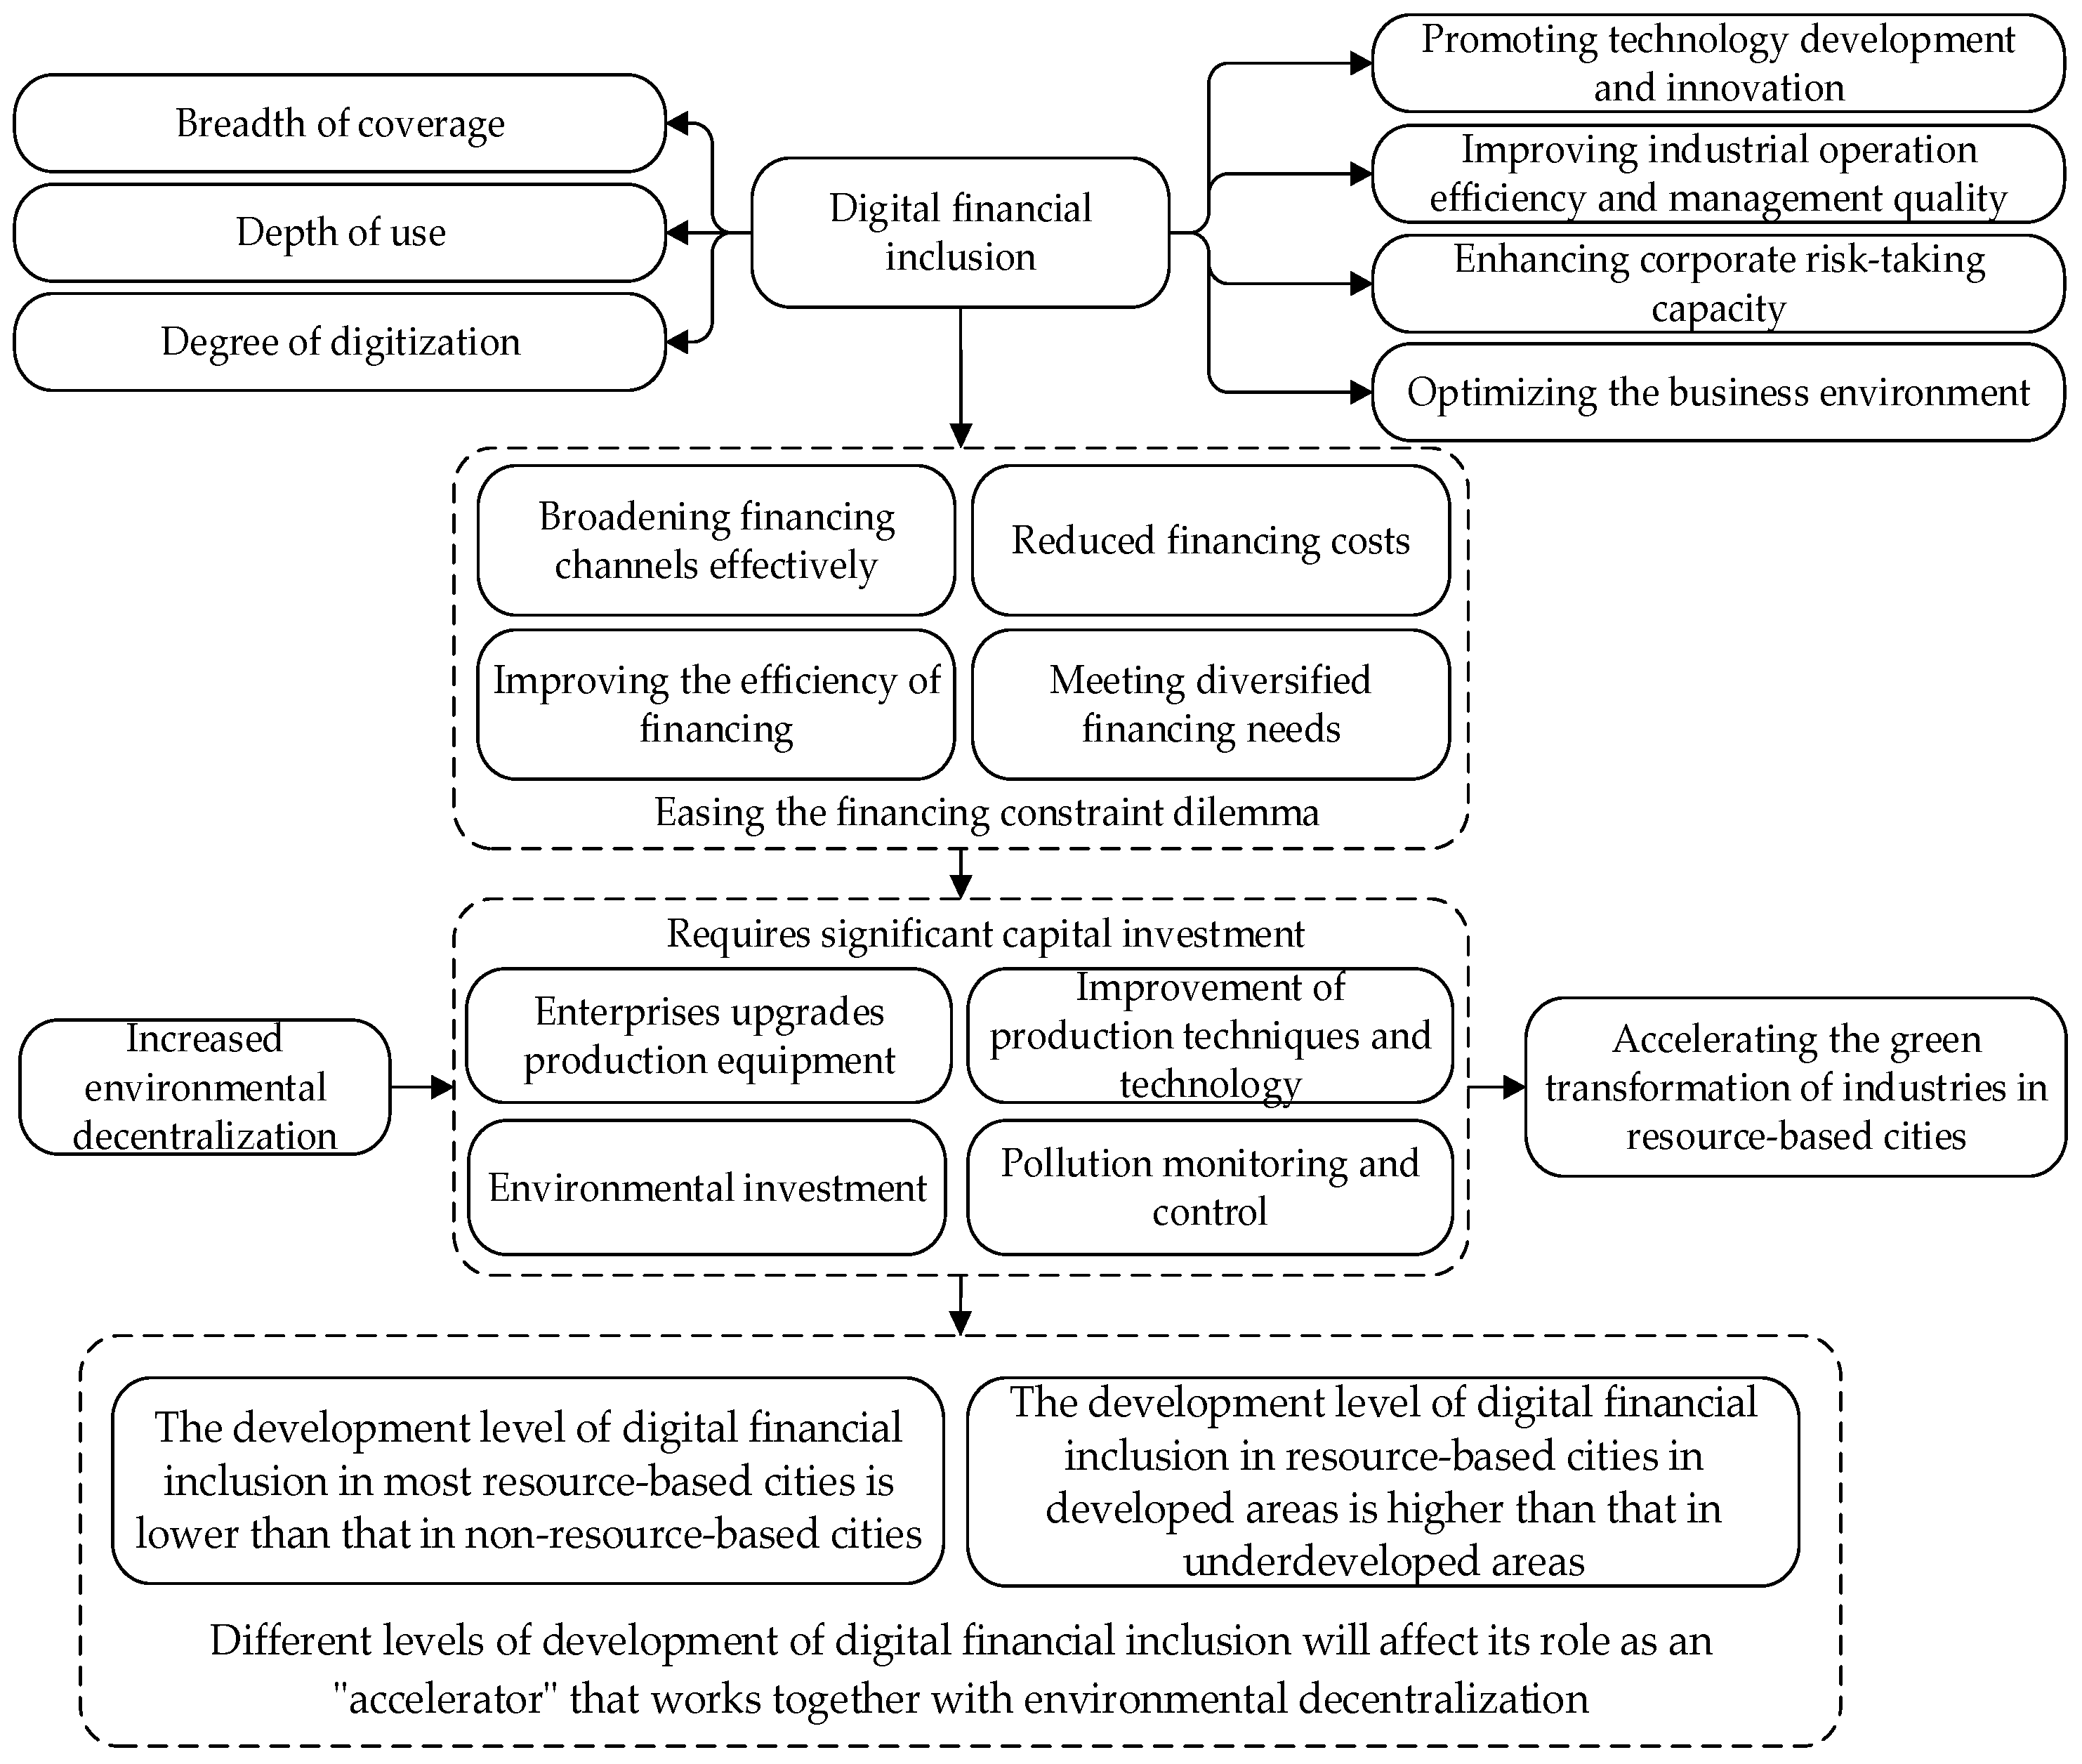
3. Analysis of Mechanisms of Influence and Proposed Research Hypothesis

Explicitly, environmental decentralization refers to how to assign the responsibilities and authorities of ecological protection between central and local governments. Environmental decentralization gives local governments greater autonomy in environmental protection matters [44]. This will not only help local governments coordinate the forces of all parties and promote the effective allocation of resources within their jurisdiction but also guide resource-based enterprises to carry out green technological innovation, increase investment in green production, and promote green transformation in a more targeted manner [45,46]. In comparison to central authorities, local governments are closer to local enterprises and residents and have a better understanding of the pollution situation and the environmental needs of enterprises within their jurisdictions [47,48]. They also have unique information advantages in local environmental governance. This allows them to rely on their accurate understanding of the behavior choice preferences of polluting enterprises within their jurisdiction and take advantage of the situation to implement environmental regulations. The goals and results of environmental governance will be more accurate. This also significantly reduces information asymmetry, enhances the effectiveness of environmental governance, and is conducive to forcing resource-based enterprises to increase investment in green production and promote technological innovation to achieve green transformation and upgrading [49,50].
Particularly, local governments have more cost advantages in environmental governance. The cost for local governments to collect data on environmental conditions and pollution discharge within their jurisdiction is lower, and the cost of information transmission between different levels of government, from the central government to the local government, is reduced in the process of environmental supervision and law enforcement. This will help local governments optimize the allocation and use of environmental protection funds and increase capital investment in the green transformation of resource-based industries. At the same time, environmental decentralization provides local governments with greater autonomy in environmental protection affairs. It is conducive to implementing environmental policy experiments and innovations, and it can guide resource-based enterprises to implement green technology innovation and promote green transformation in a more targeted manner [51]. Additionally, local governments have numerous personnel to work on the ecological protection system. These individuals are widely distributed in the fields of environmental supervision and environmental law enforcement, environmental quality testing and assessment, environmental infrastructure construction, environmental investment and financing, and environmental information services. They can give full play to the advantages of human capital, coordinate various forces, strengthen the supervision and governance of pollution sources and key polluting enterprises, form a strict environmental supervision network, improve the quality of environmental public services, stimulate the green innovation vitality of enterprises, improve production technology, increase green production investment, and promote green transformation.
From a theoretical point of view, environmental protection refers to the regulatory actions taken by the government to protect and improve the ecological environment and prevent pollution which is achieved through formulating and implementing various binding policies and measures against the behaviors of enterprises, organizations, and residents that pollute the environment and damage the ecology [52]. There are debates about the implementation of environmental decentralization between “cost compliance” and “innovation compensation” theory. The “cost compliance” represented by the neoclassical school is based on the micro-perspective of enterprise cost structure [53]. It is believed that the implementation of environmental decentralization increases the cost of pollution control for enterprises because enterprises need to invest more in environmental governance. Investment in environmental governance refers to the funds invested by enterprises to reduce environmental pollution and improve the utilization efficiency of energy resources, improve production facilities and technologies, introduce technicians, and transform from a polluting production mode to a clean and technology-intensive mode. Increased investment in environmental governance will raise the production cost of enterprises [54]. The increase in the production cost of enterprises will have a more obvious crowding-out effect on the production, operation, transformation, and upgrading of enterprises, causing enterprises to be at a disadvantage in market competition. In turn, it hinders the industrial green transformation of resource-based cities in China. On the contrary, the “innovation compensation” theory proposes that environmental decentralization requires enterprises to pay additional production costs and costs based on a dynamic perspective. However, it has forced enterprises to update and improve the potential of green production technology equipment and processes, and increased investment in green technology innovation. It has significantly improved the enterprise’s green production capacity and production efficiency, by obtaining stronger market competitiveness and profitability, and forming green innovation compensation income. Ultimately, it significantly reduces the cost of marginal pollution control and achieves green transformation. The green transformation of enterprises will drive the green transformation of the overall industry, thereby promoting the industrial green transformation of resource-based cities in China, as depicted in Figure 1. Accordingly, hypothesis H1 is postulated as follows:
Hypothesis 1. 
Environmental decentralization can compel resource-based cities to implement the green transformation of their industries.
Resource-based cities require a lot of financial support in the process of bolstering their industrial green transformation. For example, enterprises that involve significant pollution and energy consumption require substantial investments in updating production equipment, improving production technology, and improving pollution control [55]. Under the impact of environmental decentralization, the green transformation of industries in China’s resource-based cities has a stronger demand for capital; thus, it also faces greater financing pressure. Digital financial inclusion is the seamless integration of cutting-edge information technology with inclusive financial services. It includes the advantages of convenience, mobility, credit, and affordability, as well as breadth and depth of coverage, which can break through the bottleneck of traditional financing constraints. Furthermore, it can also effectively diversify funding sources, minimize financing expenses, enhance financing efficiency, fulfill different financing needs, and help alleviate the financing constraints of the green transformation of industries in resource-based cities in China. Simultaneously, digital financial inclusion also augments technological development and innovation, improves industrial operational efficiency and management quality, enhances corporate risk-taking capacity, and optimizes the business environment. Digital financial inclusion not only provides stable and continuous capital flow for technological development and innovation but it also introduces numerous high-quality production factors and innovation resources [56]. It can help enterprises improve their innovation ability and promote green transformation.
The innovation of digital financial inclusion business models and the optimization of service processes are enhancing the effectiveness of financial services, while profoundly changing the operation and production mode of companies [57]. This will help to enhance the operational efficiency and management quality of firms and related industries. Digital financial inclusion can effectively address ethical concerns by providing decision support through data in intelligent risk control, and significantly lessen the expense of obtaining and processing key decision-making information by management. It can mobilize enthusiasm for risk-taking in investment activities so that the risk-taking capacity of enterprises can be improved. Additionally, digital financial inclusion optimizes the market, government, humanistic, and legal environment of enterprises in the process of transforming through information technology connectivity and integration, thus effectively improving the business environment [58,59]. Therefore, during the process of decentralizing environmental governance toward the green transformation of industries in resource-based cities in China, digital financial inclusion can serve as a catalyst for accelerating this transformation [60,61]. However, due to factors such as location conditions, resource endowments, environmental conditions, and economic development levels, the development levels of digital financial inclusion vary across cities. For example, the level of digital financial inclusion in most resource-based cities lags behind that in non-resource-based cities. Additionally, digital financial inclusion is generally higher in resource-based cities located in developed areas compared to those in underdeveloped areas. Different levels of digital financial inclusion will influence its role as an “accelerator” that works in conjunction with environmental decentralization, thus affecting its role in promoting industrial green transformation. Therefore, cities with relatively low development levels of digital financial inclusion should increase the construction of digital financial infrastructure to compensate for the shortcomings of digital financial inclusion development. Cities with a relatively high level of digital financial inclusion development should further strengthen technological innovation, improve the service quality of digital financial inclusion, and give full play to the supporting role of digital financial inclusion in the green transformation of resource-based city industries, as exhibited in Figure 2. In line with this, H2 is proposed as follows:
Hypothesis 2. 
With digital financial inclusion, environmental decentralization exerts a greater impact on the green transformation of industries in resource-based cities in China.

4. Development of Econometric Model and Selection of Indicators

4.1. Construction of Econometric Model

The fixed effects model refers to eliminating the influence by introducing individual or time-fixed effects when there are unobserved variables in the data that affect the dependent variable. The two-way fixed effect model can simultaneously control individual fixed effects that do not change with time and time-fixed effects that do not change with individuals. It can more accurately estimate the influence of other explanatory variables on the dependent variable, thus reducing the bias introduced by the omission of important variables. Therefore, to eliminate model estimation bias, we selected a two-way fixed effects model with both individual fixed effects and time-fixed effects to study the impact of environmental decentralization and digital financial inclusion on the green transformation of resource-based cities. The model is defined as follows:
G T I i t = α 0 + α 1 E D i t + α 2 X i t + σ t + λ i + ε i t
where G T I i t is the green transformation of industries index for resource-based cities; i represents different resource-based cities; t represents the year; E D i t is the degree of environmental decentralization; D F I i t is the digital financial inclusion index; X i t represents a group of control variables; α 0 is a constant term; α 1 , α 2 represents coefficient estimates for environmental decentralization and control variable, respectively; σ t denotes a time fixed effect; λ i signifies an individual fixed effect; and ε i t is a random perturbation term that meets the independent and identical distribution and finite variance.
To further study the role of digital financial inclusion in the impact of environmental decentralization on the green transformation of industries in resource-based cities, the digital financial inclusion variable ( D F I i t ) is added to Formula (1), as follows:
G T I i t = β 0 + β 1 E D i t + β 2 D F I i t + β 3 X i t + σ t + λ i + ε i t
where β 0 is a constant term; β 1 , β 2 , β 3 represents coefficient estimates for environmental decentralization, digital financial inclusion, and control variables, respectively.
To further study the impacts of the combined effects of environmental decentralization and digital financial inclusion on the green transformation of industries in resource-based cities, the interaction term of environmental decentralization and digital financial inclusion ( E D i t × D F I i t ) is added to Formula (3), and the constructed econometric model is as follows:
G T I i t = θ 0 + θ 1 E D i t + θ 2 D F I i t + θ 3 E D i t × D F I i t + θ 4 X i t + σ t + λ i + ε i t
where θ 0 is a constant term; θ 1 , θ 2 , θ 3 , θ 4 represent coefficient estimates for environmental decentralization degrees, digital financial inclusion, interactive items for environmental decentralization degrees and digital financial inclusion, and control variables, respectively.

4.2. Selection of Indicators

4.2.1. Dependent Variables

Green transformation of industries (GTI): the Super-SBM model was utilized to estimate the green transformation of industries index for resource-based cities. This assessment incorporated the input of factors in industrial production, as well as indicators for expected and unexpected output. Among them, the factor input indicators principally comprised capital input, labor input, and energy resource input. The estimation of capital input uses R&D expenditure and fixed capital stock, and the perpetual inventory method was used to estimate the fixed capital stock. The estimation expression is as follows:
K t = I t + K t 1 ( 1 δ )
where K t indicates the fixed capital stock of resource-based cities in year t; I t is the whole society’s total investment in fixed assets of resource-based cities in year t; and δ represents the depreciation rate. In this study, the capital stock data were adjusted to use 2011 as the reference period and the depreciation rate was recorded as 9.96%.
In addition, the number of employees in the mining industry and the number of R&D personnel in resource-based cities were selected as labor input indicators, and the total tons of standard coal in resource-based cities as a share of GDP was selected as an energy resource input indicator.
Since the output index is divided into expected and unexpected output indexes, we selected the main business sales income and the number of patents authorized as the expected output indexes. Industrial SO2, industrial wastewater, and industrial soot were chosen as the unexpected output indicators. The evaluation index system of green transformation of industries is shown in Table 1.

4.2.2. Independent Variables

Environmental decentralization (ED): referring to Zhang et al. [62], the distribution of employed individuals in urban units in the environment and public facilities management industry in each city was adopted to estimate the extent of environmental decentralization. The reason for adopting this measurement is that the number of personnel in environmental protection agencies at each level can better reflect the distribution of power for environmental affairs. The staffing of environmental protection departments is relatively stable, and the division of environmental powers can be reflected in the adjustment of the number of personnel in environmental protection agencies. Judging from the internationally accepted decentralization measurement indicators, both personnel distribution and expenditure distribution can be measured. To a large extent, environmental decentralization belongs to management decentralization, and the distribution of personnel is more aligned with the essential connotation of environmental decentralization. In addition, the measurement method of environmental decentralization used in this article is essentially a location quotient. This method can assess the relative concentration of environmental protection agency personnel in each city and the configuration structure of environmental management authority through cluster identification. The higher the degree of environmental decentralization, the greater the autonomous management power of local governments in environmental affairs. Therefore, it is both applicable and feasible to use the distribution of employed individuals in urban units within the environment and public facilities management industry in each city to describe the degree of environmental decentralization. Ran et al. [63] introduced the economic deflation factor [ 1 ( G D P i t / G D P ) t ] to eliminate the endogenous problems between environmental decentralization and economic development which can be expressed as follows:
E D i t = L E i t / L P i t G E t / G P t [ 1 ( G D P i t / G D P t ) ]
where E D i t indicates the environmental decentralization index of each resource-based city; L E i t indicates the number of urban units utilized in the environment and public facilities management industry in year t in city i; L P i t represents the total population at the end of year t in city i; G E t indicates the number of employees in the environment and public facilities management industry in year t; and G P t indicates the overall population at the end of year t [18]. G D P i t indicates the gross domestic product in year t in city i and G D P t indicates the gross domestic product of all resource-based cities in year t. [ 1 ( G D P i t / G D P t ) ] is the economic deflation factor. Location quotient may be affected to some extent by the size of the regional economy. For example, in cities with higher degrees of economic development in cities, there tend to be more people employed in environmental and public facilities management industries. Therefore, the economic deflation factor is used to deflate the environmental decentralization index to eliminate the endogenous problems between environmental decentralization and economic development.
Digital financial inclusion (DFI): we calculated the digital financial inclusion index based on the system constructed by the Digital Finance Research Center at Peking University [64]. The construction of the digital financial inclusion indicator system follows the following principles: first of all, it considers both the breadth and depth of digital financial inclusion services. Furthermore, it takes into account the comparability of time and regional dimensions. Additionally, it reflects the multi-level nature and diversification of digital financial inclusion services, which makes the construction of a digital financial inclusion indicator system more comprehensive, scientific, and reasonable. The three dimensions of the digital financial inclusion indicator system include depth of use, breadth of coverage, and degree of digitization, with a total of 33 specific indicators. Among them, the depth of usage reflects the actual usage and activity of digital financial inclusion, the breadth of coverage reflects the coverage of users’ access to digital financial inclusion services, and the degree of digitization reflects the convenience, low cost, and credibility that digital financial inclusion provides users. To a certain extent, it can reflect the connotation and characteristics of the development of digital financial inclusion and it is conducive to accurately describing the development level of digital financial inclusion. To eliminate the influence of extreme values and maintain the stability of the index, and to include the features of the rapid expansion of digital finance, we adopted a logarithmic efficacy function approach to make the index dimensionless. The weighting of each index was determined using the analytic hierarchy process. Finally, the weighted arithmetic average synthesis model was used for exponential synthesis. The index calculation method is both scientific and robust and has strong explanatory power, which can objectively reflect the development level of digital financial inclusion. The relevant mathematical expression is as follows:
d = i = 1 n w i d i
where d is a composite index of digital financial inclusion in various resource-based cities; w i is the standardized weight of each evaluation index; d i represents the evaluation score for individual indexes; and n indicates the number of evaluation indexes.

4.2.3. Control Variables

(1) Government (GOV): referring to Wang et al. [65], this is the proportion of local fiscal expenditure to regional GDP. (2) Economic agglomeration (EA): referring to Wang et al. [66], this is the proportion of GDP to land area for each resource-based city. (3) Urbanization rate (UR): referring to Borsatto et al. [67], this is the share of urban population among the total population. (4) Human capital (HC): referring to Wang et al. [68], this is the proportion of students in ordinary colleges and universities relative to the total population at the end of the year. (5) Marketization level (ML): referring to Wang et al. [69], this is the proportion of private and individual employees in urban areas among the total urban employees.

4.3. Data Resources

According to the list of resource-based cities defined in the Sustainable Development Plan of China’s Resource-based Cities issued by the State Council of China (https://www.gov.cn/zwgk/2013-12/03/content_2540070.htm (accessed on 25 February 2024)), there are 126 resource-based cities in prefecture-level administrative regions in China. We eliminated 14 resource-based cities with serious amounts of missing data and changes in statistical caliber and selected panel data of 112 resource-based cities from 2011 to 2022 from 126 prefecture-level administrative regions as research samples. The selected sample resource-based cities account for about 88.89% of all resource-based cities, with a sufficient sample size. The selected sample of resource-based cities are widely distributed in the eastern, central, western, and northeastern regions of China. The selected sample covers 23 provincial-level administrative divisions in China, including Hebei, Shandong, Fujian, Shanxi, Henan, Anhui, Inner Mongolia, Gansu, Sichuan, Heilongjiang, Jilin, Liaoning, and others. Among them, the sample of resource-based cities in the eastern region accounts for about 17.0%, the sample of resource-based cities in the central region accounts for about 33.0%, the sample of resource-based cities in the western region accounts for about 33.0%, and the sample of resource-based cities in the northeast region accounts for about 17.0%. In addition, the selected sample also includes resource-based cities at different stages of development, including growing, mature, declining, and regenerative resource-based cities. Among them, the sample of growing resource-based cities accounts for approximately 12.50%, the sample of mature resource-based cities accounts for approximately 53.57%, the sample of declining resource-based cities accounts for approximately 20.54%, and the sample of regenerative resource-based cities accounts for approximately 13.39%. From the perspective of the types of leading resource-based industries involved in the sample resource-based cities, it includes a series of resource-based industries such as coal industry, oil industry, natural gas industry, iron industry, copper industry, aluminum industry, tin industry, rare earths industry, wood industry and so on, covering the main leading resource-based industrial types of resource-based cities. Table A2 in the Appendix A section shows the distribution of sample resource-based cities in China. The relevant data were retrieved from the China Environmental Statistical Yearbook (https://data.cnki.net/yearBook/single?nav=%E7%BB%9F%E8%AE%A1%E5%B9%B4%E9%89%B4&id=N2024050561 (accessed on 15 March 2024)), China Industrial Statistical Yearbook (https://data.cnki.net/yearBook/single?nav=%E7%BB%9F%E8%AE%A1%E5%B9%B4%E9%89%B4&id=N2024050101 (accessed on 21 March 2024)), Wind Database (https://www.wind.com.cn/portal/zh/EDB/index.html (accessed on 6 May 2024)), China Urban Statistical Yearbook (https://data.cnki.net/yearBook/single?nav=%E7%BB%9F%E8%AE%A1%E5%B9%B4%E9%89%B4&id=N2024050590 (accessed on 3 April 2024)), Peking University Digital Financial Inclusion Index Report (https://www.idf.pku.edu.cn/yjcg/zsbg/index.htm (accessed on 12 April 2024)), and local statistical yearbooks. Partial and missing data were processed by interpolation. All variables were logarithmically transformed to eliminate dimensionality concerns and the interference of heteroskedasticity. Table 2 outlines the descriptive statistics of the study variables.

5. Regression Analysis

5.1. Baseline Regression Analysis

To examine the effect of environmental decentralization and digital financial inclusion on the green transformation of industries in resource-based cities in China, we first conducted a benchmark regression analysis. The derived outcomes are presented in Table 3.
A mixed OLS model and fixed effects model were selected by the F test, while the fixed effects model and random effects model were selected by the Hausman test. Given that the p-value from the F test and the Hausman test were statistically significant, the original hypothesis is rejected. Therefore, the fixed effect model was used for the regression analysis. Table 3 demonstrates a significant positive correlation between environmental decentralization and the green transformation of industries in resource-based cities in China, thereby confirming Hypothesis 1 [70]. The regression analysis also reveals that for every 1% increase in the interactive items between ED and DFI, there is a corresponding 0.039% increase in the reverse impact. This is because digital financial inclusion can efficiently reduce financing costs due to the extensive incorporation of digitization and inclusive finance services. This will improve financing efficiency, meet diversified financing needs, and help alleviate the financing constraints on the green transformation of industries in resource-based cities in China. Meanwhile, digital financial inclusion plays a significant role in facilitating technological advancement and innovation, improving industry operational efficiency and management quality, enhancing corporate risk-taking capacity, and optimizing the business environment. As a result, the convergence of digital financial inclusion and environmental decentralization expedites the process of green transformation for industries in resource-based cities in China; thus, H2 is also confirmed.
According to the regression analysis of control variables, the result of GOV was significantly negative. This indicates that excessive government intervention restricts the green transformation of industries in resource-based cities in China [71]. The outcome of EA was considerably positive since it has the advantages of information sharing, cost saving, resource allocation optimization, and market power expansion in the process of economic agglomeration. This is conducive to improving the green economic efficiency of resource-based cities and creating conditions for further promoting the green transformation of the urban economy, thereby realizing a win-win situation of ecology and economy. The regression result of UR was notably favorable since urbanization promotes regional industrial restructuring and the most efficient allocation of resources, thus contributing to the greening of the economy. The regression result of HC was positive, indicating that improving human capital quality can effectively promote improved talent flexibility and talent industry integration, thus contributing to the promotion of industrial green transformation and the realization of common prosperity. The regression result of ML was significantly positive. This is because a high marketization degree can improve financing efficiency and broaden financing channels. The green transformation of industries in resource-based cities requires substantial financial support, and a high degree of marketization can meet diverse financing needs.

5.2. Robustness Test

The instrumental variable method, replacement of explained variables, and systematic GMM method were used to ascertain the robustness of sample data. The derived outcomes are provided in Table 4.

5.2.1. Instrumental Variable Approach

To solve the problems of omitted variables and reverse causality, we selected the one-period lag variable of the interaction term between environmental decentralization and digital financial inclusion as the instrumental variable to test the endogeneity of the model, and we conducted 2SLS regression on environmental decentralization and digital financial inclusion. Specifically, the related outcomes of the instrumental variable indicate that the F-statistic is above the critical value of 10. This implies that there is no issue of weak instrumental variables. Additionally, the outcomes of variable endogeneity are essentially aligned with the regression outcomes.

5.2.2. Replacement of the Dependent Variable

In this study, we refer to the industrial structure upgrading index proposed by Wang et al. [72], which uses the ratio of the output value of the tertiary industry to the secondary industry, and uses it as another proxy variable for industrial green transformation. There was no noticeable change between the regression outcomes and the benchmark regression outcomes after replacing the explained variables.

5.2.3. Endogeneity Test Using SYS-GMM Model

Taking into account the potential heteroskedasticity of the random disturbance term, we utilized the lagged factor of environmental decentralization as an instrumental variable. System-GMM was employed for testing purposes. Based on the estimation results using SYS-GMM, the regression results showed AR (1) values below 0.1 and AR (2) values exceeding 0.1. Additionally, the Sargan value surpassed 0.1, indicating the effectiveness of the instrumental variable selection, with no issue of over-recognition. Meanwhile, the regression findings obtained through the SYS-GMM test generally aligned with those from the fixed effect estimation for all variables [18].

6. Further Study

6.1. Analysis of the Threshold Effect

The impact of environmental decentralization and digital financial inclusion on the green transformation of China’s resource-based cities may differ due to different degrees of decentralization and levels of inclusion. That is, there may be a nonlinear relationship between variables. This study uses the panel threshold regression model proposed by Hansen to examine whether there is a nonlinear relationship between environmental decentralization and digital financial inclusion in the industrial green transformation of China’s resource-based cities [73]. As a nonlinear econometric model, the essence of “threshold regression” is to find out all specific threshold values that may exist by estimating sample data on the premise of setting threshold variables. According to these threshold values, it divides the sample intervals and analyzes whether the parameters of the sample groups in different intervals are significantly different [74]. In this study, environmental decentralization and digital financial inclusion are used as threshold variables respectively, and the threshold effect model constructed is as follows:
G T I i t = μ 0 + μ 1 E D i t 1 ( E D i t γ ) + μ 2 E D i t 1 ( E D i t > γ ) + μ 3 X i t + ε i t
G T I i t = φ 0 + φ 1 E D i t 1 ( D F I i t η ) + φ 2 E D i t 1 ( D F I i t > η ) + φ 3 X i t + ε i t
where G T I i t is the green transformation of industries index for resource-based cities; i represents different resource-based cities; t represents the year; E D i t is the degree of environmental decentralization; D F I i t is the digital financial inclusion index; X i t represents a group of control variables; μ 0 and φ 0 are constant terms; μ 1 , μ 2 , μ 3 , φ 1 , φ 2 , φ 3 are the corresponding regression coefficients of the variables, respectively; γ and η are the threshold estimates; 1 ( ) represent characteristic function; When the expression in parentheses is false, the value is 0, otherwise the value is 1; ε i t is a random perturbation term that meets the independent and identical distribution and finite variance.

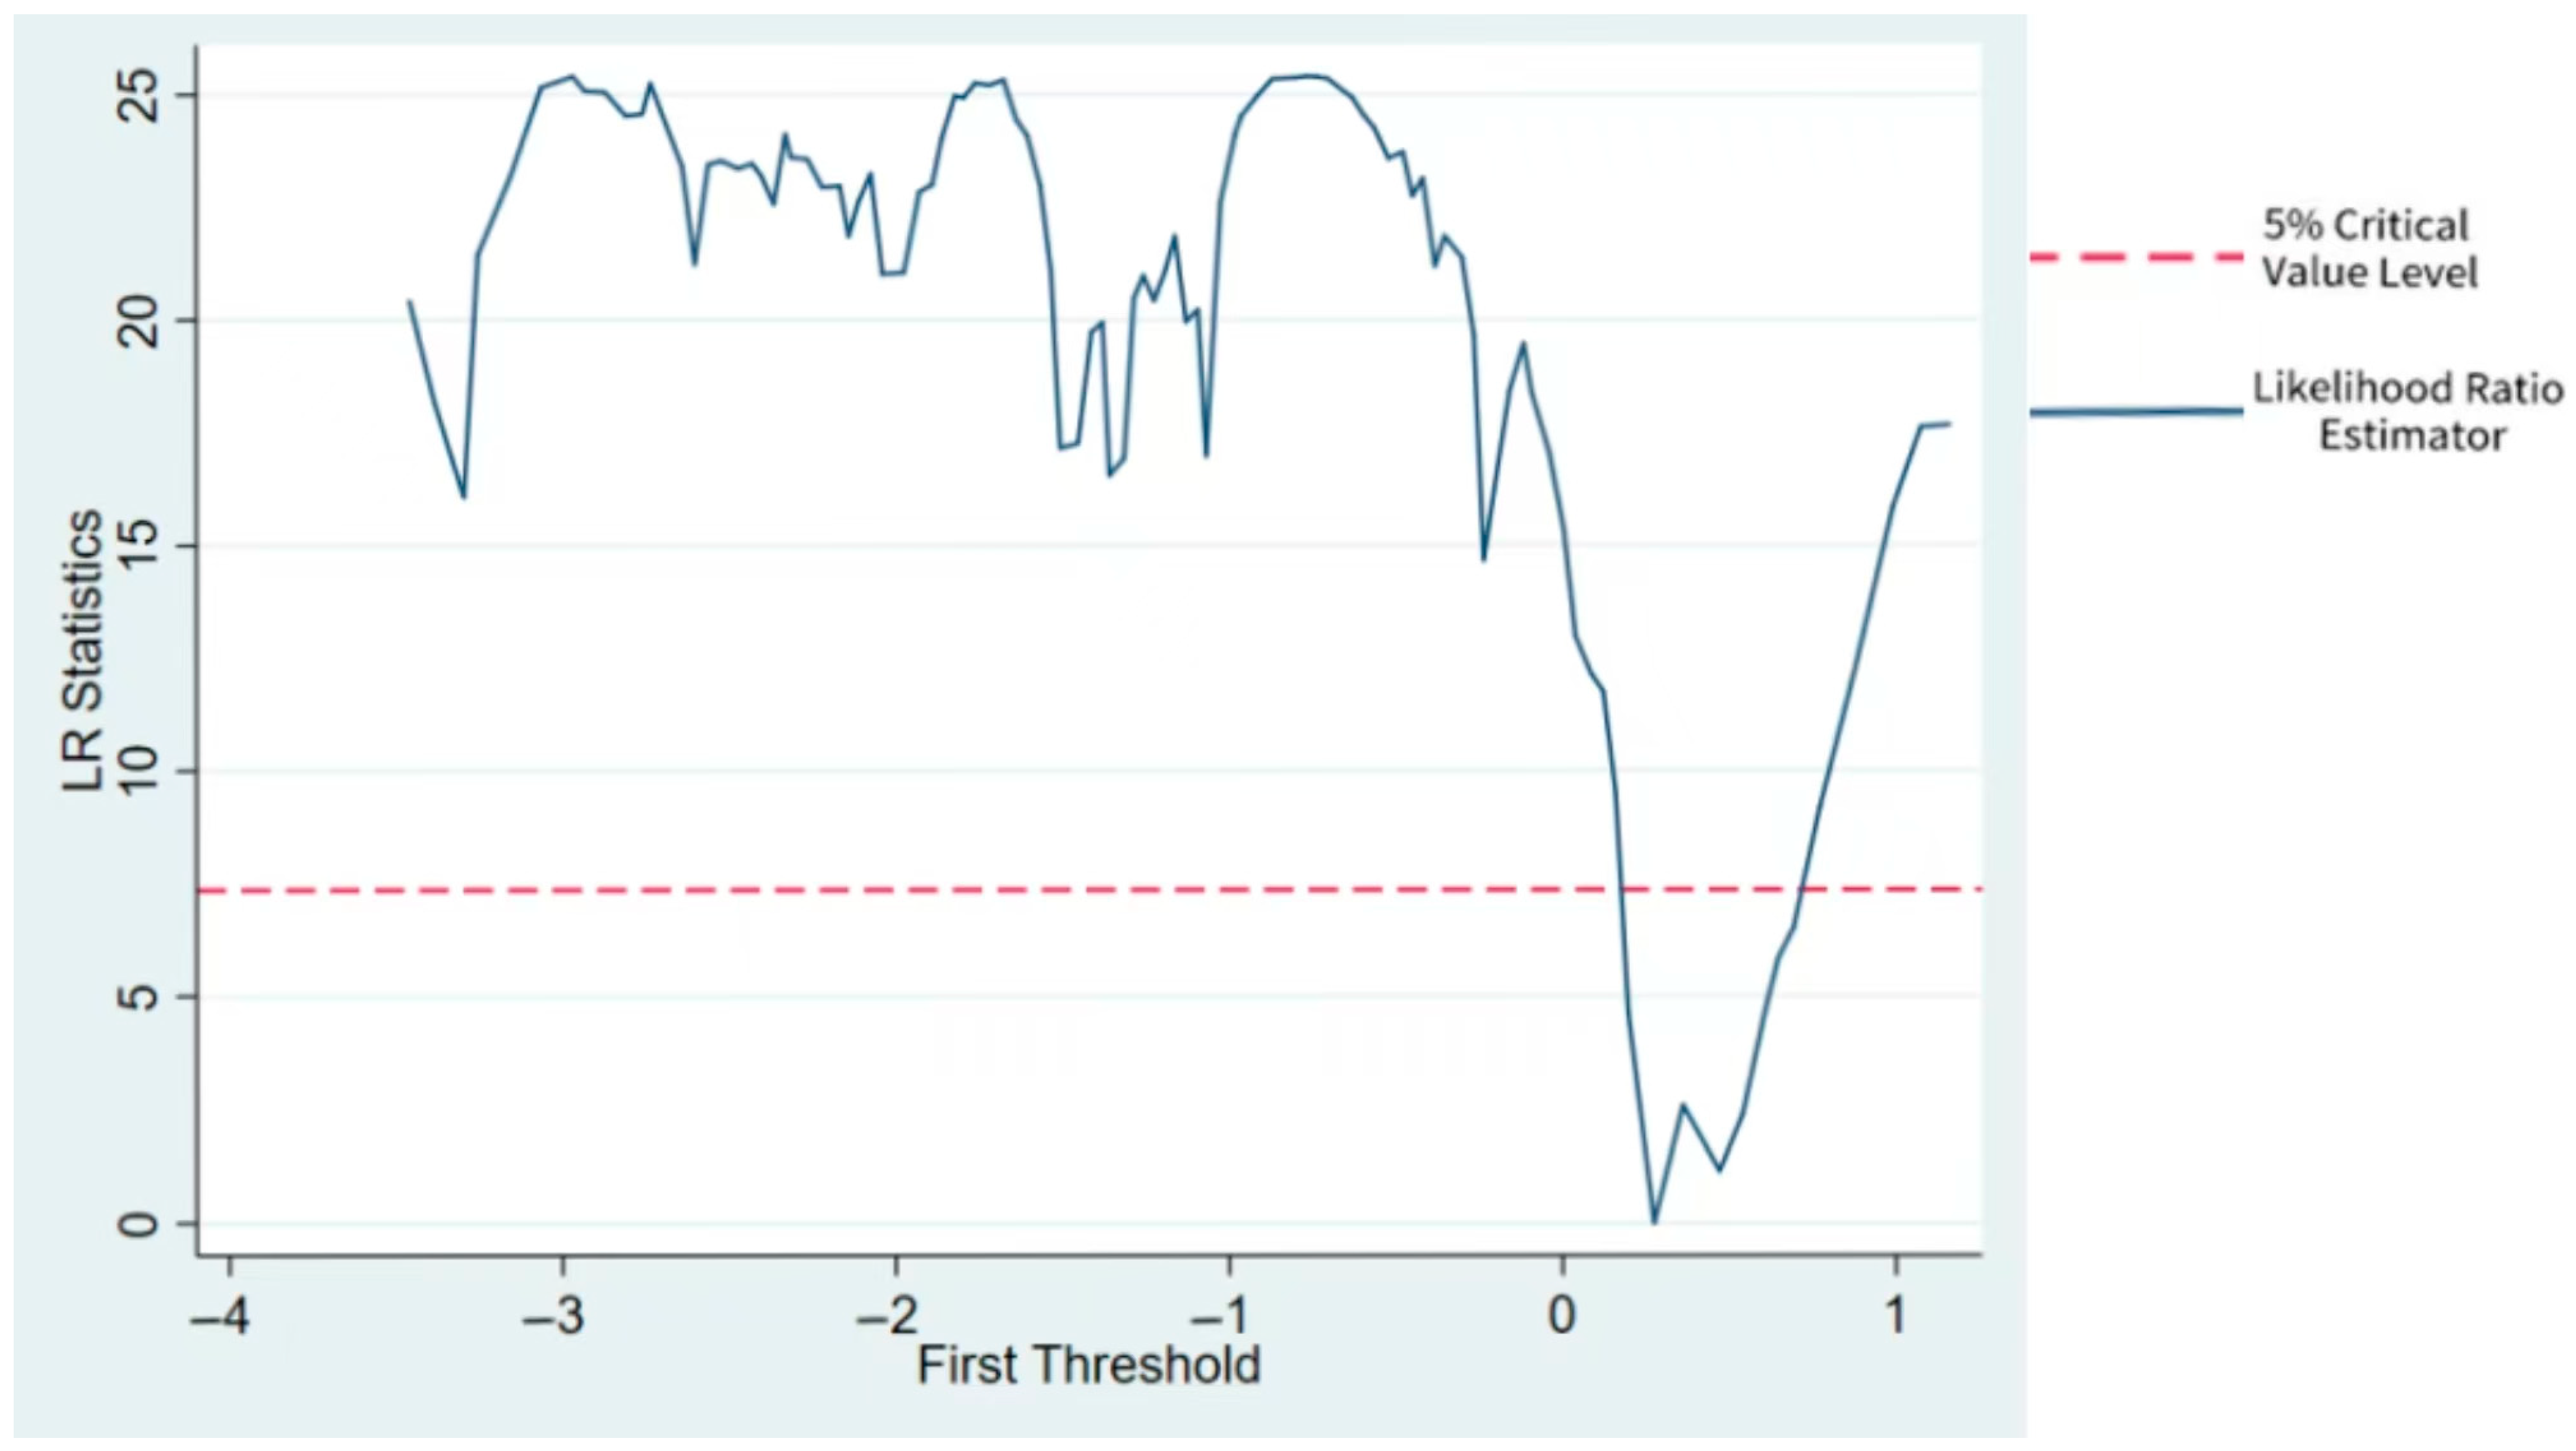
6.1.1. Analysis of the Effect of Environmental Decentralization as a Threshold Variable

According to the principle of Hansen’s threshold effect test, we used environmental decentralization as the threshold variable to test whether there was a threshold effect in the impact of digital financial inclusion on the green transformation of China’s resource-based cities. The results are shown in Table 5.
Table 5 indicates that the F-value for a single threshold is 25.490, which is significant at the 10% level. This indicates that when environmental decentralization is used as the threshold variable, there is a threshold value for digital financial inclusion to promote the green transformation of China’s resource-based cities, indicating a single threshold effect.
The threshold value for these cities was determined by employing the maximum likelihood ratio estimation method. To improve the clarity of the estimation results, a graphical representation of the maximum likelihood ratio function showing the outcomes of estimating threshold variable value η is provided in Figure 3.
As seen in the panel threshold regression results in Table 6, with different degrees of environmental decentralization, the development level of digital financial inclusion has different impacts on the green transformation of resource-based cities. When ED is less than or equal to 0.274, the regression value of GTI is 0.354 (p < 0.10). When ED exceeds 0.274, the regression coefficient of GTI is 0.743 (p < 0.01). This finding indicates that when the degree of environmental decentralization is improved, the role of digital financial inclusion in promoting the green transformation of industries in resource-based cities is more significant.

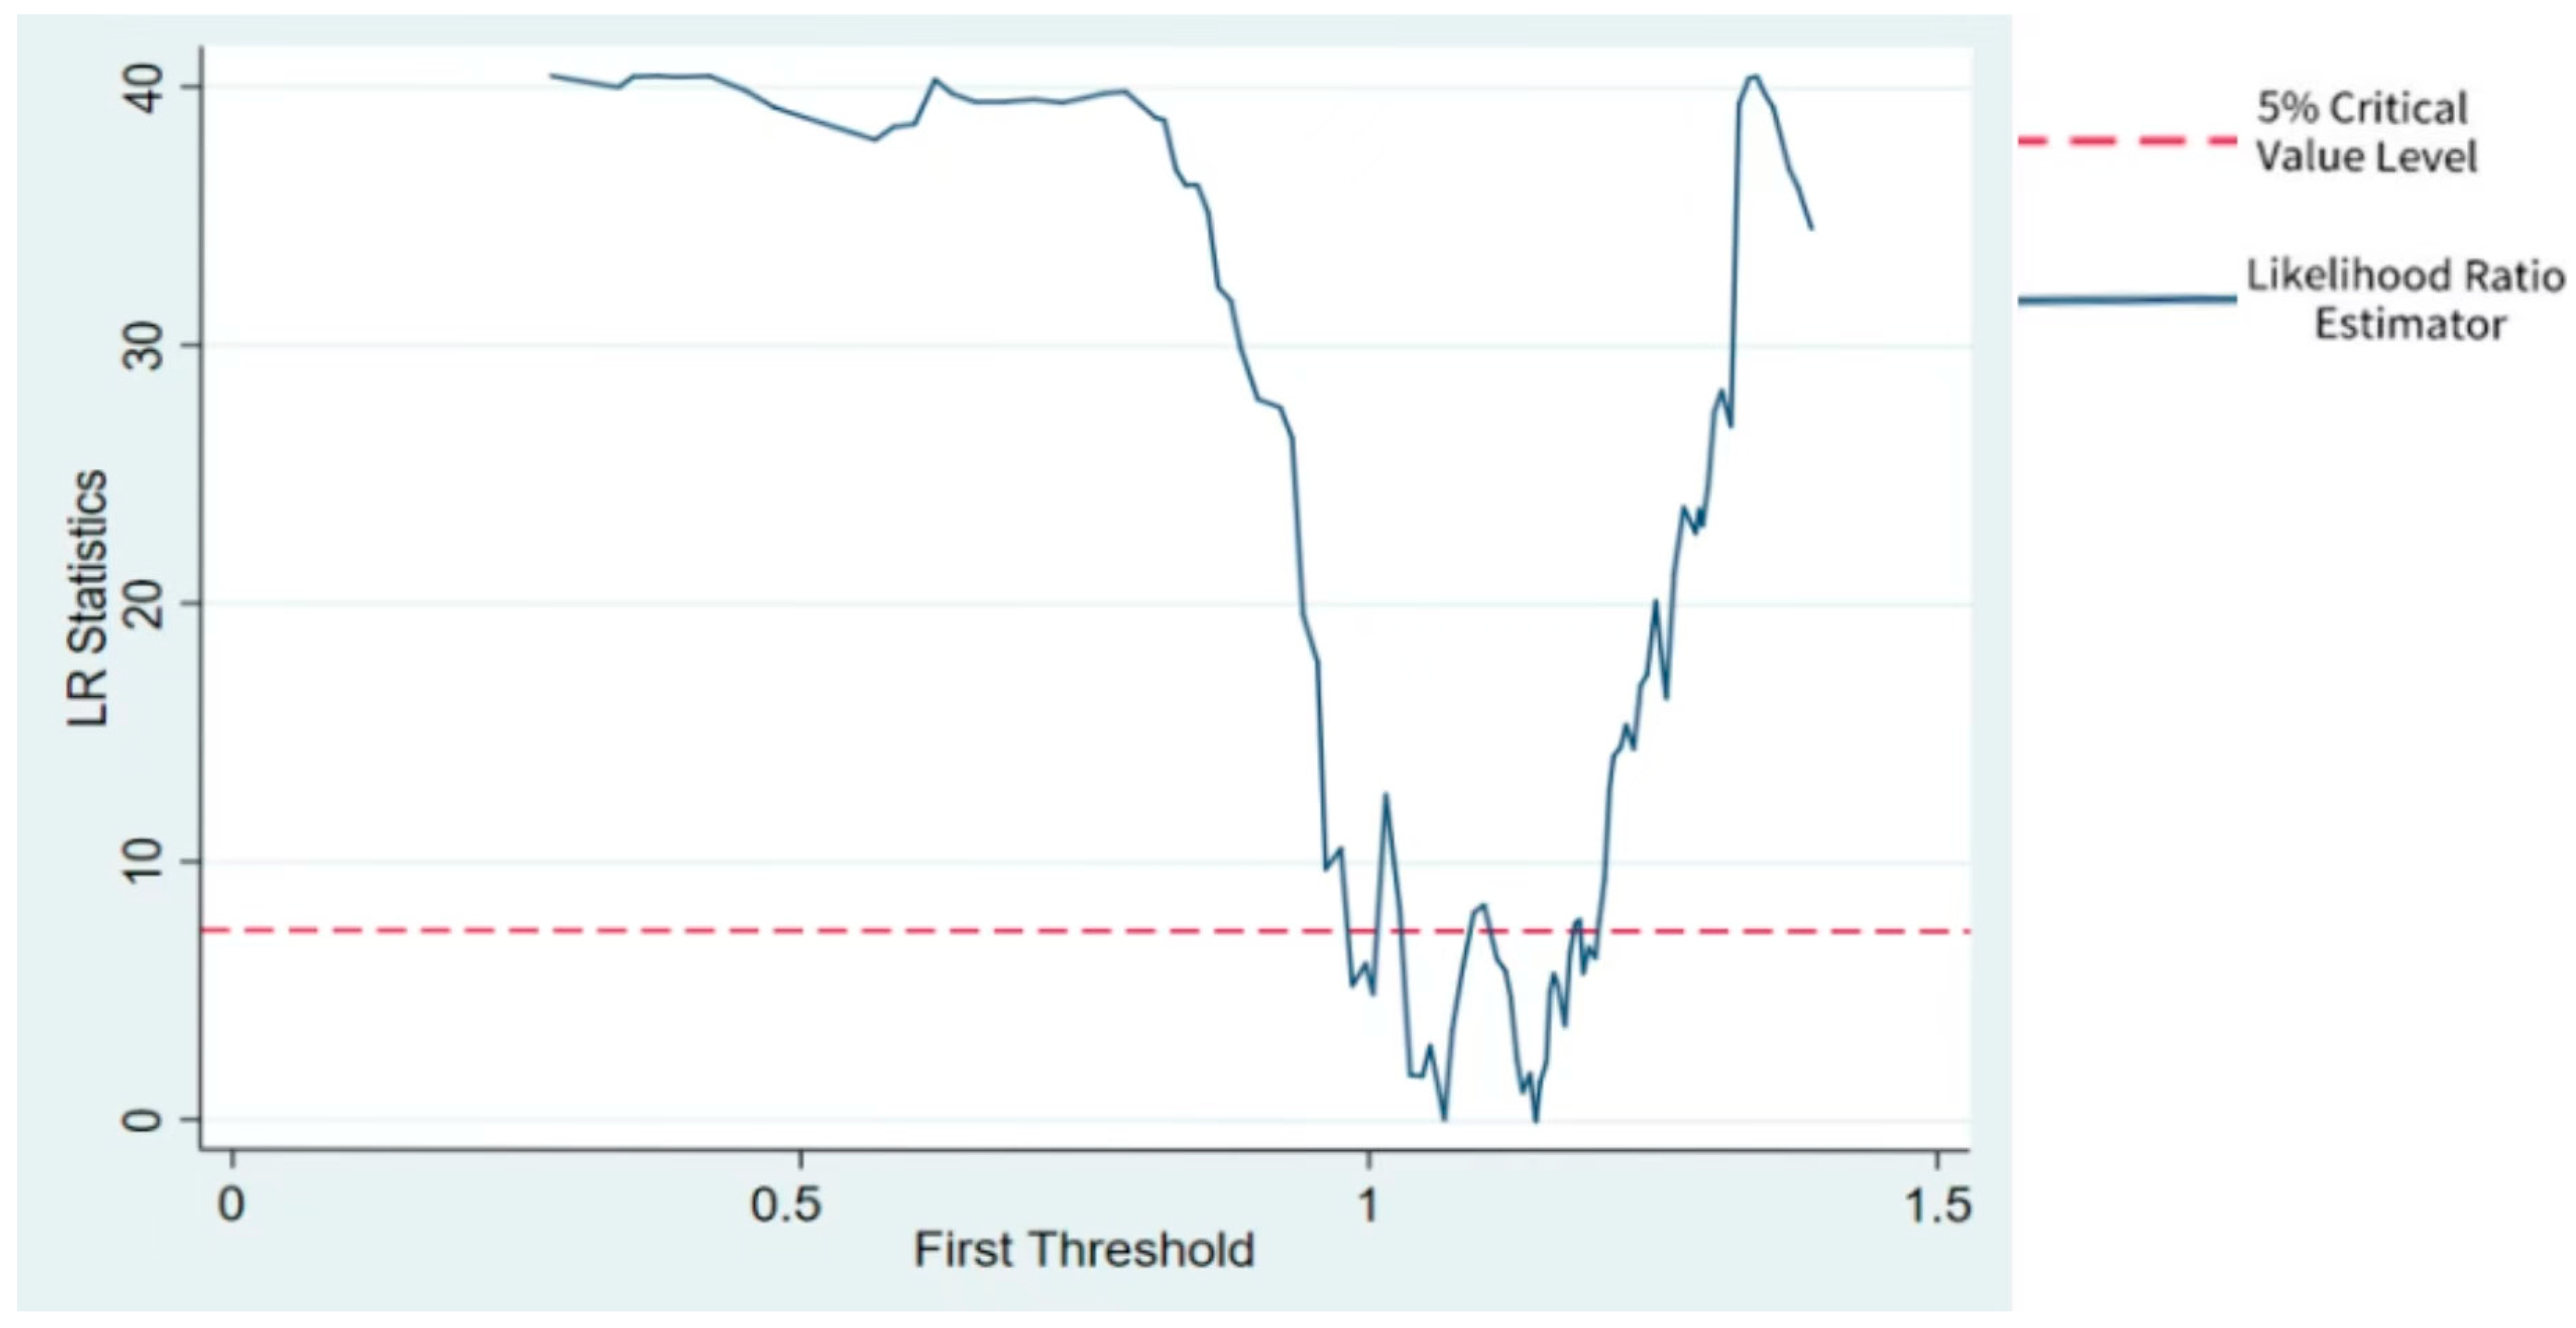
6.1.2. Analysis of the Effect of Digital Financial Inclusion as a Threshold Variable

According to the principle of Hansen’s threshold effect test, digital financial inclusion was used as a threshold variable to test whether there is a threshold effect in the pressure of environmental decentralization on the green transformation of China’s resource-based cities. The results are shown in Table 7.
Table 7 indicates that the F-value for a single threshold is 21.610, which is significant at the 10% level. This shows that when digital financial inclusion is the threshold variable, there is a threshold value for environmental decentralization to force the green transformation of China’s resource-based cities, indicating a single threshold effect.
The threshold value for these cities was determined by employing the maximum likelihood ratio estimation method. To improve the clarity of the estimation results, a graphical representation of the maximum likelihood ratio function depicting the outcomes of estimating threshold variable value η is illustrated in Figure 4.
As seen in the panel threshold regression results in Table 8, environmental decentralization has different impacts on the green transformation of industries in resource-based cities in China under different levels of digital financial inclusion. When DFI is less than or equal to 1.147, the regression value of GTI is 0.317 (p < 0.01). When DFI exceeds 1.147, the regression value of GTI is 0.145 (p < 0.05). This finding indicates that improving the development level of digital financial inclusion significantly strengthens the role of environmental decentralization in driving the green transformation of China’s resource-based cities.

6.2. Heterogeneity Analysis of Different Types of Resource-Based Cities

The Sustainable Development Plan of China’s Resource-based Cities issued by the General Office of the State Council of China divides China’s resource-based cities into growing, mature, declining, and regenerative resource-based cities based on the differences in resource security and sustainable development capabilities. Among them, the resource development of growing resource-based cities is on the rise, and the resource advantages are relatively significant. However, the industrial foundation of these cities is relatively weak, with production and processing technology and methods being relatively low-level and outdated. The resource development of mature resource-based cities is in a stable stage. After a long period of development, a relatively stable industrial system has been formed. The degree of intensive development and utilization of resources is high, and the cost of marginal pollution control is significantly reduced. Declining resource-based cities are facing greater pressure of resource depletion, a serious decline in industrial development, and great pressure on the ecological environment. However, the continuous alternative industry has not yet found its optimal position. Renewable resource-based cities have largely eliminated resource dependence, and the adjustment of industrial structure has achieved results. However, because it is in the transitional stage of developing emerging industries and reducing over-dependence on resources, the development of alternative industries is still immature. Different types of resource-based cities face their own development challenges, and the implementation status of environmental decentralization and the development level of digital financial inclusion vary among them [75]. Therefore, it is necessary to further analyze the heterogeneity of the impact of the combined effects of environmental decentralization and digital financial inclusion on the industrial green transformation for different types of resource-based cities in China. This study conducts a regression analysis on four types of resource-based cities respectively. Table 9 displays the regression results.
Based on the regression findings in Table 9, the interaction coefficient of ED and DFI with GTI in growing resource-based cities is 0.258, which is significant at the level of 1%. The concurrent influence of environmental decentralization and digital financial inclusion on the development of resource-based cities can significantly drive the green transformation of industries. This is because growing resource-based cities have ample resource reserves and obvious resource advantages. However, these cities have a comparatively weak industrial base, and the advancement of digital financial inclusion remains limited. Consequently, the impact of environmental decentralization on the green transformation of industries is relatively minor. The regression coefficient of mature resource-based cities is 0.090, which is significant at the level of 1%. This indicates that the environmental decentralization of mature resource-based cities is more significant in promoting industrial green transformation in the presence of digital financial inclusion. This also suggests that mature resource-based cities have formed a relatively stable industrial system after a long period of development. They have a high degree of intensive utilization of resources and significantly reduced marginal pollution control costs. Additionally, the supportive advantages of digital financial inclusion and the allocation of financial resources are significantly improved. Therefore, the green transformation of industries is efficiently enhanced.
From the regression results of declining and regenerating cities, the regression coefficients of ED and DFI on GTI are low and significantly negative. The regression factor of declining resource-based cities is low and significantly negative. This indicates that the combined impact of environmental decentralization and digital financial inclusion hinders the green transformation of industries in these cities. Declining resource-based cities are facing great pressure due to resource depletion, leading to serious declines in industrial development. Consequently, the progress of digital financial inclusion has also been affected, leading to obstacles in achieving the green transformation of industries in the context of environmental decentralization. The regression coefficient of regenerative resource-based cities is 0.093, which is significant at the 10% level. It can be noted that the collective influence of environmental decentralization and digital financial inclusion in regenerative resource-based cities significantly contributes to industrial green transformation. This is because these cities have completed their economic transformation and achieved remarkable results in industrial restructuring. However, their emerging industries are in the transitional stage of initial development and reducing excessive reliance on resources, and the support of environmental decentralization and digital financial inclusion is very limited. Therefore, it has great prospects for industrial green transformation.

7. Research Findings and Countermeasures

Existing research mainly explores the relationship between environmental decentralization and industrial green transformation from the micro level, or focuses on the relationship between digital financial inclusion and industrial green transformation without considering environmental decentralization. At the same time, there is also a lack of new research perspectives for solving the dilemma of industrial green transformation in resource-based cities. However, there is currently no research that combines environmental decentralization, digital financial inclusion, and the green transformation of resource-based urban industries to explore the mechanism and interactive effects between them. Compared to existing research, the academic contribution of this study is mainly reflected in using the mechanism of digital financial inclusion as a breakthrough to explore the impact of the combined effects of environmental decentralization and digital financial inclusion on the green transformation of resource-based city industries. Based on the panel data of resource-based cities in China from 2011 to 2022 an empirical test was developed. Accounting for the differences in the degree of environmental decentralization and the different development levels of digital financial inclusion, environmental decentralization, and digital financial inclusion are used as threshold variables, respectively. The purpose was to explore the nonlinear impact of environmental decentralization and digital financial inclusion on the industrial green transformation of resource-based cities in China. In addition, we further investigated the heterogeneity of comprehensive effects of environmental decentralization and digital financial inclusion on the green transformation of industries of various resource-based cities in China.
It was found that environmental decentralization can act as a catalyst for the green transformation of industries in China’s resource-based cities. The presence of digital financial inclusion enhances the impact of environmental decentralization, making it a stronger driver for such transformation. Additionally, the level of influence environmental decentralization exerts on the green transformation varies depending on the degree of digital financial inclusion across different resource-based cities in China. As digital financial inclusion progresses, its synergistic effect with environmental decentralization will significantly bolster the push toward greener industrial practices in these cities. Moreover, the interaction between environmental decentralization and digital financial inclusion has different levels of influence across various types of resource-based cities. The combined effect of environmental decentralization and digital financial inclusion has the most significant reverse effect on growing resource-based cities, and it can also positively affect mature and regenerative resource-based cities, while negatively affecting declining resource-based cities. Based on the above research findings, we developed a series of targeted and innovative policy recommendations. For example, we suggest scientifically optimizing the environmental decentralized management system according to local conditions, leveraging the advantages of digital financial inclusion as a “booster”, taking advantage of the situation, implementing targeted policies by city, and actively promoting the industrial green transformation of China’s resource-based cities. These policy suggestions are significantly different from existing policies, reflecting the comprehensive, integrated, and dynamic characteristics of policy design. This will help address the current main problems and contradictory priorities by maximizing the role of policy synergy, providing policymakers with scientific decision-making reference, and formulating more reasonable and effective environmental, financial, and industrial policies. This also provides an innovative path for resolving the dilemma of industrial green transformation in resource-based cities in China, and supporting the “win-win” scenario of ecological preservation and high-quality economic development.
Specific policy recommendations are as follows:
To begin, it is crucial to enhance the decentralized environmental management system in line with local conditions. Taking into account the resource–environment–economy characteristics of resource-based cities in China, the allocation of authorities and responsibilities related to environmental conservation affairs between central and local governments should be systematically determined. The information, cost, and personnel advantages of local government environmental supervision should be fully utilized. We should also build a robust environmental supervision network to achieve synergy between the decentralization of administration, monitoring, and supervision in environmental governance. Additionally, by intensifying investment in environmental governance and forcing enterprises to embrace technological innovation, it will become possible to enhance the efficiency and effectiveness of comprehensive ecological and environmental governance and improve the green transformation of industries in resource-based cities in China. Meanwhile, environmental quality assessment standards should be tailored to local conditions, emphasizing the guiding role of coordinated ecological and economic development in the green transformation of industries in resource-based cities. Environmental, financial, industrial, and innovation incentive policies can be comprehensively applied to encourage enterprises to change their production structure. This would enhance the standards for cleaner production and the effectiveness of resource recycling, thereby improving the green transformation and optimizing the allocation of resources, to fully stimulate the capacity of environmental decentralization and drive the green transformation of industries in resource-based cities in China. In addition, due to the threshold effect of environmental decentralization, the degree of environmental decentralization should be determined scientifically and reasonably. It place it within the optimal degree range of decentralization and achieve the optimal effect of environmental decentralization in driving the green transformation of resource-based cities.
Secondly, we should continuously enhance the service quality of digital financial inclusion and streamline the distribution of green financial resources in resource-based cities. This process should fully leverage digital means to strengthen innovation in digital inclusive financial technology. In addition, we should further improve the infrastructure of digital financial inclusion and enhance product innovation in terms of payment, credit, insurance, investment, and other business areas, to create an accurate, personalized, intelligent, and integrated financial service platform to optimize business models and service processes. We should promote information integration, provide online product and service convenience, improve service efficiency, enhance the customer experience of digital financial inclusion, and efficiently expand the financing area to reduce costs and increase efficiency for market players. We should also make comprehensive use of risk control models and intelligent algorithms, strengthen risk monitoring, improve risk sharing and compensation mechanisms, and effectively prevent and resolve financing risks. Moreover, we should actively guide financial resources toward green industries and green projects by strengthening cooperation among banks, financial technology companies, local governments, and regulatory authorities. This not only would maximize the three-dimensional linkage of finance, science and technology, and industrial development, streamlining the distribution of green financial resources, but also create efficient and orderly financial market competition, thus providing strong financial support for the green transformation of industries in resource-based cities in China. Compared with non-resource-based cities, the development level of digital financial inclusion in resource-based cities is weak. Therefore, it is necessary to address the shortcomings in the infrastructure construction of digital financial inclusion in resource-based cities, fully leverage the “booster” role of digital financial inclusion, and promote the green transformation of industries in resource-based cities.
Building upon an understanding of the principles of environmental decentralization, we should make use of the situation and implement targeted measures in different cities, so as to fully leverage the positive impact of environmental decentralization in driving the green transformation of industries of resource-based cities in China. Resource-based cities in China should closely integrate their own basic conditions, development reality, and functional orientation. They should not only strengthen collaborative innovation in environmental policies, financial policies, industrial policies, and innovation policies, but also deepen exchanges and cooperation among resource-based cities and optimize the allocation of factor resources across administrative regions. For growing resource-based cities, environmental quality assessment targets should be set scientifically, and support for industrial development should be strengthened to facilitate rapid growth. Meanwhile, investment in digital financial inclusion infrastructure should be increased, and technological innovation and product development should be strengthened. This would minimize the financing thresholds and costs for enterprises and highlight the staged growth targets of growing resource-based cities. For mature resource-based cities, the industrial structure and market system should be improved, and the added value and competitiveness of industries should be enhanced. We should strengthen the assessment of the harmonized advancement of ecology and economy, constantly improve the whole process for financing the service system of digital financial inclusion, and optimize the allocation of green financial resources. For declining resource-based cities, flexible and effective financial support policies should be formulated, and risk monitoring should be strengthened. This would prevent or defuse financial risks, enabling these cities to survive an economic recession crisis. In addition, continuous monitoring of resource and environmental pressures should be strengthened to avoid falling into a more severe recessionary trap. For regenerative resource-based cities, policy support for the expansion of emerging green industries and successive alternative industries should be increased to encourage rapid development and growth. We should also strengthen the assessment of economic transformation and coordinated development, utilize digital technology to facilitate the accurate matching of financial resources and emerging green industries, and accelerate the green transformation and sustainable development of industries in regenerative resource-based cities.
Additionally, promoting the industrial green transformation of resource-based cities in China requires the coordination and joint efforts of multi-dimensional policies of “environment-finance-industry-innovation-supervision” and the implementation of precise policy support. It is important to strengthen cross-departmental and cross-field collaboration between ecological environment departments, financial management departments, and industrial development departments. At the same time, establishing an environmental risk assessment system for resource-based cities, deepening the reform of environmental information disclosure system, and accelerating the construction of carbon emissions trading market can help promote healthy competition and collaborative governance of environmental decentralization across administrative regions. Moreover, it is necessary to properly handle the relationship between the interests of financial institutions, ecological environment interests, and social and economic interests. The use of digital financial inclusion not only effectively improves the accuracy of green financial investment and plays the role of an industry–finance cooperation platform, but also solves the financing needs of enterprises to execute technological innovation and implement the technological transformation of old devices. Therefore, it promotes a high-level virtuous circle of science and technology, industry, and finance, thereby guiding various factor resources to gather in green and low-carbon fields in an orderly manner. Simultaneously, we should also promote the deep integration of the innovation chain, industrial chain, capital chain, and talent chain. It is essential to continuously improve the level of transformation and industrialization of scientific and technological achievements, strengthen the promotion and application of advanced green and low-carbon technologies, accelerate the transformation of industrial models and corporate organizational forms, and improve the resilience and safety level of industrial chains and supply chains, to promote the green transformation of resource-based urban industries towards high-end and intelligent development. Lastly, a coordinated supervision mechanism should be built. It is crucial to strengthen target coordination, multi-pollutant control coordination, departmental coordination, regional coordination, and policy coordination. By continuously enhancing the systematic nature, integrity, and synergy of various policies, the effectiveness of these policies can be maximized, thereby jointly promoting the green transformation of resource-based cities in China.

8. Limitations and Directions for Future Research

The sample data in this article only includes the resource-based cities at the prefecture level in China, but not the resource-based cities at the county level. Considering the dual structure of urban-rural areas in China, county-level resource-based cities are included among all resource-based cities. It is important to further expand the sample range in future studies. Additionally, the research on the impact mechanism of environmental decentralization and digital financial inclusion on the industrial green transformation of resource-based cities in this study is not comprehensive. In particular, the impact mechanism of digital inclusive finance can be further analyzed. In future research, we would continue to explore other possible influence mechanisms and analyze the impact of the combined effects of environmental decentralization and digital inclusive finance on the industrial green transformation of resource-based cities in China from different perspectives. In addition, given the large-scale temporal and spatial nature of environmental issues and the accelerated flow of factor resources, this study has not yet empirically tested the spatial effects of the combined effects of environmental decentralization and digital financial inclusion on the industrial green transformation of resource-based cities in China. At the same time, the measurement method of the variable index can be further optimized, and additional heterogeneity analysis can be added to study the topic of this study more deeply.

Author Contributions

Conceptualization, F.Z.; Methodology, R.D. and H.C.; Software, R.D.; Investigation, H.C.; Data curation, R.D.; Writing—original draft, F.Z., R.D. and H.C.; Writing—review & editing, F.Z.; Supervision, F.Z.; Project administration, F.Z.; Funding acquisition, F.Z. All authors have read and agreed to the published version of the manuscript.

Funding

This research was funded by the Humanities and Social Sciences Youth Fund Project of the Ministry of Education of China (No.22YJC790179), Key Projects of Philosophy and Social Science Research for Universities in Anhui Province (No.2023AH052156), and Hefei University Talent Research Fund Project (No.20RC58).

Institutional Review Board Statement

Not applicable.

Informed Consent Statement

Not applicable.

Data Availability Statement

The data will be made available by request from the corresponding author.

Conflicts of Interest

The authors declare no conflicts of interest.

Appendix A

Table A1. List of resource-based cities and non-resource-based cities in China.
Resource-Based CitiesNon-Resource-Based Cities
Tangshan, Handan, Xingtai, Zhangjiakou, Chengde, Datong, Yangquan, Changzhi, Jincheng, Shuozhou, Jinzhong, Yuncheng, Xinzhou, Linfen, Lvliang, Baotou, Wuhai, Chifeng, Ordos, Hulunbeier, Fuxin, Fushun, Benxi, Anshan, Panjin, Huludao, Songyuan, Jilin, Liaoyuan, Tonghua, Baishan, Heihe, Daqing, Yichun, Hegang, Shuangyashan, Qitaihe, Jixi, Mudanjiang, Xuzhou, Suqian, Huzhou, Suzhou, Huaibei, Bozhou, Chizhou, Chuzhou, Huainan, Maanshan, Tongling, Xuanchengy, Sanming, Nanping, Longyan, Jingdezhen, Pingxiang, Xinyu, Ganzhou, Yichun, Dongying, Zibo, Linyi, Zaozhuang, Jining, Tai’an, Sanmenxia, Puyang, Luoyang, Pingdingshan, Hebi, Nanyang, Jiaozuo, Ezhou, Huangshi, Hengyang, Shaoyang, Loudi, Chenzhou, Shaoguan, Yunfu, Baise, Hechi, Hezhou, Guangyuan, Nanchong, Guang’an, Zigong, Luzhou, Panzhihua, Dazhou, Ya’an, Liupanshui, Anshun, Bijie, Qujing, Baoshan, Zhaotong, Lijiang, Pu’er, Lincang, Yan’an, Tongchuan, Yulin, Baoji, Weinan, Xianyang, Jinchang, Baiyin, Wuwei, Zhangye, Qingyang, Pingliang, Longnan, Shizuishan, and Karamay.Shijiazhuang, Qinhuangdao, Baoding, Cangzhou, Langfang, Hengshui, Taiyuan, Hohhot, Bayannur, Ulanqab, Tongliao, Shenyang, Dalian, Dandong, Jinzhou, Yingkou, Liaoyang, Tieling, Chaoyang, Changchun, Siping, Baicheng, Harbin, Qiqihar, Jiamusi, Suihua, Nanjing, Wuxi, Changzhou, Suzhou, Nantong, Lianyungang, Huaian, Yancheng, Yangzhou, Zhenjiang, Taizhou, Hangzhou, Ningbo, Wenzhou, Jiaxing, Shaoxing, Jinhua, Quzhou, Zhoushan, Taizhou, Lishui, Hefei, Wuhu, Bengbu, Anqing, Huangshan, Fuyang, Lu’an, Fuzhou, Xiamen, Putian, Quanzhou, Zhangzhou, Ningde, Nanchang, Jiujiang, Yingtan, Ji’an, Fuzhou, Shangrao, Jinan, Qingdao, Yantai, Weifang, Weihai, Rizhao, Dezhou, Liaocheng, Binzhou, Heze, Zhengzhou, Kaifeng, Anyang, Xinxiang, Xuchang, Luohe, Shangqiu, Xinyang, Zhoukou, Zhumadian, Wuhan, Shiyan, Yichang, Xiangyang, Jingmen, Xiaogan, Jingzhou, Huanggang, Xianning, Suizhou, Changsha, Zhuzhou, Xiangtan, Yueyang, Changde, Zhangjiajie, Yiyang, Yongzhou, Huaihua, Guangzhou, Shenzhen, Zhuhai, Shantou, Foshan, Jiangmen, Zhanjiang, Maoming, Zhaoqing, Huizhou, Meizhou, Shanwei, Heyuan, Yangjiang, Qingyuan, Dongguan, Zhongshan, Chaozhou, Jieyang, Nanning, Liuzhou City, Guilin City, Wuzhou City, Beihai City, Fangchenggang, Qinzhou, Guigang, Yulin, Laibin, Chongzuo, Haikou, Sanya, Sansha, Danzhou, Chengdu, Deyang, Mianyang, Suining, Neijiang, Leshan, Meishan, Yibin, Bazhong, Ziyang, Guiyang, Zunyi, Tongren, Kunming, Yuxi, Lhasa, Rikaze, Chamdo, Linzhi, Shannan, Nagchu, Xi’an, Hanzhong, Ankang, Shangluo, Lanzhou, Jiayuguan, Tianshui, Jiuquan, Dingxi, Xining, Haidong, Yinchuan, Wuzhong, Guyuan, Zhongwei, Urumqi, Turpan and Hami.
Table A2. Distribution of sample resource-based cities in China.
RegionNumber of SamplesSample ProportionResource-BasedCity TypesNumber of SamplesSample Proportion
Eastern1916.96%Growing resource-based cities1412.50%
Central3733.04%Mature resource-based cities6053.57%
Western3733.04%Declining resource-based cities2320.54%
Northeast1916.96%Regenerative resource-based cities1513.39%

References

  1. Wu, H.; Deng, K.; Dong, Z.; Meng, X.; Zhang, L.; Jiang, S.; Yang, L.; Xu, Y. Comprehensive assessment of land use carbon emissions of a coal resource-based city, China. J. Clean. Prod. 2022, 379, 134706. [Google Scholar] [CrossRef]
  2. Batterbury, S.P.J.; Fernando, J.L. Rescaling governance and the impacts of political and environmental decentralization: An introduction. World Dev. 2006, 34, 1851–1863. [Google Scholar] [CrossRef]
  3. Sarpong, F.A.; Sappor, P.; Nyantakyi, G.; Agyeiwaa, O.E.; Ahakwa, I.; Cobbinah, B.B.; Kir, K.F. Green financial development efficiency: A catalyst for driving China’s green transformation agenda towards sustainable development. Environ. Sci. Pollut. Res. 2023, 30, 60717–60745. [Google Scholar] [CrossRef]
  4. Gao, D.; Li, Y.; Li, G. Boosting the green total factor energy efficiency in urban China: Does low-carbon city policy matter? Environ. Sci. Pollut. Res. 2022, 29, 56341–56356. [Google Scholar] [CrossRef] [PubMed]
  5. Fang, Y.; Cao, H. Environmental decentralization, heterogeneous environmental regulation, and green total factor productivity-evidence from China. Sustainability 2022, 14, 11245. [Google Scholar] [CrossRef]
  6. Xiao, Y. Do financial inclusion and environmental regulations affect the green economy? An empirical study with a generalized linear model. Environ. Sci. Pollut. Res. 2023, 30, 91324–91343. [Google Scholar] [CrossRef]
  7. Fredriksson, P.G.; Wollscheid, J.R. Environmental decentralization and political centralization. Ecol. Econ. 2014, 107, 402–410. [Google Scholar] [CrossRef]
  8. Zhao, B.; Wang, K.-L.; Xu, R.-Y. Fiscal decentralization, industrial structure upgrading, and carbon emissions: Evidence from China. Environ. Sci. Pollut. Res. 2023, 30, 39210–39222. [Google Scholar] [CrossRef]
  9. Opoku, E.E.O.; Acheampong, A.O.; Dzator, J.; Kufuor, N.K. Does environmental sustainability attract foreign investment? Evidence from developing countries. Bus. Strategy Environ. 2022, 31, 3542–3573. [Google Scholar] [CrossRef]
  10. Fu, Z.; Zhou, Y.; Li, W.; Zhong, K. Impact of digital finance on energy efficiency: Empirical findings from China. Environ. Sci. Pollut. Res. 2023, 30, 2813–2835. [Google Scholar] [CrossRef]
  11. Shah, N.; Soomro, B.A. Effects of green human resource management practices on green innovation and behavior. Manag. Decis. 2023, 61, 290–312. [Google Scholar] [CrossRef]
  12. Song, M.; Du, J.; Tan, K.H. Impact of fiscal decentralization on green total factor productivity. Int. J. Prod. Econ. 2018, 205, 359–367. [Google Scholar] [CrossRef]
  13. Wang, Y.; Chen, H.; Long, R.; Sun, Q.; Jiang, S.; Liu, B. Has the sustainable development planning policy promoted the green transformation in China’s resource-based cities. Resour. Conserv. Recycl. 2022, 180, 106181. [Google Scholar] [CrossRef]
  14. Zhao, X.; Nakonieczny, J.; Jabeen, F.; Shahzad, U.; Jia, W. Does green innovation induce green total factor productivity? Novel findings from Chinese city level data. Technol. Forecast. Soc. Change 2022, 185, 122021. [Google Scholar] [CrossRef]
  15. Chen, Y.; Chen, Y.; Yin, G.; Liu, Y. Industrial eco-efficiency of resource-based cities in China: Spatial-temporal dynamics and associated factors. Environ. Sci. Pollut. Res. 2023, 30, 94436–94454. [Google Scholar] [CrossRef]
  16. Zheng, F.; Niu, Y. Environmental decentralization, resource endowment and urban industrial transformation and upgrading: A comparison of resource-based and non-resource-based cities in China. Sustainability 2023, 15, 10475. [Google Scholar] [CrossRef]
  17. Yang, J.; Wang, Y.; Mao, J.; Wang, D. Exploring the dilemma and influencing factors of ecological transformation of resource-based cities in China: Perspective on a tripartite evolutionary game. Environ. Sci. Pollut. Res. 2022, 29, 41386–41408. [Google Scholar] [CrossRef]
  18. Lovo, S. Effect of environmental decentralization on polluting firms in India. Econ. Dev. Cult. Change 2018, 67, 55–94. [Google Scholar] [CrossRef]
  19. Rexhaeuser, S.; Rammer, C. Environmental innovations and firm profitability: Unmasking the Porter hypothesis. Environ. Resour. Econ. 2014, 57, 145–167. [Google Scholar] [CrossRef]
  20. Godil, D.I.; Yu, Z.; Sharif, A.; Usman, R.; Khan, S.A.R. Investigate the role of technology innovation and renewable energy in reducing transport sector CO2 emission in China: A path toward sustainable development. Sustain. Dev. 2021, 29, 694–707. [Google Scholar] [CrossRef]
  21. Udeagha, M.C.; Ngepah, N. Striving towards environmental sustainability in the BRICS economies: The combined influence of fiscal decentralization and environmental innovation. Int. J. Sustain. Dev. World Ecol. 2023, 30, 111–125. [Google Scholar] [CrossRef]
  22. Li, D.; Lv, H. Investment in environmental innovation with environmental regulation and consumers’ environmental awareness: A dynamic analysis. Sustain. Prod. Consump. 2021, 28, 1366–1380. [Google Scholar] [CrossRef]
  23. Van Leeuwen, G.; Mohnen, P. Revisiting the Porter hypothesis: An empirical analysis of green innovation for the Netherlands. Econ. Innov. New Technol. 2017, 26, 63–77. [Google Scholar] [CrossRef]
  24. Turner, E.H.; Thompson, M.A. Further evidence on the financial impact of environmental regulations on the trucking industry. Transp. Policy 2023, 133, 134–143. [Google Scholar] [CrossRef]
  25. Wang, Y.; Sun, X.; Guo, X. Environmental regulation and green productivity growth: Empirical evidence on the Porter Hypothesis from OECD industrial sectors. Energy Policy 2019, 132, 611–619. [Google Scholar] [CrossRef]
  26. Liu, X.; Yang, X. Impact of China’s environmental decentralization on carbon emissions from energy consumption: An empirical study based on the dynamic spatial econometric model. Environ. Sci. Pollut. Res. 2022, 29, 72140–72158. [Google Scholar] [CrossRef] [PubMed]
  27. Shi, F.; Ding, R.; Li, H.; Hao, S. Environmental regulation, digital financial inclusion, and environmental pollution: An empirical study based on the spatial spillover effect and panel threshold effect. Sustainability 2022, 14, 6869. [Google Scholar] [CrossRef]
  28. Yang, S.; Chen, Z.; Umar, M.; Khursheed, A. Environmental regulation and high-quality sustainable development of China’s economy—An empirical study based on a spatial durbin model and threshold model. Ekon. Istraz. 2022, 35, 5699–5718. [Google Scholar] [CrossRef]
  29. Akalin, G.; Erdogan, S. Does democracy help reduce environmental degradation? Environ. Sci. Pollut. Res. 2021, 28, 7226–7235. [Google Scholar] [CrossRef]
  30. Chen, Y.; Kumara, E.K.; Sivakumar, V. Investigation of finance industry on risk awareness model and digital economic growth. Ann. Oper. Res. 2023, 326, 15. [Google Scholar] [CrossRef]
  31. Lee, C.C.; Tang, M.; Lee, C.C. Reaping digital dividends: Digital inclusive finance and high-quality development of enterprises in China. Telecommun. Policy 2023, 47, 102484. [Google Scholar] [CrossRef]
  32. Mukalayi, N.M.; Inglesi-Lotz, R. Digital financial inclusion and energy and environment: Global positioning of Sub-Saharan African countries. Renew. Sust. Energ. Rev. 2023, 173, 113069. [Google Scholar] [CrossRef]
  33. Khan, D.; Nouman, M.; Ullah, A. Assessing the impact of technological innovation on technically derived energy efficiency: A multivariate co-integration analysis of the agricultural sector in South Asia. Environ. Dev. Sustain. 2023, 25, 3723–3745. [Google Scholar] [CrossRef]
  34. Kim, T. Financing technological innovation: Evidence from patent-intensive firms. Glob. Econ. Rev. 2019, 48, 350–362. [Google Scholar] [CrossRef]
  35. Syed, A.A.; Ahmed, F.; Kamal, M.A.; Trinidad Segovia, J.E. Assessing the role of digital finance on shadow economy and financial instability: An empirical analysis of selected South Asian countries. Mathematics 2021, 9, 3018. [Google Scholar] [CrossRef]
  36. Xuan, S.; Ge, W.; Yang, P.; Zhang, Y. Exploring digital finance, financial regulations and carbon emission nexus: New insight from resources efficiency, industrial structure and green innovation in China. Resour. Policy 2024, 88, 104452. [Google Scholar] [CrossRef]
  37. Li, Y.; Yang, X.; Ran, Q.; Wu, H.; Irfan, M.; Ahmad, M. Energy structure, digital economy, and carbon emissions: Evidence from China. Environ. Sci. Pollut. Res. 2021, 28, 64606–64629. [Google Scholar] [CrossRef]
  38. Guo, B.; Wang, Y.; Zhou, H.; Hu, F. Can environmental tax reform promote carbon abatement of resource-based cities? Evidence from a quasi-natural experiment in China. Environ. Sci. Pollut. Res. 2022, 30, 117037–117049. [Google Scholar] [CrossRef]
  39. Zhao, F.; Sun, Y.; Zhang, J. Does industrial agglomeration and environmental pollution have a spatial spillover effect?: Taking panel data of resource-based cities in China as an example. Environ. Sci. Pollut. Res. 2023, 30, 76829–76841. [Google Scholar] [CrossRef]
  40. Tang, Y.; Wang, Y. Impact of digital economy on ecological resilience of resource-based cities: Spatial spillover and mechanism. Environ. Sci. Pollut. Res. 2023, 30, 41299–41318. [Google Scholar] [CrossRef]
  41. Deng, Y.; Jiang, W.; Wang, Z. Economic resilience assessment and policy interaction of coal resource oriented cities for the low carbon economy based on AI. Resour. Policy 2023, 82, 103522. [Google Scholar] [CrossRef]
  42. Anser, M.K.; Yousaf, Z.; Nassani, A.A.; Xuan Vinh, V.; Zaman, K. Evaluating ‘natural resource curse’ hypothesis under sustainable information technologies: A case study of Saudi Arabia. Resour. Policy 2020, 68, 101699. [Google Scholar] [CrossRef]
  43. Ouyang, X.; Li, Q.; Du, K. How does environmental regulation promote technological innovations in the industrial sector? Evidence from Chinese provincial panel data. Energy Policy 2020, 139, 111310. [Google Scholar] [CrossRef]
  44. Li, G.; Guo, F.; Di, D. Regional competition, environmental decentralization, and target selection of local governments. Sci. Total Environ. 2021, 755, 142536. [Google Scholar] [CrossRef]
  45. Calvino, F. Technological innovation and the distribution of employment growth: A firm-level analysis. Ind. Corp. Change 2019, 28, 177–202. [Google Scholar] [CrossRef]
  46. Latif, Z.; Yang, M.; Danish; Latif, S.; Liu, X.; Pathan, Z.H.; Salam, S.; Zeng, J. The dynamics of ICT, foreign direct investment, globalization and economic growth: Panel estimation robust to heterogeneity and cross-sectional dependence. Telemat. Inform. 2018, 35, 318–328. [Google Scholar] [CrossRef]
  47. Shimizu, M. The relationship between pollution abatement costs and environmental regulation: Evidence from the Chinese industrial sector. Rev. Dev. Econ. 2020, 24, 668–690. [Google Scholar] [CrossRef]
  48. Thu, N.T.P.; Huong, L.M.; Xuan, V.N. Factors affecting environmental pollution for sustainable development goals-evidence from Asian countries. Sustainability 2022, 14, 16775. [Google Scholar] [CrossRef]
  49. Gong, Q.; Wang, X.; Tang, X. How can the development of digital economy empower green transformation and upgrading of the manufacturing industry?—A quasi-natural experiment based on the national big data comprehensive pilot zone in China. Sustainability 2023, 15, 8577. [Google Scholar] [CrossRef]
  50. Du, K.; Cheng, Y.; Yao, X. Environmental regulation, green technology innovation, and industrial structure upgrading: The road to the green transformation of Chinese cities. Energy Econ. 2021, 98, 105247. [Google Scholar] [CrossRef]
  51. Herman, K.S.; Xiang, J. How collaboration with G7 countries drives environmental technology innovation in ten Newly Industrializing Countries. Energy Sustain Dev. 2022, 71, 176–185. [Google Scholar] [CrossRef]
  52. Fan, W.; Yan, L.; Chen, B.; Ding, W.; Wang, P. Environmental governance effects of local environmental protection expenditure in China. Resour. Policy 2022, 77, 102760. [Google Scholar] [CrossRef]
  53. Jurgelevicius, A.; Tvaronaviciene, M. Assessing the impact of human capital’s structure on high value-added economic sectors in European countries: Illustration of mining industry. Acta Montan. Slovaca 2021, 26, 106–116. [Google Scholar]
  54. Li, C.J.; Razzaq, A.; Irfan, M.; Luqman, A. Green innovation, environmental governance and green investment in China: Exploring the intrinsic mechanisms under the framework of COP26. Technol. Forecast. Soc. Change 2023, 194, 122708. [Google Scholar] [CrossRef]
  55. Ozturk, I.; Ullah, S. Does digital financial inclusion matter for economic growth and environmental sustainability in OBRI economies? An empirical analysis. Resour. Conserv. Recycl. 2022, 185, 106489. [Google Scholar] [CrossRef]
  56. Daud, S.N.M.; Ahmad, A.H. Financial inclusion, economic growth and the role of digital technology. Financ. Res. Lett. 2023, 53, 103602. [Google Scholar] [CrossRef]
  57. Usman, M.; Balsalobre-Lorente, D.; Jahanger, A.; Ahmad, P. Are Mercosur economies going green or going away? An empirical investigation of the association between technological innovations, energy use, natural resources and GHG emissions. Gondwana Res. 2023, 113, 53–70. [Google Scholar] [CrossRef]
  58. Li, Z.; Zhu, J.; He, J. The effects of digital financial inclusion on innovation and entrepreneurship: A network perspective. Electron. Res. Arch. 2022, 30, 4697–4715. [Google Scholar] [CrossRef]
  59. Chen, Y.; Yang, S.; Li, Q. How does the development of digital financial inclusion affect the total factor productivity of listed companies? Evidence from China. Financ. Res. Lett. 2022, 47, 102956. [Google Scholar] [CrossRef]
  60. Feng, S.; Sui, B.; Liu, H.; Li, G. Environmental decentralization and innovation in China. Econ. Model 2020, 93, 660–674. [Google Scholar] [CrossRef]
  61. Zhang, Y.; Ma, X.; Pang, J.; Xing, H.; Wang, J. The impact of digital transformation of manufacturing on corporate performance-The mediating effect of business model innovation and the moderating effect of innovation capability. Res. Int. Bus. Financ. 2023, 64, 101890. [Google Scholar] [CrossRef]
  62. Zhang, J.; Wang, J.; Yang, X.; Ren, S.; Ran, Q.; Hao, Y. Does local government competition aggravate haze pollution? A new perspective of factor market distortion. Socioecon. Plann. Sci. 2021, 76, 100959. [Google Scholar]
  63. Ran, Q.; Zhang, J.; Hao, Y. Does environmental decentralization exacerbate China’s carbon emissions? Evidence based on dynamic threshold effect analysis. Sci. Total Environ. 2020, 721, 137656. [Google Scholar] [CrossRef] [PubMed]
  64. Yang, L.; Zhang, Y. Digital financial inclusion and sustainable growth of small and micro enterprises-evidence based on China’s new third board market listed companies. Sustainability 2020, 12, 3733. [Google Scholar] [CrossRef]
  65. Wang, J.; Feng, L.; Li, B. The heterogeneity impact of factor market distortions on GTFP: From the view of resource-based cities. Environ. Sci. Pollut. Res. 2023, 30, 78108–78126. [Google Scholar] [CrossRef]
  66. Wang, Y.; Yin, S.; Fang, X.; Chen, W. Interaction of economic agglomeration, energy conservation and emission reduction: Evidence from three major urban agglomerations in China. Energy 2022, 241, 122519. [Google Scholar] [CrossRef]
  67. Borsatto, J.M.L.S.; Amui, L.B.L. Green innovation: Unfolding the relation with environmental regulations and competitiveness. Resour. Conserv. Recycl. 2019, 149, 445–454. [Google Scholar] [CrossRef]
  68. Wang, M.; Xu, M.; Ma, S. The effect of the spatial heterogeneity of human capital structure on regional green total factor productivity. Struct. Change Econ. Dyn. 2021, 59, 427–441. [Google Scholar] [CrossRef]
  69. Wang, W.; Xiao, W.; Bai, C. Can renewable energy technology innovation alleviate energy poverty? Perspective from the marketization level. Technol. Soc. 2022, 68, 101933. [Google Scholar] [CrossRef]
  70. Xie, Q.; Fan, X. Carbon emission reduction effects of green finance reform and innovation pilot zones policy: Evidence from the prefecture-level city in China. Environ. Sci. Pollut. Res. 2023, 30, 102624–102640. [Google Scholar] [CrossRef]
  71. Ahmad, M.; Satrovic, E. Role of economic complexity and government intervention in environmental sustainability: Is decentralization critical? J. Clean. Prod. 2023, 418, 138000. [Google Scholar] [CrossRef]
  72. Wang, X.; Wang, Q. Research on the impact of green finance on the upgrading of China’s regional industrial structure from the perspective of sustainable development. Resour. Policy 2021, 74, 102436. [Google Scholar] [CrossRef]
  73. Hansen, B.E. Threshold effects in non-dynamic panels, estimation, testing, and inference. J. Econom. 1999, 93, 345–368. [Google Scholar] [CrossRef]
  74. Che, C.M. Panel threshold analysis of Taiwan’s outbound visitors. Econ. Model. 2013, 33, 787–793. [Google Scholar] [CrossRef]
  75. Si, R.; Wang, Y.; Cao, M.; Wen, H. Does green technology innovation promote green economic growth? -Examining regional heterogeneity between resource-based and non-resource-based cities. Int. Rev. Econ. Financ. 2024, 94, 103406. [Google Scholar] [CrossRef]
Figure 1. Mechanisms of influence of H1.
Sustainability 16 07564 g001
Figure 2. Mechanisms of influence of H2.
Sustainability 16 07564 g002
Figure 3. Plot of maximum likelihood ratio function with environmental decentralization of resource-based cities as the threshold variable.
Sustainability 16 07564 g003
Figure 4. Plot of maximum likelihood ratio function with digital financial inclusion in resource-based cities as the threshold variable.
Sustainability 16 07564 g004
Table 1. Evaluation index system of green transformation of industries.
Index TypeSecondary IndexIndex Description
input indexcapital inputfixed capital stock
R&D expenditure
labor inputnumber of employees in mining industry
R&D personnel
energy resource inputtotal tons of standard coal as a share of GDP
output indexexpected outputmain business sales income
number of patents
unexpected outputindustrial SO2 emissions
industrial wastewater emissions
industrial soot emissions
Table 2. Descriptive statistics of variables.
VariableObsMeanStd. Dev.MinMax
GTI1344−2.2301.292−8.9691.066
ED1344−1.0531.736−9.0066.115
DFI13441.0110.2890.1931.456
GOV1344−0.8090.898−10.1701.776
EA13440.1510.1500.0040.850
UR13440.5420.1400.1811.077
HC13440.0120.011−0.0010.091
ML13441.6214.7880.00017.141
Table 3. Basic regression outcomes.
Variable(1)
Mixed
(2)
Mixed
(3)
Mixed
(4)
Random
(5)
Random
(6)
Random
(7)
Fixed
(8)
Fixed
(9)
Fixed
ED0.020−0.004−0.0140.097 ***0.073 **0.055 *0.112 ***0.102 ***0.081 **
(0.020)(0.020)(0.021)(0.028)(0.029)(0.030)(0.034)(0.035)(0.037)
DFI 0.697 ***0.716 *** 0.402 ***0.435 *** 0.226 *0.267 **
(0.124)(0.124)(0.115)(0.116)(0.131)(0.133)
ED×DFI 0.045 * 0.043 ** 0.039 *
(0.026)(0.022)(0.022)
GOV−0.098 **−0.076 **−0.089 **−0.198 ***−0.177 ***−0.192 ***−0.216 ***−0.211 ***−0.222 ***
(0.039)(0.038)(0.039)(0.046)(0.046)(0.047)(0.053)(0.053)(0.054)
EA2.679 ***2.634 ***2.640 ***2.451 ***2.180 ***2.137 ***2.199 ***1.845 ***1.740 ***
(0.238)(0.235)(0.235)(0.417)(0.423)(0.424)(0.594)(0.628)(0.631)
UR0.713 ***0.2490.2442.351 ***1.634 ***1.590 ***3.118 ***2.606 ***2.545 ***
(0.257)(0.268)(0.267)(0.357)(0.411)(0.412)(0.430)(0.523)(0.524)
HC2.2180.7610.9267.602 *5.8736.55410.078 **8.886 *9.747 *
(3.182)(3.157)(3.156)(4.388)(4.400)(4.412)(5.115)(5.158)(5.176)
ML0.020 ***0.017 **0.016 **0.034 ***0.033 ***0.032 ***0.034 ***0.034 ***0.033 ***
(0.007)(0.007)(0.007)(0.006)(0.006)(0.006)(0.006)(0.006)(0.006)
_cons−3.137 ***−3.568 ***−3.615 ***−4.074 ***−4.037 ***−4.085 ***−4.480 ***−4.368 ***−4.409 ***
(0.134)(0.153)(0.156)(0.195)(0.194)(0.196)(0.216)(0.226)(0.227)
F33.23833.65629.863 44.49138.61834.239
R-squared0.1300.1500.152 0.1790.1810.183
Note: * p < 10%, ** p < 5%, *** p < 1%.
Table 4. Robustness test analysis.
Variable(1)
Instrumental Variable Approach
(2)
Replacement of Dependent Variable
(3)
SYS-GMM
L.ED 0.504 ***
(0.116)
ED3.317 ***0.006 ***0.203 ***
(1.263)(0.002)(0.076)
DFI−3.426 **0.190 ***1.054 ***
(1.614)(0.007)(0.288)
ED × DFI−0.917 **0.003 **0.135 **
(0.378)(0.001)(0.055)
_cons−4.387 ***2.088 ***0.504 ***
(0.230)(0.012)(0.116)
F328.950252.789286.870
R-squared0.2220.623
Add control variablesYesYesYes
AR (1) 0.000
AR (2) 0.424
Note: ** p < 5%, *** p < 1%.
Table 5. Results of effects test with ED as the threshold.
VariableF-Valuep-ValueBS TimesCrit10Crit5Crit1Threshold
1st Threshold25.490 *0.07330023.05927.90736.4250.274
Note: * p < 10%.
Table 6. Regression results with ED as threshold.
VariableED(ED ≤ 0.274)ED(ED > 0.274)ControlNR2
GTI0.354 *
(0.193)
0.743 ***
(0.210)
YES13440.175
Note: * p < 10%, *** p < 1%.
Table 7. Results of effects test with DFI as the threshold.
VariableF-Valuep-ValueBS TimesCrit10Crit5Crit1Threshold
1st Threshold21.610 ***0.04330029.35338.49059.1381.146
Note: *** p < 1%.
Table 8. Regression results with DFI as threshold.
VariableED (DFI ≤ 1.147)ED (DFI > 1.147)ControlNR2
GTI0.317 ***
(0.065)
0.145 **
(0.057)
YES13440.125
Note: ** p < 5%, *** p < 1%.
Table 9. Regression outcomes of different types of resource-based cities.
Variable(1)
Growing Resource-Based Cities
(2)
Mature Resource-Based Cities
(3)
Declining Resource-Based Cities
(4)
Regenerative Resource-Based Cities
ED−0.205 ***0.134 ***0.006−0.193 **
(0.076)(0.049)(0.091)(0.097)
DFI0.647 **1.523 ***1.424 ***−0.908 ***
(0.285)(0.154)(0.254)(0.344)
ED × DFI0.258 ***0.090 ***−0.117 *0.093 *
(0.070)(0.032)(0.062)(0.056)
Add control variablesYESYESYESYES
_cons−3.390 ***−3.934 ***−4.025 ***−4.615 ***
(0.349)(0.172)(0.339)(0.699)
R-squared0.0870.2570.2590.267
F-value4.80451.55321.7935.888
Note: * p < 10%, ** p < 5%, *** p < 1%.
Disclaimer/Publisher’s Note: The statements, opinions and data contained in all publications are solely those of the individual author(s) and contributor(s) and not of MDPI and/or the editor(s). MDPI and/or the editor(s) disclaim responsibility for any injury to people or property resulting from any ideas, methods, instructions or products referred to in the content.

