Article

Decoupling Analysis between Socio-Economic Growth and Air Pollution in Key Regions of China

Safety and Emergency Management Research Center, Henan Polytechnic University, Jiaozuo 454003, China
*
Author to whom correspondence should be addressed.
Sustainability 2024, 16(17), 7571; https://doi.org/10.3390/su16177571 (registering DOI)
Submission received: 16 July 2024 / Revised: 23 August 2024 / Accepted: 30 August 2024 / Published: 1 September 2024
(This article belongs to the Section Environmental Sustainability and Applications)

Abstract

:
The coordinated development of atmospheric pollution and socio-economic growth plays a core role in the sustainable development of cities and regions. The relationship between socio-economic growth and air pollution can be described using decoupling analysis. The seven key regions of China (168 cities), including Beijing–Tianjin–Hebei and its surrounding areas (BTHSR), the Yangtze River Delta region (YRDR), the Fen-Wei Plain (FWP), the Chengdu–Chongqing region (CCR), the urban agglomeration of the middle reaches of the Yangtze River (MLRYR), the Pearl River Delta region (PRDR), and other provincial capitals and municipalities with specialized plans (OPCCSP) were taken as targets to investigate the spatiotemporal evolution characteristics of AQI values and PM2.5 concentrations from 2014 to 2022. Then, the decoupling relationship between the AQI/PM2.5 and the socio-economic growth index (SEGI) in these key regions was deeply researched by the Tapio decoupling model. The main results were as follows: (1) Although the continuous improvement in air quality was observed in these seven key regions in China, the PM2.5 concentration in the BTHSR and FWP was still higher than 35 μg·m−3. The AQI showed a spatial pattern of high in the north and low in the south, and the distribution of PM2.5 in China was high in the east and low in the west. (2) The decoupling degree between air pollution and socio-economic growth was relatively high in the PRDR and YRDR. In contrast, the degree of decoupling was poor in the FWP and OPCCSP. The decoupling states were primarily influenced by industrial structure, energy consumption, and urbanization. (3) The decoupling of air pollution from socio-economic growth was in a strong decoupling state throughout the majority of the study period, achieving a comparatively ideal decoupling state in 2018. However, the overall decoupling states of the seven regions were not sustainable, and the decoupling stability was relatively poor. During the research period, the decoupling state between socio-economic growth and air pollution changed and was unstable.

1. Introduction

Since implementing the reform and opening-up policy, the industrial economic growth of China has maintained a high speed, and the Chinese government has been committed to achieving stable economic growth to improve people’s living standards. However, over-reliance on highly polluting industries and the continuous energy demand have also led to an increasingly severe air pollution problem [1]. According to the “Ecological Environment Bulletin of the Ministry of Ecology and Environment in China in 2014”, only 16 cities among 161 prefecture-level and above cities in China (accounting for only 9.9%) surpassed the annual average air quality standard for GB3095-2012 [2]. Since 2013, China has begun to experience widespread air pollution, which is mainly presented in the form of haze events.
Human and even public health suffer greatly from air pollution [3] since it is harmful to the respiratory system [4], gastrointestinal (GI) system [5], and mental health [6], and increases the risk of lung cancer [7]. Furthermore, it has many negative impacts on residents’ lives and impairs their happiness [8,9,10]. Even worse, air pollution has become increasingly severe in many fields and threatened people’s quality of life and economic development, i.e., air pollution exacerbates poverty in low-income areas by increasing investment in pollution control [11], increasing the burden on public health and the economy [12], as well as increasing the burden on future health [13]. Moreover, it leads to a great challenge to sustainable economic development [14].
Close correlations were still observed between air pollution levels and socio-economic development, although there has been a tremendous improvement in air quality because of pollution control in recent years [15]. It is important to note that the relationship between air pollution control and promoting sustainable economic development should be addressed well to achieve high-quality development of China’s economy. The dynamic relationship between air pollution and socio-economic growth has been studied using the Environmental Kuznets Curve (EKC) [16,17]. Jiang et al. [18] found that air pollution in the “2 + 26” cities of China was accompanied by economic growth, and there was a U-shaped relationship between economic growth and air pollution. Wang et al. [19] selected panel data from Chinese prefecture-level cities and pointed out that the economic growth expectations of local governments in China had significantly increased air pollution.
The decoupling theory was first proposed by the Organization for Economic Cooperation and Development (OECD). Decoupling in environmental pollution means that environmental pollution does not grow with continuous economic growth. As the acceleration of social–economic development continues, the contradiction between social–economic development and air pollution control in China is becoming more and more prominent; so, it is particularly important to achieve economic growth while realizing the reduction in environmental pollutant emissions. The decoupling model can measure the dynamic development of the relationship between economic growth and environment from adjacent years or different time scales, attracting increasing scholarly research interest. Regarding the research on decoupling theory, the OECD [20] analyzed the decoupling of its member countries using 31 decoupling indicators, which pointed out that the relative decoupling of the environment from the economy was observed in OECD countries. Furthermore, even further decoupling of the environment from the economy was possible. The results of Juknys [21] distinguished the differences between primary decoupling and secondary decoupling. He found that primary decoupling was the link between resource consumption and economic growth, while secondary decoupling was the link between environmental pollution and resource consumption. On this basis, Tapio [22] defined the difference between decoupling, coupling, and negative decoupling. The specific decoupling relationship between the economy and the environment was divided into eight categories by dividing the elasticity indexes.
Because the division avoids the influence of different base periods on the results, its stability has certain advantages. It thus has been widely used in the research of the decoupling of environmental pollution, economic growth and energy consumption. Conrad et al. [23] took a small island state (Malta) as their study case to explore the decoupling between economic growth and environmental degradation, noting that the decoupling between environmental degradation and economic growth was more important than the decoupling of population expansion. Sanyé et al. [24] assessed the decoupling states of GDP from environmental impacts in EU-28. They determined the decoupling status between relative and absolute decoupling during 2005–2014, and the decoupling status varied considerably among countries. Luo et al. [25] focused on the relationship between economic growth and the resource environment in the Central Plains Urban Agglomeration (CPUA) of China. It was proved that the decoupling status was strong in 2015, but Changzhi, Jincheng, Heze, and Anyang had a weak decoupling. Zhou et al. [26] found that most of the economic development and carbon emissions of eight regional industrial sectors in China were weakly decoupled at the end of the 20th century through big data analysis combined with the decoupling extended model. Zhang and Geng et al. [27] studied the decoupling of economic growth and environmental pollution in China from the perspective of regional investment, choosing PM2.5 emissions as the environmental indicator. Their study showed that in China as a whole, as well as its four sub-regions, economic growth and environmental pollution were weakly decoupled from 1998 to 2016. Furthermore, decoupling research has been expanded to the study fields of transportation [28,29,30], land resources [31,32], and agricultural [33,34] and economic development relationships, as well as other fields. Freitas et al. [30] examined the relationship between carbon emissions, transportation and economic growth in Brazil, concluding that energy mix and economy structure were the important factors affecting the decoupling states. Li et al. [32] paid attention to carbon emissions from the construction land (CECL) of Shanghai in 1999–2015. They analyzed the relationship between economic growth and CO2 emissions by constructing a decoupling model, which indicated a strong decoupling in 2002, 2012, 2014, and 2015, while weak decoupling states were observed in the remaining years.
The research on the decoupling relationship between environmental pollution and economic growth at the national, regional, and provincial levels has attracted increasing attention from domestic and foreign scholars. Engo [35] studied the decoupling relationship between economic growth and CO2 emissions in Cameroon, and found that Cameroon was weakly decoupled throughout the study period. In contrast, Roinioti and Koroneos [36] pointed out the decoupling status varied over time. The decoupling of economic growth and environmental pressure in China was investigated by Liang and Liu et al. [37], who concluded that there were four distinguishable periods of decoupling performance, and the relative decoupling status was realized generally. The Yangtze River Economic Belt [38,39] and Beijing–Tianjin–Hebei region [40] were selected as targets to focus on regarding regional air pollution in China. In addition, Dong et al. [41], Ji et al. [42], and Yu et al. [43] explored the decoupling between environmental pressure and economic development in Jiangsu, Yunan, and Chongqing, respectively.
The decoupling of carbon emissions and economic growth has attracted many researchers, while SO2, NOX, and industrial dust emissions are the most widely used environmental pollution indicators [25,44,45]. As one of the main air pollutants in China, a decrease in PM2.5 concentration remains the key to air pollution control. In 2022, 52.1% of the total days exceeded the standards for particulate matter as the primary pollutant, and 36.9% exceeded the standards for PM2.5 as the primary pollutant [46]. Moreover, the PM2.5 concentration in most Chinese cities has long exceeded the environmental safety and quality guidelines published by the World Health Organization (5 μg·m−3), posing a threat to human life and health. In addition, air quality conditions can be comprehensively reflected by the Air Quality Index (AQI). Therefore, PM2.5 and AQI were chosen to analyze the decoupling between air pollution and socio-economic growth. Most existing studies focus on decoupling from economic growth [42,43,47,48], and the GDP or GDP per capita has been used as the only indicator of economic growth. A series of socio-economic drivers lead to increased air pollutants while promoting socio-economic growth, including population, urbanization, industrial structure, industry, and living energy consumption. Furthermore, the coordinated development of atmosphere pollution and socio-economic growth is the basis for realizing high-quality development. Therefore, this study examined the decoupling relationship between air pollution and socio-economic growth, and the aggregative socio-economic growth index (SEGI) was extracted from various socio-economic parameters, including urban development, economic growth, industrial structure, and energy consumption.
This review of the literature makes it possible to identify the following three trends: (1) Relatively little attention was committed to the comparative analysis of the decoupling differences among different regions at the national scale. However, there are considerable differences in natural resource endowments among various regions. Therefore, it is urgent to investigate the regional differences in the decoupling of air pollution and social–economic growth nationwide in China. (2) Most scholars paid attention to the decoupling state under the synchronous growth of pollutant level and GDP. (3) The GDP or per capita GDP was commonly used as an economic growth indicator for decoupling analysis, with fewer studies focusing on the decoupling of socio-economic growth from air pollution. However, a single GDP is difficult to be separated from the comprehensive socio-economic development indicators.
This study aimed to clarify the decoupling states of socio-economic growth from air pollution and regional differences in the seven regions, provide policy recommendations for improving air quality in China, and thus promote sustainable development of social economy. The main objectives were as follows: (1) investigate the spatial and temporal variation characteristics of PM2.5 concentrations and AQI values in seven key regions of China from 2014 to 2022 to obtain a thorough comprehension of the effectiveness of air pollution control; and (2) consider the decoupling states of PM2.5 and AQI from socio-economic growth in these seven regions from 2015 to 2021 using the Tapio decoupling model. This manuscript is divided into several parts. Section 2 presents the study areas, methods and related data of this paper. In Section 3, the spatiotemporal evolution characteristics of air pollution and the decoupling states of socio-economic growth from air pollution were analyzed. Section 4 presents the main discussion. Section 5 contains the conclusions from this research and recommendations of a political nature.

2. Materials and Methods

2.1. Study Areas

According to the key regions for air pollution prevention and control divided by the Ministry of Ecology and Environment of the People’s Republic of China, this study examined the following seven regions with 168 cities [49] (Figure 1): (1) Beijing–Tianjin–Hebei and its surrounding areas (BTHSR, 54 cities); (2) the Yangtze River Delta region (YRDR 41, cities); (3) the Fen-Wei Plain (FWP, 11 cities); (4) the Chengdu–Chongqing region (CCR, 16 cities); (5) the urban agglomeration of the middle reaches of the Yangtze River (MLRYR, 22 cities); (6) the Pearl River Delta region (PRDR, 9 cities); and (7) the other provincial capitals and municipalities with specialized plans (OPCCSP, 15 cities).

2.2. Data Sources

This study used Air Quality Index (AQI) values and PM2.5 concentrations of 168 cities from 2014 to 2022 as measures of air pollution. The statistics were obtained from the Ministry of Ecology and Environment of the People’s Republic of China and the China Air Quality Online Monitoring and Analysis Platform (https://www.aqistudy.cn/historydata/ accessed on 8 March 2023).

2.3. The Social-Economic Growth Index

2.3.1. The Evaluation Index System

In this study, the selection of sub-indicators was based on the DPSIR model (Driving forces-Pressures-State-Impact-Response). The DPSIR model describes the current environmental state and its impacts on ecosystems through the direct pressures on the environment caused by the driving forces of social and economic activities. According to the DPSIR model, the accurate factors affecting socio-economic conditions can be identified. Socio-economic growth indicators are selected from the perspectives of driving forces and pressures. “Driving forces” refer to the underlying causes of resource and environmental changes, mainly referring to the trends in socio-economic activities and industrial development. Representative indicators include the level and scale of economic development, population, industrial structure, and output value. “Pressures” refer to the impacts of human activities on the adjacent resource environment and natural resource environment, which are direct pressure factors on the environment, mainly manifested as the intensity of energy consumption. The representative indicators are living energy consumption, energy consumption of the scale enterprise. Furthermore, in reference to the study of Qin et al., Fan et al., and Zhang et al. [50,51,52], the following sub indicators were selected (Table 1).
The living energy consumption (ES1j) in the 168 cities in a year was computed based on Equation (1):
ES1j = ES0 × UD1j
where ES0 represents the per capita living energy consumption of each province, and UD1j is the population of j municipalities in each province, with j = 1, 2, 3, …, 168.

2.3.2. Calculation Method of Social-Economic Growth Index

The socio-economic growth data were standardized and processed using the statistical analysis software SPSS27.0. The principal component analysis (PCA) method was used to calculate the socio-economic growth index (SEGI), UDPG, EGCIS, and ECGSC.
The original data were standardized by Equation (2) to eliminate the difference in dimensionality and magnitude (year 2020 was selected as the reference year) given the inconsistent statistical caliber of various measurement indicators. The calculation model was as follows:
X i = Y i Y 2020
where Xi represents the standardized the values in year i, Yi is the primitive values in year i, and Y2020 is the values in year 2020.
The calculation of SEGI requires the use of three indicators: UDPG, EGCIS, and ECGSC. The data in Table 1 are used for the calculation of UDPG, EGCIS, and ECGSC. These four indicators can be derived using Formulas (3)–(5).
P = i = 1 n λ i i n λ i F i
F i = ω i 1 X 1 + ω i 2 X 2 + ω i m X m
ω i j =     θ j λ i
where n is the number of principal components; i is the i-th indicator; m is the number of indicators; F i is the score of each component; ω i j is the weight; and θ j and λ i are the coefficients of each variable in the component matrix and the eigenvalues corresponding to each principal component, respectively.

2.4. Tapio Decoupling

The main methods for measuring the decoupling relationship are the Tapio elasticity coefficient and the OECD decoupling factor. Compared to the OECD decoupling factor, Tapio decoupling improves upon the calculation method of the OECD decoupling factor and avoids the instability of base period selection during the calculation process, allowing for a more comprehensive and precise reflection of the relationship between the economy and the environment. Thus, we adopted the Tapio decoupling model to study the decoupling state of air pollution and socio-economic growth; the calculation formula of the Tapio decoupling index [22,25] is defined as follows:
D I = Δ P I Δ S E G I = E t E t 1 / E t 1 S E G I t S E G I t 1 / S E G I t 1
Among them, DI represents the decoupling indicator, ∆PI denotes the rate of change in air pollution, and ∆SEGI denotes the rate of change in SEGI. Et and Et − 1 represent air pollutant emissions in years t and t − 1, respectively; SEGIt and SEGIt−1 represent socio-economic growth in years t and t − 1, respectively. The types of decoupling could be divided into eight states [22] (Table 2).

2.5. Pearson’s Correlation Analysis

Pearson’s correlation is a statistical method that measures the degree of correlation between X and Y. It can quantitatively assess the relationship between fluctuating data and various factors. The correlation coefficient (r) is in the range of [−1, 1]; the greater the absolute value of r, the stronger the correlation between the two variables. The correlation coefficient r is defined as follows:
r = i = 1 n ( X i X ) ( Y i Y ) i = 1 n ( X i X ) 2 i = 1 n ( Y i Y ) 2

3. Results

3.1. The Spatiotemporal Evolution Characteristics of Air Pollution

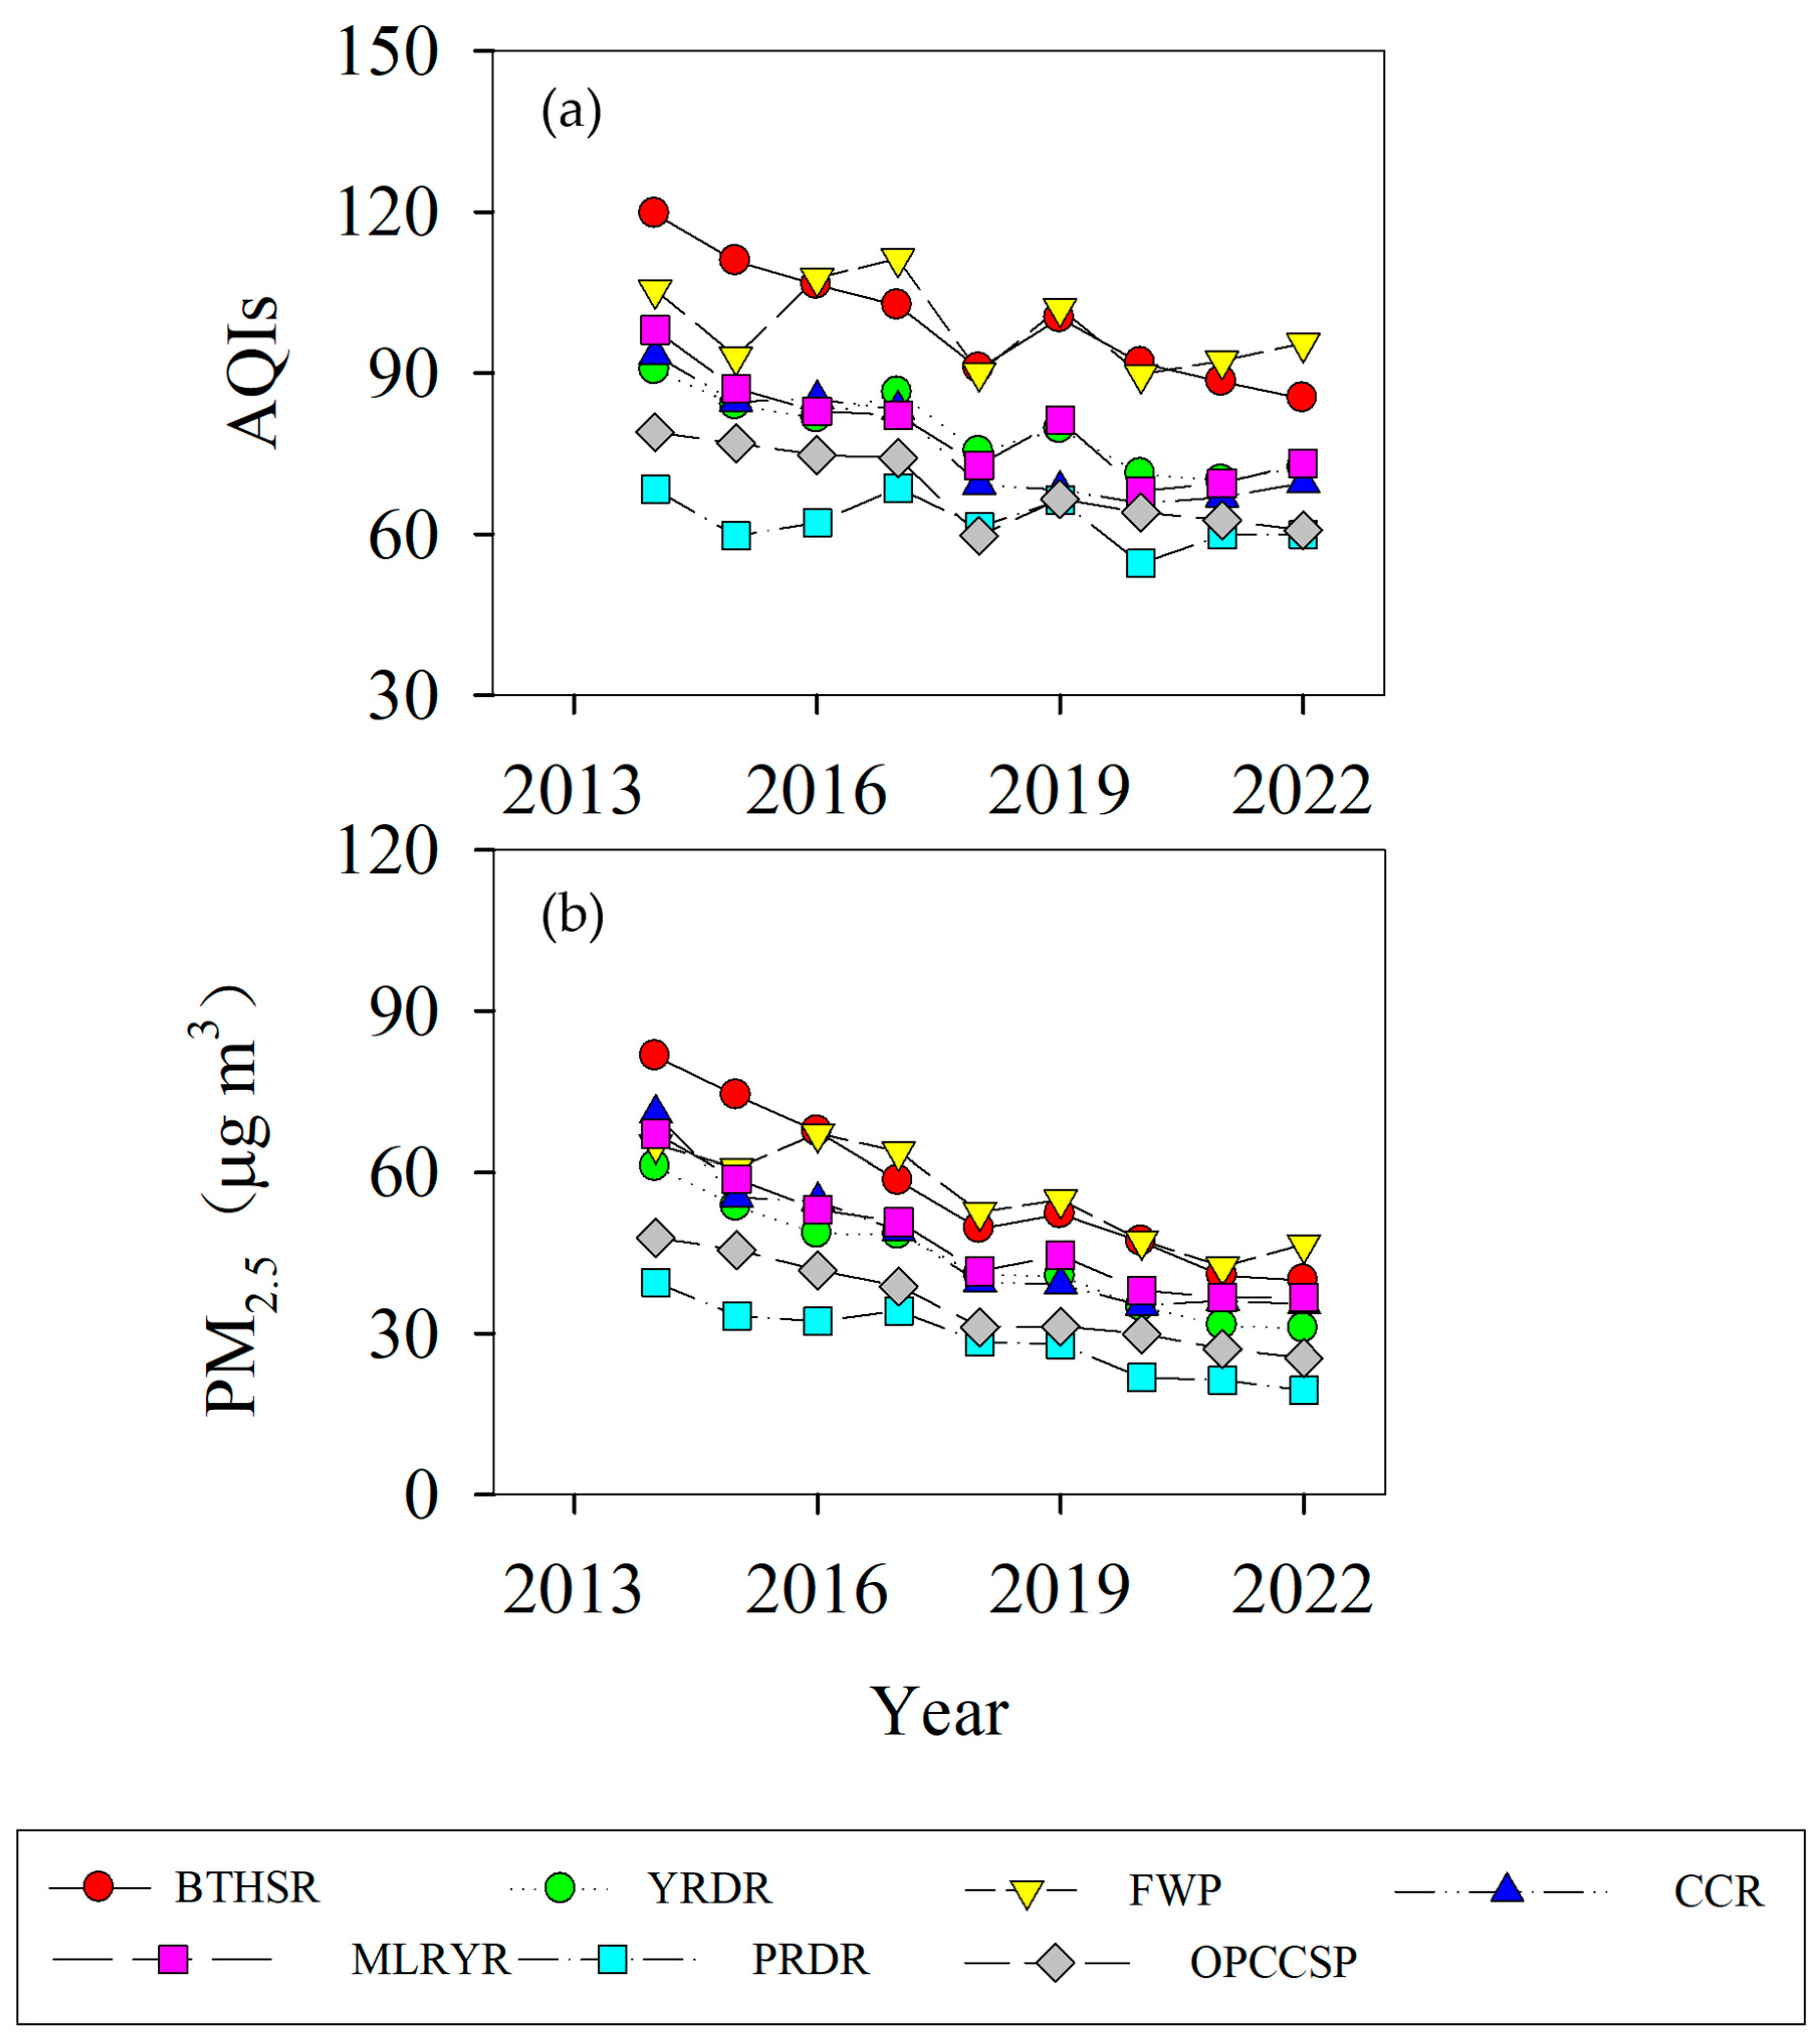
3.1.1. Temporal Evolution Characteristics

Figure 2 shows the temporal evolution characteristics of PM2.5 concentrations and the AQI index in the seven key regions of China from 2014 to 2022. Fluctuating decreases in AQI values were observed in these regions from 2014 to 2022 (Figure 2a). The annual average AQI index of the seven regions showed an overall downward trend from 2014 to 2022, with a significant decrease from 2015 to 2018, a slight increase from 2018 to 2019, and a slight decrease from 2019 to 2020. Air quality showed varying degrees of improvement in the seven regions, as demonstrated by the BTHSR (28.71%), YRDR (20.12%), FWP (9.39%), CCR (25.93%), MLRYR (25.41%), PRDR (12.30%), and OPCCSP (23.06%). The highest annual average AQI values were in the BTHSR and FWP, with values higher than 100 (the second standard for HJ663-2013 [53]) in 2014, especially in FWP, with AQI values of 95.48 in 2022. At the same time, the PRDR has always maintained relatively good air quality. Therefore, the monitoring and prevention of air pollution in the BTHSR and FWP should be emphasized and strengthened, and the excellent air quality in the PRDR should continue to be maintained to intensify the prevention and control of air pollution.
From 2014 to 2022, the concentrations of PM2.5 showed a steady downward trend over time (Figure 2b). In 2014, the PM2.5 pollution was severe in these key regions of China; the PM2.5 concentrations in the seven regions all exceeded the CAAQS (Chinese Ambient Air Quality Standards (GB3095-2012)) Grade II standards (<35 μg/m3). Since the 13th Five-Year Plan, with the gradual implementation of atmospheric pollution reduction policies in China, PM2.5 pollution emissions have been controlled, and the overall PM2.5 concentration in various regions has shown a downward trend. From 2018 to 2019, the PM2.5 concentration showed a slight increase, which was related to the weakening of environmental policy effects. However, it is important to note that the PM2.5 concentrations of the seven regions were still higher than the World Health Organization’s health standard value (5 μg·m−3). Moreover, in 2022, the concentration of PM2.5 in the BTHSR, FWP, and MLRYR still exceeded the Grade II standards, and the PM2.5 concentration in the FWP was still 1.33 times the national second-level standard limit. Therefore, a decrease in PM2.5 concentration is still a heavy burden that will take a long time to resolve.

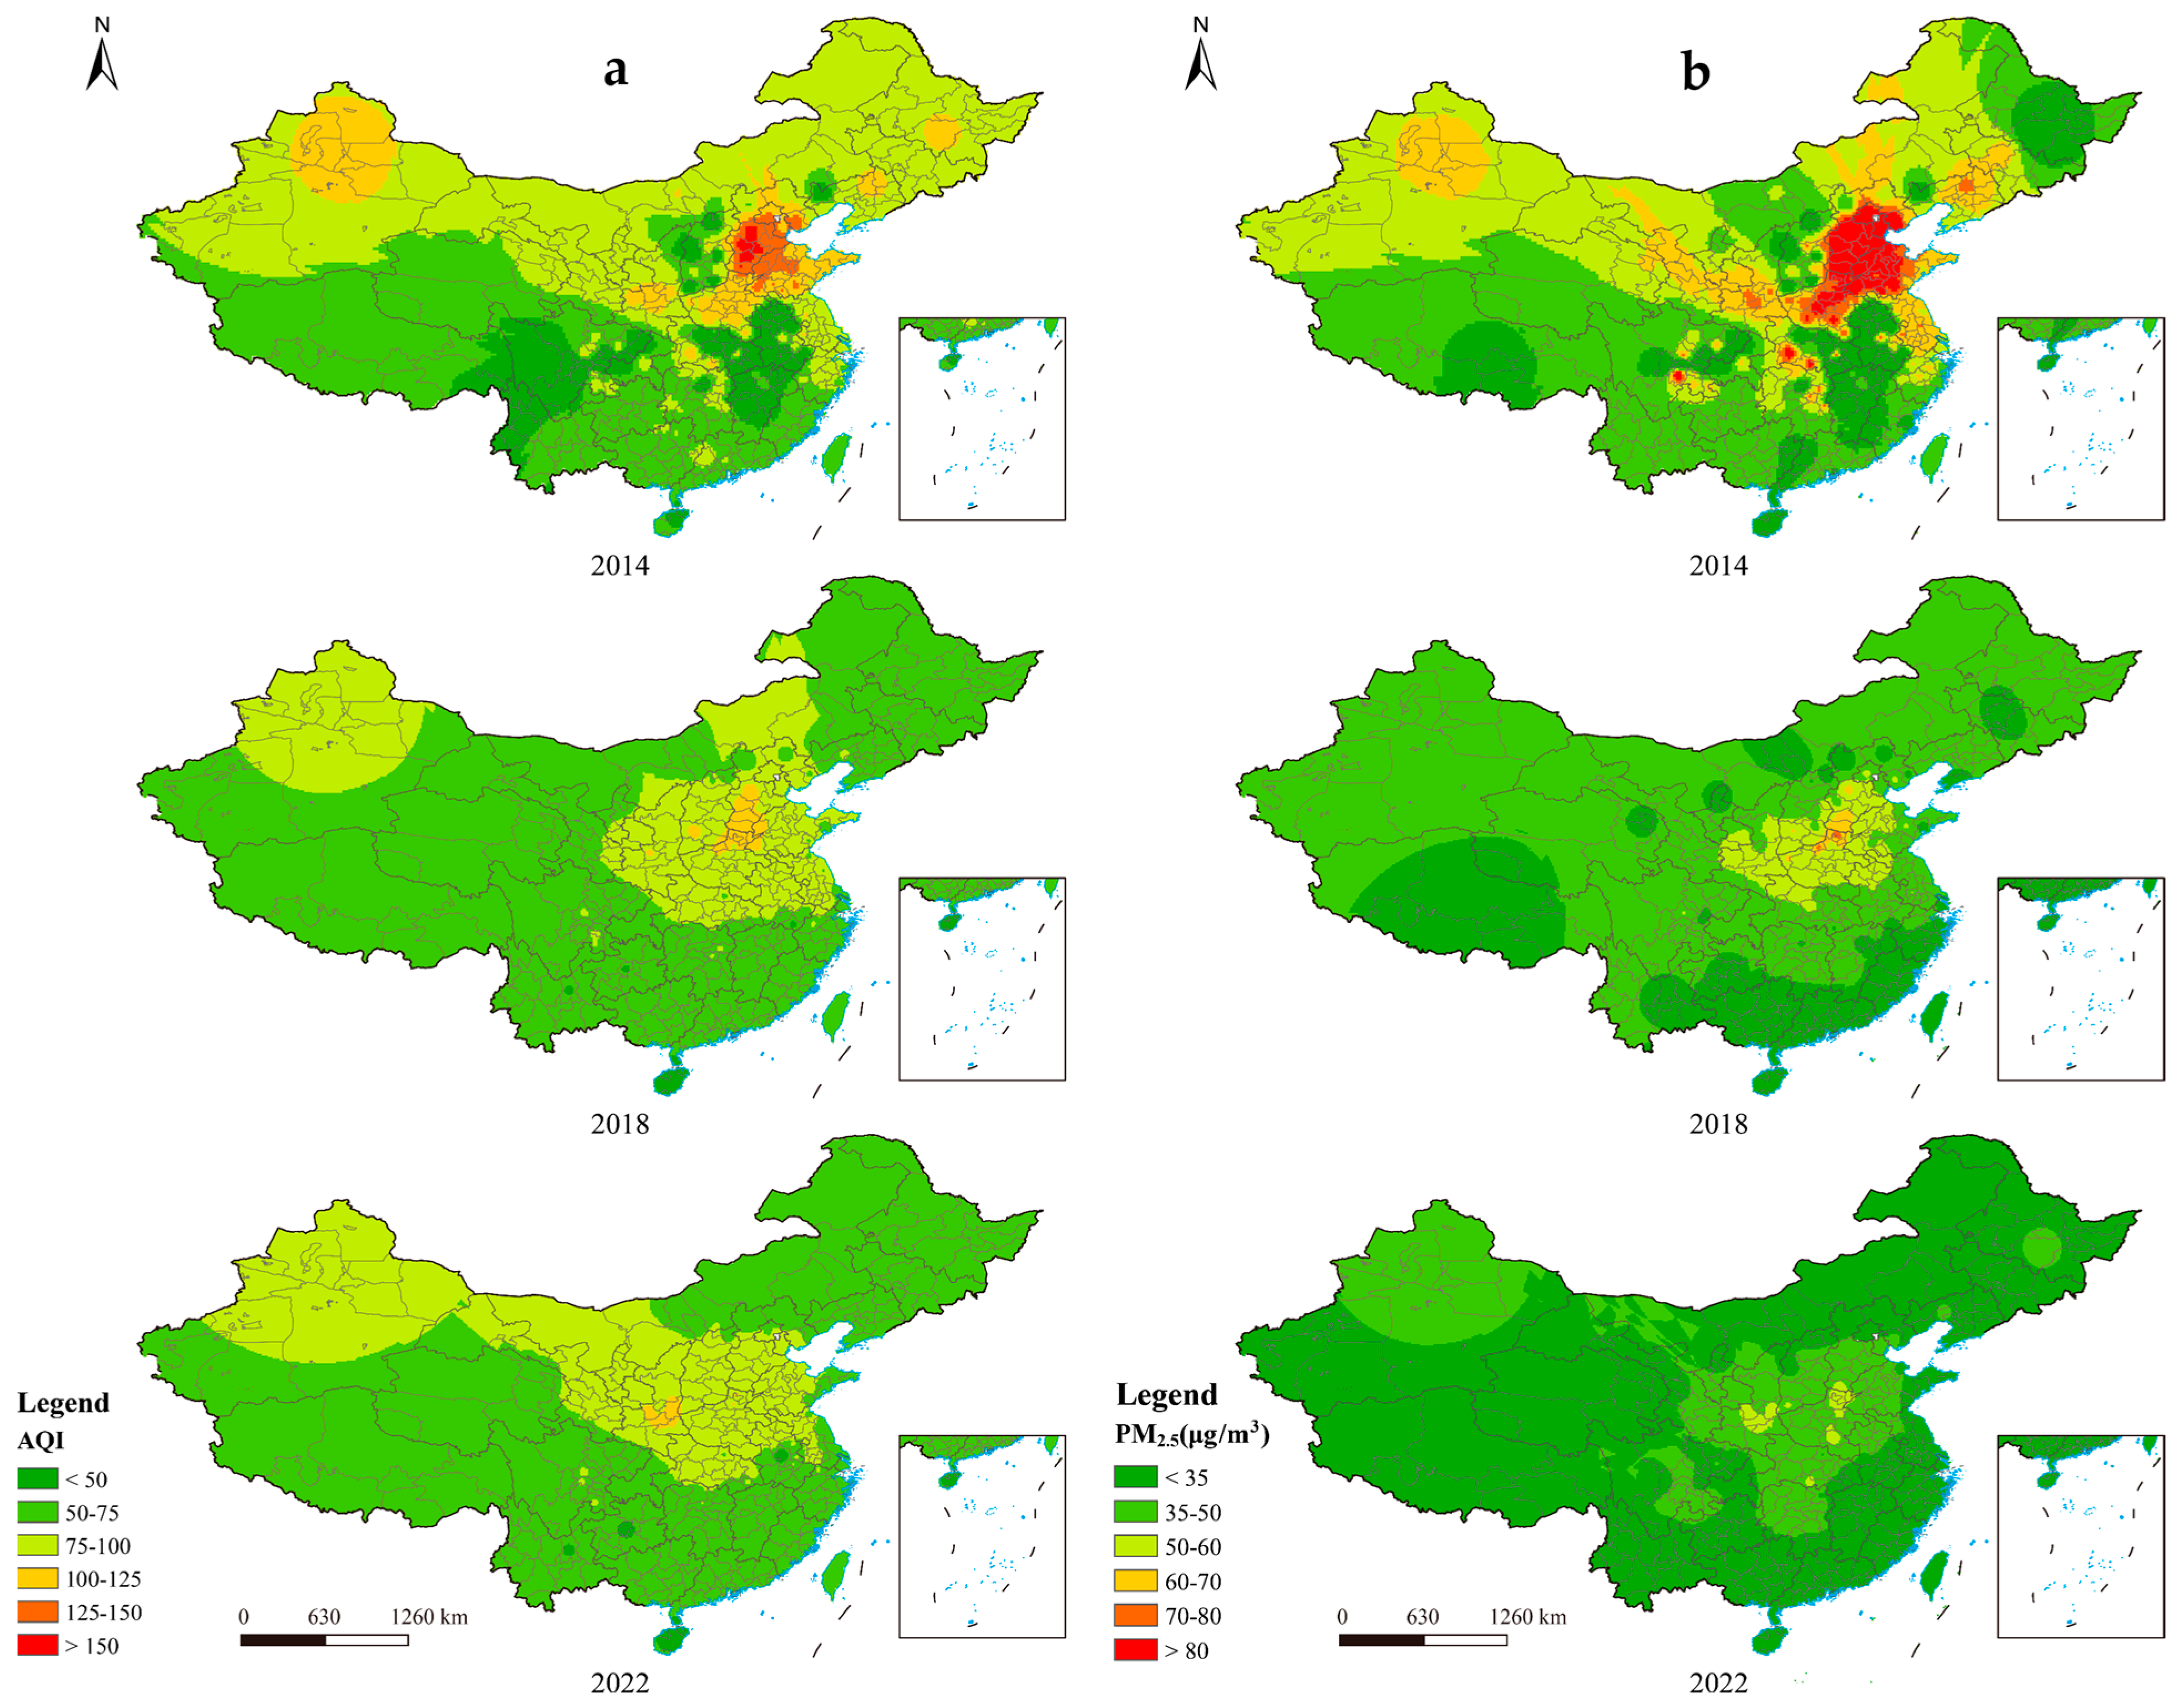
3.1.2. Spatial Evolution Characteristics

The average annual AQI values showed a spatial pattern of high in the north and low in the south, and the air quality in the southeastern coastal areas was significantly better than that in the northern and central regions (Figure 3a). The cities with poor air quality were mainly concentrated in the BTHSR, while those with slight pollution were distributed in the FWP. In contrast, the air quality of the PRDR was excellent. Among the 168 cities, those with relatively poor air quality were Baoding, Xingtai, and Shijiazhuang, and the only city with excellent air quality was Haikou. From 2014 to 2022, the air quality in China improved generally with significant reductions in pollution intensity and spatial extent. In 2022, the only cities with unqualified air quality were Kaifeng, Anyang, and Xinxiang in the BTHSR, and Xi ‘an, Xianyang, and Weinan in the FWP.
As depicted in Figure 3b, from the perspective of regional distribution, due to the influence of topography, economic development, industrial layout, and other factors, the distribution of PM2.5 in China was high in the east and low in the west. In 2014, cities with high PM2.5 pollution were concentrated in the BTHSR, YRDR, FWP, and Xinjiang province and Northeast China. The average annual concentration of PM2.5 in these cities generally exceeded the Grade II standards. In 2022, there was a significant improvement in PM2.5 in most regions of China, but the PM2.5 concentrations in the BTHSR and FWP were still above the Grade II standards. Generally, PM2.5 pollution has improved over the years, but the BTHSR and FWP still need to strengthen governance. In addition, it is necessary to prevent the rebound of PM2.5 concentration in other areas.

3.2. Decoupling of AQI from Socio-Economic Growth

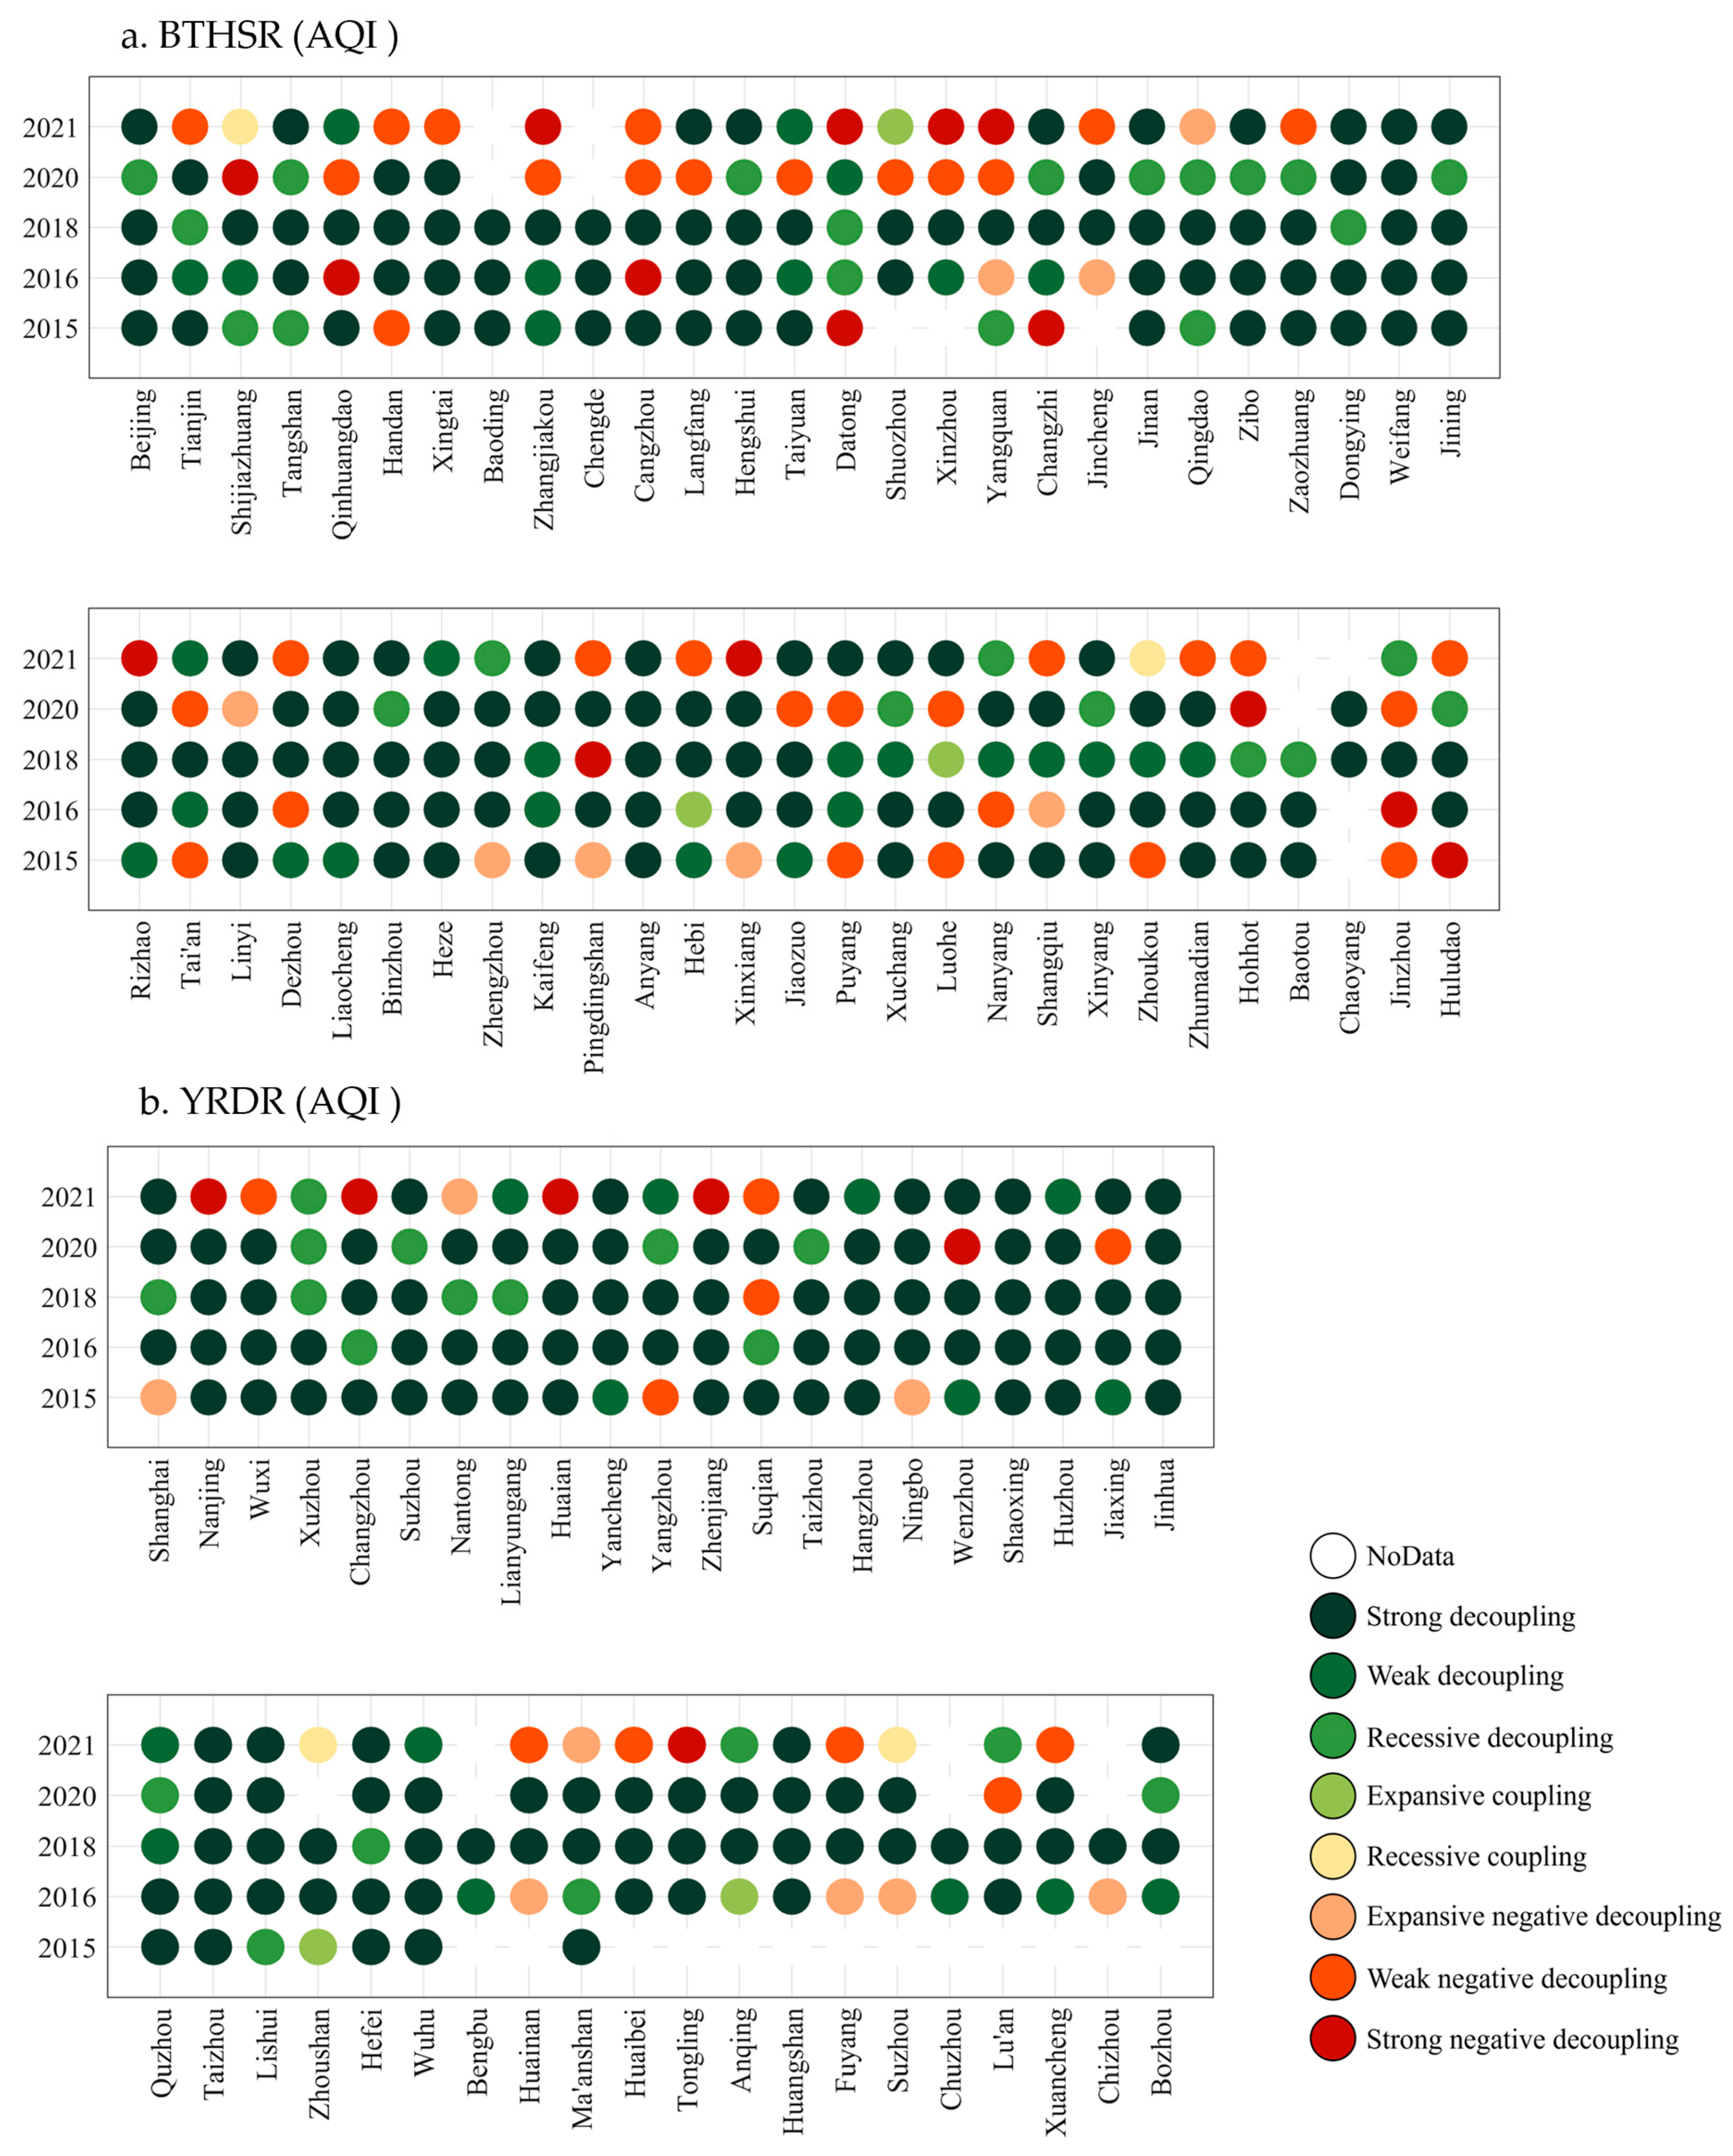
3.2.1. Decoupling of AQI from Socio-Economic Growth in the BTHSR

The AQI values in the BTHSR decreased by 24.1% from 2014 to 2018 (Figure 2a). A total of 56.0% and 18.0% of cities in the BTHSR were in strong decoupling states and negative decoupling states, respectively, in 2015, while these percentages were 72.2% and 1.9% in 2018 (Figure 4a). In 2018, only Pingdingshan had strong negative decoupling, Luohe had expansive coupling, and the rest of the cities were in decoupling states, indicating that socio-economic growth was less dependent on air pollution, which was favorable to sustainable development. Furthermore, resource-based cities, including Handan, Xingtai, Zhangjiakou, Cangzhou, Datong, Xinzhou, Yangquan, Pingdingshan, Xinxiang, Hohhot, and Huludao, accounted for 55% of the negative decoupling states in 2021. This is supported by the analysis conducted by Guo et al. and Zhang et al., which indicated that resource consumption was still the main causes for air pollution in the BTHSR [54,55]. It is worth mentioning that Kaifeng and Anyang were in an ideal state of strong decoupling or weak decoupling in 2015–2021 mainly because Kaifeng is a tourist city without highly polluting industry, while Anyang actively responded and implemented industrial restructuring and has achieved initial results in urban transformation.

3.2.2. Decoupling of AQI from Socio-Economic Growth in the YRDR

The decoupling states from 2015 to 2020 were similar and relatively stable, with strong decoupling being the main focus (Figure 4b). Consistent with the BTHSR, the YRDR exhibited the best decoupling states in 2018, with strong decoupling accounting for 82.9%, and only Suqian had weak negative decoupling. In 2021, there was a decrease in strong decoupling and an increase in negative decoupling, with strong decoupling accounting for 36.8% and negative decoupling accounting for 34.2%, indicating that the overall level of decoupling was decreasing. Negative decoupling cities mainly included Nanjing, Wuxi, Changzhou, Huaian, Zhenjiang, Suzhou, and Huaibei in Jiangsu Province, as well as Huainan, Tongling, Fuyang, and Xuancheng. Because the decline rate of AQI in these cities slowed down, and at the same time, China’s social–economic development was affected by COVID-19 [56], the decline rate of the SEGI was greater than that of the AQI; so, there was a temporary negative decoupling state. After the continued implementation of pollution control policies and the gradual improvement in the economy after the epidemic, it should be possible to return to a state of decoupling.

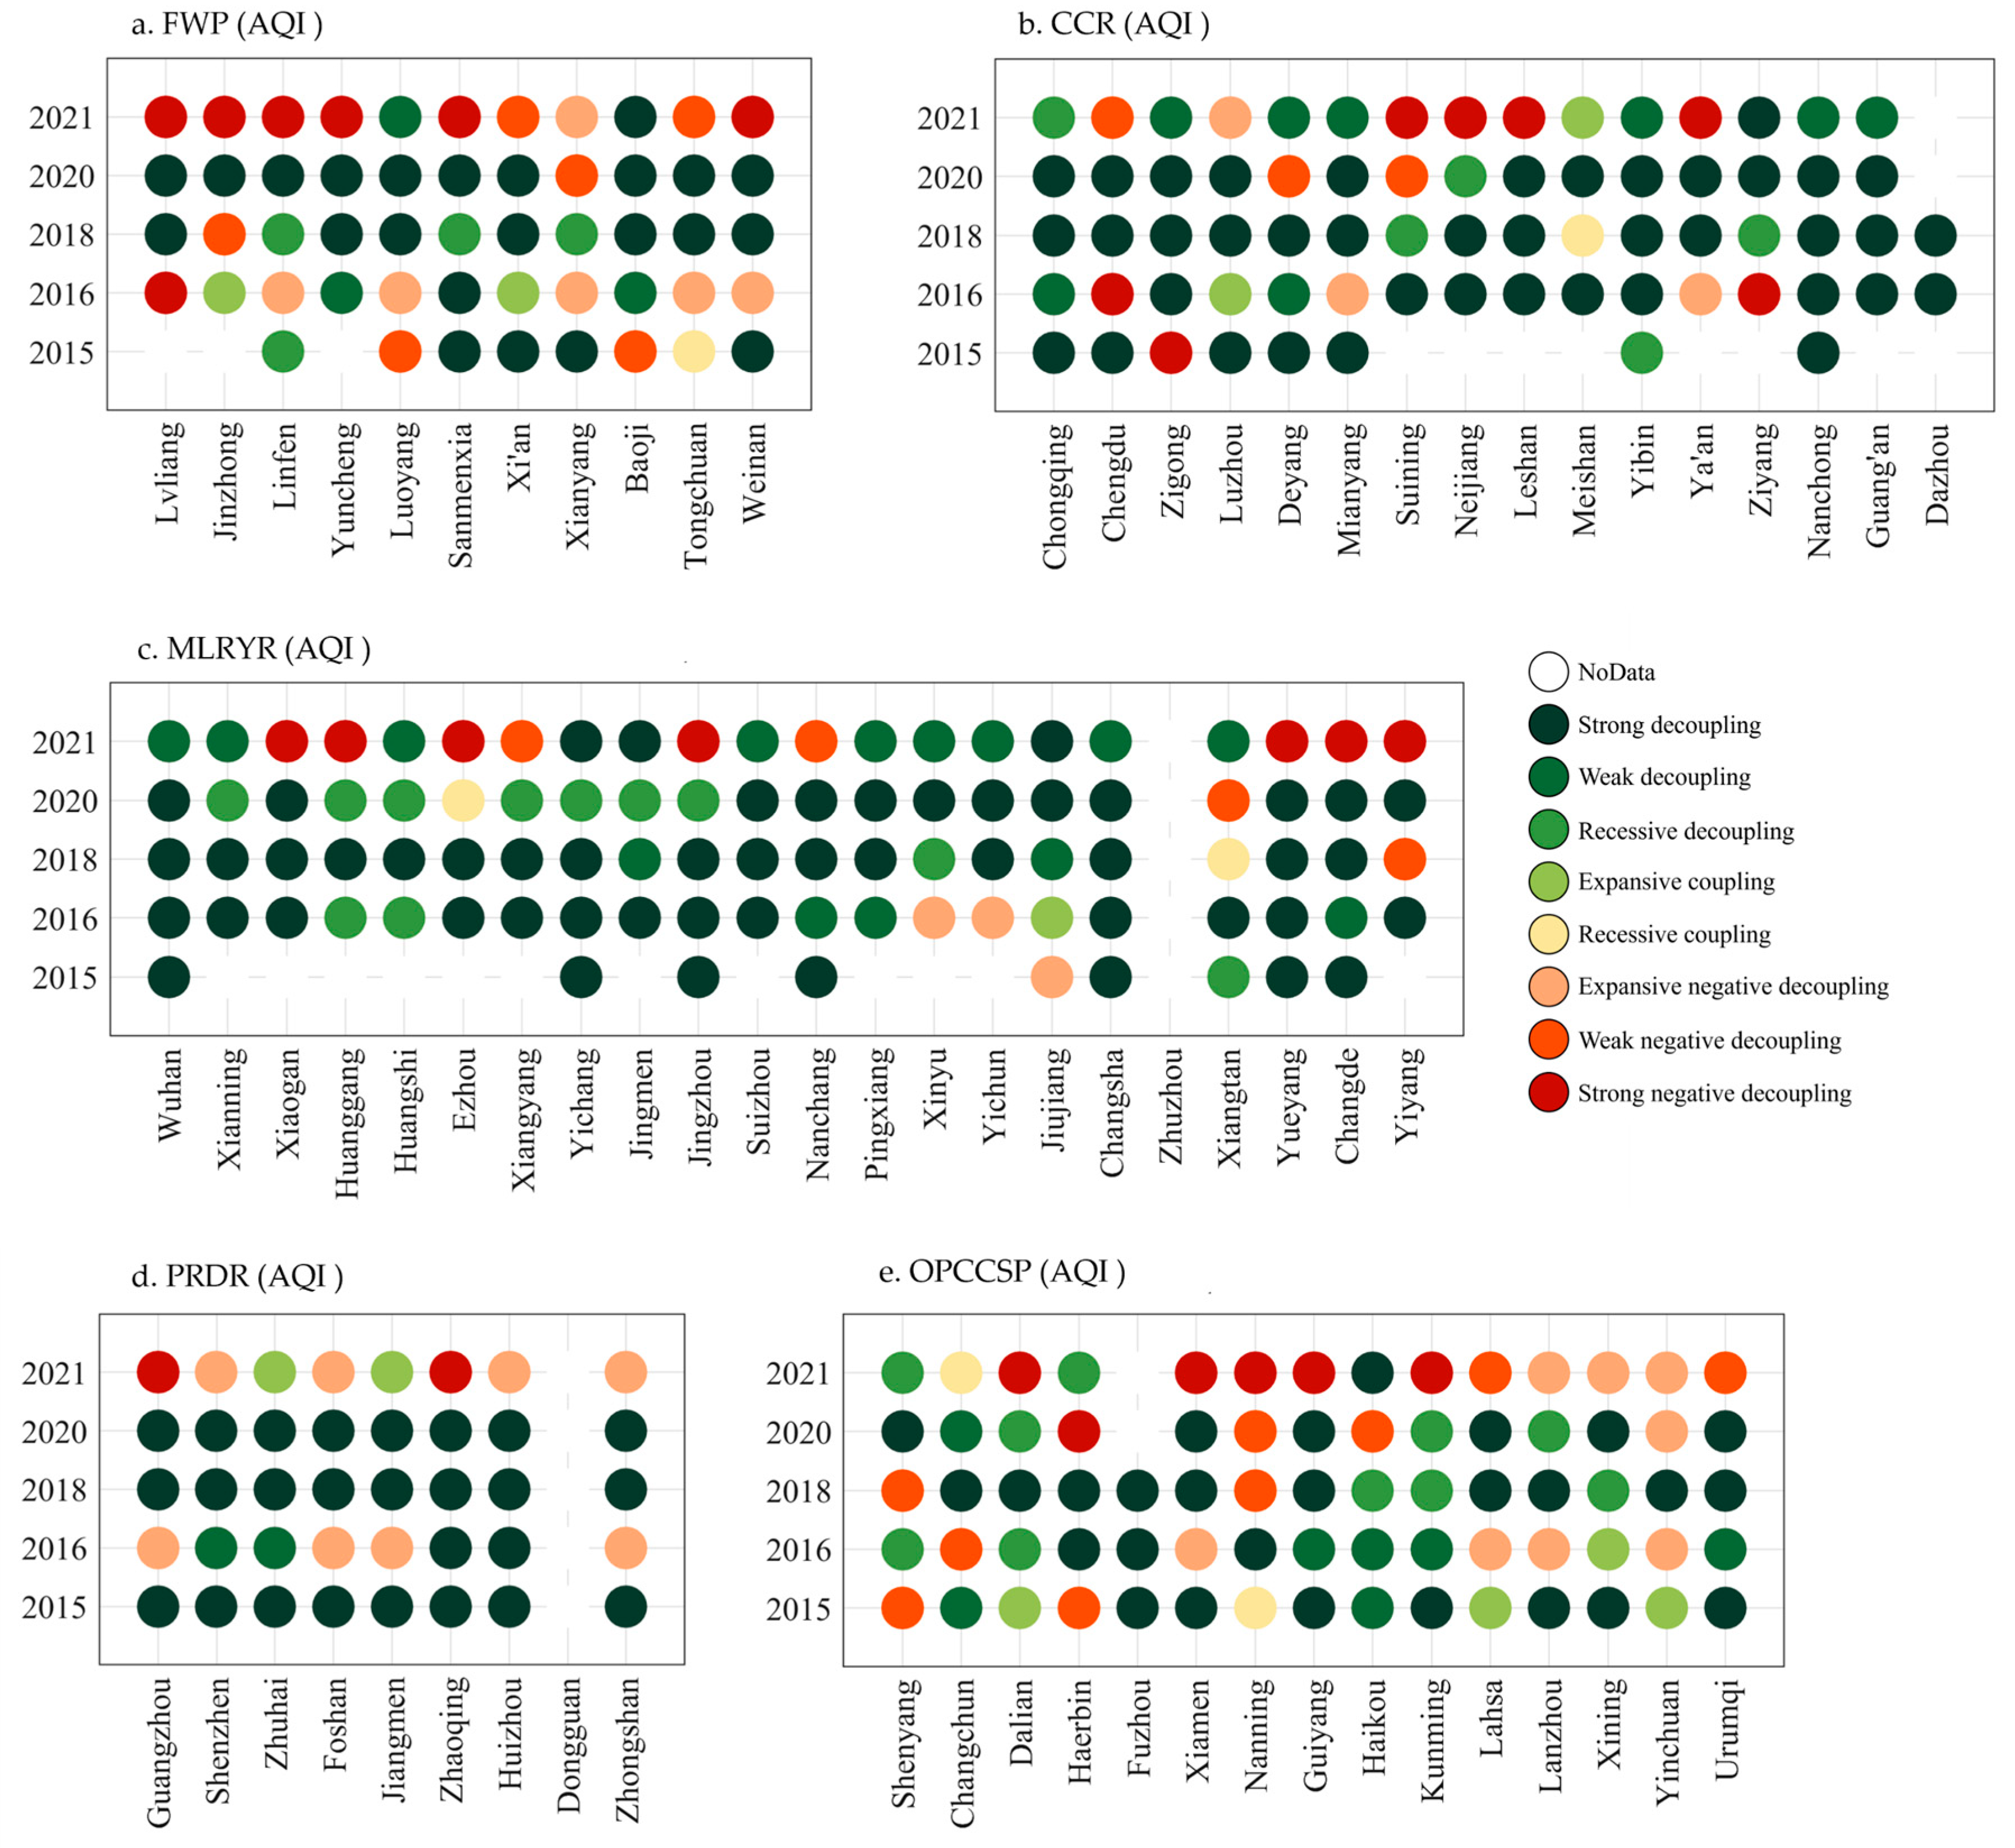
3.2.3. Decoupling of AQI from Socio-Economic Growth in FWP

In 2020, except for Xianyang, other cities in the FWP achieved strong decoupling between the AQI and SEGI (Figure 5a). In 2021, the FWP mainly exhibited negative decoupling, including Lvliang, Jinzhong, Linfen, Yuncheng, Sanmenxia, Xianyang, and Weinan. The AQI values of these cities increased from 2020 to 2021, with the change rate of the SEGI ranging from 0.02 to −0.12. The increase in the AQI values was greater than the SEGI decrease in some cities. Because Lvliang, Jinzhong, Linfen, and Yuncheng in Shanxi Province previously relied on coal mining as the pillar industry, the environment was seriously polluted. Currently, the FWP is breaking the path of resource-based economic dependence, and its industrial restructuring and environmental pollution control still need a long period of steady progress to achieve strong, stable decoupling states between social–economic growth and air pollution.

3.2.4. Decoupling of AQI from Socio-Economic Growth in the CCR

The cities with strong decoupling continued to increase in prevalence from 2015 to 2020. The best decoupling states were in 2018 and 2020, with strong decoupling accounting for 81.3% and 80.0% of the cities, respectively (Figure 5b). However, strong negative decoupling appeared in 2021, including Suining, Neijiang, Leshan, and Ya’an, which are old industrial cities or cities rich in mineral resources. The increase in SEGI, accompanied by a decrease in the AQI index in Chongqing, Nanchong, Yibin, and Guang’an from 2015 to 2021, indicates a relatively steady decoupling state, characterized by strong decoupling, weak decoupling, and recessive decoupling.

3.2.5. Decoupling of AQI from Socio-Economic Growth in the MLRYR

From 2015 to 2018, strong decoupling was the main trend, accounting for 31.8%, 59.1%, and 72.7%, respectively (Figure 5c). In 2020, recessive decoupling increased, while cities such as Huanggang, Xiangyang, and Jingzhou had recessive decoupling in 2020 and transformed into negative decoupling in 2021. The SEGI of these cities decreased, with a SEGI change rate ranging from −0.13 to −0.44 from 2020 to 2021. In addition, Huanggang, Jingzhou, and Xiangyang were mainly developing manufacturing industrial cities, which had a significant impact on the environment. Currently, they are undergoing transformation, and their decoupling states are unstable. In 2021, the weak decoupling state accounted for 42.9%, indicating that socio-economic growth in the MLRYR still relied on resources and threatened the environment. Nevertheless, the degree of dependence and harm was insignificant. In recent years, the MLRYR has been in a stage of catching up with developed coastal areas and narrowing the development gap. The adjustment of the industrial structure has led to the transfer of highly polluting industries to these areas, which often neglect environmental protection while vigorously developing their economy. As provincial capital cities, Wuhan and Changsha have relatively stable decoupling relationships, with strong decoupling as the main focus. This is because the economic development of Wuhan and Changsha has always relied mainly on advanced manufacturing and emerging industries, resulting in low pollution emissions. In recent years, the Changsha government has issued a series of policies to attract talent and high-tech industries, continuously promoting the development of the green economy.

3.2.6. Decoupling of AQI from Socio-Economic Growth in the PRDR

The PRDR has a well-developed economy, with good air quality levels and a relatively stable decoupling status. From 2015 to 2020, the decoupling state of the AQI from the SEGI was mainly strong decoupling (Figure 5d). However, the decoupling state in 2021 was deplorable because there was strong negative decoupling in Guangzhou and Zhaoqing; expansive coupling in Zhuhai and Jiangmen; and expansive negative decoupling in Shenzhen, Foshan, Huizhou, and Zhongshan. The AQI values of these cities increased from 2020 to 2021, and the change rate of SEGI in Guangzhou and Zhaoqing was negative in the rest of cities; the SEGI increased, but the AQI growth rate was higher than the SEGI growth rate.

3.2.7. Decoupling of AQI from Socio-Economic Growth in the OPCCSP

Based on the comprehensive analysis, the trend of decoupling state in the OPCCSP fluctuated up and down in 2015–2021, which was unstable (Figure 5e). Strong decoupling accounted for 37.0%, and weak decoupling accounted for 9.6% of the total decoupling states. In addition, recessive decoupling and coupling accounted for 13.7% and 8.2%. Meanwhile, negative decoupling accounted for 31.5% of all decoupling states. In 2018, the proportion of strong decoupling was the highest, and the decoupling relationship between AQI and social–economic growth was relatively ideal. In 2020 and 2021, the number of strong decoupling cities in OPCSSP decreased, while that of negative decoupling cities increased. Dalian, Xiamen, Nanning, Guiyang, Kunming exhibited especially strong negative decoupling. The AQI values of these cities in OPCCSP increased, while the SEGI slightly decreased from 2020 to 2021, with AQI growth rates ranging from 0.8% to 11.4%. Shenyang, Changchun, and Harbin, as old industrial bases in China, are currently facing the development dilemma of traditional industries declining and emerging industries developing slowly. Lhasa, Lanzhou, Xining, and Yinchuan have relatively small permanent populations and less energy consumption and utilization, but their economic development is lagging behind.

3.3. Decoupling of PM2.5 from Socio-Economic Growth

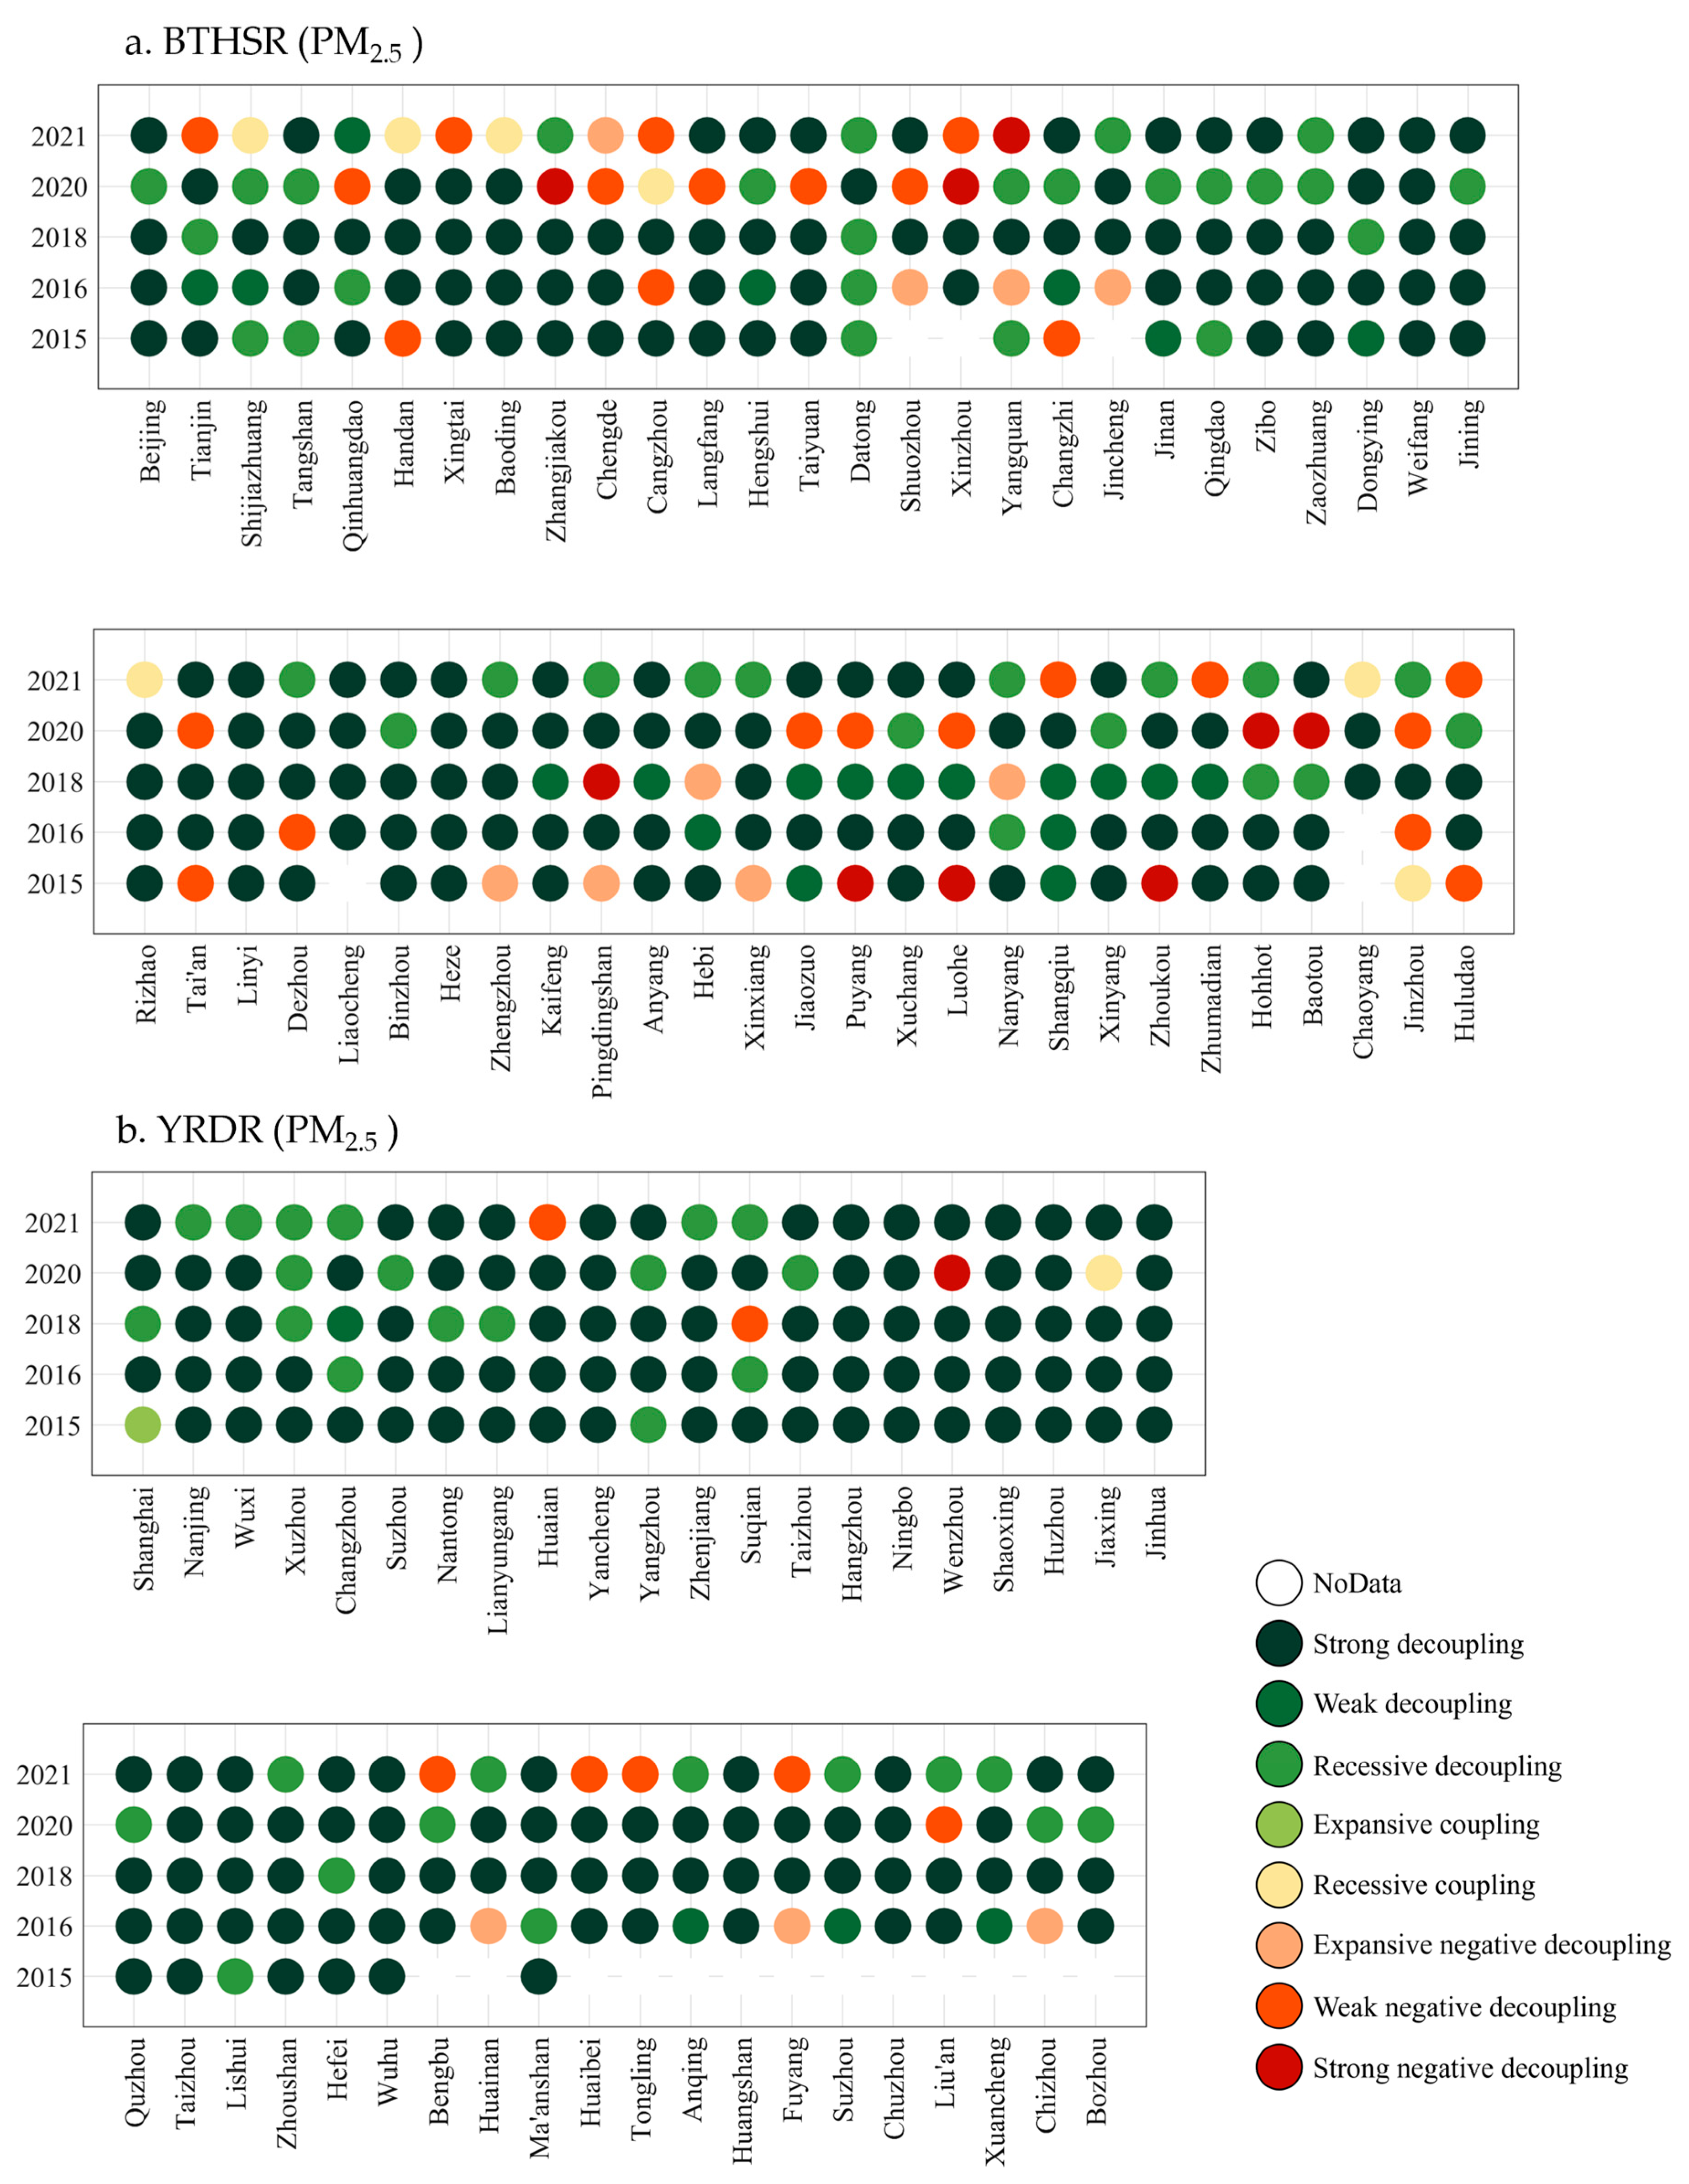
3.3.1. Decoupling of PM2.5 from Socio-Economic Growth in the BTHSR

Overall, the decoupling state between PM2.5 and the SEGI in the BTHSR was mainly strong decoupling (Figure 6a). The phase changes in decoupling states could be roughly divided into two stages: The first stage, from 2015 to 2018, was the overall transition from negative decoupling to weak decoupling and strong decoupling. In 2018, the decoupling relationship between PM2.5 and SEGI in the BTHSR was the most ideal, with 94.4% of cities in a decoupling state. Strong decoupling accounted for 66.7% of the cities, including in Hebei Province, Shandong Province, and Shanxi Province, except for Datong, Zhengzhou, and Xinxiang in Henan Province, and Chaoyang, Jinzhou, and Huludao in Liaoning Province. This indicates that PM2.5 in the BTHSR continued to decrease significantly during this period, presenting an ideal state in which the SEGI increased accompanied by a decrease in PM2.5 concentrations. In the second stage, from 2019 to 2021, there was a phase of transition from strong decoupling and weak decoupling to recessive decoupling and weak negative decoupling, exhibiting a phenomenon of “re-coupling”. In Xingtai, Cangzhou, Xinzhou, Yangquan, and Huludao, the strong decoupling in 2018 shifted to weak negative decoupling. Although a series of governance efforts have achieved significant results since the implementation of the Action Plan for Air Pollution Prevention and Control, PM2.5 concentrations in the BTHSR were still high. After some cities achieved a significant decrease in PM2.5 in 2018, the decline rate of PM2.5 slowed, leading to an unstable decoupling status.

3.3.2. Decoupling of PM2.5 from Socio-Economic Growth in the YRDR

As shown in Figure 6b, the decoupling relationship between PM2.5 and socio-economic growth in the YRDR was relatively stable, showing mainly a strong decoupling state due to the prosperous economy and a high degree of industrial greening. From 2015 to 2021, strong decoupling accounted for 89.3%, 78.0%, 82.9%, 73.2%, and 58.5% of the cities, respectively. Overall, a relatively large proportion of cities with strong decoupling indicates that the YRDR’s socio-economic development was less dependent on the environment, which was an ideal development state. However, the increase in recessive decoupling in 2020 indicates that pollutant emission control was still necessary when developing the economy. In 2021, the decoupling states of Bengbu, Huaibei, Tongling, and Fuyang in Anhui Province shifted to weak negative decoupling. The PM2.5 concentrations of Bengbu, Huaibei, and Fuyang exceeded the Grade II standard from 2015 to 2021, exceeding 7.9%, 19.0%, and 26.0%, respectively, in 2021. Huaibei and Tongling are typical resource-based cities, and their economic development mainly relies on highly energy-consuming heavy industry, which leads to serious environmental pollution. Hangzhou, Ningbo, Shaoxing, Huzhou, Jinhua, and Taizhou in Zhejiang Province have continuously decreased and maintained low concentrations of PM2.5 from 2015 to 2021; they maintained a strong, stable decoupling state, making them ideal cities for decoupling in the YRDR.

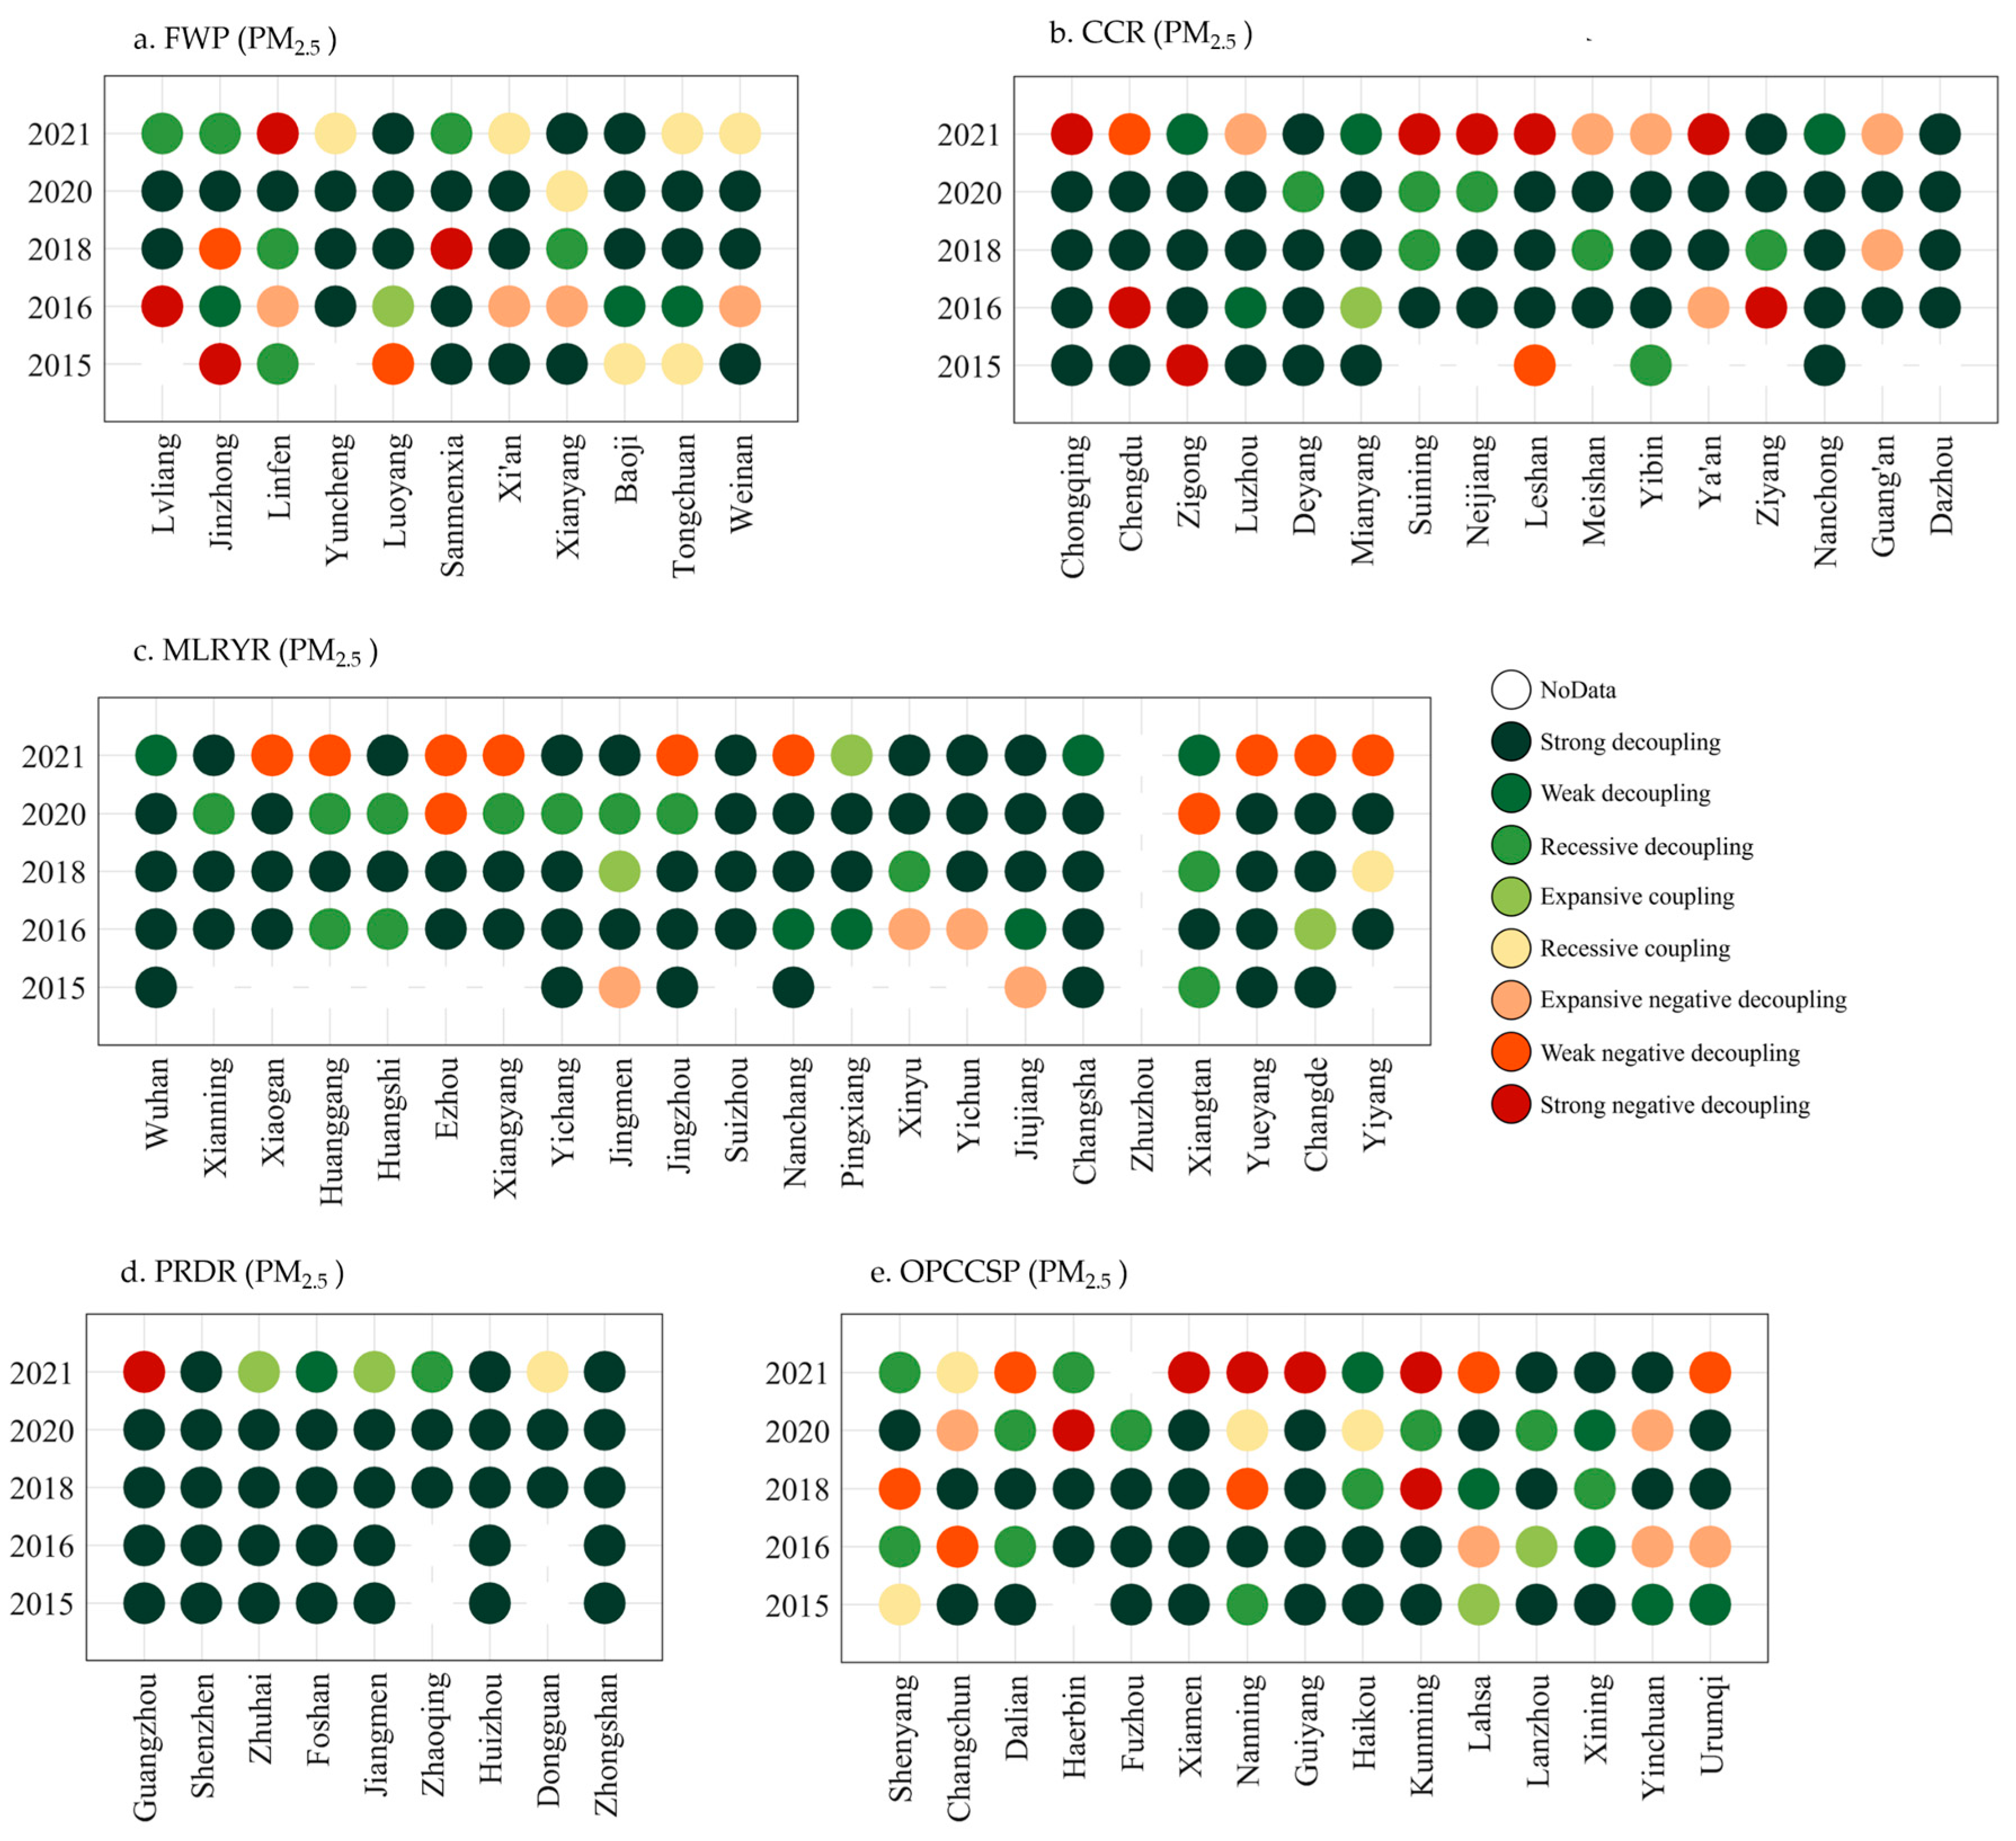
3.3.3. Decoupling of PM2.5 from Socio-Economic Growth in the FWP

The decoupling states of the FWP were unstable, with all cities except Xianyang achieving strong decoupling in 2020 (Figure 7a), while in 2021, the decoupling relationship deteriorated. Lvliang, Jinzhong, and Sanmenxia recessively decoupled, while Yuncheng, Xi’an, Tongchuan, and Weinan recessively coupled. Luoyang, Xianyang, and Baoji had strong decoupling, and Linfen had strong negative decoupling. As a typical coal resource city, Linfen has severe air pollution, and the PM2.5 concentration exceeded the Grade II standard for many consecutive years. From 2013 to 2022, although the PM2.5 concentration in the FWP decreased, it still exceeded the Grade II standard for several consecutive years (Figure 2b). In 2022, the concentration of PM2.5 in the FWP was 31.4% higher than the Grade II standard. The industrial structure in the FWP was still biased, with coal accounting for nearly 80% of energy consumption [57]. Since 2018, the FWP has been listed as one of the key areas for air pollution prevention and control in China [58]. To date, the industrial structure dominated by the heavy chemical industry, the energy structure dominated by coal, and the transportation structure dominated by road freight have not been fundamentally changed [59,60]. The total amount of pollutant emissions was high. In addition, the terrain conditions were not conducive to the diffusion of pollutants [61], and air pollution prevention and control was still severe. Therefore, the decoupling status of FWP was unstable and poor.

3.3.4. Decoupling of PM2.5 from Socio-Economic Growth in the CCR

The CCR is in the southwest of China, and it has a large number of automobiles and developed industries. The current type of pollution is mainly manifested as fine particulate matter pollution [62]. Overall, the decoupling states in the CCR from 2015 to 2020 were mainly strong decoupling and recessive decoupling, while Dazhou was in a strong decoupling state from 2015 to 2021 (Figure 7b). In 2020, the decoupling states in the CCR were the best, with all cities except Deyang, Suining, and Neijiang achieving strong decoupling. In 2021, Chongqing, Chengdu, Suining, Neijiang, Leshan, and Ya’an converted to negative decoupling, mainly due to the excessive PM2.5 concentration in the CCR in 2021. Further, the PM2.5 concentration of Chongqing, Suining, Neijiang, and Leshan experienced a counter increase from 2020 to 2021. Moreover, the SEGI decreased in Leshan and Neijiang, with change rates of −0.21 and −0.27, respectively.

3.3.5. Decoupling of PM2.5 from Socio-Economic Growth in the MLRYR

Both the MLRYR and YRDR are part of the Yangtze River Economic Belt. From 2015 to 2018, the prevalence of strong decoupling cities gradually increased, especially in 2018, where strong decoupling cities accounted for 81.0% (Figure 7c). During this period, social–economic growth was accompanied by a decrease in PM2.5 concentrations. In 2021, the decoupling state worsened, and there was an increase in weak negative decoupling cities, mainly in Xiaogan, Huanggang, Ezhou, Xiangyang, and Jingzhou in Hubei Province; Nanchang in Jiangxi Province; and Yueyang, Changde, and Yiyang in Hunan Province, because the SEGI of these cities decreased, with the SEGI index ranging from −0.10 to −0.46. Although PM2.5 concentrations also decreased, the rate of SEGI decline was greater than that of PM2.5 decline. Wuhan and Changsha, as the provincial capitals of Hubei and Hunan Province, with their rapid economic development and low dependence on the environment, maintaining strong decoupling states of socio-economic growth from PM2.5 pollution, exhibited a more optimal state of decoupling.

3.3.6. Decoupling of PM2.5 from Socio-Economic Growth in the PRDR

PRDR is one of China’s most densely populated, highly innovative, and economically powerful urban agglomerations [63]. Since 2015, PM2.5 in the PRDR has continuously been below the Grade II standard; so, from 2015 to 2020, the decoupling states between PM2.5 and the SEGI in the PRDR remained stable at strong decoupling (Figure 7d). Although there were some changes in the decoupling relationship in 2021, it did not have an overall impact. Among them, Guangzhou had strong negative decoupling in 2021, with a PM2.5 change rate of 0.03 and a SEGI change rate of −0.09, indicating a slight increase in PM2.5.

3.3.7. Decoupling of PM2.5 from Socio-Economic Growth in the OPCCSP

The decoupling states of the OPCCSP were relatively unstable compared to other regions. Its cities are scattered and distributed in the northeast, south, and northwest regions of China, with significant differences in urban development. Shenyang, Changchun, Dalian, and Harbin are traditional heavily industrial cities in the northeast. Although PM2.5 concentrations have continuously decreased in recent years, socio-economic development is still associated with the environment; so, the decoupling states are unstable. Dalian notably exhibited weak negative decoupling in 2021 (Figure 7e) as the rate of decrease in SEGI was greater than that of the decrease in PM2.5 concentrations. The PM2.5 concentrations in Fuzhou, Xiamen, Nanning, Guiyang, Haikou, and Kunming in the southern region were well controlled and below the Grade II standard for many years. However, it is difficult to continue to reduce the PM2.5 concentrations. In addition, there was a slight increase from 2020 to 2021; so, Xiamen, Nanning, Guiyang, and Kunming had strong negative decoupling in 2021. From 2015 to 2021, Lhasa, Lanzhou, Xining, Yinchuan, and Urumqi in the northwest mainly had strong and weak decoupling, accounting for 62.9% of the total. Overall, there was a good decoupling relationship between PM2.5 and socio-economic growth in Fuzhou and Xining. Fuzhou has superior climate conditions and excellent air quality, and the light industry is the main industrial structure. At the same time, Xining utilizes its advantageous resources to develop clean energy, such as photovoltaic manufacturing, without high emissions and pollution.

3.4. Decoupling Analysis

Strong decoupling is optimal for socio-economic growth and air pollution. Therefore, the proportion of the total number of cities with strong decoupling was calculated to compare the decoupling states of the seven regions (Table 3). The region with the best decoupling states of PM2.5 from the SEGI was the PRDR, with strong decoupling accounting for 85.37% of the cities, followed by the YRDR, CCR, MLRYR, BTHSR, FWP, and OPCCSP. The proportions in these regions were 75.52%, 61.6%, 60.6%, 57.96%, 49.1%, and 45.21%, respectively. The decoupling relationship between the AQI and SEGI was slightly different from that between PM2.5 and the SEGI. The optimal region of decoupling between the AQI and SEGI was the YRDR, with strong decoupling accounting for 67.57% of the cities, followed by the PRDR, CCR, BTHSR, MLRYR, FWP, and OPCCSP, accounting for 65.00%, 58.57%, 55.04%, 54.84%, 44.23%, and 36.99%, respectively.
Based on the above analysis, the seven key regions can be characterized as follows: the BTHSR features regions with a concentration of heavy industries; the YRDR features an economically developed, densely populated region; the MLRYR features a region with vigorously developing economy and adjusting industrial structure; the FWP features a coal-resource-dependent region; the CCR features a new industrialized and well-developed transportation region; the OPCCSP features dispersed cities with an imbalanced development region; and the PRDR features an economically developed region with better air pollution control. The decoupling of PM2.5 from the SEGI and the decoupling of the AQI from the SEGI showed that China’s seven key regions had spatial differences and certain synergies from 2015 to 2021. The regions with the best decoupling states were the YRDR and PRDR, while the worst were the FWP and OPCCSP. The YRDR and PRDR have experienced rapid economic development, but they have strengthened the control of pollutants and achieved significant results in atmospheric governance meanwhile. The FWP was included in the key area of the Three-Year Action Plan to Fight Air Pollution by the Ministry of Ecology and Environment Protection in 2018, becoming a key area for air pollution prevention and control in China. Due to the dense industrial layout and low equipment level in the FWP, the energy structure is mainly coal. Meanwhile, the transportation structure still primarily relies on road transport, and air pollution dominated by PM2.5 was relatively severe. The cities in the OPCCSP, however, are relatively scattered, with significant differences in development between cities, including traditional heavy-industry cities such as Shenyang and Harbin, where economic development relies heavily on the environment.
The correlations between PM2.5 concentration/AQI values and socio-economic growth indicators were examined using Pearson’s correlation analysis in the statistical analysis software SPSS27.0 and by then assessing the influence on the decoupling level. The correlation results indicated that the AQI values were significantly positively correlated to the energy consumption of large-scale enterprises (ES2), urbanization (UD2), percentage of GDP of the added value of secondary industry (EG9) and industrial output value (EG5). However, there was negative correlation between per capita GDP (UD4) and AQI value. There was a significant positive correlation among urbanization (UD2), raw coal consumption of scale-enterprises (ES3) and the added value of second industry (EG3) with PM2.5 concentrations. Therefore, these correlation relationships indicate that industrial structure, energy consumption, and urbanization are the main three factors affecting the decoupling between socio-economic growth and air pollution. (See Table 4 and Table 5).
In fact, urbanization was usually accompanied by industrialization, urban population expansion and the rapid growth of energy consumption demand, which hampered the decoupling between air pollution and socio-economic growth in the seven key regions of China [64]. The decoupling states of the BTHSR were significantly correlated to urbanization, urban population, and energy consumption. The secondary industry included mining, manufacturing, and heating industries, which were dominated by highly polluting enterprises. The impact of industrial structure on decoupling was also reinforced by the study of Wu et al., and Yuan et al. [65,66], which indicated that optimizing industrial structure can improve environmental quality and promote decoupling. Thus, the heavy-industry-dominated industrial structure has made the FWP the most polluted region in China, resulting in poor decoupling status. The negative correlation between per capita GDP and AQI indicated that the air quality improved to a certain extent as the economy developed, which was consist with the studies of Zhao et al. and Zhu et al. [67,68]. Energy consumption, especially energy-intensive industries such as electric power production, petroleum processing, coking, chemical and metal smelting and rolling, had a significant positive correlation with air pollution. In fact, energy structure was one of the most significant factors affecting the level of decoupling between socio-economic growth and air pollution, which were confirmed by the findings of Luo et al. and Lei and Xu [25,69], who suggested that it was urgent to transform the energy structure to achieve coordinated development of the socio-economic development and environment.

4. Discussion

There is an inseparable relationship between socio-economic growth and air pollution levels in key regions of China. Socio-economic growth has driven the improvement in air pollution levels, and the change in air pollution levels could also affect the sustainable development of social economy. Therefore, research on the decoupling relationship between air pollution and socio-economic growth played crucial roles in the enrichment of air pollution decoupling theory and sustainable development of social economy in China.
The spatiotemporal variation characteristics of PM2.5 concentrations and AQI values were analyzed to investigate air pollution trends in seven key regions of China, which could provide decision-making reference for air pollution prevention and control in China. China’s air quality has greatly improved since the AQI values and PM2.5 concentrations decreased dramatically in seven key regions of China. However, the AQI values of BTHSR and FWP remained significantly higher than those in other regions, and PM2.5 concentrations were still higher than the Grade II standards. Rapid urbanization, high-energy-consumption lifestyles, and an industrial structure dominated by heavy industry jointly determine the air quality in the BTHSR, while the coal-dominated energy structure contributes to air pollution in the FWP, which is supported by the findings of Xiao et al. and Zhu et al. [61,70]. The upgrading of industrial structure and the optimization of the energy consumption structure were the two main reasons for the improvement in air pollution in YRDR and MLRYR in China. Industrialization and meteorological conditions were important causes of air pollution in CCR and OPCCSP, respectively. Although the AQI values and PM2.5 concentrations in PRDR were relatively lower, the need for clean industries and low-energy lifestyles remains a pressing concern. All that was discussed above could provide a reference for government departments to formulate and implement more pertinent environmental governance policies for improvements in governance effectiveness.
Clarifying the decoupling relationship between air pollution and socio-economic growth in seven key regions of China could benefit the prevention and treatment of air pollution and the sustainable development of the social economy. The analysis results indicate that the decoupling relationship between socio-economic growth and air pollution in the seven key regions of China was gradually developing towards strong decoupling. However, China’s economic development is currently in a critical period of transforming its development mode; thus, the decoupling relationship in seven regions was unstable and still changing. Especially after 2020, the strong decoupling states have decreased given the slight increase in PM2.5 concentration and AQI index in seven regions (Figure 2), resulting in an increase in weak decoupling and negative decoupling states. This supports the existing research on the ‘decoupling trap’ by Zhao et al. [71] and Zhu et al. [72], who proposed that relying on endogenous drivers such as industrial structure upgrades was the ideal way to achieve a positive and stable decoupling of air pollution and socio-economic growth. In contrast, relying solely on external factors such as policy-driven measures can lead to volatility in the decoupling state. Air pollution control policies may struggle to sustain a continuous decrease in pollutants, resulting in a dynamic decoupling state where ‘decoupling–recoupling’ phenomena alternate, thus falling into the ‘decoupling trap’.
The differences in the decoupling relationship between socio-economic growth and air pollution were observed in seven key regions of China. The PRDR and YRDR had better decoupling states compared to other regions, while the FWP and OPCCSP had relatively poorer decoupling states. All of these were closely related to the level of regional economic development and environmental governance capacity. Analyzing the decoupling relationship between socio-economic growth and air pollution at the national level provided a theoretical basis for differentiated air pollution control measures and targets. It offered new ideas for government departments to formulate high-quality and efficient development strategies and policy implementation. Furthermore, controlling the root of decoupling played crucial roles in achieving beneficial decoupling in these key regions. Firstly, controlling urban population accumulation, upgrading and transforming the industrial structure, and transforming living energy consumption patterns played crucial roles in achieving complete decoupling in the BTHSR and FWP. Secondly, the optimization and upgrading of industrial structure, as well as the change in energy consumption structure, were the critical ways for the YRDR, MLRYR, and OPCCSP to achieve complete decoupling. Thirdly, energy conservation and emission reduction were the premise and foundation for all regions to achieve complete decoupling in China. Other countries have different policies and measures to promote the decoupling of socio-economic development and air pollution. Romania and Thailand have suggested learning from China’s energy-saving and emission reduction technologies, including electric vehicles and high-speed trains [73]. In contrast, economically developed countries like the United States emphasized that government intervention policies could promote decoupling through pollution reduction technologies [74].

5. Conclusions and Policies

5.1. Conclusions

This study analyzed the spatiotemporal evolution characteristics of AQI values and PM2.5 concentrations from 2014 to 2022 in seven key regions in China. Then, the decoupling relationship between the AQI and PM2.5 from the socio-economic growth index (SEGI) in these regions was deeply researched by the Tapio decoupling model. The following conclusions and suggestions were drawn:
(1)
Although continuous improvement in air quality was observed in the seven key regions in China, the PM2.5 concentrations were still higher than the health standard values of the World Health Organization (5 μg·m−3), with annual contents of 19.37–46.64 μg·m−3. More worthy of attention is that PM2.5 concentration was still higher than 35 μg·m−3 in Beijing–Tianjin–Hebei and its surrounding areas and the Fen-Wei Plain. The AQI showed a spatial pattern of higher in the north and lower in the south, and the distribution of PM2.5 was characterized by higher in the east and lower in the west. Both the intensity and spatial extent of pollution were significantly reduced. However, the decrease in PM2.5 concentration is still a heavy burden.
(2)
The decoupling relationship differed between the seven regions. The degree of decoupling between air pollution and socio-economic growth was relatively high in the Pearl River Delta and Yangtze River Delta regions. In contrast, the degree of decoupling was poor in the Fen-Wei Plain and other provincial capitals and municipalities with specialized plan regions. The decoupling states were primarily influenced by industrial structure, energy consumption, and urbanization.
(3)
Overall, the decoupling of air pollution from socio-economic growth in the seven key regions was in a strong decoupling state for most of the research period, achieving a relatively ideal decoupling state in 2018. However, the overall decoupling states of the seven regions were not sustainable, and the decoupling stability was relatively poor. The relationship between air pollution and socio-economic growth during the research period changed and did not reach a stable state. China must intensify its efforts in air pollution prevention and control to reduce the PM2.5 concentration and the AQI index, and achieve sustainable development.

5.2. Policies and Limitations

When comparing different regions, industrial structure optimization plays a crucial role in regional economic growth and sustainable environmental development. The government can facilitate this by promoting the low-carbon transformation of traditional industries and fostering the development of a new green and low-carbon economy, as well as by expanding the proportion of the tertiary sector, leveraging its potential and benefits, and fostering coordinated industrial growth through policy support and guidance.
It is crucial to transform the energy structure to achieve air pollution control and sustainable development. This transformation can be accomplished by promoting the development and utilization of clean energy sources, such as solar, wind, and hydropower. Additionally, developing energy-saving technologies to reduce coal consumption in high-energy-consuming industries, such as electricity production and petroleum processing, is essential.
This study analyzed the decoupling relationship between air pollution and socio-economic growth in seven key regions of China from 2014 to 2022. However, due to multiple factors such as data availability, longer time scales could not be explored. It is recommended that further studies expand the time series to obtain more comprehensive results.

Author Contributions

Conceptualization, M.W. and X.C.; methodology, M.W.; formal analysis, M.W. and X.C.; investigation, M.W.; data curation, M.W. and X.C.; writing—original draft preparation, M.W.; writing—review and editing, M.W., X.C., Y.L., J.H. and C.Z.; supervision, X.C.; funding acquisition, X.C. All authors have read and agreed to the published version of the manuscript.

Funding

This research was funded by the Humanities and Social Sciences Project of the Ministry of Education (21YJCZH016).

Institutional Review Board Statement

Not applicable.

Informed Consent Statement

Not applicable.

Data Availability Statement

The data presented in this study are openly available in the Ministry of Ecology and Environment of the People’s Republic of China at https://www.mee.gov.cn/.

Conflicts of Interest

The authors declare no conflicts of interest.

References

  1. Li, G.; Fang, C.; Wang, S.; Sun, S. The effect of economic growth, urbanization, and industrialization on fine particulate matter (PM2.5) concentrations in china. Environ. Sci. Technol. 2016, 50, 11452–11459. [Google Scholar] [CrossRef] [PubMed]
  2. Ministry of Ecology and Environmentthe People’s Republic of China. Report on the State of the Environment in China 2014. Available online: http://english.mee.gov.cn/Resources/Reports/ (accessed on 31 July 2024).
  3. Shaddick, G.; Thomas, M.L.; Mudu, P.; Ruggeri, G.; Gumy, S. Half the world’s population are exposed to increasing air pollution. NPJ Clim. Atmos. Sci. 2020, 3, 23. [Google Scholar] [CrossRef]
  4. Sierra-Vargas, M.P.; Teran, L.M. Air pollution: Impact and prevention. Respirology 2012, 17, 1031–1038. [Google Scholar] [CrossRef]
  5. Feng, J.; Cavallero, S.; Hsiai, T.; Li, R. Impact of air pollution on intestinal redox lipidome and microbiome. Free Radic. Biol. Med. 2020, 151, 99–110. [Google Scholar] [CrossRef]
  6. Buoli, M.; Grassi, S.; Caldiroli, A.; Carnevali, G.S.; Mucci, F.; Iodice, S.; Cantone, L.; Pergoli, L.; Bollati, V. Is there a link between air pollution and mental disorders? Environ. Int. 2018, 118, 154–168. [Google Scholar] [CrossRef]
  7. Fajersztajn, L.; Veras, M.; Barrozo, L.V.; Saldiva, P. Air pollution: A potentially modifiable risk factor for lung cancer. Nat. Rev. Cancer 2013, 13, 674–678. [Google Scholar] [CrossRef]
  8. Ambrey, C.L.; Fleming, C.M.; Chan, A.Y.-C. Estimating the cost of air pollution in south east queensland: An application of the life satisfaction non-market valuation approach. Ecol. Econ. 2014, 97, 172–181. [Google Scholar] [CrossRef]
  9. Yuan, L.; Shin, K.; Managi, S. Subjective well-being and environmental quality: The impact of air pollution and green coverage in china. Ecol. Econ. 2018, 153, 124–138. [Google Scholar] [CrossRef]
  10. Shao, M.; Wang, W.; Yuan, B.; Parrish, D.D.; Li, X.; Lu, K.; Wu, L.; Wang, X.; Mo, Z.; Yang, S.; et al. Quantifying the role of PM2.5 dropping in variations of ground-level ozone: Inter-comparison between beijing and los angeles. Sci. Total Environ. 2021, 788, 147712. [Google Scholar] [CrossRef]
  11. Furie, G.L.; Balbus, J. Global environmental health and sustainable development: The role at rio+20. Cien Saude Colet. 2012, 17, 1427–1432. [Google Scholar] [CrossRef]
  12. Balwinder, S.; McDonald, A.J.; Srivastava, A.K.; Gerard, B. Tradeoffs between groundwater conservation and air pollution from agricultural fires in northwest india (vol 2, pg 580, 2019). Nat. Sustain. 2020, 3, 972. [Google Scholar] [CrossRef]
  13. Fenech, S.; Doherty, R.M.; O’connor, F.M.; Heaviside, C.; Macintyre, H.L.; Vardoulakis, S.; Agnew, P.; Neal, L.S. Future air pollution related health burdens associated with rcp emission changes in the uk. Sci. Total Environ. 2021, 773, 145635. [Google Scholar] [CrossRef] [PubMed]
  14. Burnett, R.; Chen, H.; Szyszkowicz, M.; Fann, N.; Hubbell, B.; Pope, C.A.; Apte, J.S.; Brauer, M.; Cohen, A.; Weichenthal, S.; et al. Global estimates of mortality associated with long-term exposure to outdoor fine particulate matter. Proc. Natl. Acad. Sci. USA 2018, 115, 9592–9597. [Google Scholar] [CrossRef]
  15. Ali, S.H.; Puppim de Oliveira, J.A. Pollution and economic development: An empirical research review. Environ. Res. Lett. 2018, 13, 123003. [Google Scholar] [CrossRef]
  16. Xie, Q.; Xu, X.; Liu, X. Is there an ekc between economic growth and smog pollution in china? New evidence from semiparametric spatial autoregressive models. J. Clean. Prod. 2019, 220, 873–883. [Google Scholar] [CrossRef]
  17. Li, Z.; Song, Y.; Zhou, A.; Liu, J.; Pang, J.; Zhang, M. Study on the pollution emission efficiency of china’s provincial regions: The perspective of environmental kuznets curve. J. Clean. Prod. 2020, 263, 121497. [Google Scholar] [CrossRef]
  18. Jiang, S.; Tan, X.; Hu, P.; Wang, Y.; Shi, L.; Ma, Z.; Lu, G. Air pollution and economic growth under local government competition: Evidence from china, 2007–2016. J. Clean. Prod. 2022, 334, 130231. [Google Scholar] [CrossRef]
  19. Wang, L.; Wang, H.; Dong, Z.; Wang, S.; Cao, Z. The air pollution effect of government economic growth expectations: Evidence from china’s cities based on green technology. Environ. Sci. Pollut. Res. 2021, 28, 27639–27654. [Google Scholar] [CrossRef]
  20. OECD. Indicators to Measure Decoupling of Environmental Pressure from Economic Growth. 2002. Available online: https://one.oecd.org/document/SG/SD(2002)1/FINAL/en/pdf (accessed on 10 September 2023).
  21. Juknys, R. Transition period in lithuania-do we move to sustainability. Energy 2003, 4, 4–9. [Google Scholar]
  22. Tapio, P. Towards a theory of decoupling: Degrees of decoupling in the eu and the case of road traffic in finland between 1970 and 2001. Transp. Policy 2005, 12, 137–151. [Google Scholar] [CrossRef]
  23. Conrad, E.; Cassar, L.F. Decoupling economic growth and environmental degradation: Reviewing progress to date in the small island state of malta. Sustainability 2014, 6, 6729–6750. [Google Scholar] [CrossRef]
  24. Sanye-Mengual, E.; Secchi, M.; Corrado, S.; Beylot, A.; Sala, S. Assessing the decoupling of economic growth from environmental impacts in the european union: A consumption-based approach. J. Clean. Prod. 2019, 236, 117535. [Google Scholar] [CrossRef]
  25. Luo, H.; Li, L.; Lei, Y.; Wu, S.; Yan, D.; Fu, X.; Luo, X.; Wu, L. Decoupling analysis between economic growth and resources environment in central plains urban agglomeration. Sci. Total Environ. 2021, 752, 142284. [Google Scholar] [CrossRef]
  26. Zhou, X.; Zhang, M.; Zhou, M.; Zhou, M. A comparative study on decoupling relationship and influence factors between china’s regional economic development and industrial energy-related carbon emissions. J. Clean. Prod. 2017, 142, 783–800. [Google Scholar] [CrossRef]
  27. Zhang, X.; Geng, Y.; Shao, S.; Song, X.; Fan, M.; Yang, L.; Song, J. Decoupling PM2.5 emissions and economic growth in china over 1998–2016: A regional investment perspective. Sci Total Environ. 2020, 714, 136841. [Google Scholar] [CrossRef] [PubMed]
  28. Raza, M.Y.; Lin, B. Decoupling and mitigation potential analysis of CO2 emissions from pakistan’s transport sector. Sci. Total Environ. 2020, 730, 139000. [Google Scholar] [CrossRef]
  29. Oliveira, R.P.; Oliveira, A.V.M.; Lohmann, G.; Bettini, H. The geographic concentrations of air traffic and economic development: A spatiotemporal analysis of their association and decoupling in brazil. J. Transp. Geogr. 2020, 87, 102792. [Google Scholar] [CrossRef] [PubMed]
  30. de Freitas, L.C.; Kaneko, S. Decomposing the decoupling of CO2 emissions and economic growth in brazil. Ecol. Econ. 2011, 70, 1459–1469. [Google Scholar] [CrossRef]
  31. Zhang, Z.; Hu, B.; Shi, K.; Su, K.; Yang, Q. Exploring the dynamic, forecast and decoupling effect of land natural capital utilization in the hinterland of the three gorges reservoir area, china. Sci. Total Environ. 2020, 718, 134832. [Google Scholar] [CrossRef]
  32. Li, Y.-N.; Cai, M.; Wu, K.; Wei, J. Decoupling analysis of carbon emission from construction land in shanghai. J. Clean. Prod. 2019, 210, 25–34. [Google Scholar] [CrossRef]
  33. Wei, Z.Q.; Wei, K.K.; Liu, J.C.; Zhou, Y.Z. The relationship between agricultural and animal husbandry economic development and carbon emissions in henan province, the analysis of factors affecting carbon emissions, and carbon emissions prediction. Mar. Pollut. Bull. 2023, 193, 115134. [Google Scholar] [CrossRef]
  34. Hu, J.X.; Chi, L.; Xing, L.W.; Meng, H.; Zhu, M.S.; Zhang, J.; Wu, J.Z. Decomposing the decoupling relationship between energy consumption and economic growth in china’s agricultural sector. Sci. Total Environ. 2023, 873, 162323. [Google Scholar] [CrossRef] [PubMed]
  35. Engo, J. Decomposing the decoupling of CO2 emissions from economic growth in cameroon. Environ. Sci. Pollut. Res. 2018, 25, 35451–35463. [Google Scholar] [CrossRef] [PubMed]
  36. Roinioti, A.; Koroneos, C. The decomposition of CO2 emissions from energy use in greece before and during the economic crisis and their decoupling from economic growth. Renew. Sustain. Energy Rev. 2017, 76, 448–459. [Google Scholar] [CrossRef]
  37. Liang, S.; Liu, Z.; Crawford-Brown, D.; Wang, Y.F.; Xu, M. Decoupling analysis and socioeconomic drivers of environmental pressure in china. Environ. Sci. Technol. 2014, 48, 1103–1113. [Google Scholar] [CrossRef] [PubMed]
  38. Yuan, L.; Li, R.; Wu, X.; He, W.; Kong, Y.; Ramsey, T.S.; Degefu, D.M. Decoupling of economic growth and resources-environmental pressure in the yangtze river economic belt, china. Ecol. Indic. 2023, 153, 110399. [Google Scholar] [CrossRef]
  39. Zhang, Y.Y.; Sun, M.Y.; Yang, R.J.; Li, X.H.; Zhang, L.; Li, M.Y. Decoupling water environment pressures from economic growth in the yangtze river economic belt, china. Ecol. Indic. 2021, 122, 107314. [Google Scholar] [CrossRef]
  40. Wang, X.; Lu, C.; Cao, Y.; Chen, L.; Abedin, M.Z. Decomposition, decoupling, and future trends of environmental effects in the beijing-tianjin-hebei region: A regional heterogeneity-based analysis. J. Environ. Manag. 2023, 331, 117124. [Google Scholar] [CrossRef]
  41. Dong, J.; Li, C. Scenario prediction and decoupling analysis of carbon emission in jiangsu province, china. Technol. Forecast. Soc. Change 2022, 185, 122074. [Google Scholar] [CrossRef]
  42. Ji, S.; Lv, W.; Meng, L.; Yang, X.; Yang, H.; Chuan, Y.; Chen, H.; Hayat, T.; Alsaedi, A.; Ahmad, B. Decoupling environmental pressures from economic growth based on emissions monetization: Case in yunnan, china. J. Clean. Prod. 2019, 208, 1563–1576. [Google Scholar] [CrossRef]
  43. Yu, Y.; Zhou, L.; Zhou, W.; Ren, H.; Kharrazi, A.; Ma, T.; Zhu, B. Decoupling environmental pressure from economic growth on city level: The case study of chongqing in china. Ecol. Indic. 2017, 75, 27–35. [Google Scholar] [CrossRef]
  44. Chang, M.; Zheng, J.; Inoue, Y.; Tian, X.; Chen, Q.; Gan, T. Comparative analysis on the socioeconomic drivers of industrial air-pollutant emissions between japan and china: Insights for the further-abatement period based on the lmdi method. J. Clean. Prod. 2018, 189, 240–250. [Google Scholar] [CrossRef]
  45. Bichler, R.; Schönebeck, S.S.; Bittner, M. Observing decoupling processes of NO2 pollution and gdp growth based on satellite observations for los angeles and tokyo. Atmos. Environ. 2023, 310, 119968. [Google Scholar] [CrossRef]
  46. Ministry of Ecology and Environmentthe People’s Republic of China. Report on the State of the Ecology and Environment in China 2022. Available online: http://english.mee.gov.cn/Resources/Reports/ (accessed on 18 December 2023).
  47. Zhang, Z.; Chen, X.; Heck, P.; Xue, B.; Liu, Y. Empirical study on the environmental pressure versus economic growth in china during 1991–2012. Resour. Conserv. Recycl. 2015, 101, 182–193. [Google Scholar] [CrossRef]
  48. Yu, Y.; Chen, D.; Zhu, B.; Hu, S. Eco-efficiency trends in china, 1978-2010: Decoupling environmental pressure from economic growth. Ecol. Indic. 2013, 24, 177–184. [Google Scholar] [CrossRef]
  49. Ministry of Ecology and Environment of the People’s Republic of China. January 2019 National Urban Air Quality Report. Available online: https://www.mee.gov.cn/hjzl/dqhj/cskqzlzkyb/index_4.shtml (accessed on 1 August 2023).
  50. Qin, X.; Hu, X.; Xia, W. Investigating the dynamic decoupling relationship between regional social economy and lake water environment: The application of dpsir-extended tapio decoupling model. J. Environ. Manag. 2023, 345, 118926. [Google Scholar] [CrossRef] [PubMed]
  51. Fan, Y.; Fang, C.; Zhang, Q. Coupling coordinated development between social economy and ecological environment in chinese provincial capital cities-assessment and policy implications. J. Clean. Prod. 2019, 229, 289–298. [Google Scholar] [CrossRef]
  52. Zhang, K.; Jin, Y.; Li, D.; Wang, S.; Liu, W. Spatiotemporal variation and evolutionary analysis of the coupling coordination between urban social-economic development and ecological environments in the yangtze river delta cities. Sustain. Cities Soc. 2024, 105561. [Google Scholar] [CrossRef]
  53. HJ 663—2013; Technical Regulation for Ambient Air Quality Assessment (on Trial). Ministry of Ecology and Environment of the People’s Republic of China: Beijing, China, 2013.
  54. Zhang, Z.; Wang, W.; Cheng, M.; Liu, S.; Xu, J.; He, Y.; Meng, F. The contribution of residential coal combustion to PM2.5 pollution over china’s beijing-tianjin-hebei region in winter. Atmos. Environ. 2017, 159, 147–161. [Google Scholar] [CrossRef]
  55. Li, J.; Ren, L.; Wu, Y.; Zhang, R.; Yang, X.; Li, G.; Gao, E.; An, J.; Xu, Y. Different variations in PM2.5 sources and their specific health risks in different periods in a heavily polluted area of the beijing-tianjin-hebei region of china. Atmos. Res. 2024, 308, 107519. [Google Scholar] [CrossRef]
  56. Wu, J.; Zhan, X.; Xu, H.; Ma, C. The economic impacts of covid-19 and city lockdown: Early evidence from china. Struct. Change Econ. Dyn. 2023, 65, 151–165. [Google Scholar] [CrossRef]
  57. Chinese Academy of Enviromental Planing. Research Report on Total Coal Control in Fenwei Plain: Deepening the Battle of Pollution Prevention and Control. Available online: http://www.nrdc.cn/Public/uploads/2023-07-11/64acba9b171ee.pdf (accessed on 18 May 2024).
  58. Lin, C.; Huang, R.-J.; Zhong, H.; Duan, J.; Wang, Z.; Huang, W.; Xu, W. Elucidating ozone and PM2.5 pollution in the fenwei plain reveals theco-benefits of controlling precursor gas emissions in winter haze. Atmos. Chem. Phys. 2023, 23, 3595–3607. [Google Scholar] [CrossRef]
  59. Cao, J.J.; Cui, L. Current status, characteristics and causes of particulate air pollution in the fenwei plain, china: A review. J. Geophys. Res. -Atmos. 2021, 126, e2020JD034472. [Google Scholar] [CrossRef]
  60. Chen, B.; Wang, X.B.; Li, Y.L.; Yang, Q.; Li, J.S. Energy-induced mercury emissions in global supply chain networks: Structural characteristics and policy implications. Sci. Total Environ. 2019, 670, 87–97. [Google Scholar] [CrossRef] [PubMed]
  61. Xiao, C.; Zhou, J.; Meng, F.; Cullen, J.; Wang, X.; Zhu, Y. Regional characteristics and spatial correlation of haze pollution: Interpretative system analysis in cities of fenwei plain in china. Sci. Total Environ. 2023, 869, 161779. [Google Scholar] [CrossRef] [PubMed]
  62. Tian, M.; Wang, H.; Chen, Y.; Zhang, L.; Shi, G.; Liu, Y.; Yu, J.; Zhai, C.; Wang, J.; Yang, F. Highly time-resolved characterization of water-soluble inorganic ions in PM2.5 in a humid and acidic mega city in sichuan basin, china. Sci. Total Environ. 2017, 580, 224–234. [Google Scholar] [CrossRef]
  63. Liu, B. An analysis of energy efficiency of the pearl river delta of china based on super-efficiency sbm model and malmquist index. Environ. Sci. Pollut. Res. 2023, 30, 18998–19011. [Google Scholar] [CrossRef]
  64. Liang, L.; Gong, P. Urban and air pollution: A multi-city study of long-term effects of urban landscape patterns on air quality trends. Sci. Rep. 2020, 10, 18618. [Google Scholar] [CrossRef]
  65. Wu, W.; Zhao, K. Does upgrading of industrial structure drive economy to “decouple” from environment: An empirical analysis based on the data of prefecture-level cities in china. J. Knowl. Econ. 2023, 14, 287–313. [Google Scholar] [CrossRef]
  66. Yuan, Y.; Lu, Y.; Xie, J.; Tao, J.; Chuai, X.; Huang, S.; Zhang, R.; Zhai, J.; Wang, X.; Pu, L. Decoupling and decomposition analysis of industrial carbon emissions and economic growth in china from a dynamic perspective. Environ. Dev. Sustain. 2024. [Google Scholar] [CrossRef]
  67. Zhao, Y.; Li, F.; Yang, Y.; Zhang, Y.; Dai, R.; Li, J.; Wang, M.; Li, Z. Driving forces and relationship between air pollution and economic growth based on ekc hypothesis and stirpat model: Evidence from henan province, china. Air Qual. Atmos. Health 2023, 16, 1891–1906. [Google Scholar] [CrossRef] [PubMed]
  68. Zhu, Y.; Wang, Z.; Yang, J.; Zhu, L. Does renewable energy technological innovation control china’s air pollution? A spatial analysis. J. Clean. Prod. 2020, 250, 119515. [Google Scholar] [CrossRef]
  69. Lei, H.; Xu, W. How does the transformation of the energy structure impact the coordinated development of economy and environment? Environ. Sci. Pollut. Res. 2023, 30, 112368–112384. [Google Scholar] [CrossRef] [PubMed]
  70. Zhu, M.; Guo, J.; Zhou, Y.; Cheng, X. Exploring the spatiotemporal evolution and socioeconomic determinants of PM2.5 distribution and its hierarchical management policies in 366 chinese cities. Front. Public. Health 2022, 10, 843862. [Google Scholar] [CrossRef]
  71. Fei-fei, Z.; Zheng, H.; Xu, Z.; Wei-jun, H. Identification and solution of decoupling trap between carbon emissions and economic growth in yangtze river economic belt. Res. Environ. Yangtze Basin 2023, 32, 1127–1137. [Google Scholar] [CrossRef]
  72. ZhenFeng, Z.; YuKun, C. Pseudo decoupling risk of economic growth and resource consumption identifying and cracking in the national forestry area. Sci. Silvae Sin. 2017, 53, 139–149. [Google Scholar] [CrossRef]
  73. Khan, R. Catch-up growth with alpha and beta decoupling and their relationships between CO2 emissions by gdp, population, energy production, and consumption. Heliyon 2024, 10, e31470. [Google Scholar] [CrossRef]
  74. Magazzino, C.; Mele, M.; Sarkodie, S.A. The nexus between covid-19 deaths, air pollution and economic growth in new york state: Evidence from deep machine learning. J. Environ. Manage. 2021, 286, 112241. [Google Scholar] [CrossRef]
Figure 1. The key regions in China.
Sustainability 16 07571 g001
Figure 2. The temporal evolution of AQI (a) and PM2.5 (b) in seven key regions from 2014 to 2022.
Sustainability 16 07571 g002
Figure 3. The spatial evolution of AQI (a) and PM2.5 (b) in seven key regions from 2014 to 2022.
Sustainability 16 07571 g003
Figure 4. Decoupling status of AQI from SEGI in (a) the BTHSR and (b) YRDR, 2015–2021.
Sustainability 16 07571 g004
Figure 5. Decoupling status of the AQI from SEGI in (a) the FWP, (b) CCR, (c) MLRYR, (d) PRDR, and (e) OPCCSP, 2015–2021.
Sustainability 16 07571 g005
Figure 6. Decoupling status of PM2.5 from SEGI in (a) BTHSR and (b) YRDR, 2015–2021.
Sustainability 16 07571 g006
Figure 7. Decoupling status of PM2.5 from the SEGI in (a) FWP, (b) CCR, (c) MLRYR, (d) PRDR, and (e) OPCCSP, 2015–2021.
Sustainability 16 07571 g007
Table 1. Indicators of socio-economic growth.
ModulesSub-IndicesUnitsData Sources
Urban
Development and
Population Growth
(UDPG)
Population (UD1)10,000 peopleStatistical yearbook of each city
Urbanization (UD2)%
GDP (UD3-EG1) CNY 100 million
Per Capita GDP (UD4)
Vehicle Population (UD5)unit
Economic Growth
and Changes in
Industrial Structure
(EGCIS)
GDP (UD3-EG1)CNY 100 million Statistical yearbook of each city
Added Value of Primary Industry (EG2) CNY 100 million
Added Value of Secondary Industry (EG3)CNY 100 million
Added Value of Tertiary Industry (EG4)CNY 100 million
Industry Output Value (EG5)CNY 100 million
Construction Output Value (EG6)CNY 100 million
Tourism revenue (EG7)CNY 100 million
Percentage of GDP of the Added Value of Primary Industry (EG8)%
Percentage of GDP of the Added Value of Secondary Industry (EG9)%
Percentage of GDP of the Added Value of Tertiary Industry (EG10)%
Energy
Consumption
Growth and
Structure Change
(ECGSC)
Living Energy Consumption (ES1)10,000 tons of SCE (standard coal equivalent)Compute
Energy Consumption of Large-Scale Enterprises (ES2)10,000 tons of SCE (standard coal equivalent)Statistical yearbook of each city
Raw Coal Consumption of Large-Scale Enterprises (ES3)ton
Power Consumption of Large-Scale Enterprises (ES4)Billion kW-h
Thermal Consumption of Large-Scale Enterprises (ES5)1 million kilo-joule
Table 2. Definitions of eight decoupling states.
Decoupling StateΔPI∆SEGIDIMeaning
DecouplingStrong decoupling (SD)<0>0DI < 0Best: SEGI increases and PI decreases
Weak decoupling (WD)>0>00 < DI < 0.8Better: SEGI increases rate more than PI increases rate
Recessive decoupling (RD)<0<0DI > 1.2Good: PI declines rate more than SEGI declines rate
CouplingExpansive coupling (EC)>0>00.8 < DI < 1.2Worse: SEGI increases and PI increases
Recessive coupling (RC)<0<00.8 < DI < 1.2Average: SEGI decreases and PI decreases
Negative DecouplingExpansive negative decoupling (END)>0>0DI > 1.2Poor: PI increases rate more than SEGI increases rate
Weak negative decoupling (WND)<0<00 < DI < 0.8Very Bad: SEGI decreases rate more than PI decreases rate
Strong negative decoupling (SND)>0<0DI < 0Worst: SEGI decreases and PI increases
Table 3. The proportion of cities with strong decoupling from 2015 to 2021.
The Proportion of Cities with Strong Decoupling (%)BTHSRYRDRFWPCCRMLRYRPRDROPCCSP
PM2.5, SEGI57.9675.5249.161.660.685.3745.21
AQI, SEGI55.0467.5744.2358.5754.8465.0036.99
Table 4. Pearson’s correlation between socio-economic growth indicators and AQI values.
UD1UD2UD3-EG1UD4UD5EG2EG3EG4EG5EG6EG7EG8EG9EG10ES1ES2ES3ES4ES5
R0.0840.3430.019−0.244−0.0130.0620.012−0.1050.121−0.016−0.1080.1140.378−0.136−0.0280.2900.034−0.0100.073
P0.0030.0000.5000.0000.6780.0290.6840.0100.0000.6040.0010.0010.0000.0000.3560.0000.3150.7540.020
Table 5. Pearson’s correlation between socio-economic growth indicators and PM2.5 concentrations.
UD1UD2UD3-EG1UD4UD5EG2EG3EG4EG5EG6EG7EG8EG9EG10ES1ES2ES3ES4ES5
R0.0800.1930.1090.0550.0920.07850.3140.1340.0720.0080.003−0.0200.0360.1240.0580.0230.2700.0200.007
P0.0260.0000.0040.0780.0240.0320.0000.0000.0690.8000.9220.5690.2360.0010.0720.5300.0000.5690.845
Disclaimer/Publisher’s Note: The statements, opinions and data contained in all publications are solely those of the individual author(s) and contributor(s) and not of MDPI and/or the editor(s). MDPI and/or the editor(s) disclaim responsibility for any injury to people or property resulting from any ideas, methods, instructions or products referred to in the content.

