Article

An Experimental Study of the Retention Effect of Urban Drainage Systems in Response to Grate Inlet Clogging

Department of Civil and Environmental Engineering, Incheon National University, Incheon 22012, Republic of Korea
*
Author to whom correspondence should be addressed.
Sustainability 2024, 16(17), 7596; https://doi.org/10.3390/su16177596
Submission received: 1 August 2024 / Revised: 30 August 2024 / Accepted: 31 August 2024 / Published: 2 September 2024
(This article belongs to the Section Sustainable Water Management)

Abstract

:
The rainfall drainage characteristics of urban areas result in more surface runoff compared to soil surfaces. Conventional Urban Drainage Systems, CUDs, have disadvantages when managing this surface runoff, leading to urban water circulation issues such as flooding and depletion of groundwater. The performance of CUDs varies significantly depending on the clogging of grate inlets with various debris and shapes. To address these disadvantages, Sustainable Urban Drainage Systems, SUDs, have been proposed. This study compares the drainage efficiency of the two systems; using a physical model with an artificial rainfall simulator, an experimental study was conducted with respect to clogging type, clogging ratio, and rainfall intensity. Comparative analysis of peak flow rates and the peak time demonstrates the advantages of IRDs. As a result, IRDs are applicable to the mitigation of urban water circulation problems such as inundation.

1. Introduction

Climate change has induced alterations in the hydrological cycle. It, coupled with rapid urbanization-driven land use changes, has led to global challenges such as flooding, water pollution, and widespread economic losses [1]. Traditionally, urban areas rely on pipe network systems and conventional rainwater drainage systems. These are continuously diminishing in effectiveness [2]. Lowlands are especially experiencing sudden surges of discharge rates. This issue is expected to become worse due to the insufficient capacity of Conventional Urban Rainwater Drainage Systems, CUDs [3]. Traditional methods for designing and rehabilitating urban drainage systems typically focus on ensuring adequate flow capacity using deterministic or probabilistic approaches. However, these methods may reduce overall system efficiency when factors such as pipe blockages by sediment settlement or unexpected flood events exceed the system’s design capacity. These issues can significantly undermine the reliability and performance of the system [4].
From this perspective, there has been research on the limitations of CUDs in addressing the issues of modern climate challenges. CUDs primarily focus on controlling water volume, overlooking essential aspects such as water circulation and utilization [5]. In response to urban inundation issues, various Sustainable Urban Drainage Systems, SUDs, have been suggested. Eco-friendly drainage approaches were proposed, mimicking natural processes by utilizing the landscape to control surface water flow. This method supports urban water circulation, contributing to a more sustainable and efficient discharge system [6]. Commonly known as Low-Impact Development, it embodies an approach that has synergy between natural processes and urban environments for effective water management [7]. Loc et al. conducted a numerical comparison of rain harvesting, green roofs, urban green space, and pervious pavement for their rainfall management in SUDs. The results indicated that green roofs provided the best runoff reduction, followed by urban green space and pervious pavement [8]. Bouarafa et al. investigated the discharge performance of three SUDs: vegetated pavement, grit packages, and embankments. The study revealed that the performance of these SUDs varies significantly with soil characteristics, including capillary length scale, average pore size, and saturated hydraulic conductivity [9]. Guptha et al. conducted a study in the Gurugram region in India to assess the applicability of SUDs to the mitigation of urban floods. Using numerical analysis, the study investigated the impact of rainfall intensity and watershed impermeability on urban drainage systems. The results demonstrated that the implementation of SUDs improved the resilience of drainage systems, effectively reducing flooding caused by heavy rainfall [10]. Joshi et al. evaluated the economic and environmental effectiveness of SUDs. The results provided evidence of the economic viability resulting from the reduction in Combined Sewer Overflow across the entire urban area. Additionally, the study demonstrated a from 74% to 80% reduction in the peak flow rates by implementing SUDs [11]. Abbott et al. studied the runoff reduction effects of a permeable pavement, which has 350 mm of sub-grid, 80 mm of block paving, and 50 mm of bedding. Drainage continued for 2–3 days after the end of precipitation. The total volume of drainage was 67% of rainfall; the remaining 33% was either stored or evaporated. The infiltration rate through the joint was 50 times more than through the block [12].
One of noticeable disadvantage of CUDs is clogging on the grate inlet as shown in Figure 1. Gómez et al. conducted a study on the clogging of grated inlets. They identified clogging patterns and the performance of the system was tested. Clogging patterns were found throughout the catchment and exhibited a uniform spatial distribution. While the slope of the catchment did not influence the clogging patterns, it could accelerate the clogging effect [13]. Almedeij et al. studied how clogging affects drainage efficiency in residential areas. They found that clogged grate inlets reduced drainage capacity significantly. As a result, clogging of grate inlets significantly affected drainage capacity under various rainfall conditions. Additionally, it was suggested to enlarge the size of grate inlets and arrange them continuously to prepare for the rainfall events exceeding the design rainfall frequency [14]. Jang et al. proposed the design criteria for grate inlets, specifically addressing scenarios where 50% of catchment areas were clogged. As a result, they found appropriate specifications for the inlet areas are more effective than simply increasing the number of grate inlets [15].
Securing additional permeable surfaces in developed urban areas to overcome the limitations of drainage system entails social, environmental, and economic challenges [16]. Various studies have been conducted on the environmental and economic aspects of construction technologies for sustainable urban development. Hong et al. quantitatively analyzed the CO2 emissions of buildings using the I-O LCA (Input–Output Life Cycle Assessment) model [17]. To appropriately modify the current urban drainage system of CUDs, Infiltration-type Rainwater Drainage systems, IRDs, have been developed to lead rainwater infiltration into the spaces between pavements [18]. Yeom et al. evaluated the environmental and economic aspects of IRDs (Infiltration-type Rainwater Drainage systems) compared to CUDs using LCA (Life Cycle Assessment) and LCIA (Life Cycle Impact Assessment) methods. The results indicated that IRDs demonstrate significantly lower greenhouse gas emissions and resource consumption throughout their life cycle. Additionally, IRDs were found to be more economically and environmentally effective than CUDs [19].
Figure 2 is a schematic diagram of IRDs, a new type of SUD. IRDs simultaneously drain surface runoff and infiltration. Infiltration passes through the permeable pavement and joints, then through the base layer, gathering in the storage well before being discharged through the pipe network.
Based on previous research findings, preventing urban flooding and inundation is considered possible with the application of SUDs using infiltration. Previous studies have demonstrated the potential of various SUDs in managing urban runoff. However, there remains a gap in understanding the comparative performance of these systems under extreme clogging conditions, particularly for IRDs. This study builds on these findings by providing a detailed experimental comparison.

2. Materials and Methods
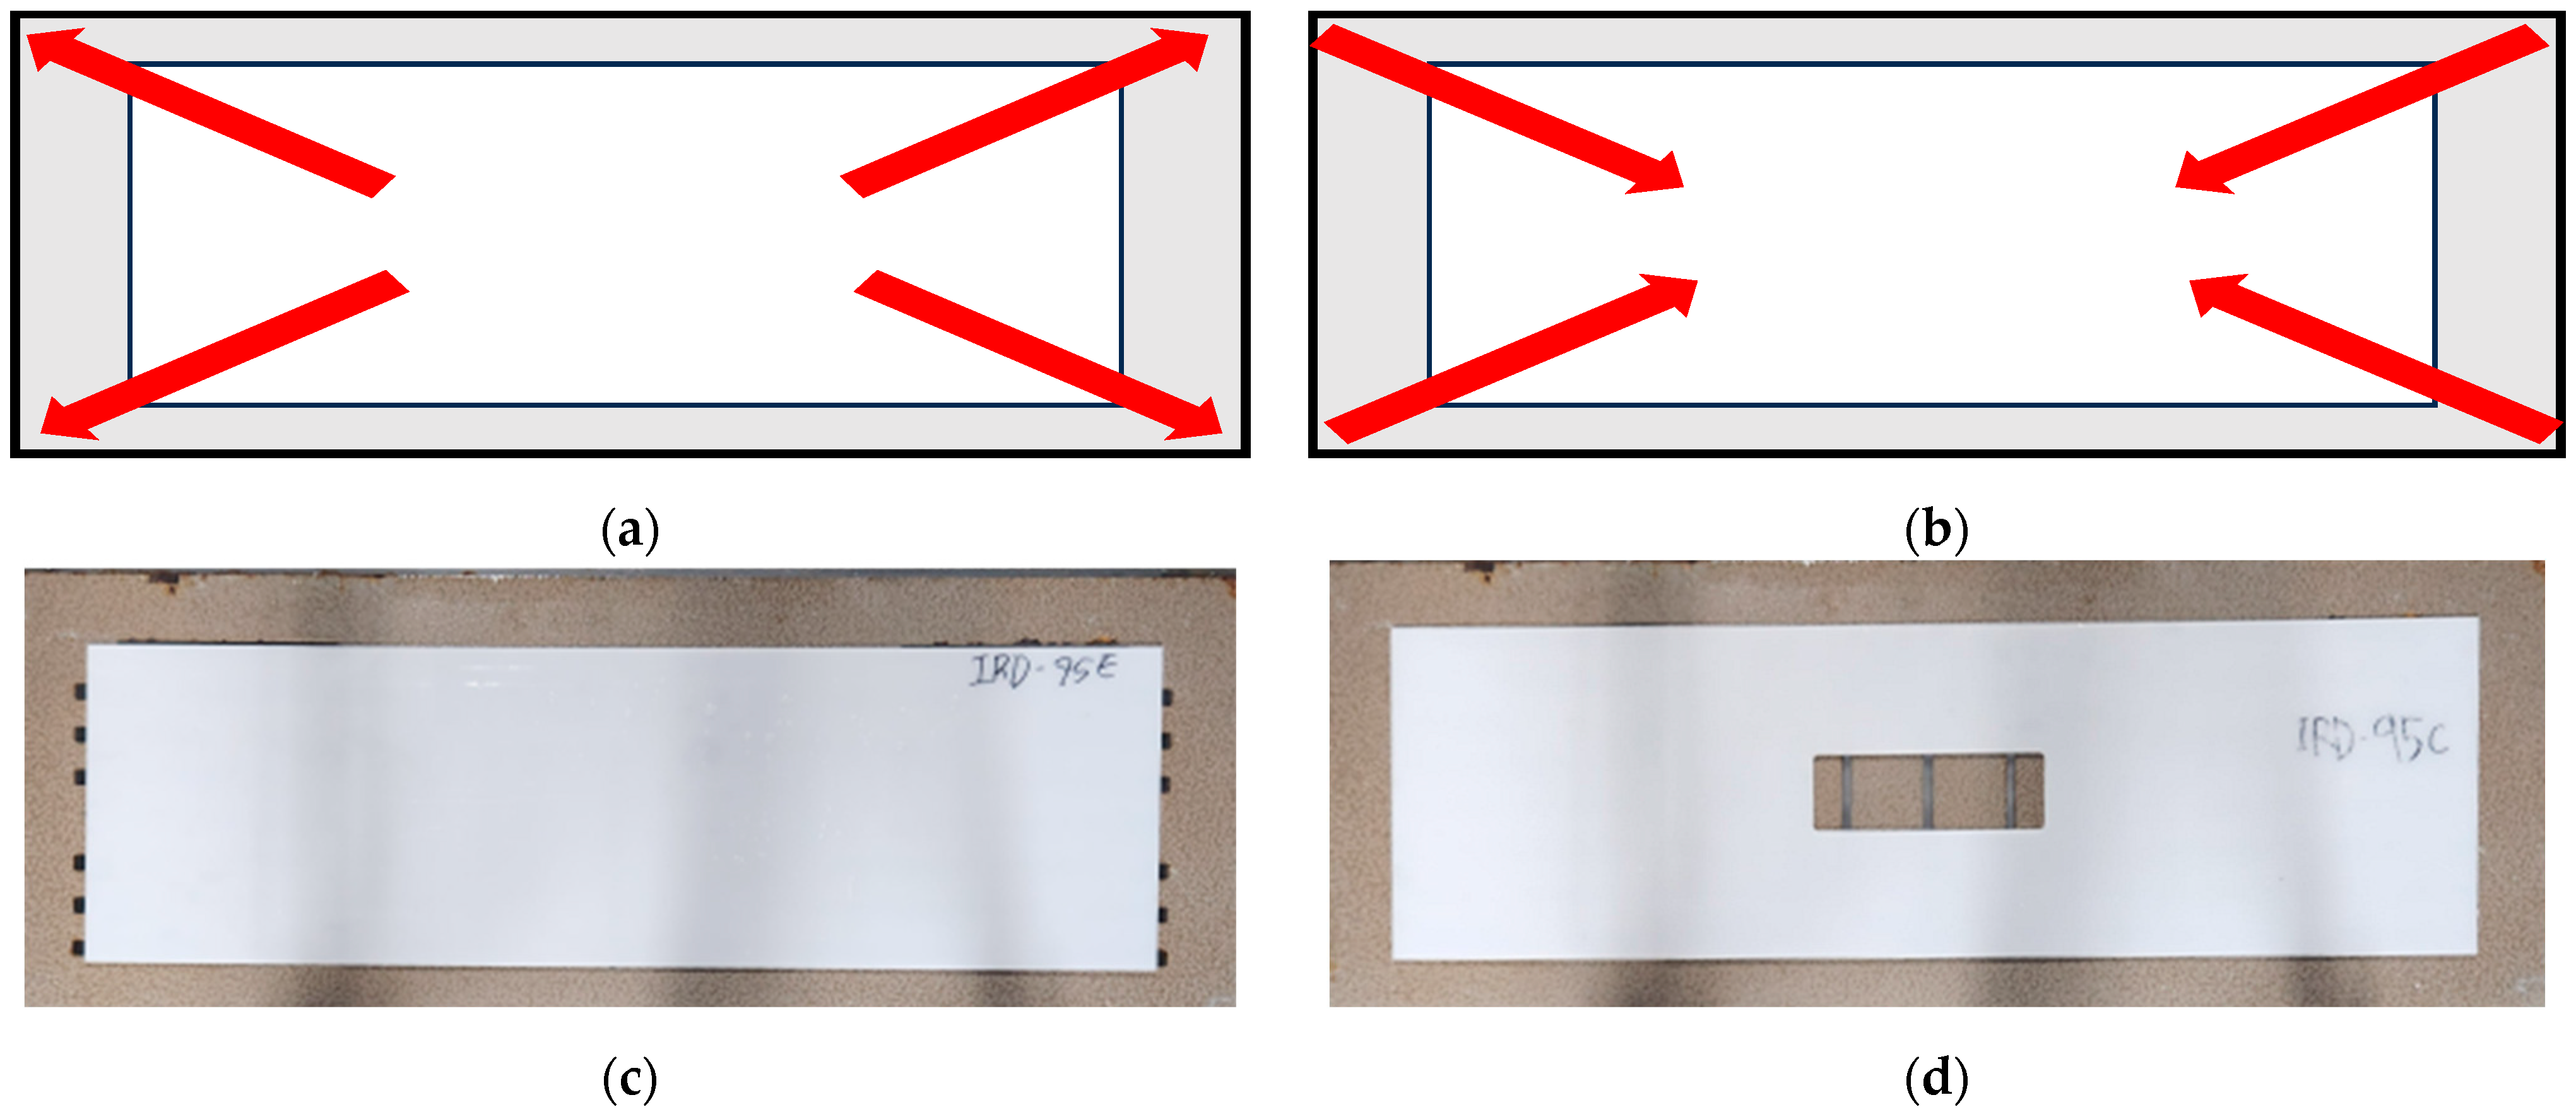
2.1. Physical Model

CUDs typically consist of channels and grate inlets situated along roads and pedestrian walkways. The configuration of the channel is commonly either O-shaped or U-shaped [20]. In order to address the challenges posed by CUDs, evaluation of the performance of the new system, IRDs, is essential. Physical modeling of CUDs with O-shaped channels, OCs, and IRDs was performed. The physical model was designed to measure the discharge of both IRDs and CUDs. Also, it is typically used to demonstrate natural phenomena resulting from rainfall.
Various studies have utilized an artificial rainfall simulator for experimental research on urban flooding. Kim et al. conducted a study using an experimental setup that simulated road structures to investigate the effects of clogging direction, variations in cross slope, and clogging on the efficiency of stormwater collection [3]. Seong et al. investigated urban inundation caused by rainfall, using an artificial rainfall simulator. The findings demonstrated a proportional relationship between rainfall intensity and flood depth [21]. Im et al. conducted experiments to demonstrate the runoff effect of SUDs with various rainfall intensities from 20 to 200 mm/h. They compared the discharge performance with respect to paving material, as well [22]. Experimental research using an artificial rainfall simulator for 41 rain events demonstrated that more than 40% of the total inflow was retained and the drainage took 7 h. It showed the significant runoff attenuation capabilities of SUDs with permeable pavement [23].
Figure 3 is a schematic diagram of the physical model. Figure 3a shows the components of the physical model. Four flowmeters were incorporated to spray artificial rainfall accurately. These are interfaced with the pump system, enabling temporal calibration of flow rates. Artificial rainfall is drained by both surface runoff and infiltrated under the pavement. To compare and analyze the discharge characteristics of OCs and IRDs, an artificial pavement was designed with specifications shown in Figure 3b.
To ensure uniform distribution of artificial rainfall, nozzles with four flowmeters were installed, allowing for real-time adjustment of flow rates through calibration with the pump system. For OCs, runoff water flowing along the surface was collected in a water tank. For IRDs, infiltrated water passing through the permeable pavement and joints traveled through a base layer before being collected in the water tank. The runoff volume was measured over time.
Figure 4a,b shows the grate inlets of the OCs and IRDs, respectively. The OCs have dimensions of 1 m by 0.1 m, while the IRDs have dimensions of 0.5 m by 0.2 m. To ensure accurate experimentation, the area of both inlets was standardized to 0.1 m2. The composition of the permeable blocks, base layer, and joints used in both drainage systems was kept the same to maintain consistency in the experimental conditions.
Figure 5 presents the sieve analysis results of the joints and base layer. Infiltration in SUDs with permeable paving primarily occurs through the joints between blocks [12]. To replicate this, different compositions for the joints and base layer were used, and sieve analysis was conducted for quantitative assessment. Figure 5b showed that the median size of the joints is 0.67 mm, while that of the base layer is 1.17 mm, indicating that the median particle size of the base layer is 42% larger.
Figure 6 represents the diagram of clogging type. Figure 6a,b illustrate clogging developing from the center and from the edge, respectively. Figure 6c,d represents 95% of Expansion- and Contraction-type clogging. The experiments were conducted by setting up a physical model with an artificial rainfall simulator. The simulator was calibrated to spray rainfall at various designed intensities. The experiments were conducted under four different clogging conditions: 0%, 90%, 95%, and 100% clogging ratio. With OCs, experiments for 100% were not conducted because no drainage occurs when 100% clogging is present. The rainfall intensities used in the experiments were 30, 60, and 90 mm/h. The experimental studies have been conducted on grate inlets, incorporating various patterns and clogging ratio assessment methods [3,15,24].
Table 1 shows the experimental conditions with respect to clogging type, clogging ratio, and rainfall intensity. Clogging types include Contraction (C) and Expansion (E).

2.2. Experimental Procedure

Figure 7 shows a flowchart of the experimental study. To reduce error from changes in soil moisture content, an antecedent rainfall of 50 mm/h was applied for 0.5 h. During application of artificial rainfall under experimental conditions, accumulative runoff was measured, and data was automatically saved in the data storage after spraying the designed rainfall for 30 min for every experiment. Also, measurement was continued for an additional hour to measure the discharge rate of each drainage system. At the 0.5 h mark after the rainfall had stopped, the surface water depth was measured to evaluate the performance of the IRDs and OCs.
Figure 8 illustrate the experiments conducted using the physical model. Figure 8a shows the experimental setup for the OCs, while Figure 8b depicts the setup for the IRDs. For both cases, runoff from the two drainage systems was collected in underlying water tanks, where it was measured over time using a scale with a one second measurement interval. This approach allowed for precise monitoring of the runoff discharge hydrograph. This setup enabled a detailed comparison of the performance of managing surface runoff of the two drainage systems.

3. Result

It is important to understand their effectiveness in reducing peak discharge and managing runoff for an quantitative evaluation the performance of SUDs and CUDs. Urbanization increases impervious surfaces, leading to higher peak discharges and greater flood risks [25,26]. This study used a physical model to compare the runoff characteristics of IRDs and OCs. The results provided a comparative analysis of surface water depth, peak time, and peak discharge for each drainage system.

3.1. Surface Water Depth

Figure 9 show the surface water depth above the grate inlet, measured due to clogging. For OCs, surface water depth was measurable, and it was confirmed that the surface water depth increases with an increase in rainfall intensity. In the case of CUDs, surface ponding reduces serviceability for pedestrians and vehicles. Therefore, this study also measured the surface water depth of IRDs and OCs. For IRDs, the infiltration through the permeable blocks and joints results in a surface water depth of less than 1 mm, which is considered negligible for serviceability.
The changes in surface water depth according to rainfall intensity, clogging ratio, and clogging type are summarized in Table 2. From IN60 to IN90, the surface water depth for E-type clogging increased by about 75%, while C-type clogging increased by around 7%. This indicates that E-type clogging is more sensitive to the changes in clogging ratio. The results also suggest that OCs are less effective than IRDs with deeper surface water. In contrast, the IRDs had surface water depth less than 1 mm, making measurement difficult. This shows that IRDs are better at managing surface runoff and preventing water accumulation than OCs.

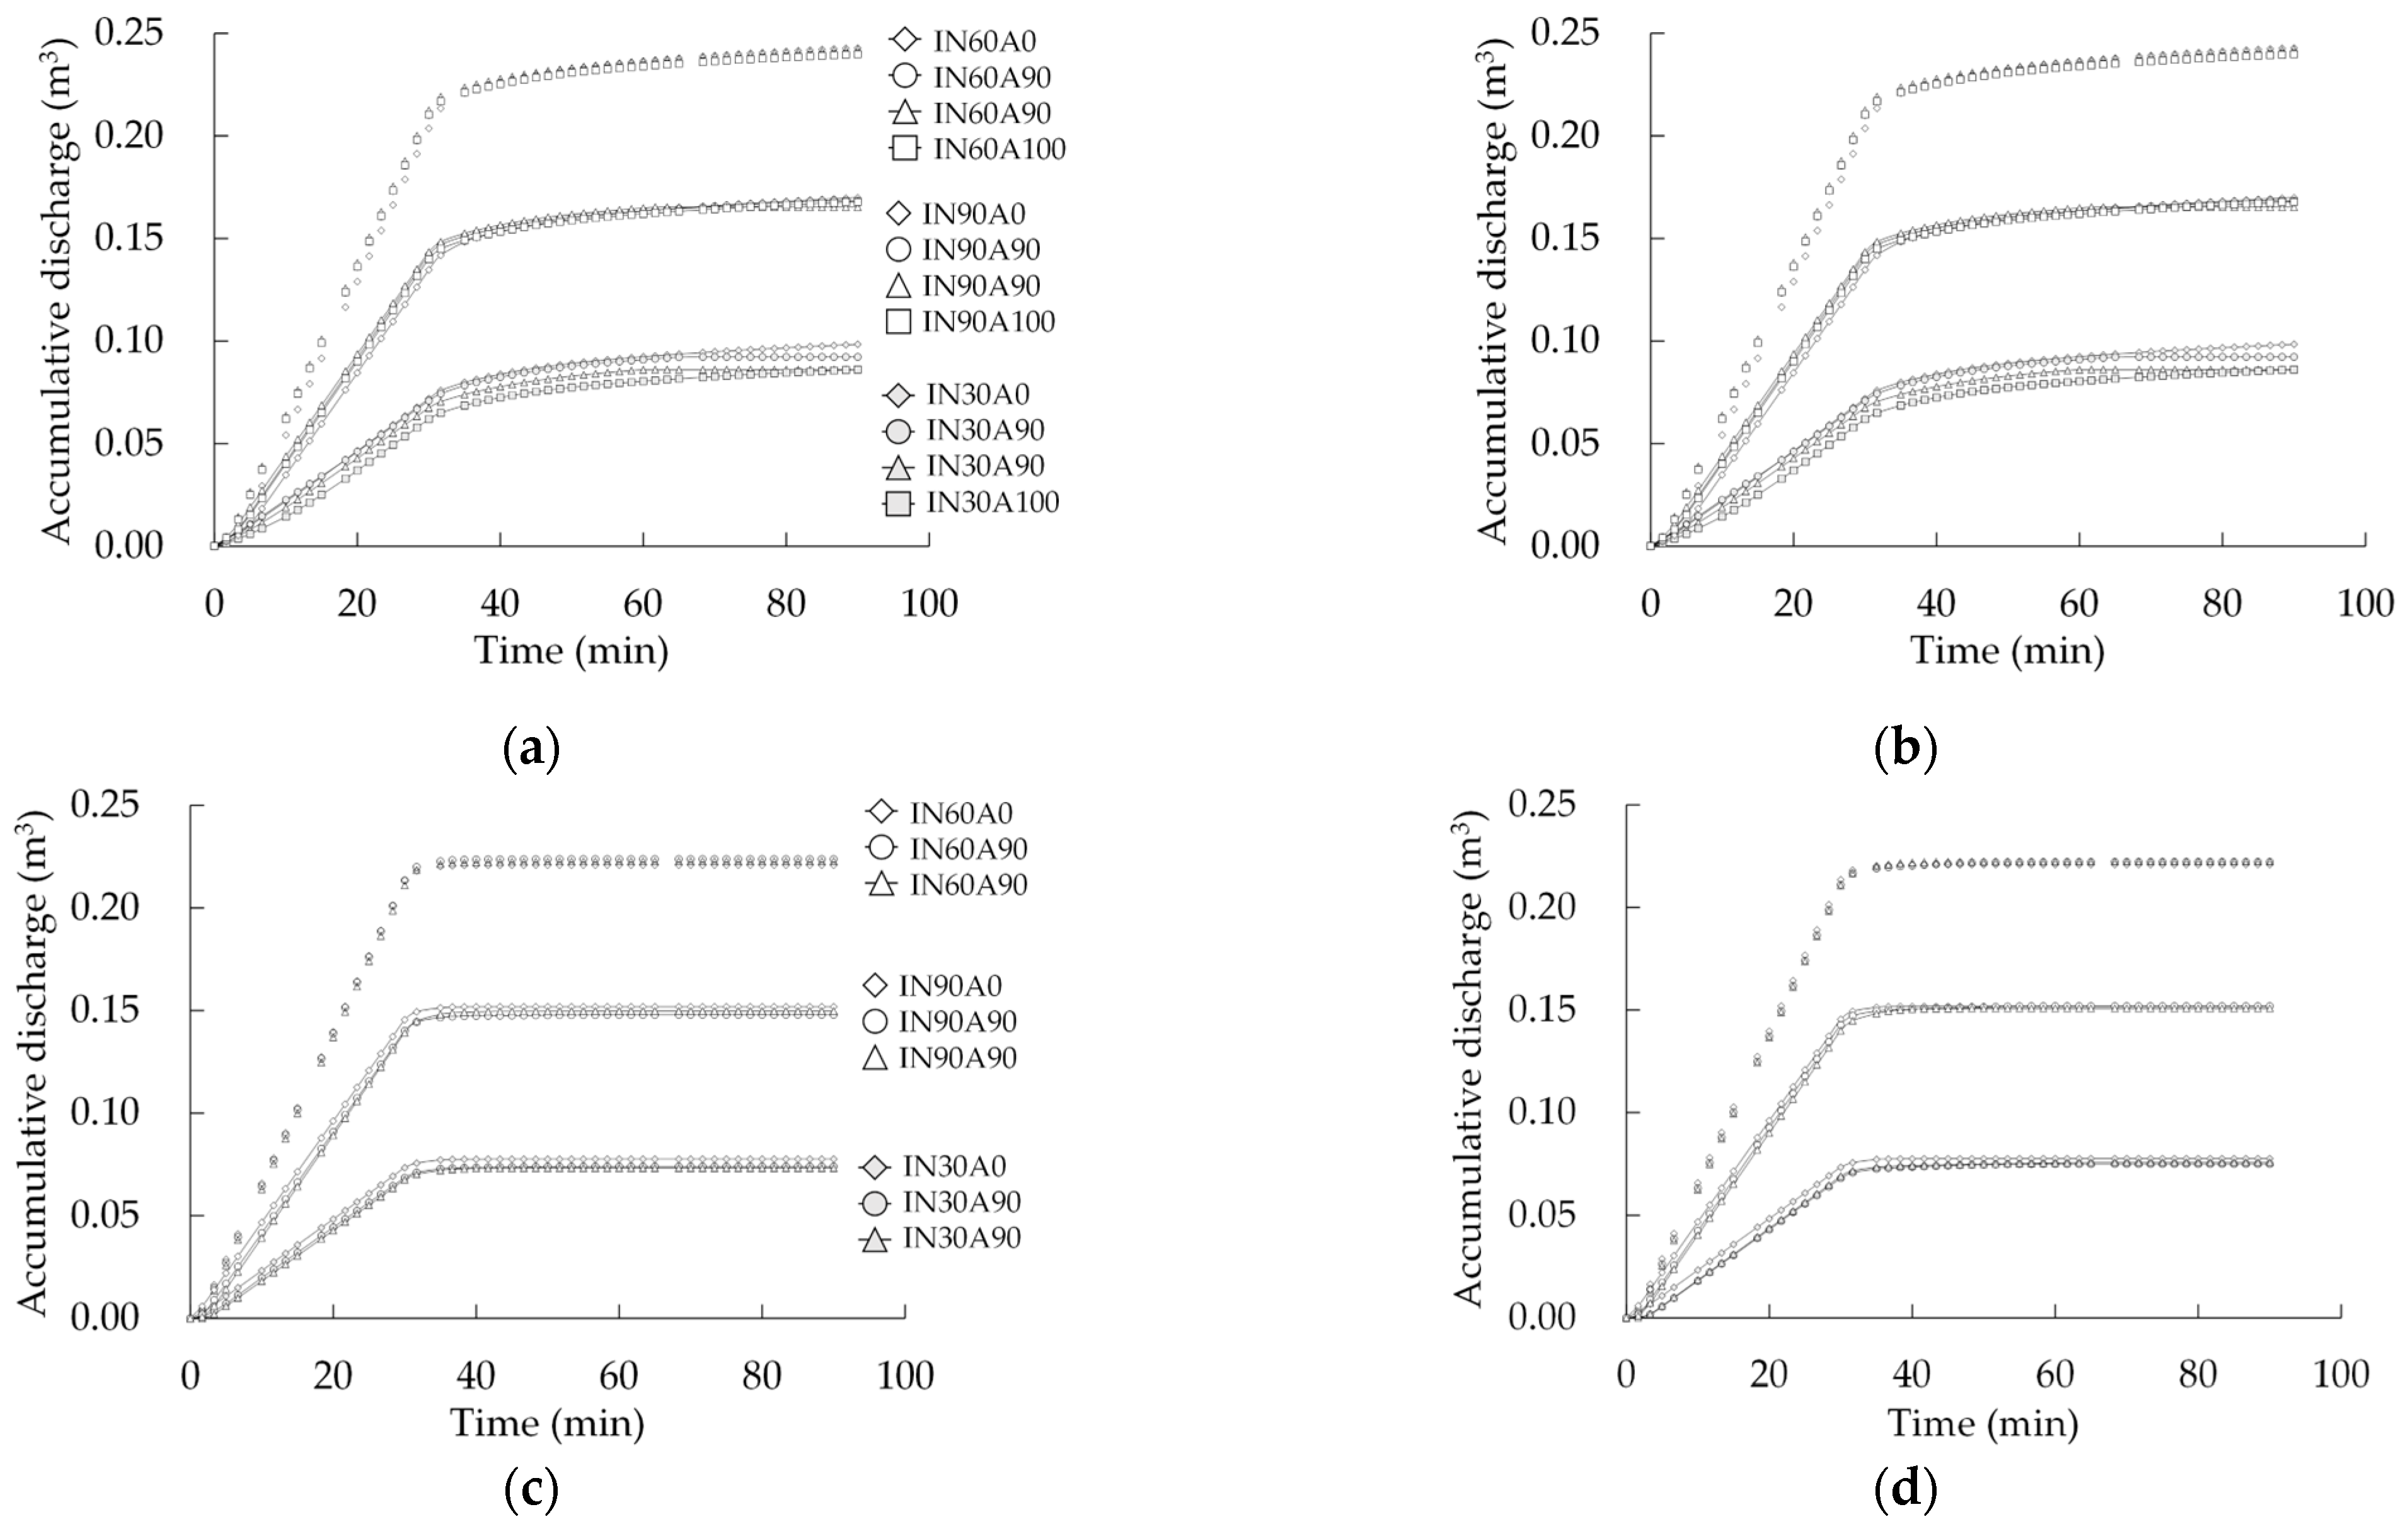
3.2. Accumulative Discharge

Figure 10 show the cumulative runoff of IRDs and OCs under various rainfall intensities and clogging ratios. Specifically, survey 10a,b shows E-type and C-type clogging for IRDs, respectively, while Figure 10c,d illustrates E-type and C-type clogging for OCs. Both drainage systems demonstrate a proportional relationship between rainfall intensity and runoff, indicating that intense rainfall leads to more runoff volume. Drainage characteristics of the two drainage systems differ significantly. OCs show a reduction in runoff volume immediately after rainfall ended, around 30 min.
A sharp drop in the runoff curve is shown. In contrast, IRDs continue to exhibit runoff even after rainfall stopped, with a more round and gradual decrease.

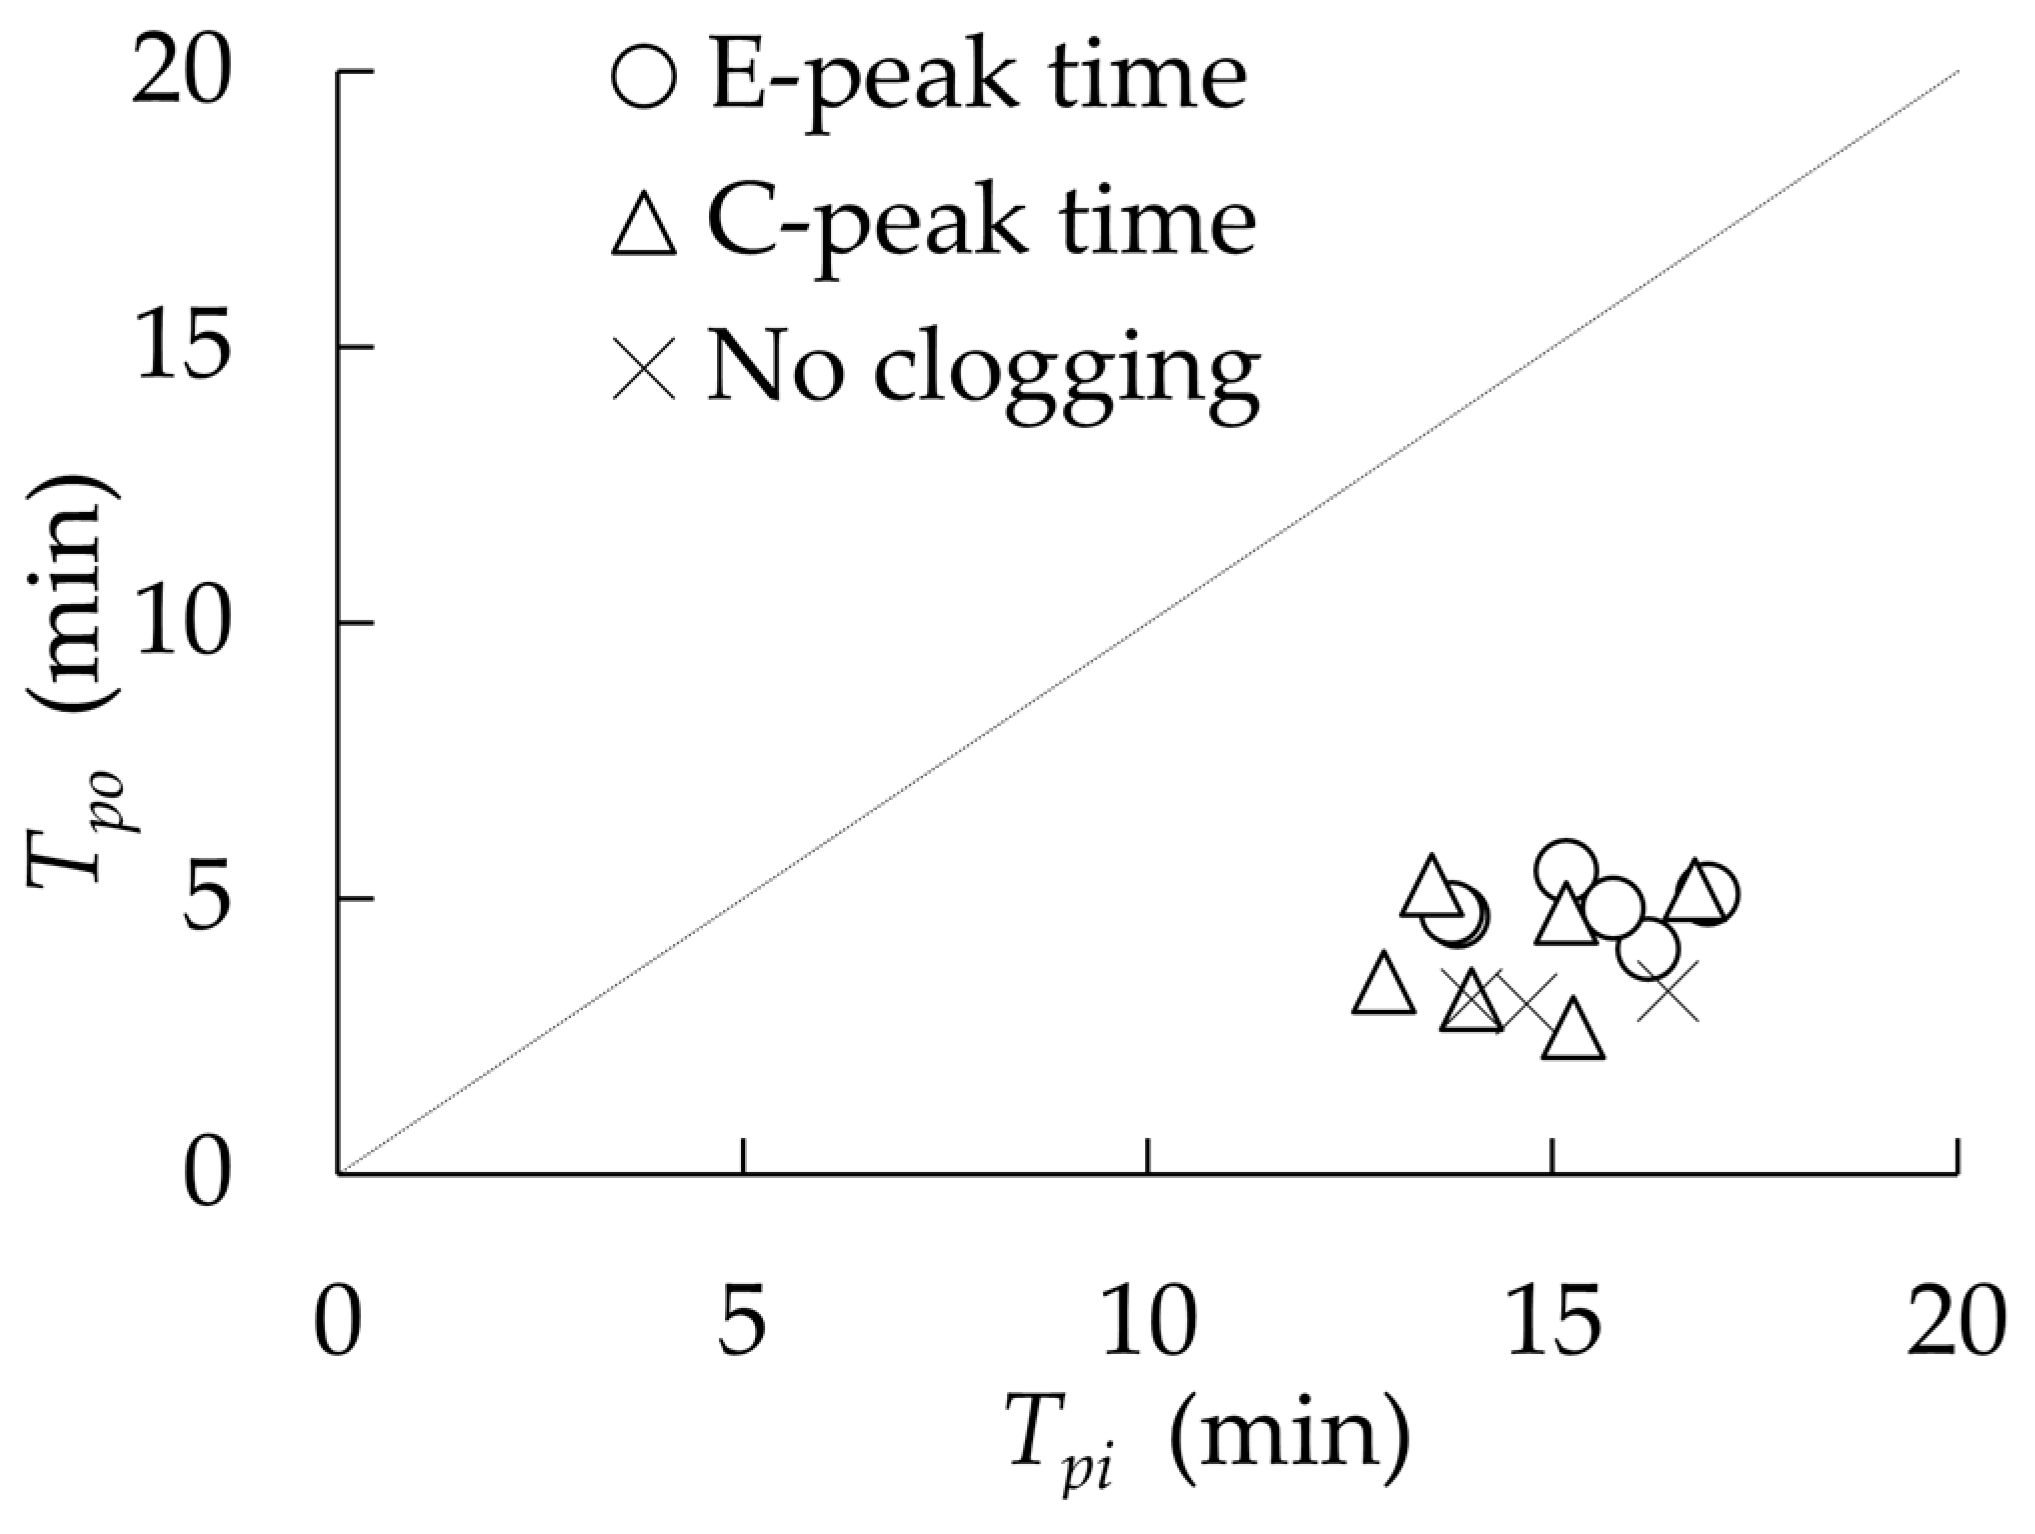
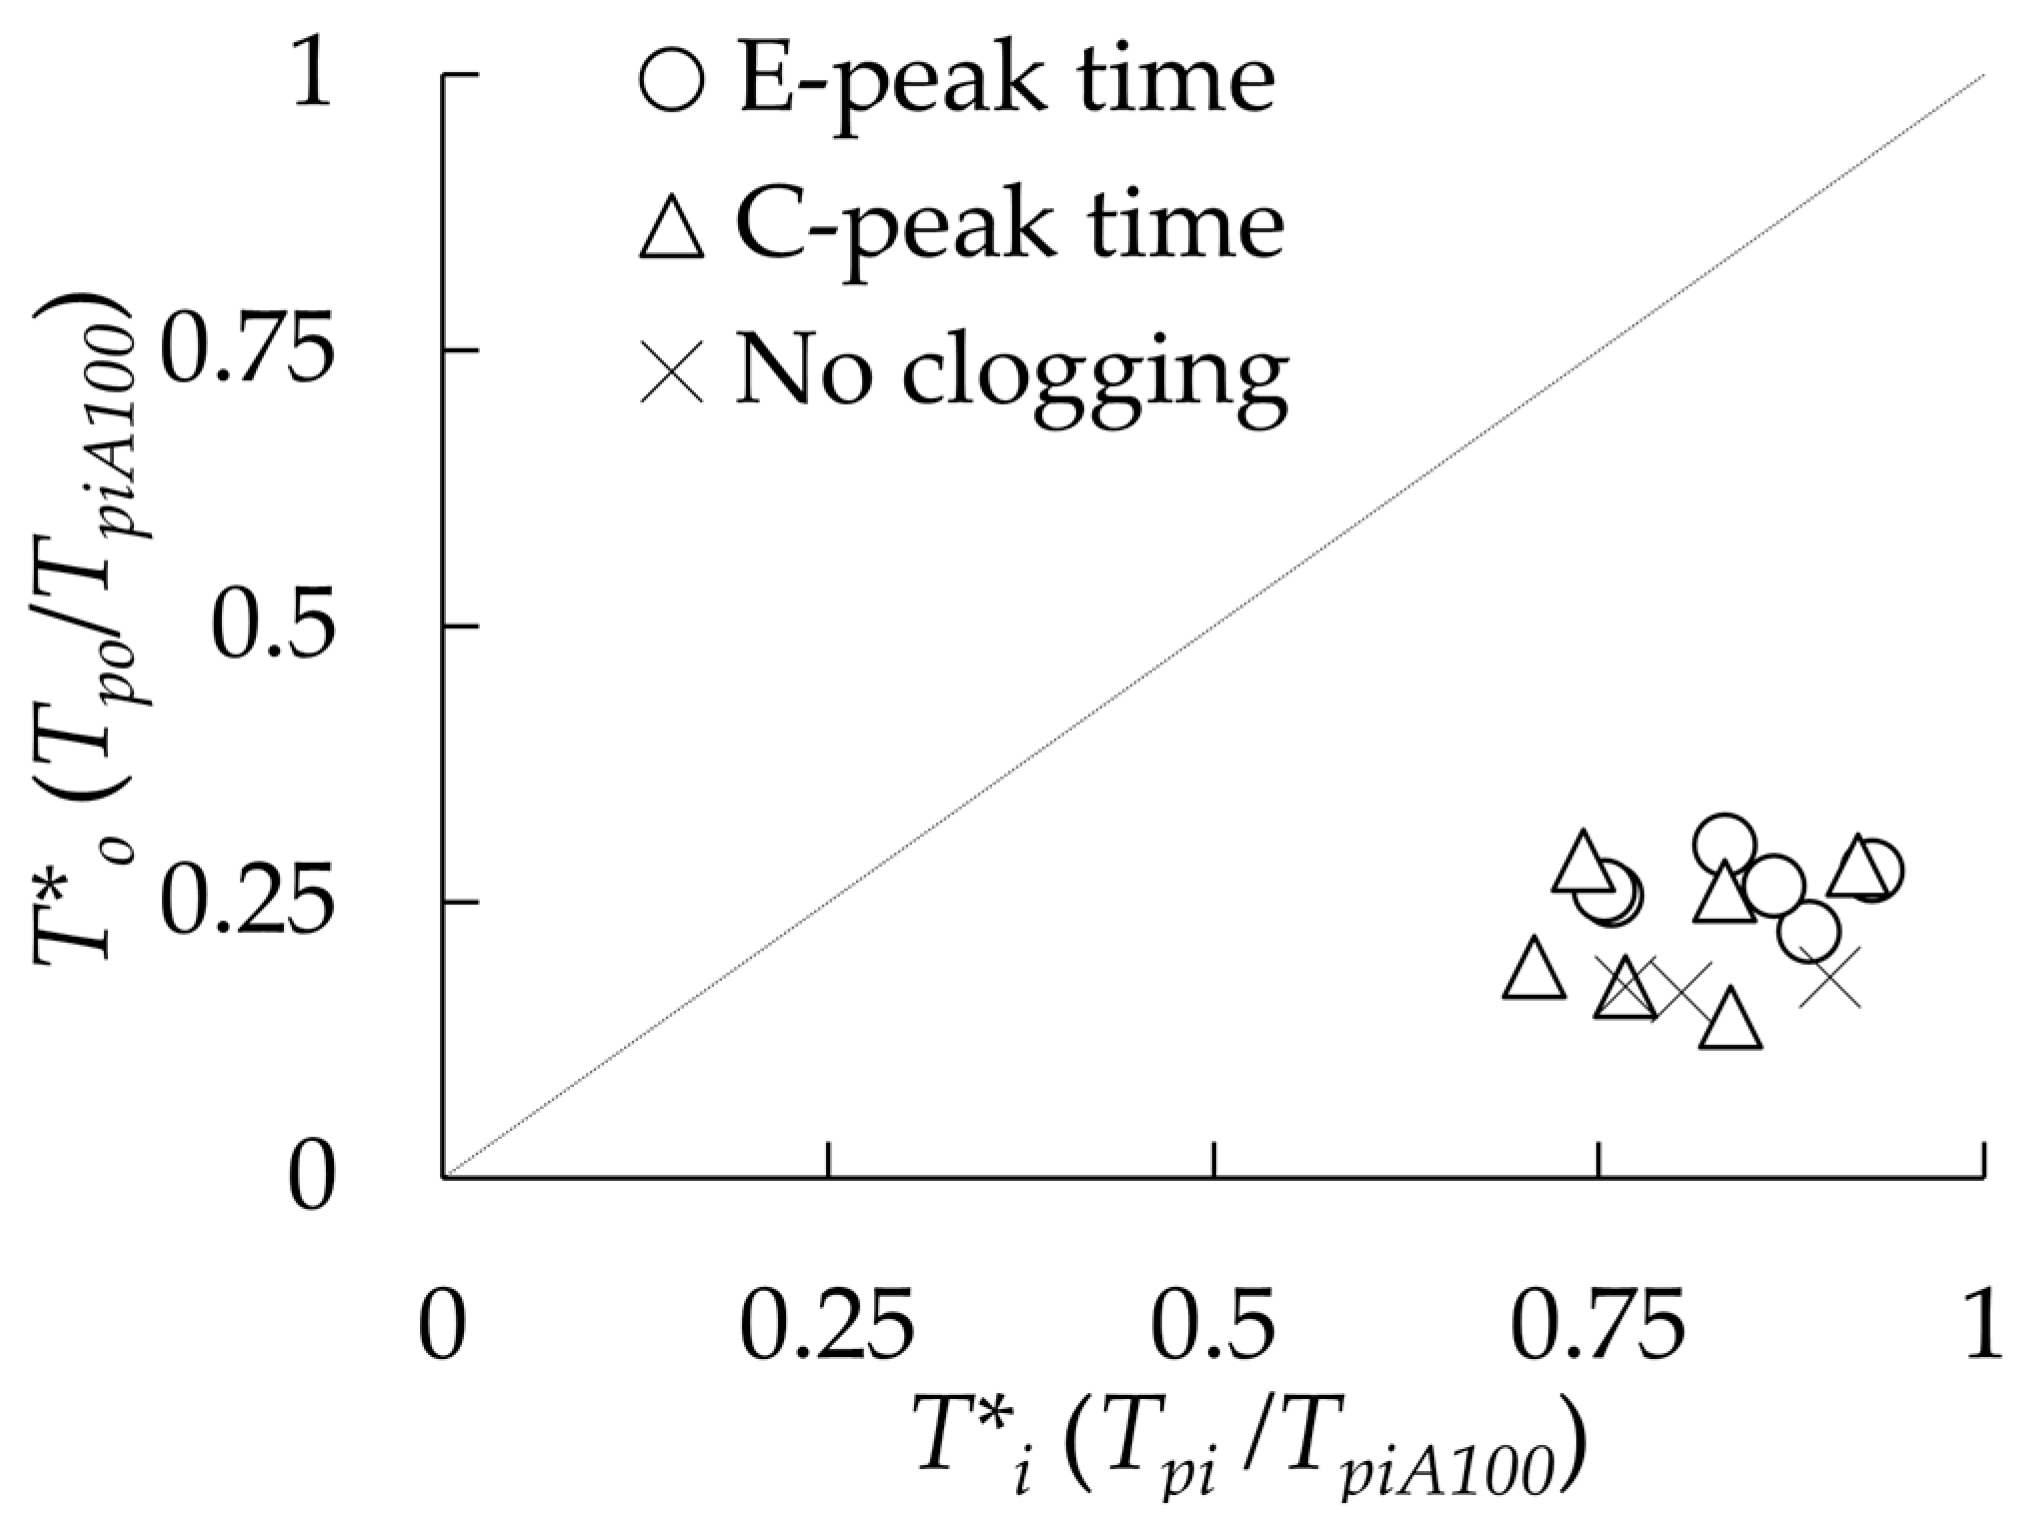
3.3. Peak Discharge and Peak Time

Table 3 presents the experimental results for OCs, showing the peak discharge Qpo and the peak time Tpo with respect to rainfall intensities, clogging ratios, and clogging types. The peak discharge, Qpo, is consistent regardless of rainfall intensity but varies with clogging ratios.
For example, the Tpo of IN30E increases by 47% at A90 and by 29% at A95 clogging compared to A0. Similar results were observed for IN60 and IN90 and under C-type clogging, indicating that higher clogging ratios require significantly longer times for rainwater to be drained. Comparing the effects of rainfall intensity and clogging ratio, it is evident that clogging ratio has a direct impact on both peak discharge Qpo and Tpo. High clogging ratios significantly reduce Qpo and increase Tpo, showing a proportional relationship between clogging ratio and the efficiency of the drainage system. As a result, OCs have more significant deterioration in discharge performance with higher rainfall intensity and clogging ratios.
Table 4 presents the experimental results of the IRDs, specifically focusing on the peak discharge and peak time. Qpi consistently increased with higher rainfall intensities. When the rainfall intensity increases from IN30 to IN60, Qpi doubled, and when the intensity increased from IN60 to IN90, it increased by approximately 40%. The Tpi increased with clogging area ratios. For IN30E, Tpi increased by about 30% as the clogging ratio increased from A0 to A100. Similar patterns were observed for IN60 and IN90, and the same trends were observed for Contraction-type clogging as well. This demonstrates that higher clogging ratios result in longer times for water to be drained for IRDs. Comparing the effects of rainfall intensity and clogging ratio, it is evident that rainfall intensity has a direct impact on peak discharge Qpi. High rainfall intensities lead to a significant increase in Qpi. On the other hand, clogging ratio primarily affects time to the peak discharge, Tpi. It takes longer for IRDs to drain the entire rainfall with higher clogging ratios. In conclusion, rainfall intensity is the dominant factor in the design of IRDs.

3.4. Result of Experimental Study

Figure 11 represents a comparison of the peak times of IRDs and OCs. The analysis of peak time for IRDs and OCs showed an average delay effect of 10.75 min, with a maximum delay of 13.1 min observed in IN90A0. The analysis of peak time variations for various drainage systems due to clogging type showed an average change of 0.67 min for IRDs and 0.73 min for OCs. It shows that higher clogging ratios result in longer peak times. These results indicate that the change in discharge performance due to clogging type is more significant for OCs. IRDs consistently exhibited a retention effect across clogging types and rainfall intensities.
T* is proposed to compare and analyze the delay effect between IRDs and OCs by relatively comparing the Tpi of IRDs with 100% clogging and the Tpi and Tpo measured at the same rainfall intensity according to the clogging ratio.
Figure 12 shows that IRDs have a delay effect of up to 92.7% and a minimum of 70% compared to a clogging ration of 100%, A100. In contrast, OCs showed a maximum delay of 30% and a minimum of 14%. These results demonstrate that, even under maximum clogging conditions, IRDs exhibit superior delayed discharge effects compared to OCs. These findings suggest that implementing IRDs in urban areas could substantially reduce the risk of flooding and improve water management.

4. Discussion

This study quantitatively evaluated the drainage performance of urban rainwater drainage systems according to rainfall intensity, clogging ratio, and clogging type. A physical model with four flow meters capable of real-time calibration was employed to ensure accurate artificial rainfall distribution. This setup enabled the collection of precise and continuous data. To effectively mitigate urban flooding and water circulation issues, it is essential to manage the reduction in peak discharge and increase the time to peak discharge. As a result, OCs showed a significant decrease in drainage efficiency with increasing rainfall intensity and clogging ratio, with a significant increase in surface water depth in the case of serious clogging.
In contrast, IRDs consistently maintained discharge performance regardless of the clogging type and ratio, even with complete clogging. Further analysis revealed that the peak discharges for OCs and IRDs were affected by the rainfall intensity only. IRDs showed consistent drainage capacity regardless of the clogging type and clogging ratio. However, the analysis of retention effect showed that IRDs delayed the peak time, which is desirable to prevent urban inundation. The importance of clogging type was also evident in the results.
These experimental results indicate that the grate inlet clogging of OCs induces inundation, leading to the reduction in efficiency of the drainage system and serviceability of sidewalks and roads. For IRDs, however, the drainage performance, peak discharge and retention effect, are not affected by clogging type.
This research demonstrated the sustained and consistent drainage performance of IRDs regardless of clogging type, clogging ratio, and rainfall intensity. These experimental results indicate that IRDs serve as effective drainage system, enabling sustainable development. Future urban planning should consider integrating IRDs to enhance the resilience of urban drainage systems.

Author Contributions

Conceptualization, J.A.; experiments and analysis, S.Y. and J.A.; writing—original draft preparation, S.Y.; writing—review and editing, J.A.; supervision, J.A.; project administration, J.A. All authors have read and agreed to the published version of the manuscript.

Funding

This work was supported by the National Research Foundation of Korea (NRF) grant funded by the Korea government (MSIT) (No. NRF-2022R1F1A1073059).

Institutional Review Board Statement

Not applicable.

Informed Consent Statement

Not applicable.

Data Availability Statement

The original contributions presented in the study are included in the article, further inquiries can be directed to the corresponding author.

Conflicts of Interest

The authors declare no conflicts of interest.

References

  1. Chang, I.-S.; Zhao, M.; Chen, Y.; Guo, X.; Zhu, Y.; Wu, J.; Yuan, T. Evaluation on the integrated water resources management in China’s major cities—Based on City Blueprint® Approach. J. Clean. Prod. 2020, 262, 121410. [Google Scholar] [CrossRef]
  2. Scholz, M.; Grabowiecki, P. Review of permeable pavement systems. Build. Environ. 2007, 42, 3830–3836. [Google Scholar] [CrossRef]
  3. Kim, J.S.; Kwon, I.S.; Yoon, S.E.; Lee, J.T. An Experimental Study for Clogging Factors Estimation of Grate Inlets in Urban Area. J. Korean Soc. Civ. Engineering. 2006, 26, 179–186. [Google Scholar]
  4. Yazdi, J.; Lee, E.H.; Kim, J.H. Stochastic Multiobjective Optimization Model for Urban Drainage Network Rehabilitation. J. Water Resour. Plannning Manag. 2015, 141, 04014091. [Google Scholar] [CrossRef]
  5. Zhou, Q. A Review of Sustainable Urban Drainage Systems Considering the Climate Change and Urbanization Impacts. Water 2014, 6, 976–992. [Google Scholar] [CrossRef]
  6. Graham, A.; Day, J.; Bray, B.; Mackenzie, S. Sustainable Drainage Systems: Maximizing the Potential for People and Wildlife; RSPB: Sandy, UK, 2012; Available online: https://www.wwt.org.uk/uploads/documents/2019-07-22/1563785657-wwt-rspb-sustainable-drainage-systems-guide.pdf (accessed on 28 June 2024).
  7. Prince George’s County, Maryland, Department of Environmental Resources, Programs and Planning Division. Low-Impact Development Design Strategies. 1999. Available online: https://www.princegeorgescountymd.gov/sites/default/files/media-document/dcv86_low-impact-development-design-strategies-pdf.pdf (accessed on 28 June 2024).
  8. Loc, H.H.; Duyen, P.M.; Ballatore, T.J.; Lan, N.H.M.; Gupta, A.D. Applicability of sustainable urban drainage systems: An evaluation by multi–criteria analysis. Env. Syst. Decis. 2017, 37, 332–343. [Google Scholar] [CrossRef]
  9. Bouarafa, S.; Lassabatere, L.; Lipeme–Kouyi, G.; Angulo–Jaramillo, R. Hydrodynamic Characterization of Sustainable Urban Drainage Systems (SuDS) by Using Beerkan Infiltration Experiments. Water 2019, 11, 660. [Google Scholar] [CrossRef]
  10. Guptha, G.C.; Swain, S.; Al–Ansari, N.; Taloor, A.K.; Dayal, D. Assessing the role of SuDS in resilience enhancement of urban drainage system: A case study of Gurugram City, India. Urban Clim. 2022, 41, 101075. [Google Scholar] [CrossRef]
  11. Joshi, P.; Leitão, J.P.; Maurer, M.; Bach, P.M. Not all SuDS are created equal: Impact of different approaches on combined sewer overflows. Water Res. 2021, 191, 116780. [Google Scholar] [CrossRef]
  12. Abbott, C.L.; Comino-Mateos, L. In-situ hydraulic performance of a permeable pavement sustainable urban drainage system. J. Chart. Inst. Water Environ. Manag. 2003, 17, 187–190. [Google Scholar] [CrossRef]
  13. Gómez, M.; Parés, J.; Russo, B.; Martínez–Gomariz, E. Methodology to quantify clogging coefficients for grated inlets: Application to SANT MARTI catchment (Barcelona). J. Flood Risk Manag. 2019, 12, 1–12. [Google Scholar] [CrossRef]
  14. Almedeij, J.; Alsulaili, A.; Alhomoud, J. Assessment of grate sag inlets in a residential area based on return period and clogging factor. J. Environ. Manag. 2006, 79, 38–42. [Google Scholar] [CrossRef]
  15. Jang, S.J.; Song, I.J.; Kim, J.S.; Yoon, S.E. Design of Street Grate Inlets with Consideration of Clogging Condition. J. Korean Soc. Civ. Eng. 2006, 26, 1251–1255. [Google Scholar]
  16. Baek, S.-Y.; Kim, H.-W.; Kim, M.-K.; Han, M.-Y. Runoff Reduction Effect of Rainwater Retentive Green Roof. J. Korean Inst. Ecol. Archit. Environ. 2016, 16, 67–71. [Google Scholar]
  17. Hong, T.; Ji, C. Comparison of the CO2 Emissions of Buildings using Input–Output LCA Model and Hybrid LCA Model. J. Korea Constr. Eng. Manag. 2014, 15, 119–127. [Google Scholar]
  18. Yeom, S.; Lee, J.; Choi, I.; Kim, Y.; Ahn, J. Environmental and Economical Evaluation of Infiltration Type Rainwater Drainage System for Sustainable Development. J. Korea Acad. Ind. Coop. Soc. 2024, 25, 314–320. [Google Scholar]
  19. Ahn, J.; Yeom, S.; Park, S.; Nguyen, T.H.T. Evaluation of Infiltration Rainwater Drainage (IRD) System with Fully 3-D Numerical Simulation Approach. Appl. Sci. 2021, 11, 9144. [Google Scholar] [CrossRef]
  20. Kim, Y.W.; Hwang, Y.W.; Kim, Y.I.; Gong, Y.J.; Lim, S.N. Evaluation of Greenhouse Gas Emissions on Sustainable Rain Water Collection System. Korean J. Life Cycle Assess. 2018, 19, 1–13. [Google Scholar]
  21. Seong, H.; Rhee, D.S.; Park, I. Analysis of Urban Flood Inundation Patterns According to Rainfall Intensity Using a Rainfall Simulator in the Sadang Area of South Korea. Appl. Sci. 2020, 10, 1158. [Google Scholar] [CrossRef]
  22. Im, J.H.; Song, J.W.; Park, Y.J. An Experimental Study on Improvement of the Effect for Runoff Reducing Facilities Using Infiltration. J. Korean Soc. Civ. Eng. 2009, 10, 5–13. [Google Scholar]
  23. Alsubih, M.; Arthur, S.; Wright, G.; Allen, D. Experimental study on the hydrological performance of a permeable pavement. Urban Water J. 2017, 14, 427–434. [Google Scholar] [CrossRef]
  24. Russo, B.; Gómez Valentín, M.; Tellez–Álvarez, J. The Relevance of Grated Inlets within Surface Drainage Systems in the Field of Urban Flood Resilience: A Review of Several Experimental and Numerical Simulation Approaches. Sustainability 2021, 13, 7189. [Google Scholar] [CrossRef]
  25. Du, S.; Shi, P.; Van Rompaey, A.; Wen, J. Quantifying the impact of impervious surface location on flood peak discharge in urban areas. Nat. Hazards 2015, 76, 1457–1471. [Google Scholar] [CrossRef]
  26. Kim, T.-H.; Park, J.-H.; Choi, B.-H. Analysis of Rainfall Runoff Delay Effect of Vegetation Unit-type LID System through Rainfall Simulator–based Probable Rainfall Recreation. J. Korean Env. Res. Tech. 2019, 22, 115–124. [Google Scholar]
Figure 1. Example of clogging on a grate inlet. (a) Complete clogging on road; (b) partial clogging on O-shaped channel.
Sustainability 16 07596 g001
Figure 2. Schematic diagram of IRDs [19].
Sustainability 16 07596 g002
Figure 3. Diagram of physical model: (a) components; (b) specification of surface area.
Sustainability 16 07596 g003
Figure 4. Detail of grate inlet: (a) OCs; (b) IRDs.
Sustainability 16 07596 g004
Figure 5. Detail of surface area: (a) specification of pavement; (b) result of sieve test.
Sustainability 16 07596 g005
Figure 6. Diagram and example of clogging types: (a) Expansion-type clogging; (b) Contraction-type clogging; (c) example of Contraction-type clogging; (d) example of Expansion-type clogging.
Sustainability 16 07596 g006
Figure 7. Flowchart of experimental study.
Sustainability 16 07596 g007
Figure 8. Measurement of runoff. (a) OCs; (b) IRDs.
Sustainability 16 07596 g008
Figure 9. Measurement of surface water depth. (a) IN30; (b) IN60; (c) IN90.
Sustainability 16 07596 g009
Figure 10. Accumulative discharge of physical model: (a) IRDs-E; (b) IRDs-C; (c) OCs-E; (d) OCs-C.
Sustainability 16 07596 g010
Figure 11. Comparison of peak time, Tp.
Sustainability 16 07596 g011
Figure 12. Dimensionless comparison of T*.
Sustainability 16 07596 g012
Table 1. Experimental conditions.
Clogging TypeRainfall Intensity, IN
(mm/h)
Clogging Ratio, A
(%)
Drainage System
IRDsOCs
Contraction, C300
90
95
100
IN30A0IN30A0
IN30A90EIN30A90E
IN30A95EIN30A95E
IN30A100-
IN60A0IN60A0
IN60A90EIN60A90E
60IN60A95EIN60A95E
IN60A100-
IN900A0IN900A0
Expansion, EIN90A90EIN90A90E
IN90A95EIN90A95E
IN90A100-
90IN30A90CIN30A90C
IN30A95CIN30A95C
IN60A90CIN60A90C
IN60A95CIN60A95C
IN90A90CIN90A90C
IN90A95CIN90A95C
Table 2. Surface water depth.
CE
IN306090306090
906.07.07.04.54.07.0
957.07.07.57.07.07.5
Table 3. Peak discharge and peak time of OCs.
Case No.EC
Peak Discharge, Qpo
(m3/s)
Peak Time, Tpo
(min)
Peak Discharge, Qpo
(m3/s)
Peak Time, Tpo
(min)
IN30A05.00   ×   10−53.175.00   ×   10−53.17
IN30A905.00   ×   10−54.675.00   ×   10−55.17
IN30A955.00   ×   10−54.085.00   ×   10−53.5
IN60A01.00   ×   10−43.081.00   ×   10−43.08
IN60A901.00   ×   10−44.751.00   ×   10−45.25
IN60A951.00   ×   10−45.501.00   ×   10−42.67
IN90A01.40   ×   10−43.331.40   ×   10−43.33
IN90A901.40   ×   10−44.831.40   ×   10−44.75
IN90A951.40   ×   10−45.081.40   ×   10−43.17
Table 4. Peak discharge and peak time of IRDs.
Case No.EC
Peak Discharge, Qpi
(m3/s)
Peak Time, Tpi
(min)
Peak Discharge, Qpi
(m3/s)
Peak Time, Tpi
(min)
IN30A05.00   ×   10−514.005.00   ×   10−514.00
IN30A905.00   ×   10−513.835.00   ×   10−516.75
IN30A955.00   ×   10−516.175.00   ×   10−512.92
IN30A1005.00   ×   10−518.255.00   ×   10−518.25
IN60A01.00   ×   10−414.671.00   ×   10−414.67
IN60A901.00   ×   10−413.751.00   ×   10−413.50
IN60A951.00   ×   10−415.171.00   ×   10−415.25
IN60A1001.00   ×   10−413.171.00   ×   10−413.17
IN90A01.40   ×   10−416.421.40   ×   10−416.42
IN90A901.40   ×   10−415.751.40   ×   10−415.75
IN90A951.40   ×   10−416.921.40   ×   10−416.92
IN90A1001.40   ×   10−415.001.40   ×   10−415.00
Disclaimer/Publisher’s Note: The statements, opinions and data contained in all publications are solely those of the individual author(s) and contributor(s) and not of MDPI and/or the editor(s). MDPI and/or the editor(s) disclaim responsibility for any injury to people or property resulting from any ideas, methods, instructions or products referred to in the content.

