
A Numerical Simulation-Based Adaptation of the Pedestrian-Level Wind Environment in Village Streets: A Case Study on the Chuan Dao Area of the Hanjiang River in Southern Shaanxi


Abstract
:1. Introduction
1.1. Backgrounds
1.2. Literature Review
2. Materials and Methods
2.1. Case Overview
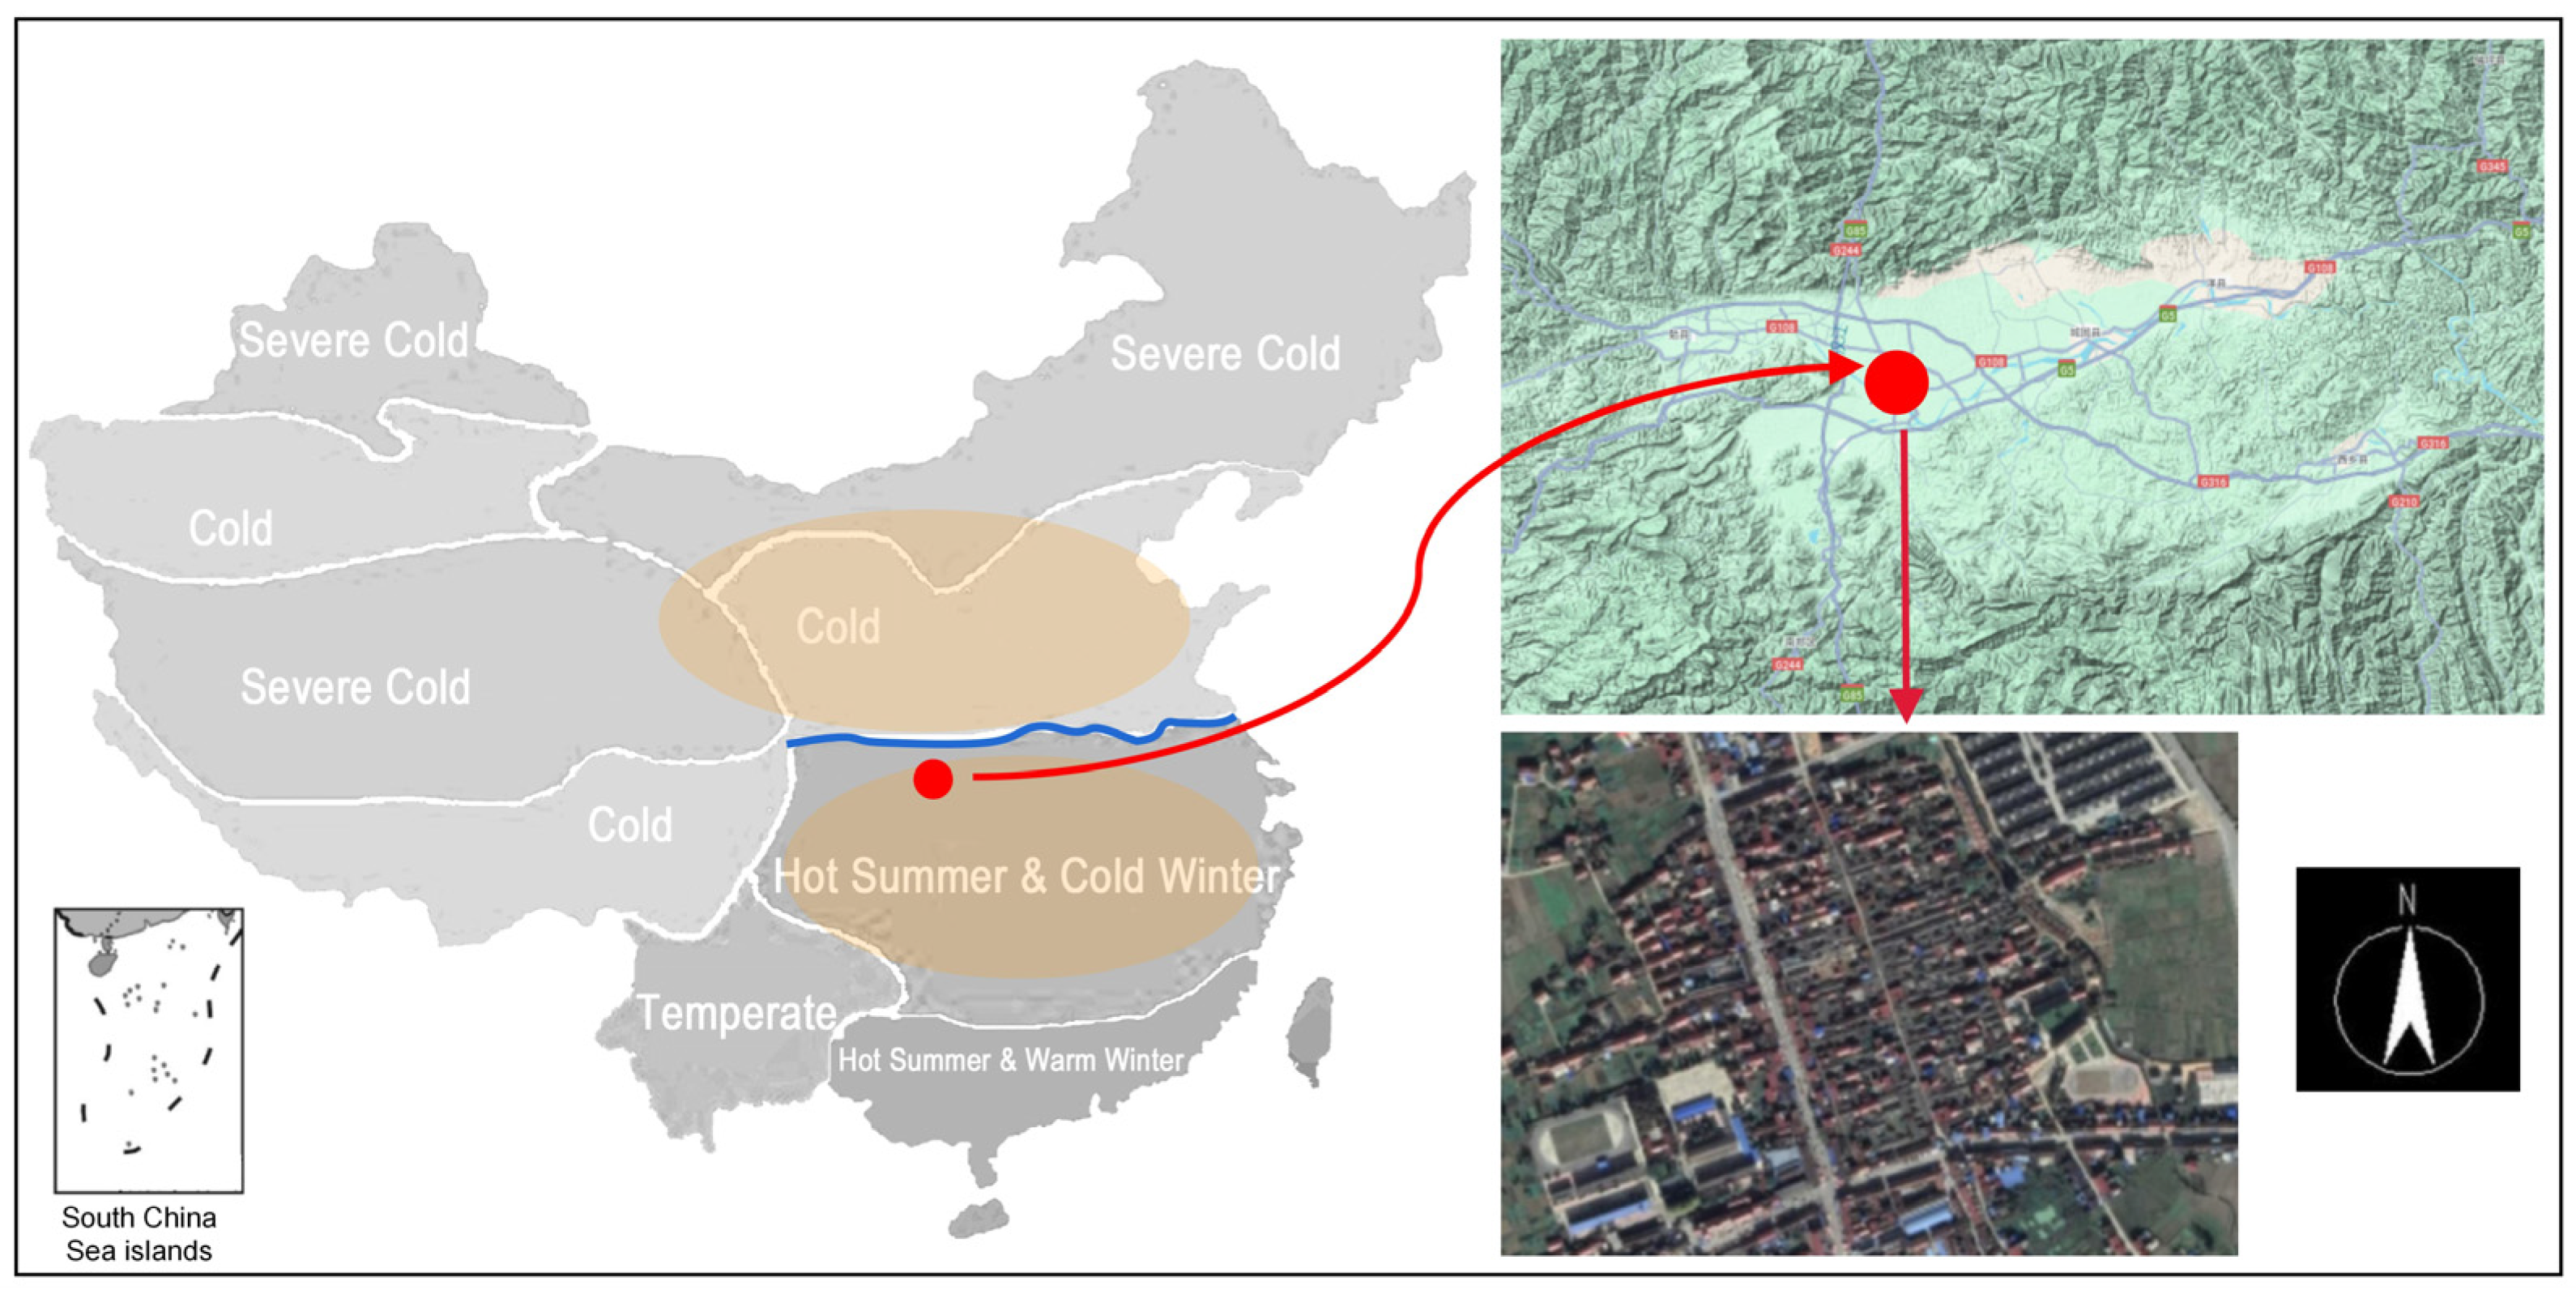
2.1.1. Study Area
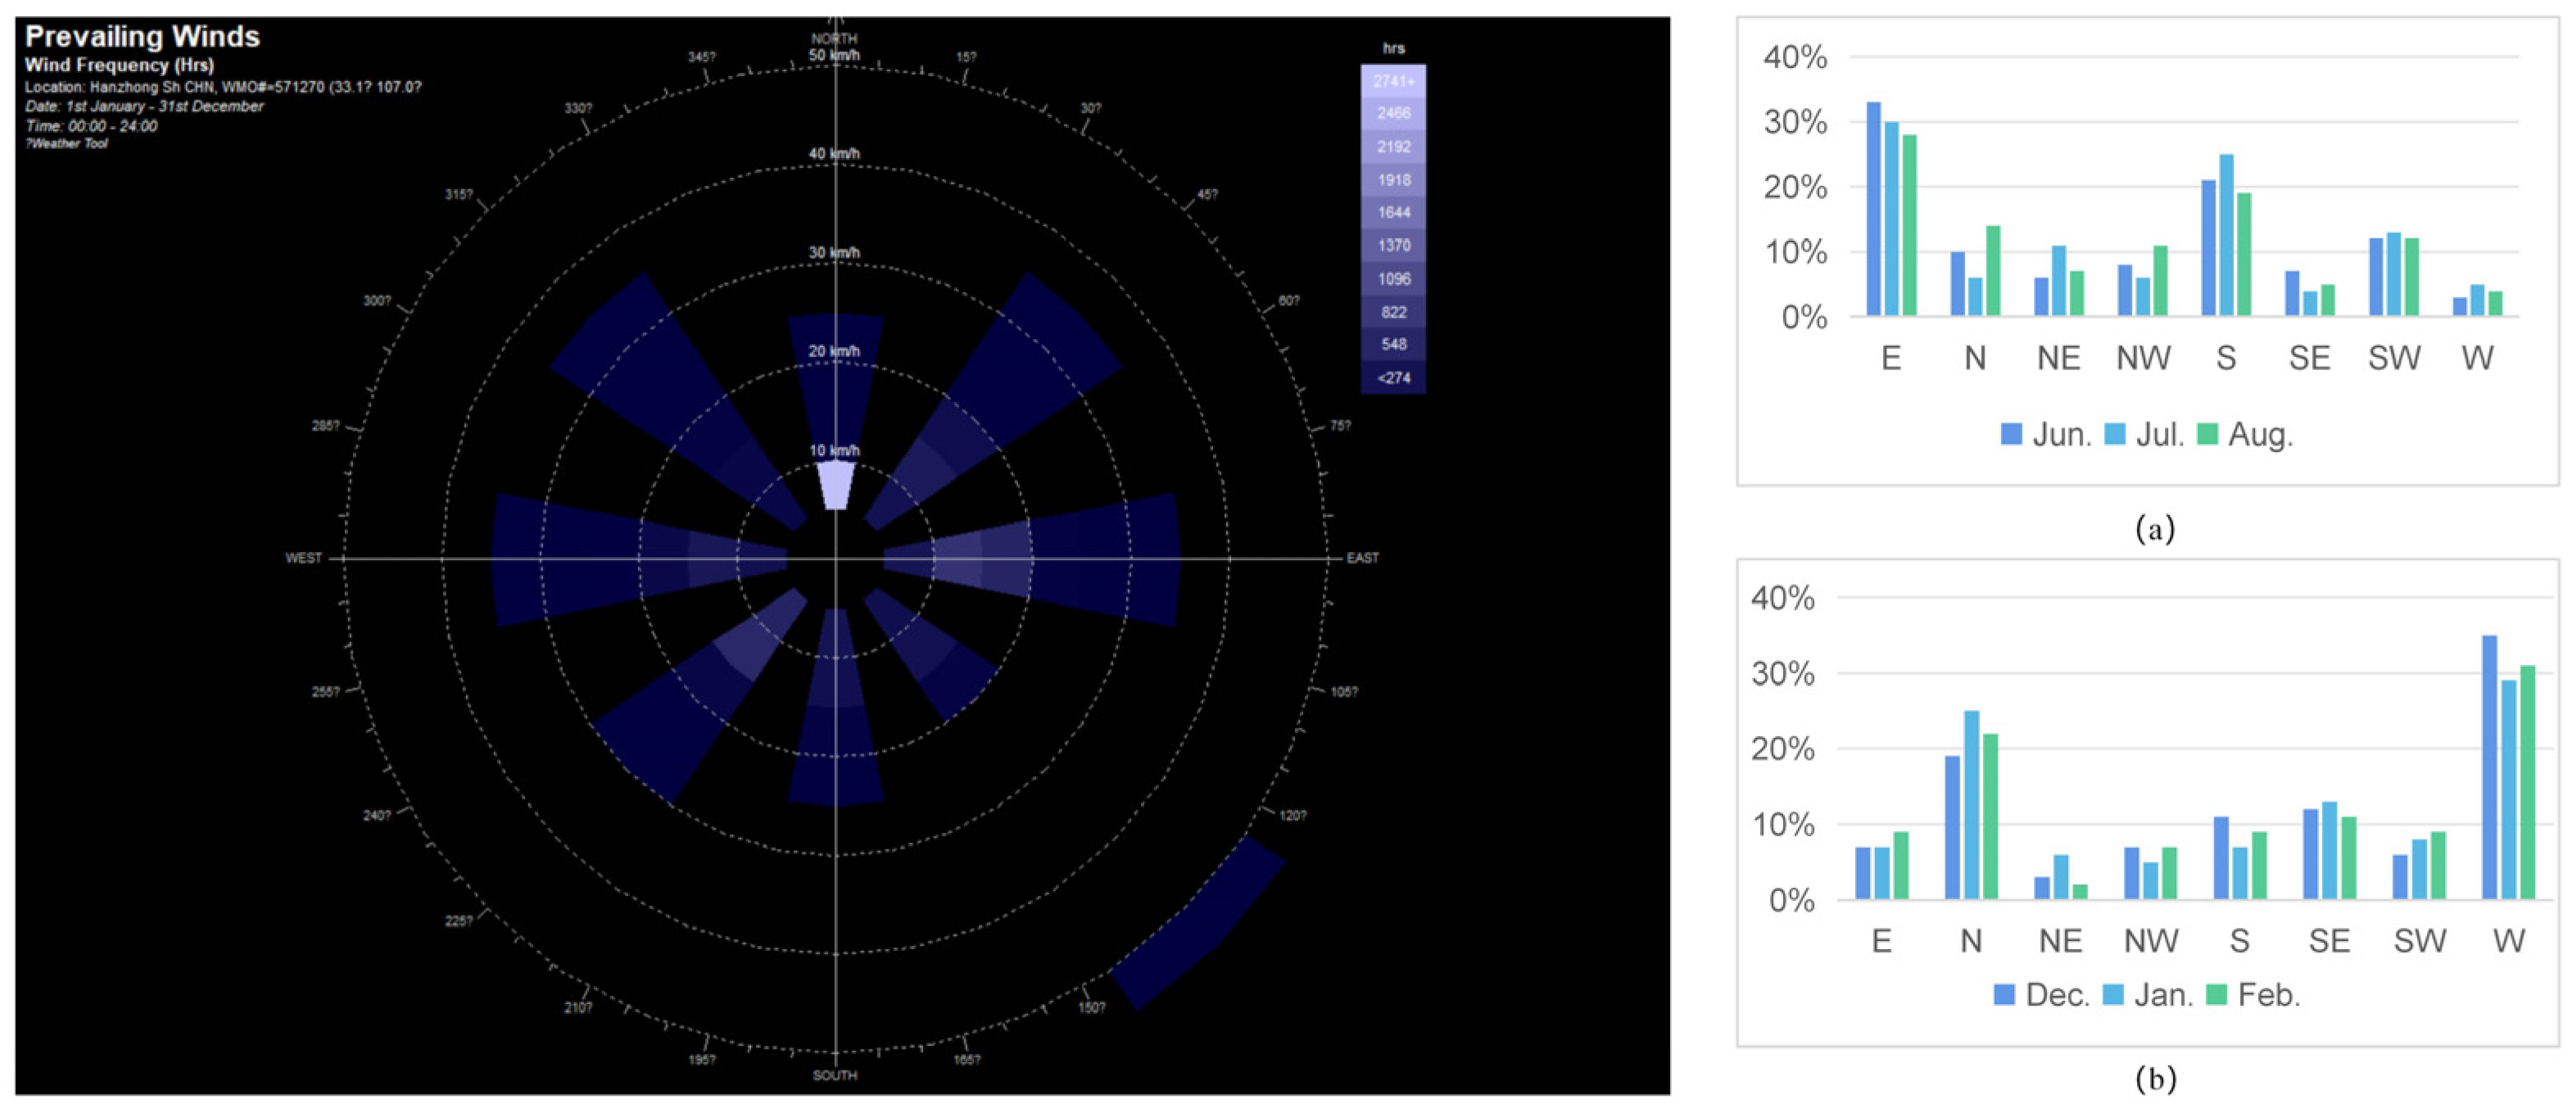
2.1.2. Climatic Characteristics
2.2. Wind Environment Evaluation Indicators
2.3. Questionnaires and Measurements
Questionnaire Survey
2.4. Wind Environment Measurement
2.5. CFD Setup and Validation
2.5.1. Software Calculation Parameter Settings
- (1)
- In the inlet direction, the length is taken as 1 times the length of the village and town;
- (2)
- In the outlet direction, the length is 3 times the length of the village;
- (3)
- In the left and right directions, the length is 3 times the length of the village;
- (4)
- In the left and right directions, the length is 3 times the width of the village and town;
- (5)
- The height is 5 times the average height of the building in the village or town.
2.5.2. Validation of Simulation Validity
2.5.3. Physical Modelling
3. Results and Discussion
3.1. Questionnaire and Measurement Results
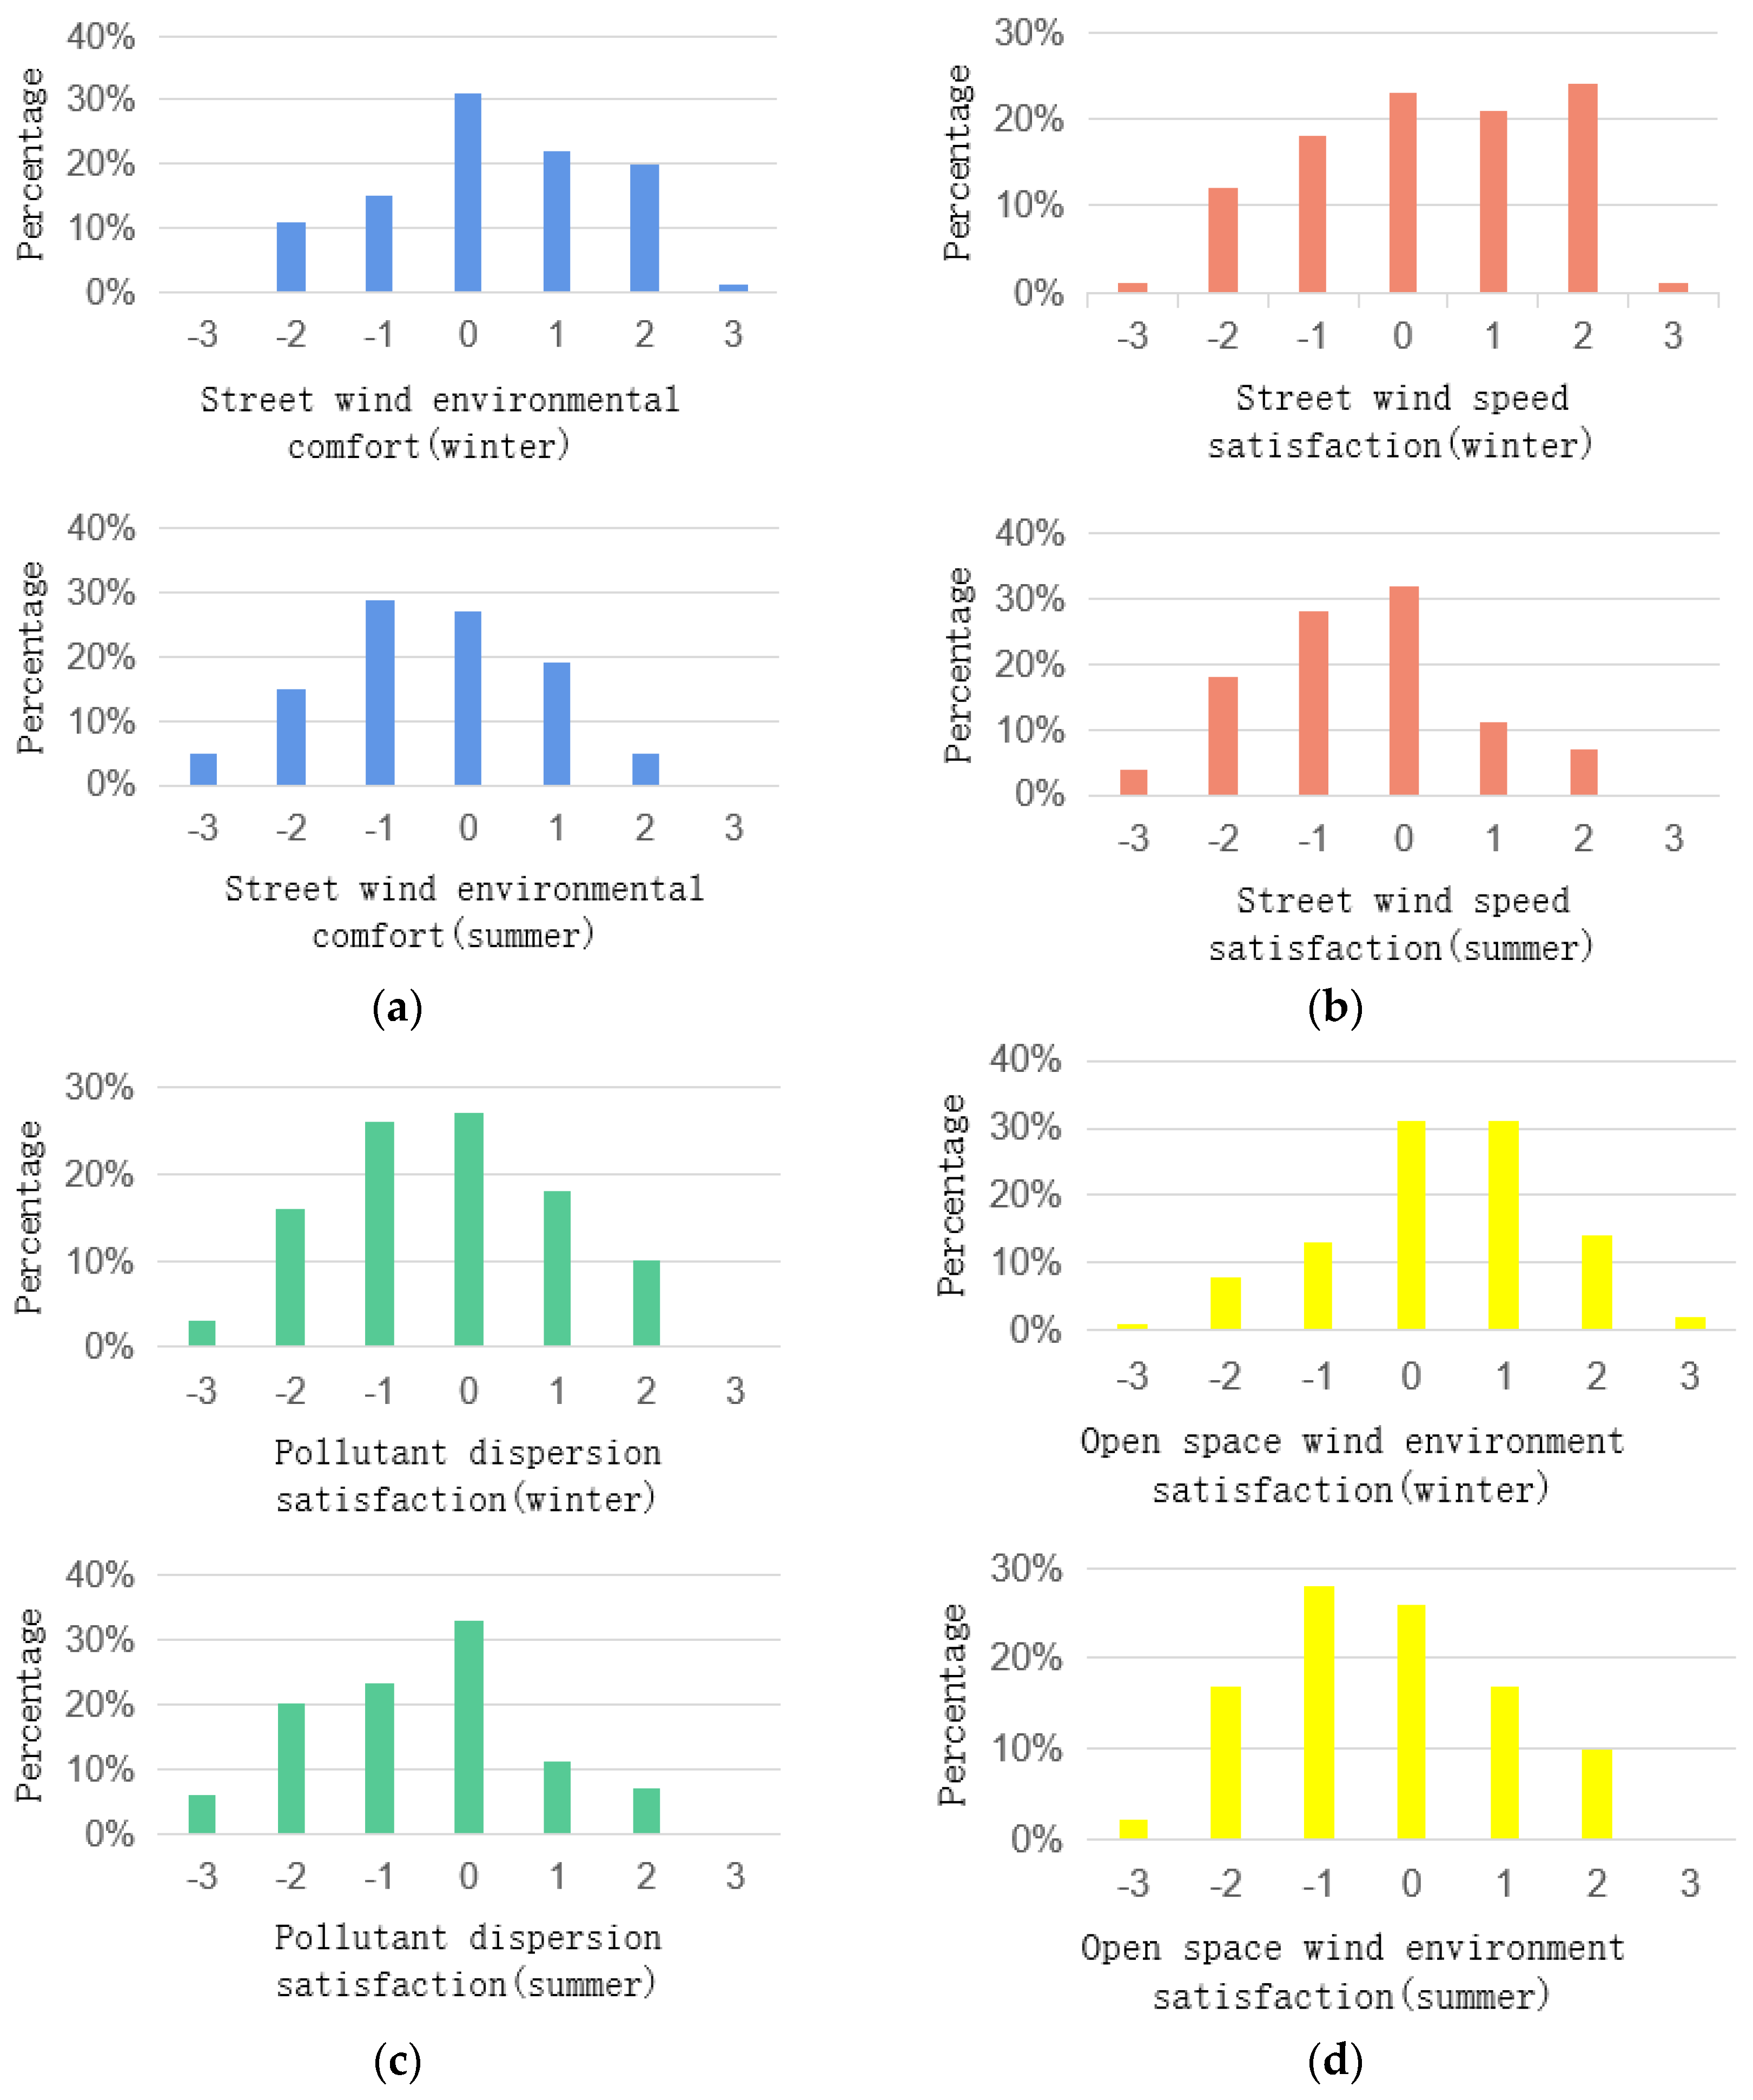
3.1.1. Questionnaire Results
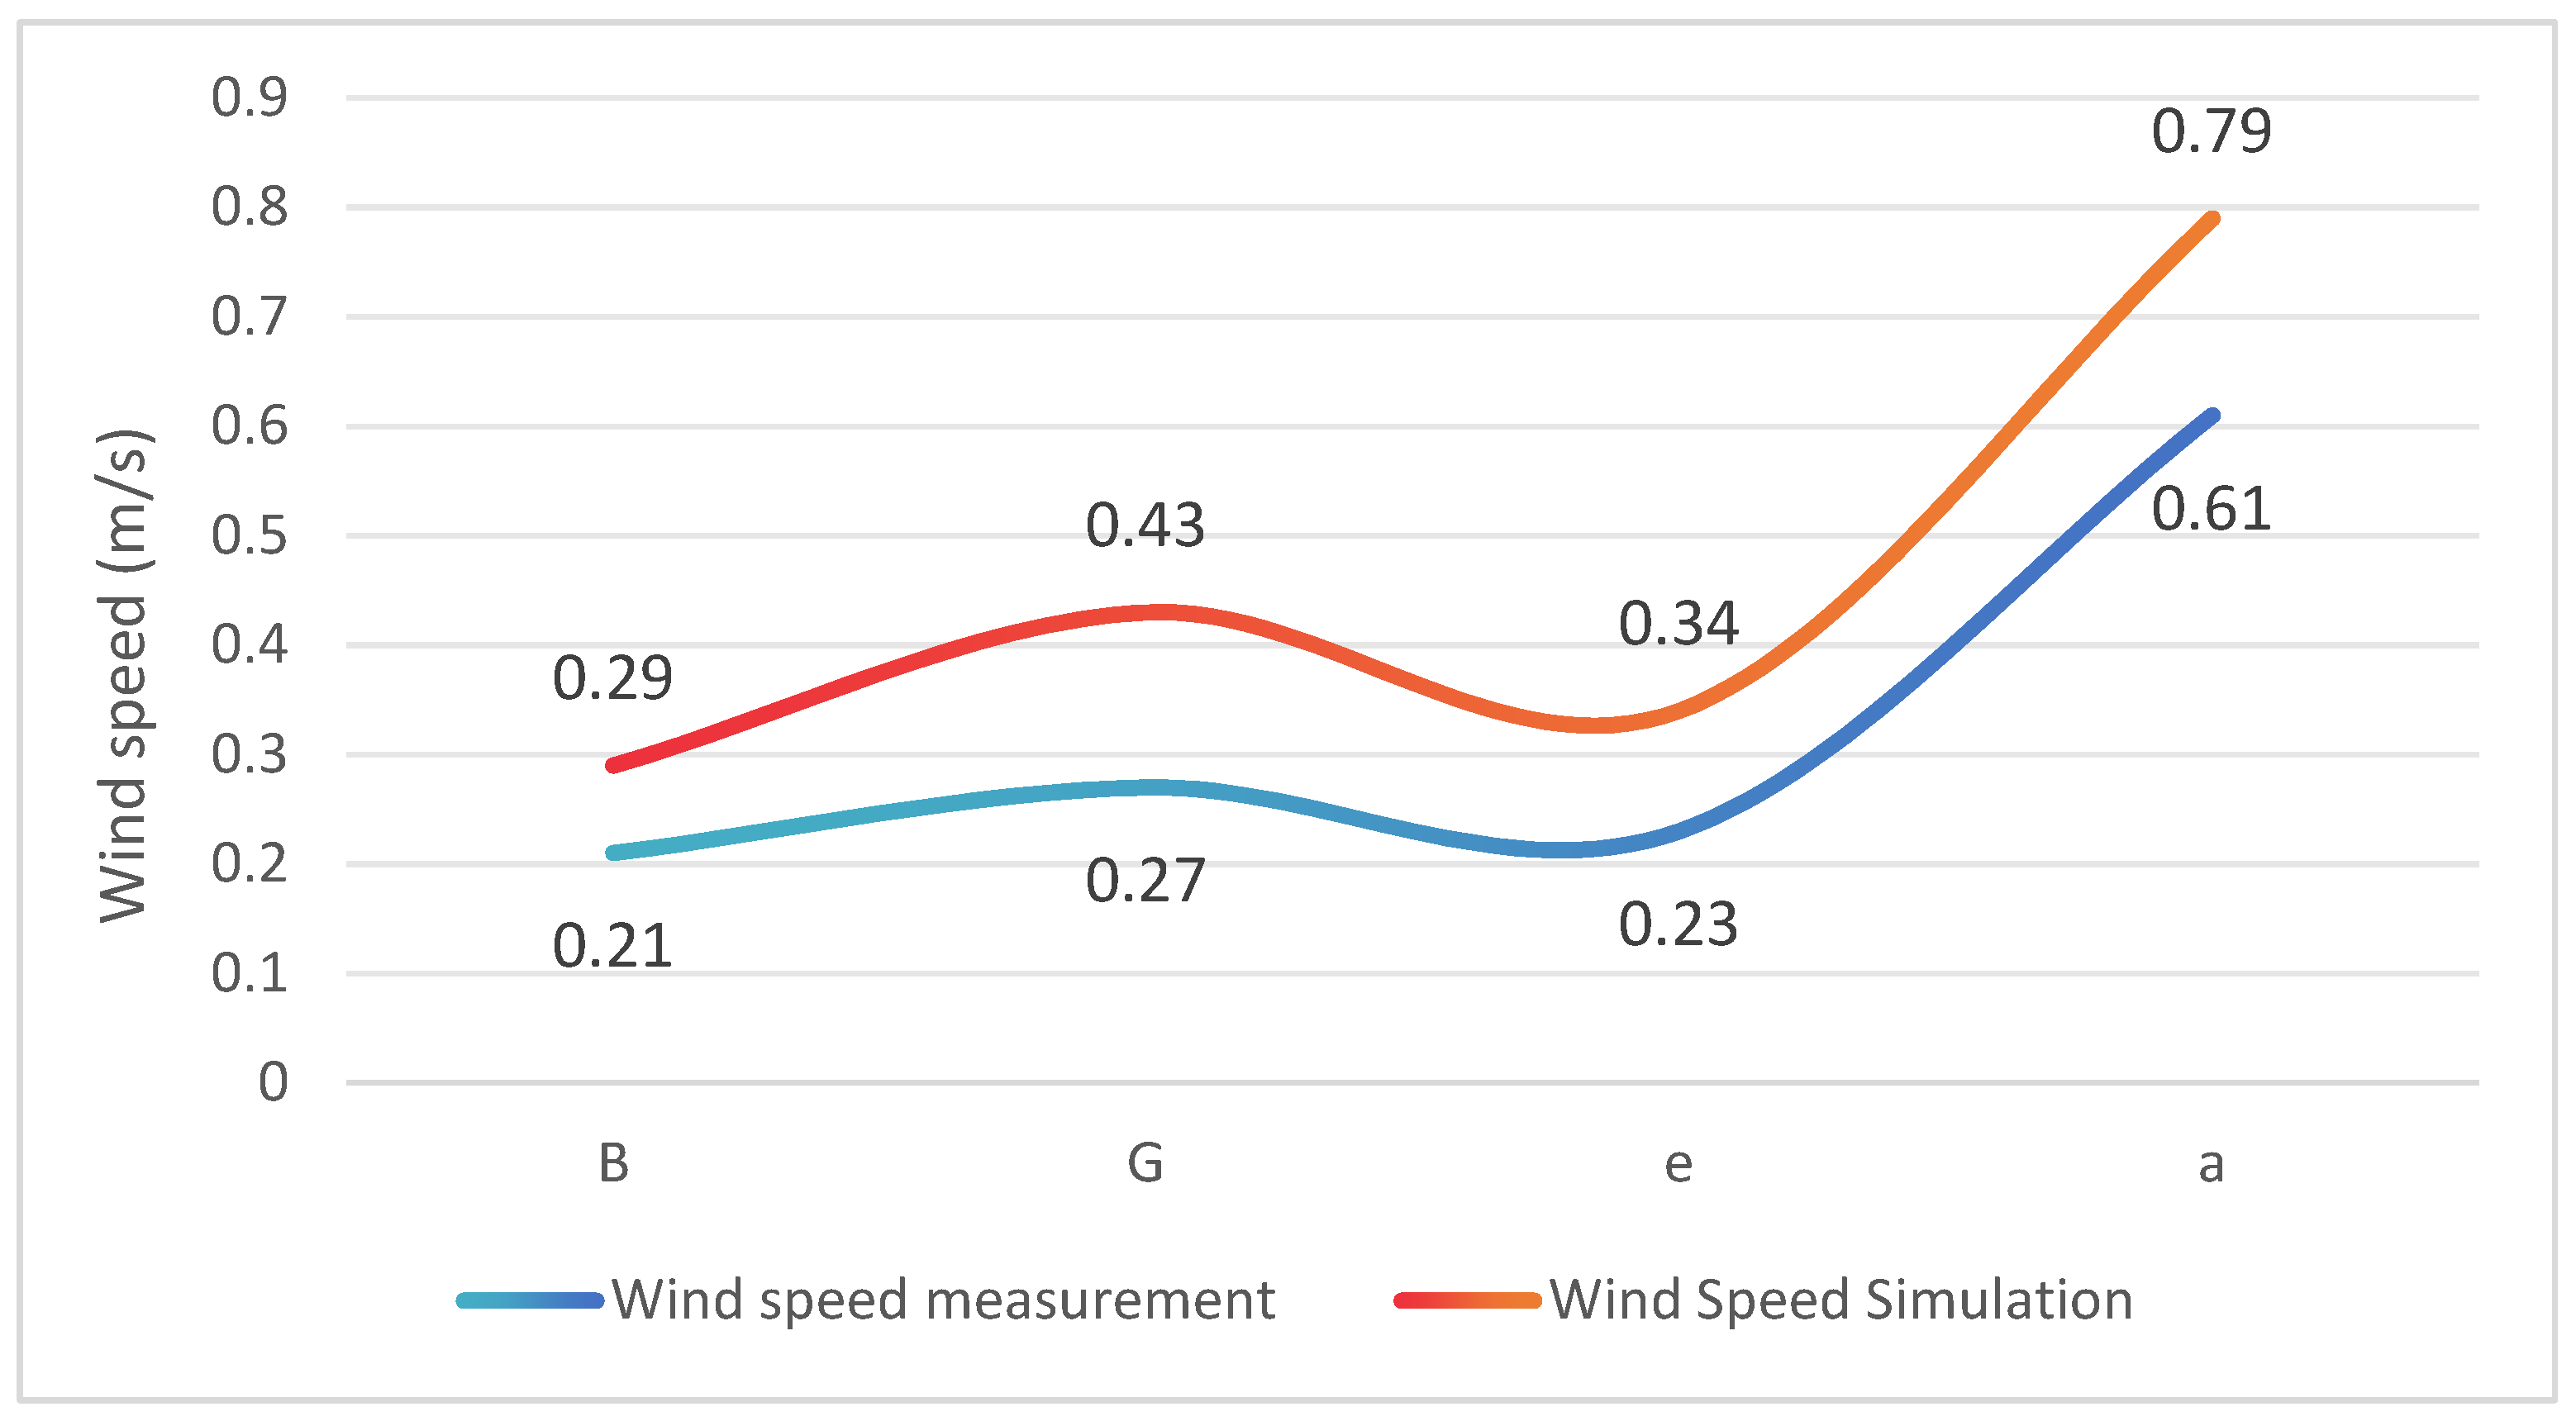
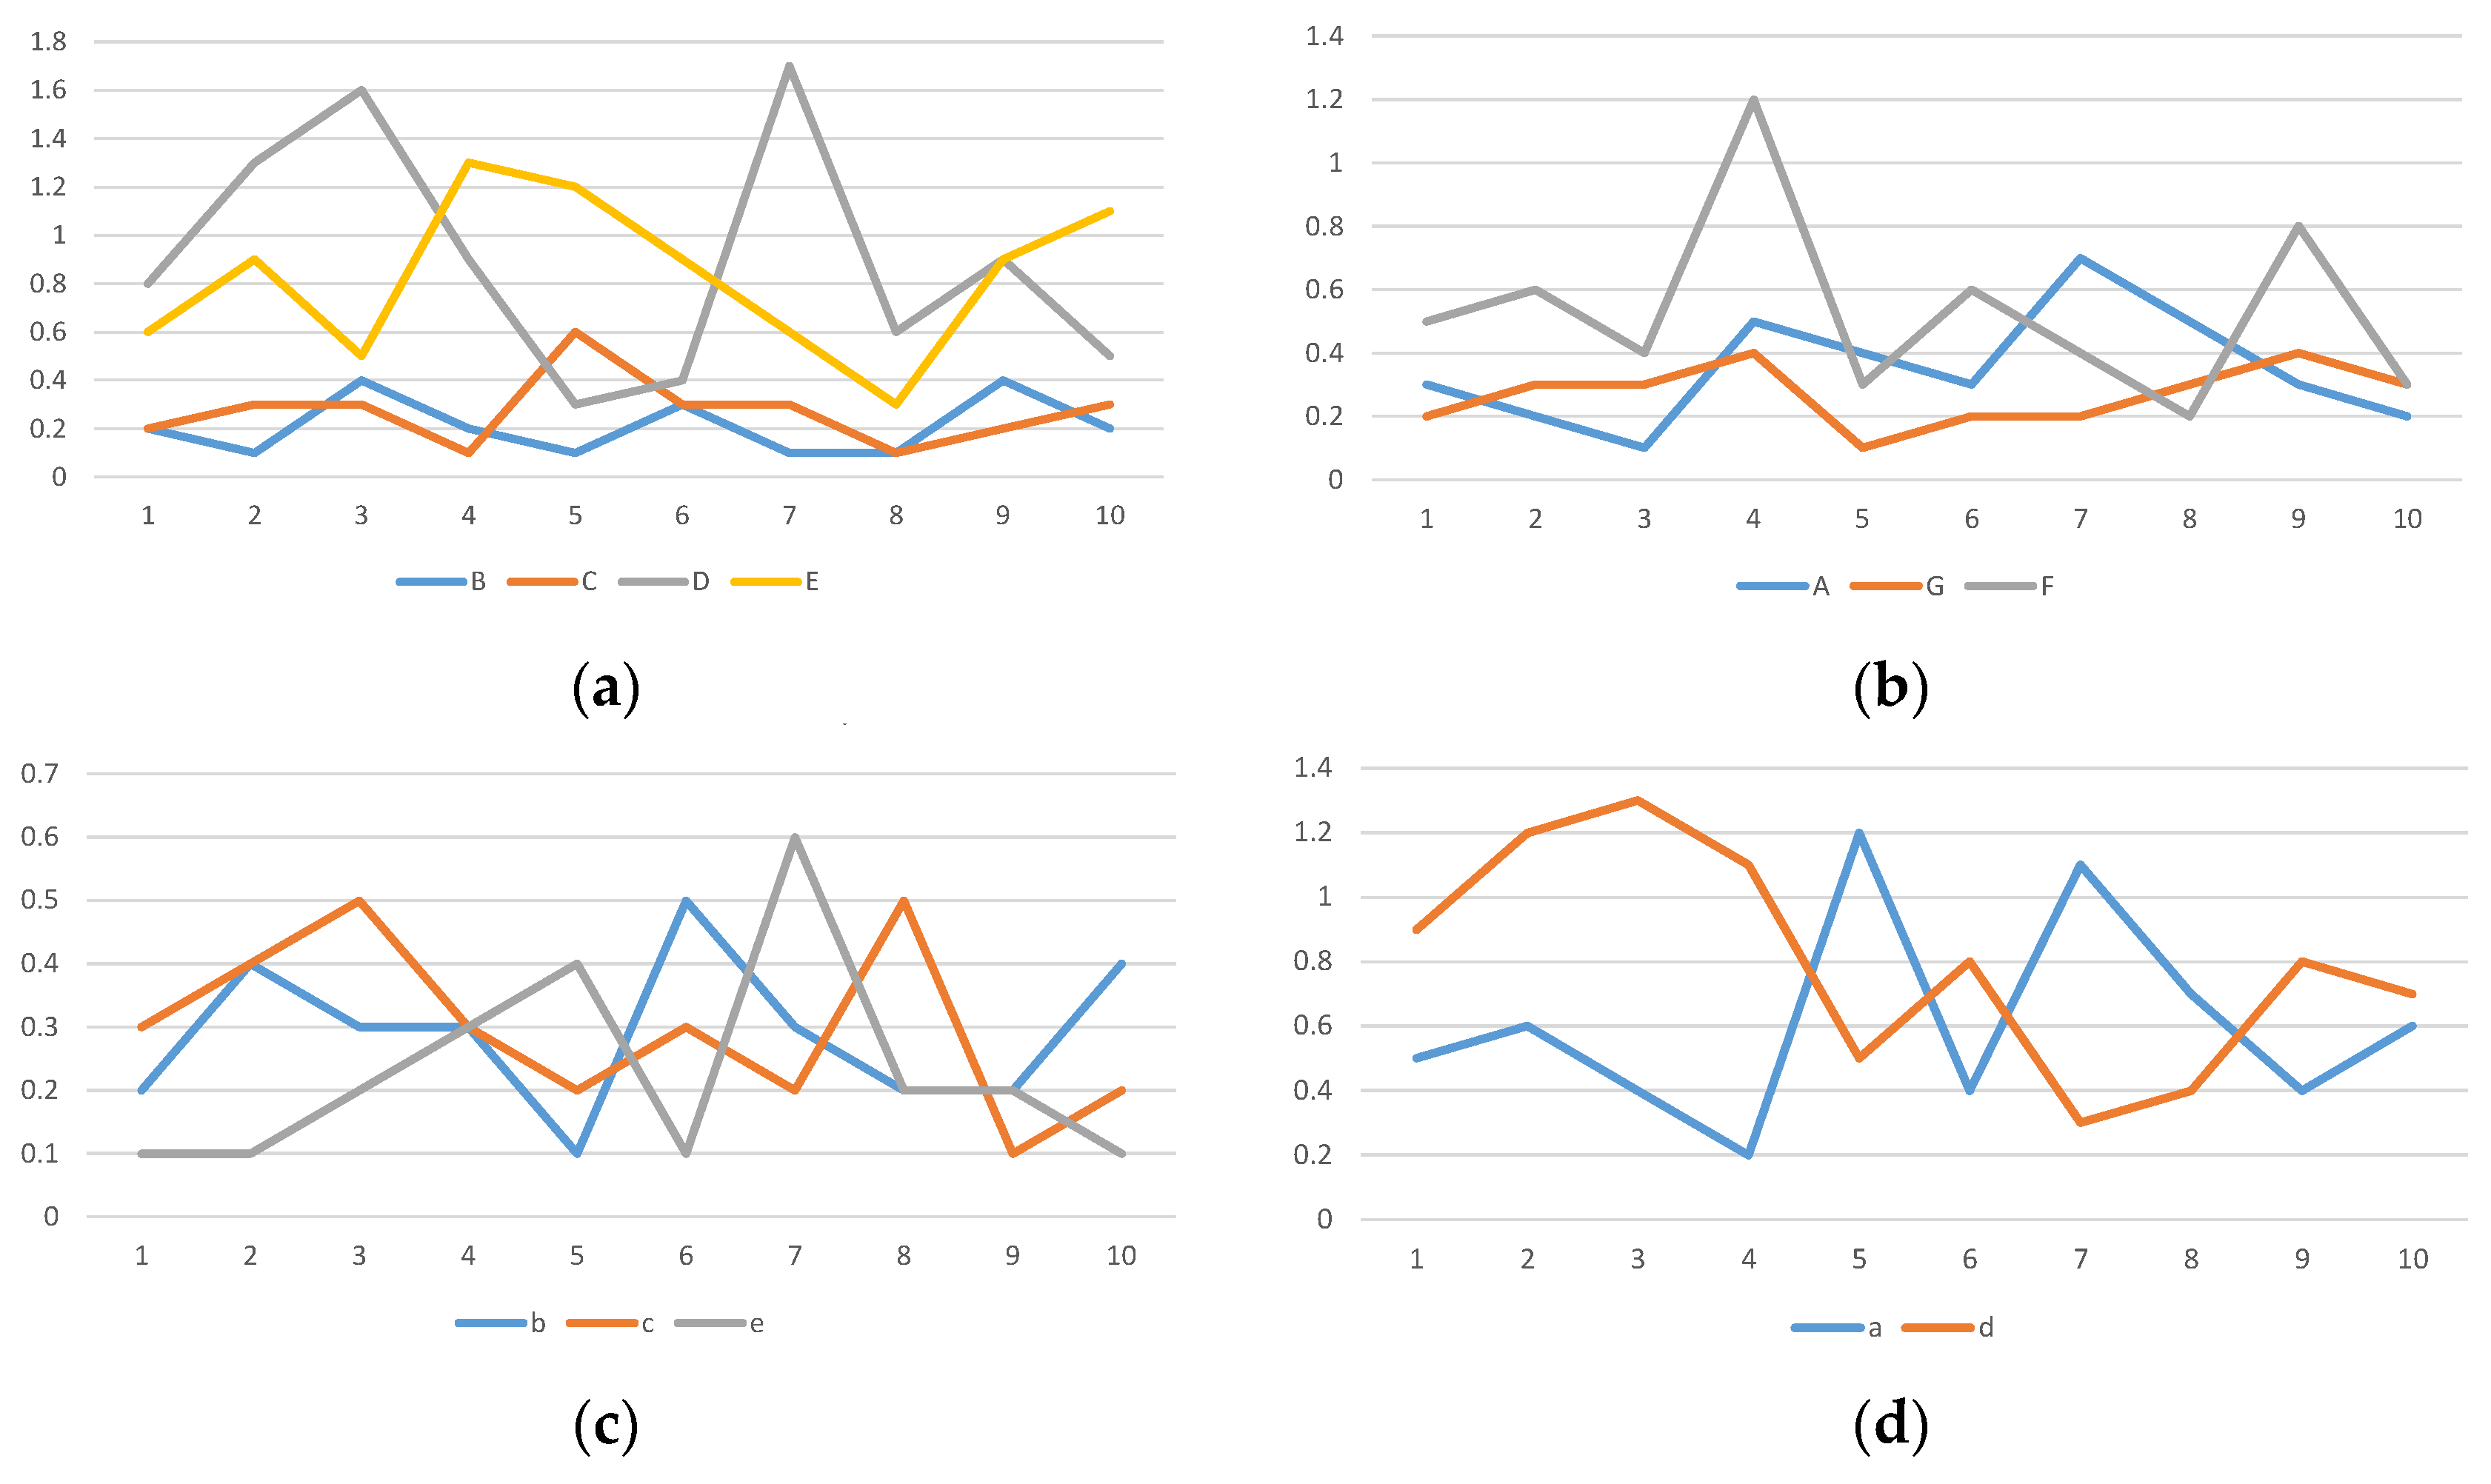
3.1.2. Wind Speed Measurement Results
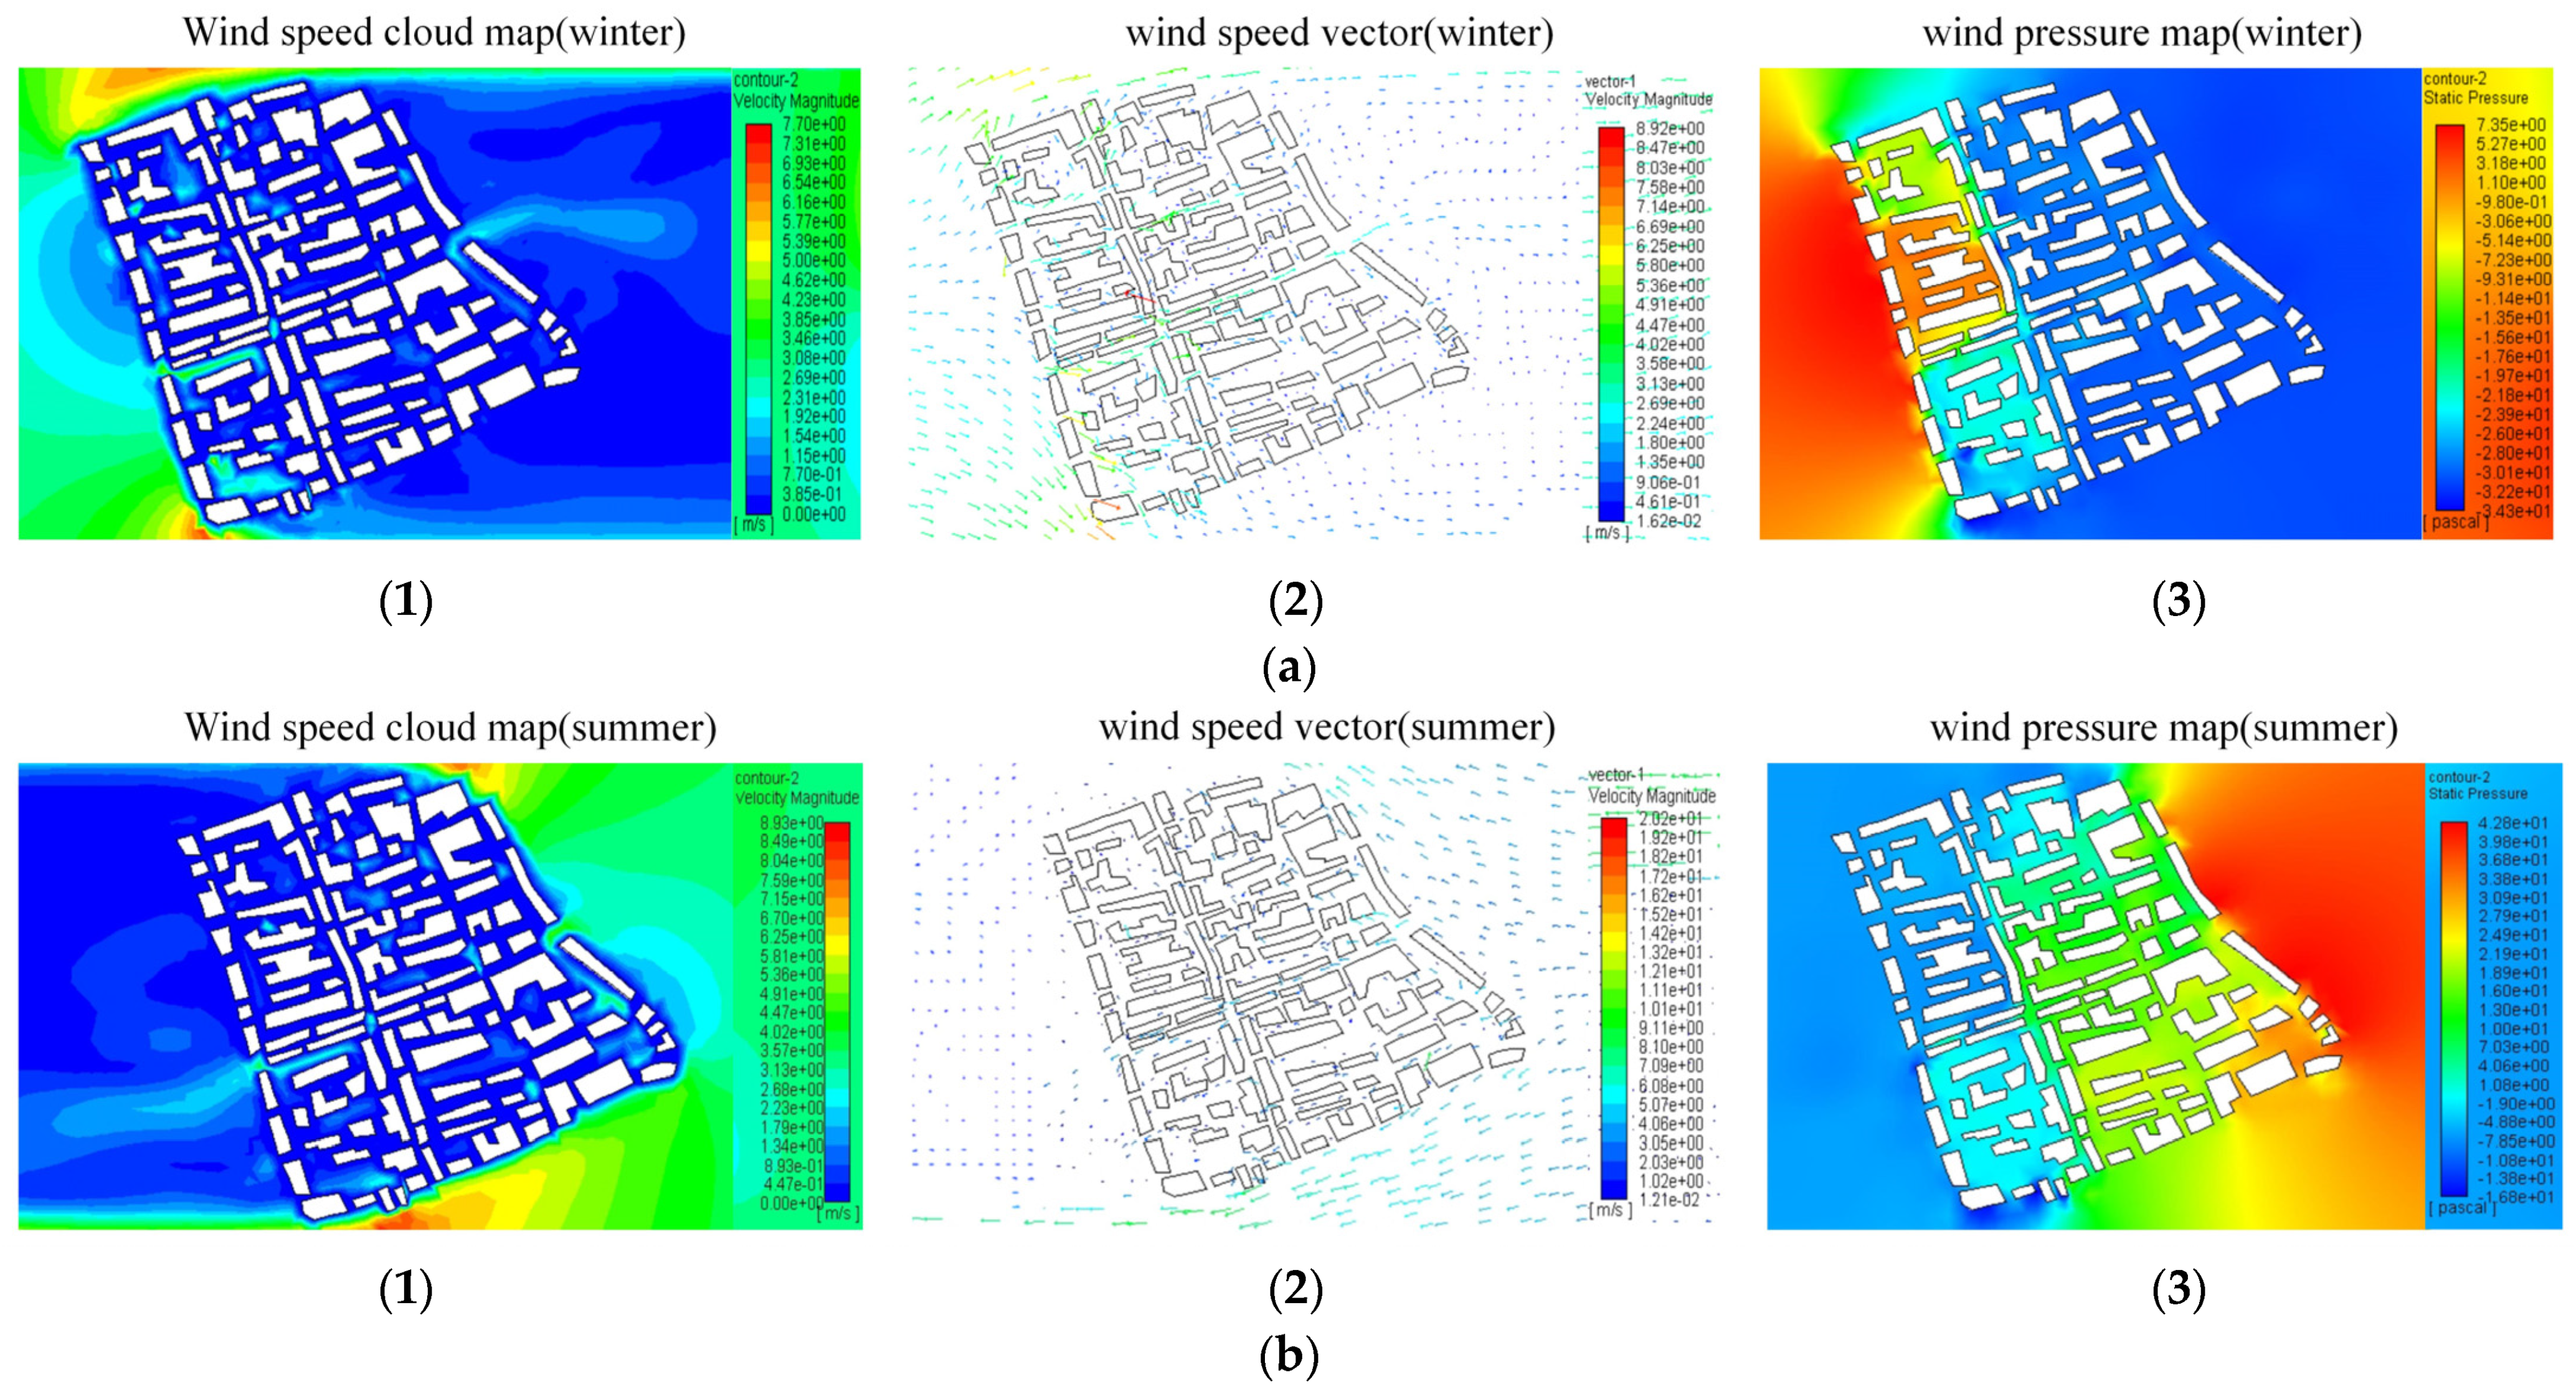
3.2. The Results of the Simulation Evaluation of the Overall Layout of Lok Fung Village
- (1)
- Evaluation based on comfortable wind speed
- (2)
- Evaluation based on wind vortex
- (3)
- Evaluation based on wind speed ratio
- (4)
- Evaluation based on air pollutant concentration
- (5)
- Wind pressure difference
3.3. Results of Street Crossing from Simulation Evaluation
- (1)
- Evaluation of wind environment of cross form of “I”-shaped streets and alleys
- (2)
- Evaluation of wind environment of “T”-shaped street crossings
- (3)
- An evaluation of the wind environment in the form of street crossings in the shape of an “X”
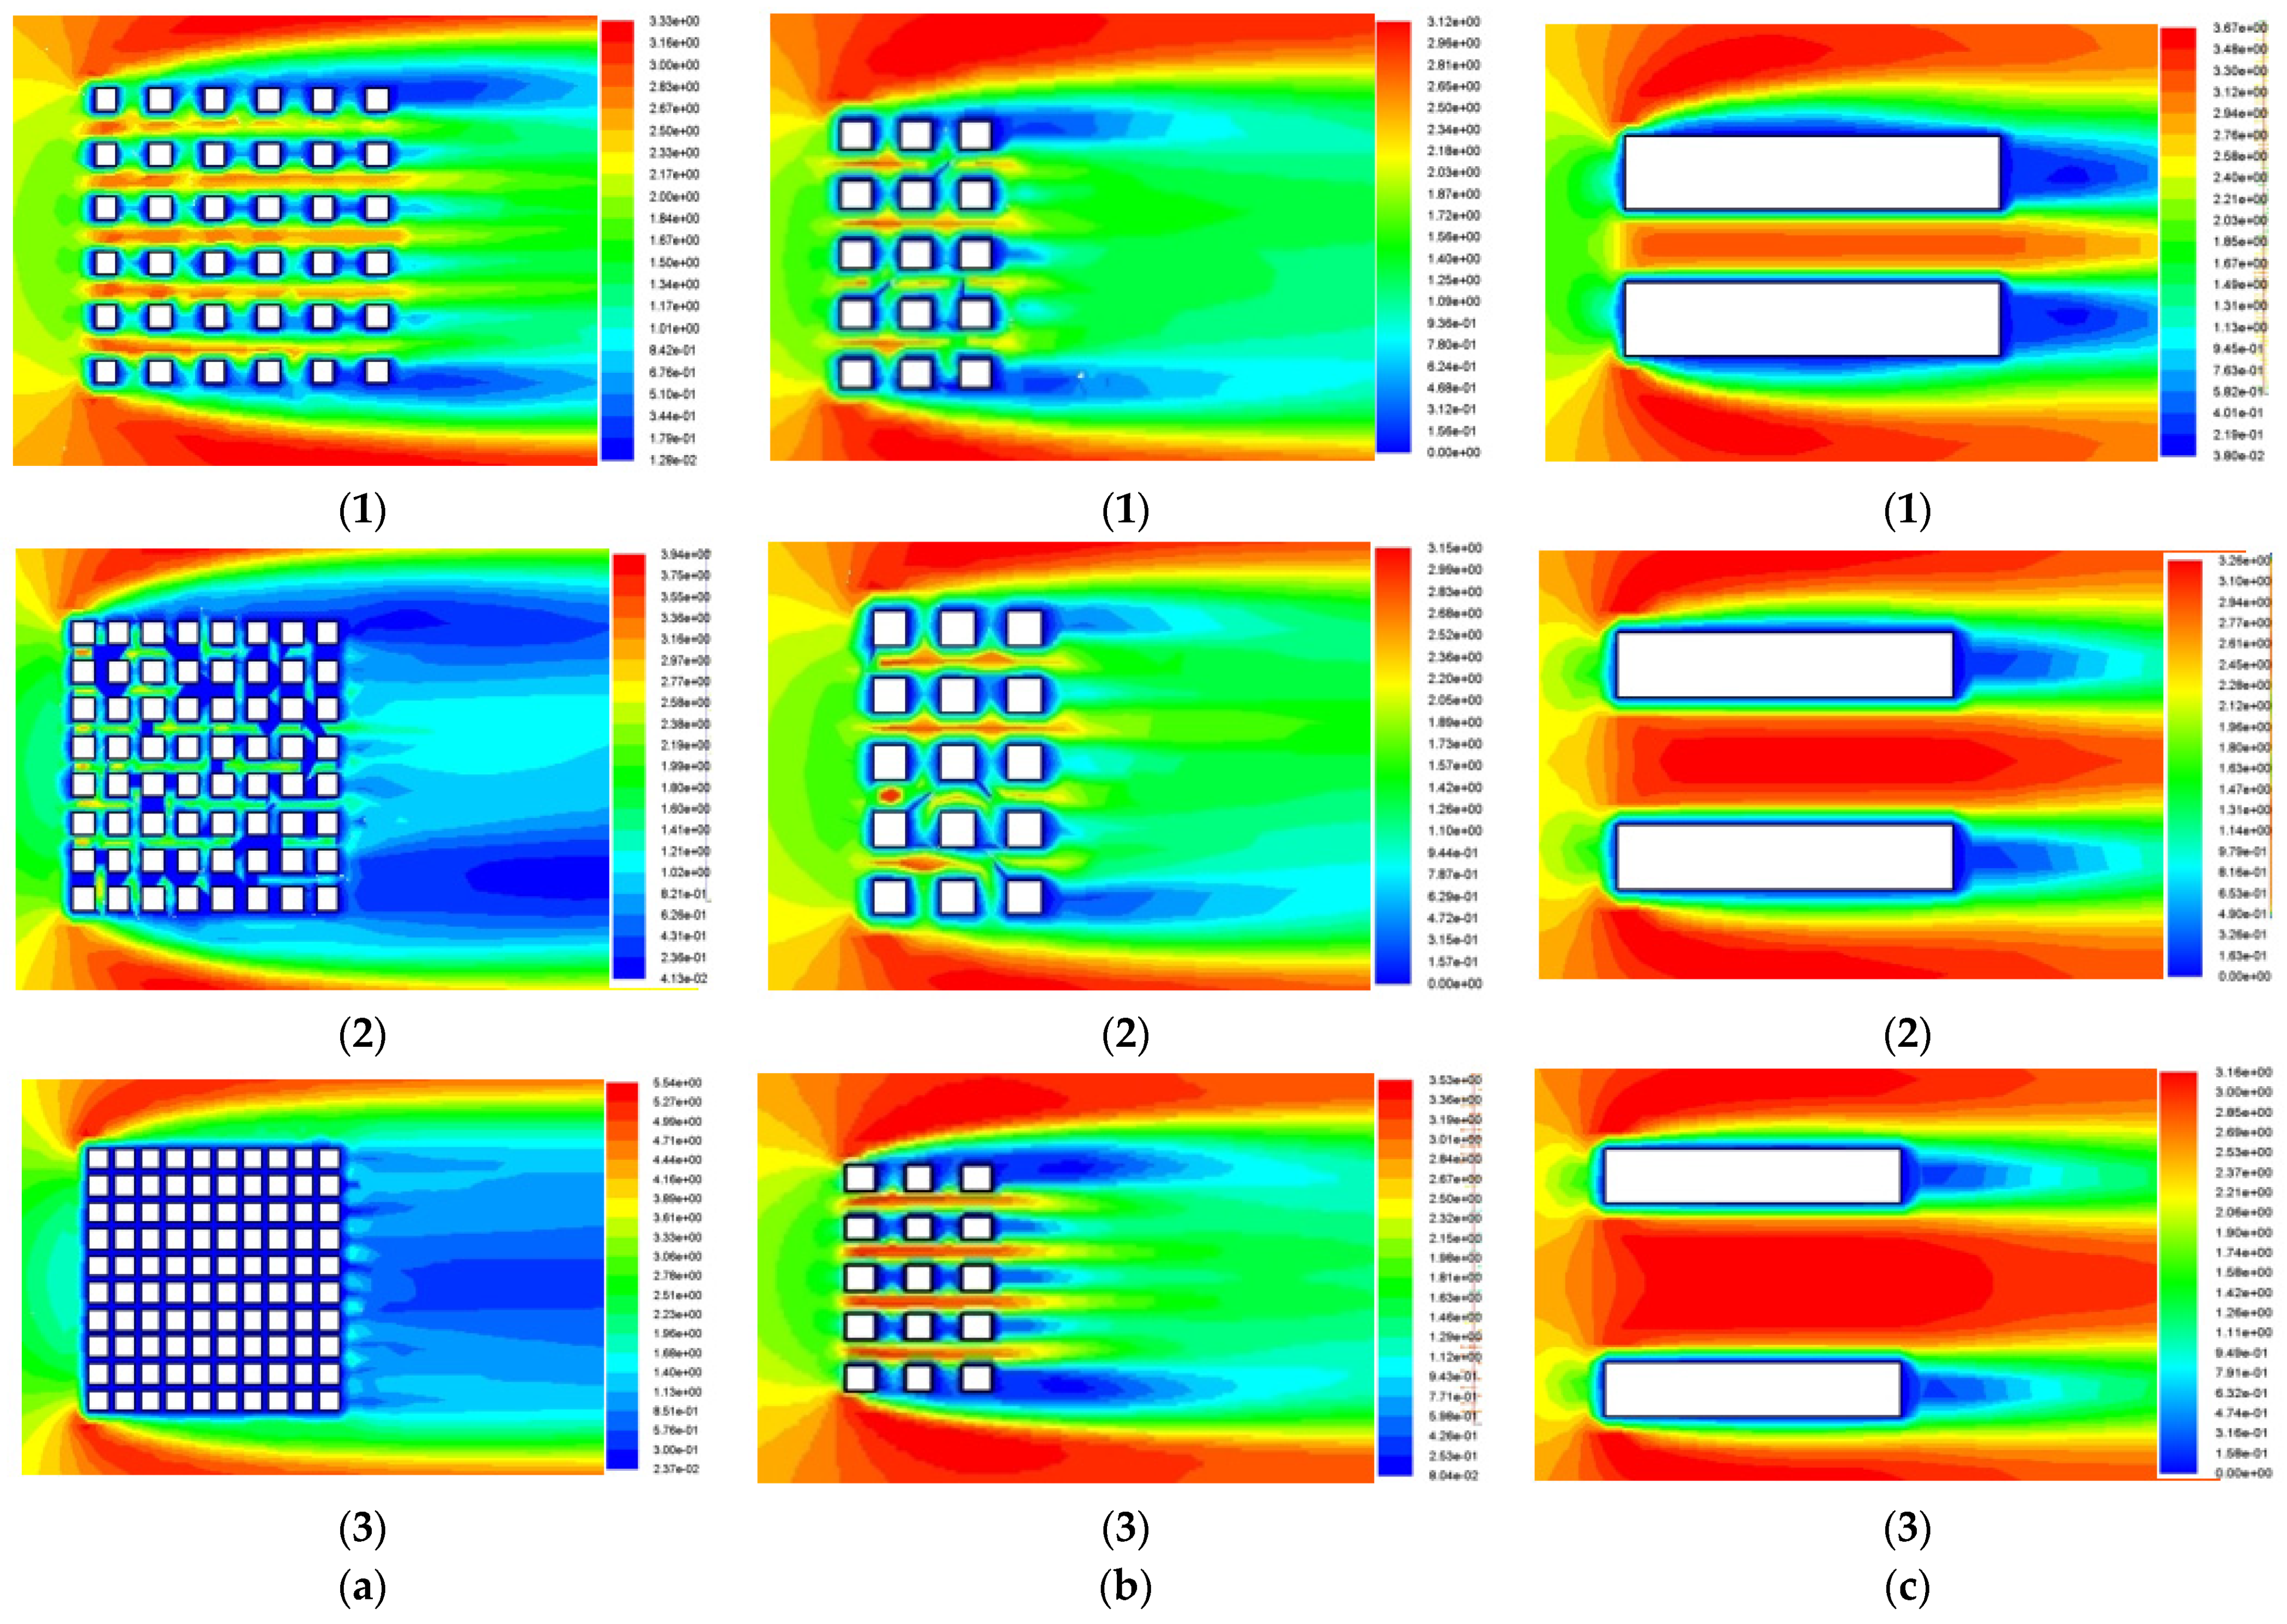
3.4. The Results of the Evaluation of Spatial Indicators for Streets and Alleys
- (1)
- Building density
- (2)
- Building height
- (3)
- Street width
4. Conclusions
4.1. Results
- (1)
- Through on-site research, questionnaires, and wind environment measurements, it was found that the widths of streets and alleys in the Hanjiang River’s Chuan Dao area range from 3.5 m to 15.6 m, and the number of building floors is mostly below five, with the height of building floors being around 3.6 m. The main street of the Zhuge Ancient Township is oriented parallel to the dominant wind direction, while the main streets of the rest of the villages and towns are perpendicular to the dominant wind direction. Through the questionnaire survey, it was summarized that most of the respondents are dissatisfied with the wind environment of the village and town streets in the winter and summer, which is mainly reflected in the poor ventilation leading to hot and stuffy air in the summer, and due to pollutants not being able to be effectively discharged from the streets in the winter, causing the odors to remain for a long time. Through the wind environment measurement of Lefeng Village in the Shangyuan Guan Township, it was found that the overall wind speed inside the streets and alleys is slow, and there are very few cases of wind speeds greater than 1 m/s, which makes it difficult to reach the standard of a comfortable wind environment.
- (2)
- We summarized the relevant wind environment theories in the literature and determined that there is a relationship between the wind environment and the layout of streets and alleys in villages and towns as well as the layout of buildings from the perspectives of numerical simulation and human habitat environment science. Numerical simulation was chosen to study the wind environment in the street space of the Hanjiang River’s Chuan Dao area in Southern Shaanxi Province. Combined with the climatic characteristics of the Hanjiang River’s Chuan Dao area, we summarized the existing wind environment comfort evaluation standards at pedestrian heights at home and abroad and put forward the outdoor wind environment evaluation requirements applicable to the Hanjiang River’s Chuan Dao area during the winter and summer seasons in six aspects, namely the wind speed, wind vortex, wind speed ratio, wind speed amplification coefficient, air pollutant concentration, and wind pressure difference.
- (3)
- There are three types of internal streets and alleys, namely “I”-, “T”-, and “X”-shaped streets. By analyzing the simulation results, it could be seen that except for the winter wind speed, all other wind environment indicators do not meet the requirements of a comfortable street wind environment. Among the villages and towns with a grid layout, those with open streets and alleys, a low density of buildings in streets and alleys, and no obvious obstructions at the entrance of the windward side of the dominant wind direction in the summer have better wind environment comfort in the winter and summer seasons. Buildings causing a high degree of enclosure in streets and alleys, narrow street spaces, and street and alley entrances being blocked cause poor wind environment comfort, as a low degree of enclosure in streets and buildings in a staggered arrangement are conducive to a good wind environment. Village and town streets with a herringbone layout should ensure that the entrances facing wind in the dominant direction in the summer should not be greater than the angle of 30°, and there should be no obstructions from buildings. Street entrances should not be facing the dominant wind direction in the winter, but if this cannot be avoided, buildings, plants, etc., should be set up to block the cold wind.
- (4)
- The impact of building density, building height, and street width on the wind environment is more obvious in the streets of the Hanjiang River’s Chuan Dao villages and towns in Southern Shaanxi Province. According to the characteristics of the village and town buildings in the Hanjiang River’s Chuan Dao area and the characteristics of the simulation study, the building density and wind speed have a negative correlation, where the greater the building density, the slower the wind speed, showing that the region’s building density should be about 36%. The building height and wind speed in the street have a positive correlation, where the higher the buildings on both sides of the street, the faster the wind speed inside the street, so the building height on both sides of the street should be below 15 m. The street width and wind speed are positively correlated; the wider the street, the greater the wind speed. A street where people and vehicles pass should have a width of 6 to 11 m, and in other cases, it should be 3 to 6 m.
- (5)
- Villages and towns with internal streets and alleys in the “T” and “X” shapes in the Hanjiang River’s Chuan Dao area, South Shaanxi are encouraged to change the design of corner buildings and combine the layouts of parks and squares to increase the amount of air inflow into the streets and alleys to improve the street wind environment. At the level of street space, through the study of street scale, the reasonable height-to-width ratio of streets in this area ranges between 0.5 and 1.5. In areas with high building density, methods of creating open spaces and building setbacks should be adopted to minimize building density and achieve good ventilation. Since the prevailing winds in this area are in opposite directions in the winter and summer, a progressive building height layout is proposed, with building heights arranged from low to high on the windward side of the prevailing winds in the summer to improve the ventilation effect of streets and alleys while blocking the cold winds in the winter.
4.2. Improvement Strategies and Prospects
- (1)
- The wind environment is a comprehensive and holistic system, and the wind environment is also affected by many factors, so this study only focuses on the street layout and street space through the simulation of the ideal model, which causes some limitations.
- (2)
- It is also necessary to study the influence of the internal space of street building compounds on the wind environment. Factors affecting the microclimate, such as plant and water bodies, need to continue to be studied.
- (3)
- The study of the wind environment of villages and towns at different altitudes has limitations for the time being, and the applicability of this study to areas with lower altitudes needs to be studied, so future research can be carried out in this perspective.
Author Contributions
Funding
Institutional Review Board Statement
Informed Consent Statement
Data Availability Statement
Conflicts of Interest
References
- Japan Refrigeration and Air Conditioning Industry Association. World Air Conditioner Demand by Region; Japan Refrigeration and Air Conditioning Industry Association: Tokyo, Japan, 2018. [Google Scholar]
- Tsinghua University. Annual Report on China Building Energy Efficiency; China Architecture & Building Press: Beijing, China, 2017. [Google Scholar]
- International Energy Agency. Transition to Sustainable Buildings: Strategies and Opportunities to 2050; OECD/IEA: Paris, France, 2013. [Google Scholar]
- U.S. EIA. Annual Energy Outlook 2018; DOE: Washington, DC, USA, 2018. [Google Scholar]
- The Guardian. World Set to Use More Energy for Cooling than Heating. Available online: https://www.theguardian.com/environment/2015/oct/26/cold-economy-cop21-global-warming-carbon-emissions (accessed on 26 October 2015).
- Cao, S.-H.; Ming, P.-P.; Zhao, X. Fuzzy comprehensive evaluation of human thermal comfort in simulating natural wind environment. Build. Environ. 2020, 188, 107447. [Google Scholar] [CrossRef]
- Tsang, C.W.; Kwok, K.C.S.; Hitchcock, P.A. Wind tunnel study of pedestrian level wind environment around tall buildings: Effects of building dimensions, separation and podium. Build. Environ. 2012, 49, 167–181. [Google Scholar] [CrossRef]
- Kaseb, Z.; Hafezi, M.; Tahbaz, M.; Delfani, S. A framework for pedestrian-level wind conditions improvement in urban areas: CFD simulation and optimization. Build. Environ. 2020, 184, 107191. [Google Scholar] [CrossRef]
- Hong, B.; Lin, B.R.; Hu, L.H.; Li, S.H. Study on the Impacts of Vegetation on Wind Environment in Residential District Combined Numerical Simulation and Field Experiment. Procedia Environ. Sci. 2012, 13, 1708–1717. [Google Scholar] [CrossRef]
- Ichinose, T. Regional warming related to land use change during recent 135 years in Japan. In Present and Future of Modeling Global Environmental Change: Toward Integrated Modeling; Terra Scientific Publishing Company: Tokyo, Japan, 2003; Volume 9, pp. 19–39. Available online: https://www.researchgate.net/publication/261710695_Regional_warming_related_to_land_use_change_during_recent_135_years_in_Japan (accessed on 15 December 2021).
- Chen, Q. Ventilation performance prediction for buildings: A method overview and recent applications. Build. Environ. 2009, 44, 848–858. [Google Scholar] [CrossRef]
- Jiang, Y.; Chen, Q. Effect of fluctuating wind direction on cross natural ventilation in buildings from large eddy simulation. Build. Environ. 2002, 37, 379–386. [Google Scholar] [CrossRef]
- Evola, G.; Popov, V. Computational analysis of wind driven natural ventilation in buildings. Energy Build. 2006, 38, 491–501. [Google Scholar] [CrossRef]
- Song, D.; Lu, M.; Xing, J. Impact of spatial layout on vertical wind conditions and comfort levels in high-rise residential buildings in Shenzhen. Urban Clim. 2024, 55, 101949. [Google Scholar] [CrossRef]
- Moonen, P.; Dorer, V.; Carmeliet, J. Evaluation of the ventilation potential of courtyards and urban street canyons using RANS and LES. J. Wind. Eng. Ind. Aerodyn. 2011, 99, 414–423. [Google Scholar] [CrossRef]
- Kubota, T.; Miura, M.; Tominaga, Y.; Mochida, A. Wind tunnel tests on the relationship between building density and pedestrian-level wind velocity: Development of guidelines for realizing acceptable wind environment in residential neighborhoods. Build. Environ. 2008, 43, 1699–1708. [Google Scholar] [CrossRef]
- Blocken, B.; Persoon, J. Pedestrian wind comfort around a large football stadium in an urban environment: CFD simulation, validation and application of the new Dutch wind nuisance standard. J. Wind. Eng. Ind. Aerodyn. 2009, 97, 255–270. [Google Scholar] [CrossRef]
- Stathopoulos, T.; Baskaran, B.A. Computer simulation of wind environmental conditions around buildings. Eng. Struct. 1996, 18, 876–885. [Google Scholar] [CrossRef]
- To, A.P.; Lam, K.M. Evaluation of pedestrian-level wind environment around a row of tall buildings using a quartile-level wind speed descripter. J. Wind. Eng. Ind. Aerodyn. 1995, 54–55, 527–541. [Google Scholar] [CrossRef]
- Canepa, E. An overview about the study of downwash effects on dispersion of airborne pollutants. Environ. Model. Softw. 2004, 19, 1077–1087. [Google Scholar] [CrossRef]
- Mensink, C.; Cosemans, G. From traffic flow simulations to pollutant concentrations in street canyons and backyards. Environ. Model. Softw. 2008, 23, 288–295. [Google Scholar] [CrossRef]
- Nkemdirim, L.C. Cold air drainage and temperature fields in an urban environment: A case study of topographical influence on climate. Atmospheric Environ. 1980, 14, 375–381. [Google Scholar] [CrossRef]
- Cao, J.; Cao, S.; Ma, Z.; Liu, L. Diffusion characteristic of air pollutant from district heating source driven by urban wind field and layout optimization. J. Wind. Eng. Ind. Aerodyn. 2023, 239, 105462. [Google Scholar] [CrossRef]
- Assimakopoulos, V.D.; ApSimon, H.M.; Moussiopoulos, N. A numerical study ofatmospheric pollutant dispersion in different two-dimensional street canyon configurations. Atmos. Environ. 2003, 37, 4037–4049. [Google Scholar] [CrossRef]
- Murakami, S.; Uehara, K.; Deguchi, K. Wind Effects on Pedestrians: New Criteria Based on Outdoor Observation of Over 2000 Persons; Cermak, J.E., Ed.; Wind Engineering Pergamon: Oxford, UK, 1980; pp. 277–288. ISBN 9781483283678. [Google Scholar] [CrossRef]
- Gadilhe, A.; Janvier, L.; Barnaud, G. Numerical and experimental modelling of the three-dimensional turbulent wind flow through an urban square. J. Wind. Eng. Ind. Aerodyn. 1993, 46–47, 755–763. [Google Scholar] [CrossRef]
- Gromke, C.; Buccolieri, R.; Di Sabatino, S.; Ruck, B. Dispersion study in a street canyon with tree planting by means of wind tunnel and numerical investigations—Evaluation of CFD data with experimental data. Atmos. Environ. 2008, 42, 8640–8650. [Google Scholar] [CrossRef]
- Chen, G.; Wang, D.; Wang, Q.; Li, Y.; Wang, X.; Hang, J.; Gao, P.; Ou, C.; Wang, K. Scaled outdoor experimental studies of urban thermal environment in street canyon models with various aspect ratios and thermal storage. Sci. Total. Environ. 2020, 726, 138147. [Google Scholar] [CrossRef]
- Li, J.; Guo, F.; Chen, H. A study on urban block design strategies for improving pedestrian-level wind conditions: CFD-based optimization and generative adversarial networks. Energy Build. 2024, 304, 113863. [Google Scholar] [CrossRef]
- Eslamirad, N.; De Luca, F.; Lylykangas, K.S.; Yahia, S.B. Data generative machine learning model for the assessment of outdoor thermal and wind comfort in a northern urban environment. Front. Arch. Res. 2023, 12, 541–555. [Google Scholar] [CrossRef]
- Ai, Z.; Mak, C. Wind-induced single-sided natural ventilation in buildings near a long street canyon: CFD evaluation of street configuration and envelope design. J. Wind. Eng. Ind. Aerodyn. 2018, 172, 96–106. [Google Scholar] [CrossRef]
- Blocken, B.; Janssen, W.D.; van Hooff, T. CFD simulation for pedestrian wind comfort and wind safety in urban areas: General decision framework and case study for the Eindhoven University campus. Environ. Model. Softw. 2011, 30, 15–34. [Google Scholar] [CrossRef]
- Mi, Z.; Zheng, J.; Meng, J.; Shan, Y.; Zheng, H.; Ou, J.; Guan, D.; Wei, Y.-M. China’s Energy Consumption in the New Normal. Earths Future 2018, 6, 1007–1016. [Google Scholar] [CrossRef]
- Zhang, L.; Hou, J.; Yu, Y.; Du, J.; Meng, X.; He, Q. Numerical simulation of outdoor wind environment of typical traditional village in the northeastern Sichuan Basin. Procedia Eng. 2017, 205, 923–929. [Google Scholar] [CrossRef]
- Liu, Z.; Liu, Y.; He, B.-J.; Xu, W.; Jin, G.; Zhang, X. Application and suitability analysis of the key technologies in nearly zero energy buildings in China. Renew. Sustain. Energy Rev. 2018, 101, 329–345. [Google Scholar] [CrossRef]
- Yao, X.; Dewancker, B.J.; Guo, Y.; Han, S.; Xu, J. Study on Passive Ventilation and Cooling Strategies for Cold Lanes and Courtyard Houses—A Case Study of Rural Traditional Village in Shaanxi, China. Sustainability 2020, 12, 8687. [Google Scholar] [CrossRef]
- Ding, J.; Ma, S. Comparative analysis of habitation behavioral patterns in spatial configuration of traditional houses in Anhui, Jiangsu, and Zhejiang provinces of China. Front. Arch. Res. 2020, 9, 54–66. [Google Scholar] [CrossRef]
- Andreescu, I.; Gaivoronsch, V.; Mosoarca, M. Old and New—The Complex Problem of Integrating Newb Functions into Old Building. Procedia Eng. 2016, 161, 1103–1108. [Google Scholar] [CrossRef]
- Chi, F.; Xu, L.; Peng, C. Integration of completely passive cooling and heating systems with daylighting function into courtyard building towards energy saving. Appl. Energy 2020, 266, 114865. [Google Scholar] [CrossRef]
- Allegrini, J. A wind tunnel study on three-dimensional buoyant flows in street canyons with different roof shapes and building lengths. Build. Environ. 2018, 143, 71–88. [Google Scholar] [CrossRef]
- Gaping, L.; Xiao, D. Spatial Evolution and Extension Patterns of Historical and Cultural Towns in the Qinling Mountains. J. Build. Sci. Eng. 2019, 36, 9. [Google Scholar]
- Hadavi, M.; Pasdarshahri, H. Quantifying impacts of wind speed and urban neighborhood layout on the infiltration rate of residential buildings. Sustain. Cities Soc. 2019, 53, 101887. [Google Scholar] [CrossRef]
- Sousa, J.H.; Gomes, M.G.; da Silva, F.M.; Tomé, A. Systematization of spatial functional layouts and pedestrian wind comfort assessment for an ultra-thin triangular free form shell structure. Build. Environ. 2023, 246, 110951. [Google Scholar] [CrossRef]
- Zhang, B. Ten major scientific issues concerning the study of China’s north-south transitional zone. Prog. Geosci. 2019, 38, 305–311. [Google Scholar] [CrossRef]
- Juan, X.; Xiaoping, H. Study on strategy of inheritance and development of traditional building in qinba mountains region. Ind. Constr. 2014, 44, 40–44. [Google Scholar]
- Simpson, G.C. Bibliographies Meteorological Office. The Velocity equivalents of the Beaufort scale, by G.-C. Simpson. Ciel. Terre. 1927, 43, 19. [Google Scholar]
- Melbourne, W.H. Criteria for environmental wind conditions. J. Wind. Eng. Ind. Aerodyn. 1978, 3, 241–249. [Google Scholar] [CrossRef]
- Du, Y.; Mak, C.M.; Kwok, K.; Tse, K.-T.; Lee, T.-C.; Ai, Z.; Liu, J.; Niu, J. New criteria for assessing low wind environment at pedestrian level in Hong Kong. Build. Environ. 2017, 123, 23–36. [Google Scholar] [CrossRef]
- Yao, X.; Han, S.; Dewancker, B. Wind Environment Simulation Accuracy in Traditional Villages with Complex Layouts Based on CFD. Int. J. Environ. Res. Public Health 2021, 18, 8644. [Google Scholar] [CrossRef]
- Gousseau, P.; Blocken, B.; Stathopoulos, T.; Van Heijst, G.J.F. CFD simulation of near-field pollutant dispersion on a high-resolution grid: A case study by LES and RANS for a building group in downtown Montreal. Atmos. Environ. 2011, 45, 428–438. [Google Scholar] [CrossRef]
- Ding, C.; Lam, K.P. Data-driven model for cross ventilation potential in high-density cities based on coupled CFD simulation and machine learning. Build. Environ. 2019, 165, 106394. [Google Scholar] [CrossRef]
- Keshavarzian, E.; Jin, R.; Dong, K.; Kwok, K.C. Effect of building cross-section shape on air pollutant dispersion around buildings. Build. Environ. 2021, 197, 107861. [Google Scholar] [CrossRef]
- Kim, T.; Kim, K.; Kim, B.S. A wind tunnel experiment and CFD analysis on airflow performance of enclosed-arcade markets in Korea. Build. Environ. 2010, 45, 1329–1338. [Google Scholar] [CrossRef]
- Ma, X.; Chau, C.K.; Lai, J.H.K. Critical factors influencing the comfort evaluation for recreational walking in urban street environments. Cities 2021, 116, 103286. [Google Scholar] [CrossRef]
- Wu, Y.; Quan, S.J. A review of surrogate-assisted design optimization for improving urban wind environment. Build. Environ. 2024, 253, 111157. [Google Scholar] [CrossRef]
- Tse, K.T.; Zhang, X.; Weerasuriya, A.U.; Li, S.W.; Kwok, K.C.S.; Mak, C.M.; Niu, J. Adopting ‘lift-up’ building design to improve the surrounding pedestrian-level wind environment. Build. Environ. 2017, 117, 154–165. [Google Scholar] [CrossRef]
- Li, W.; Mak, C.M.; Fu, Y.; Cai, C.; Tse, K.T.; Niu, J. The impact of twisted wind on pedestrian comfort around two non-identical-height buildings in tandem arrangement: A wind tunnel study. Build. Environ. 2024, 262, 111847. [Google Scholar] [CrossRef]
- Du, Y.; Mak, C.M.; Li, Y. A multi-stage optimization of pedestrian level wind environment and thermal comfort with lift-up design in ideal urban canyons. Sustain. Cities Soc. 2019, 46, 101424. [Google Scholar] [CrossRef]
- Ying, X.; Qin, X.; Shen, L.; Yu, C.; Zhang, J. An intelligent planning method to optimize high-density residential layouts considering the influence of wind environments. Heliyon 2023, 9, e13051. [Google Scholar] [CrossRef] [PubMed]
- Ma, T.; Chen, T. Outdoor ventilation evaluation and optimization based on spatial morphology analysis in Macau. Urban Clim. 2022, 46, 101335. [Google Scholar] [CrossRef]
- Zhang, Q.; Dong, R.; Xu, D.; Zhou, D.; Rogora, A. Associations between summer wind environment and urban physical indicators in commercial blocks based on field measurement and simulation in Xi’an. Urban Clim. 2023, 49, 101544. [Google Scholar] [CrossRef]


| Name | Wind Speed (1.5 m) | Wind Vortex | Wind Speed Ratio | Wind Speed Amplification Factor | Air Pollutant Concentration |
|---|---|---|---|---|---|
| winter | V ≤ 5 m/s Comfortable wind environment | Avoid | The greater the wind speed ratio, the better the ventilation effect | <2 | When V < 1 m/s, pollutants easily deposit, and the lower the wind speed, the greater the pollutant concentration. |
| summer | 1 m/s ≤ V ≤ 5 m/s Comfortable wind environment | The greater the wind speed, the lower the pollutant concentration. | |||
| V < 1 m/s or V > 5 m/s Uncomfortable wind environment |
| Evaluation of Outdoor Wind Environment (−3, Very Dissatisfied/−2, Very Dissatisfied/−1, Slightly Dissatisfied/0, Neutral/1, Mostly Satisfied/2, Very Satisfied/3, Very Satisfied) | ||
|---|---|---|
| Street wind environmental comfort | −3 −2 −1 0 1 2 3 | winter ( ) summer ( ) |
| Street wind speed satisfaction | −3 −2 −1 0 1 2 3 | winter ( ) summer ( ) |
| Pollutant dispersion satisfaction | −3 −2 −1 0 1 2 3 | winter ( ) summer ( ) |
| Open space wind environment satisfaction | −3 −2 −1 0 1 2 3 | winter ( ) summer ( ) |
| Measuring Point | Average Wind Speed | V < 1 m/s | 1 m/s ≤ V ≤ 5 m/s | V ≥ 5 m/s |
|---|---|---|---|---|
| A | 0.35 | 100% | 0% | 0% |
| B | 0.21 | 100% | 0% | 0% |
| C | 0.27 | 100% | 0% | 0% |
| D | 0.90 | 70% | 30% | 0% |
| E | 0.83 | 70% | 30% | 0% |
| F | 0.53 | 90% | 10% | 0% |
| G | 0.27 | 100% | 0% | 0% |
| a | 0.61 | 80% | 20% | 0% |
| b | 0.29 | 100% | 0% | 0% |
| c | 0.30 | 100% | 0% | 0% |
| d | 0.80 | 70% | 30% | 0% |
| e | 0.23 | 100% | 0% | 0% |
| Name | Seasonality | Comfortable Wind Speed | Wind Vortex | Wind Speed Ratio | Air Pollutant Concentrations | Wind Pressure Difference |
|---|---|---|---|---|---|---|
| Lefeng Village, Shangyuan Guan Township | Winter | √ | √ | 0.60 | √ | <5 pa |
| Summer | × | √ | 0.33 | × | -- |
| Name | Range of Wind Speeds in Streets and Alleys | Maximum Wind Speed | Average Wind Speed | Wind Speed Range in Wind Shadow Area | Wind Speed Ratio |
|---|---|---|---|---|---|
| (a) | 1.48 m/s~2.92 m/s | 2.92 m/s | 2.20 m/s | 0.03 m/s~0.83 m/s | 0.60 |
| (b) | 2.22 m/s~3.62 m/s | 3.62 m/s | 2.92 m/s | 0.20 m/s~1.20 m/s | 0.80 |
| (c) | 1.76 m/s~3.31 m/s | 3.31 m/s | 2.54 m/s | 0.02 m/s~0.60 m/s | 0.70 |
Disclaimer/Publisher’s Note: The statements, opinions and data contained in all publications are solely those of the individual author(s) and contributor(s) and not of MDPI and/or the editor(s). MDPI and/or the editor(s) disclaim responsibility for any injury to people or property resulting from any ideas, methods, instructions or products referred to in the content. |
© 2024 by the authors. Licensee MDPI, Basel, Switzerland. This article is an open access article distributed under the terms and conditions of the Creative Commons Attribution (CC BY) license (https://creativecommons.org/licenses/by/4.0/).
Share and Cite
Liu, Y.; Wang, J.; Bai, W.; Dewancker, B.; Gao, W. A Numerical Simulation-Based Adaptation of the Pedestrian-Level Wind Environment in Village Streets: A Case Study on the Chuan Dao Area of the Hanjiang River in Southern Shaanxi. Sustainability 2024, 16, 7597. https://doi.org/10.3390/su16177597
Liu Y, Wang J, Bai W, Dewancker B, Gao W. A Numerical Simulation-Based Adaptation of the Pedestrian-Level Wind Environment in Village Streets: A Case Study on the Chuan Dao Area of the Hanjiang River in Southern Shaanxi. Sustainability. 2024; 16(17):7597. https://doi.org/10.3390/su16177597
Chicago/Turabian StyleLiu, Yuanhao, Jinming Wang, Wei Bai, Bart Dewancker, and Weijun Gao. 2024. "A Numerical Simulation-Based Adaptation of the Pedestrian-Level Wind Environment in Village Streets: A Case Study on the Chuan Dao Area of the Hanjiang River in Southern Shaanxi" Sustainability 16, no. 17: 7597. https://doi.org/10.3390/su16177597