Article

An Attribution Analysis of Runoff Alterations in the Danjiang River Watershed for Sustainable Water Resource Management by Different Methods

1
College of Hydraulic Engineering, Zhejiang University of Water Resources and Electric Power, Hangzhou 310018, China
2
Key Laboratory for Technology in Rural Water Management of Zhejiang Province, Hangzhou 310018, China
3
Jinhua Survey and Design Institute of Water Conservancy and Hydropower, Jinhua 321017, China
4
State Key Laboratory of Soil Erosion and Dryland Farming on the Loess Plateau, Institute of Soil and Water Conservation, Chinese Academy of Sciences & Ministry of Water Resources, Yangling, Xianyang 712100, China
5
Institute of Soil and Water Conservation, Northwest A&F University, Yangling, Xianyang 712100, China
6
School of Architecture, Civil and Environmental Engineering, Ecole Polytechnique Fédérale de Lausanne, 1015 Lausanne, Switzerland
*
Author to whom correspondence should be addressed.
Sustainability 2024, 16(17), 7600; https://doi.org/10.3390/su16177600
Submission received: 9 July 2024 / Revised: 19 August 2024 / Accepted: 30 August 2024 / Published: 2 September 2024

Abstract

:
Determining the relative roles of climatic versus anthropogenic factors in runoff alterations is important for sustainable water resource utilization and basin management. The Danjiang River watershed is a crucial water resource area of the middle route of the South-to-North Water Transfer Project. In this study, four widely used quantitative methods, including the simple linear regression, the double mass curve, the paired year with similar climate conditions, and an elasticity method based on the Budyko framework were applied to detect the relative contribution of climatic and anthropogenic factors to runoff variation in the Danjiang River watershed. The calculation processes of each method were systematically explained, and their characteristics and applications were summarized. The results showed that runoff decreased significantly (p < 0.05) with an average change rate of −3.88 mm year−1 during the period of 1960–2017, and a significant change year was detected in 1989 (p < 0.05). Generally, consistent estimates could be derived from different methods that human activity was the dominant driving force of significant runoff reduction. Although the impacts of human activity estimated by the paired year with similar climate conditions method varied among paired years, the other three methods demonstrated that human activity accounted for 80.22–92.88% (mean 86.33%) of the total reduction in the annual runoff, whereas climate change only contributed 7.12–19.78% (mean 13.67%). The results of this study provide a good reference for estimating the effects of climate change and human activities on runoff variation via different methods.

1. Introduction

Global warming along with urbanization and industrialization has posed a growing threat to water resources, attracting considerable attention for decades [1,2]. Runoff is a fundamental component of the hydrological cycle and the essential element of basin water balance. The comprehensive acquaintance and profound exploration of runoff are directly correlated with the exploitation and allocation utilization of water resources [3]. Recent studies have revealed that global riverine runoff might increase [4,5], whereas considerable studies indicated that riverine runoff worldwide has been substantially decreased due to climate change and human activity, such as the Yellow River [6], the Yangtze River [7], the Dez River in Iran [8], and the Red River [9], which would result in water shortage, restricting economic and social development. Therefore, there is an urgent need to understand the changes in runoff, especially the assessment of climatic and anthropogenic impacts on runoff alterations, and further to maintain and promote sustainable management of water resource.
Climate change influences the spatiotemporal distribution of precipitation, temperature, and evapotranspiration, while various human activities affect soil properties and land surface characteristics, which will change the hydrological cycle of the basin and regional water resources [10,11]. Currently, numerous methods have been developed and adopted to quantify the relative contributions of climate change and human activity to runoff variations [12,13,14]. Among these methods, the paired-catchment observation approach, hydrological models, and empirical regression methods are frequently used [15]. The paired-catchment observation approach is the optimal method to eliminate the climatic effects in small catchments, whereas applying this method to medium or large basins is a challenge due to the complexity and heterogeneity of natural conditions [16]. Hydrological models generally require kinds of high-precision datasets and may provide convincing and satisfactory results [17]. However, the parameters of process-based models are uncertain, and the calibration and validation processes are time-consuming [18]. Moreover, many process-based models are unable to be directly applied to assess the environmental impacts on runoff for various reasons, such as unavailable data and the complicated basin environment.
Elasticity-based methods (e.g., an analytical method based on the Budyko framework) have been proven to be reliable for the attribution analysis of runoff variation because of the relatively substantial theoretical basis and explicit physics significance [19,20]. Yang et al. [21] applied the Budyko framework to evaluate the contributions of precipitation, potential evapotranspiration (ET0), and land surface conditions to runoff changes from 1965 to 2018 for 64 catchments in China and found runoff was more sensitive to precipitation and land surface conditions. A method called the paired year with similar climate conditions whose principle is similar to that of the paired-catchment observation approach, which is to control the weather conditions, thereby quantifying the impacts of human activity on runoff [22]. The method was easily applicable and feasible in most basins based on reasonable geographical assumptions with explicit analytical rules. Using this method, He et al. [23] demonstrated that all the selected paired years from 1961 to 2010 presented reductions in runoff in the middle reaches of the Yellow River. Although empirical regression methods (e.g., the linear regression and double mass curve) lack concrete physical mechanisms, it is an easy and operative way with relatively acceptable precision, and numerous successful applications have been reported [7,24].
Each of the aforementioned methods has its superiority and deficiency, and different approaches might produce inconsistent or even contradictory results in the same study area. For instance, Gao et al. [25] reported that the impacts of land use/cover (50.4%) and climate change (49.6%) on runoff reduction were almost equal in the Yanhe River basin when applying an elasticity method based on the Budyko framework, whereas Zhao et al. [26] indicated that climate change played a more dominant role than human activity by other methods. Similarly, Zhang et al. [27] and Ye et al. [28] produced different findings by using different methods in the same catchment (Poyang Lake catchment). Wang et al. [29] applied three methods to isolate the impacts of climate change and land use change on runoff variation and found that the impacts seemed different among methods. They suggested that different results were caused by errors related to each method, and when taking into account the errors, three approaches could produce a general consistent result. These indicate that without direct comparison among different methods, it is hard to find out whether the result obtained from one method is reasonable and convictive. Ahn and Merwade [15] indicated that averaging the results of four methods in quantifying the impacts on runoff variations could strengthen confidence in the quantitative result.
The Danjiang River watershed located upstream of the Danjiangkou Reservoir is an important water source area of the mid-route scheme of the South-to-North Water Diversion Project, China [30]. However, the Danjiang River watershed is also an ecological fragile region where the flood control system is imperfect and pollution control is inadequate [31]. With the development of ecological economy and engineering construction in the watershed, land use/vegetation cover has undergone significant changes, resulting in changes in the underlying surface conditions and hydrological processes [32]. Moreover, human demand for water resources has increased due to population growth and industrial–agricultural development. Previous studies mostly focused on the water quality of the watershed [33,34], whereas the investigation of variations in the riverine runoff magnitude is also essential. The runoff variations and soil conservation function of the watershed not only directly affect the operation of the project but also influence the water quality, quantity, and stability of downstream areas. Since few studies have been conducted to analyze long-term runoff variations in the Danjiang River watershed, understanding the long-term variability of runoff and its influential factors, such as precipitation, ET0, and land use/cover is essential for maintaining sustainable water resources. What is more, the extent to which the driving factors have affected runoff variation also needs to be addressed, which can provide valuable information for integrated river management (e.g., rational utilization and protection of water resources).
Therefore, an attribution analysis on runoff alterations in the Danjiang River watershed was conducted to improve sustainable water resource management. The objectives of this study are (1) to analyze the runoff variation in the Danjiang River watershed during the period of 1960–2017 and (2) to quantify the response of runoff to climate variability and human activity in the watershed with four methods. We then further compared the results provided by different methods, discussed the uncertainties, and evaluated the applicability of each method. The results can provide a reference for the method selection in a hydrological response analysis in similar watersheds and are beneficial for the relevant authorities to formulate scientifically feasible riverine development strategies, allocating water resources optimally.

2. Materials and Methods
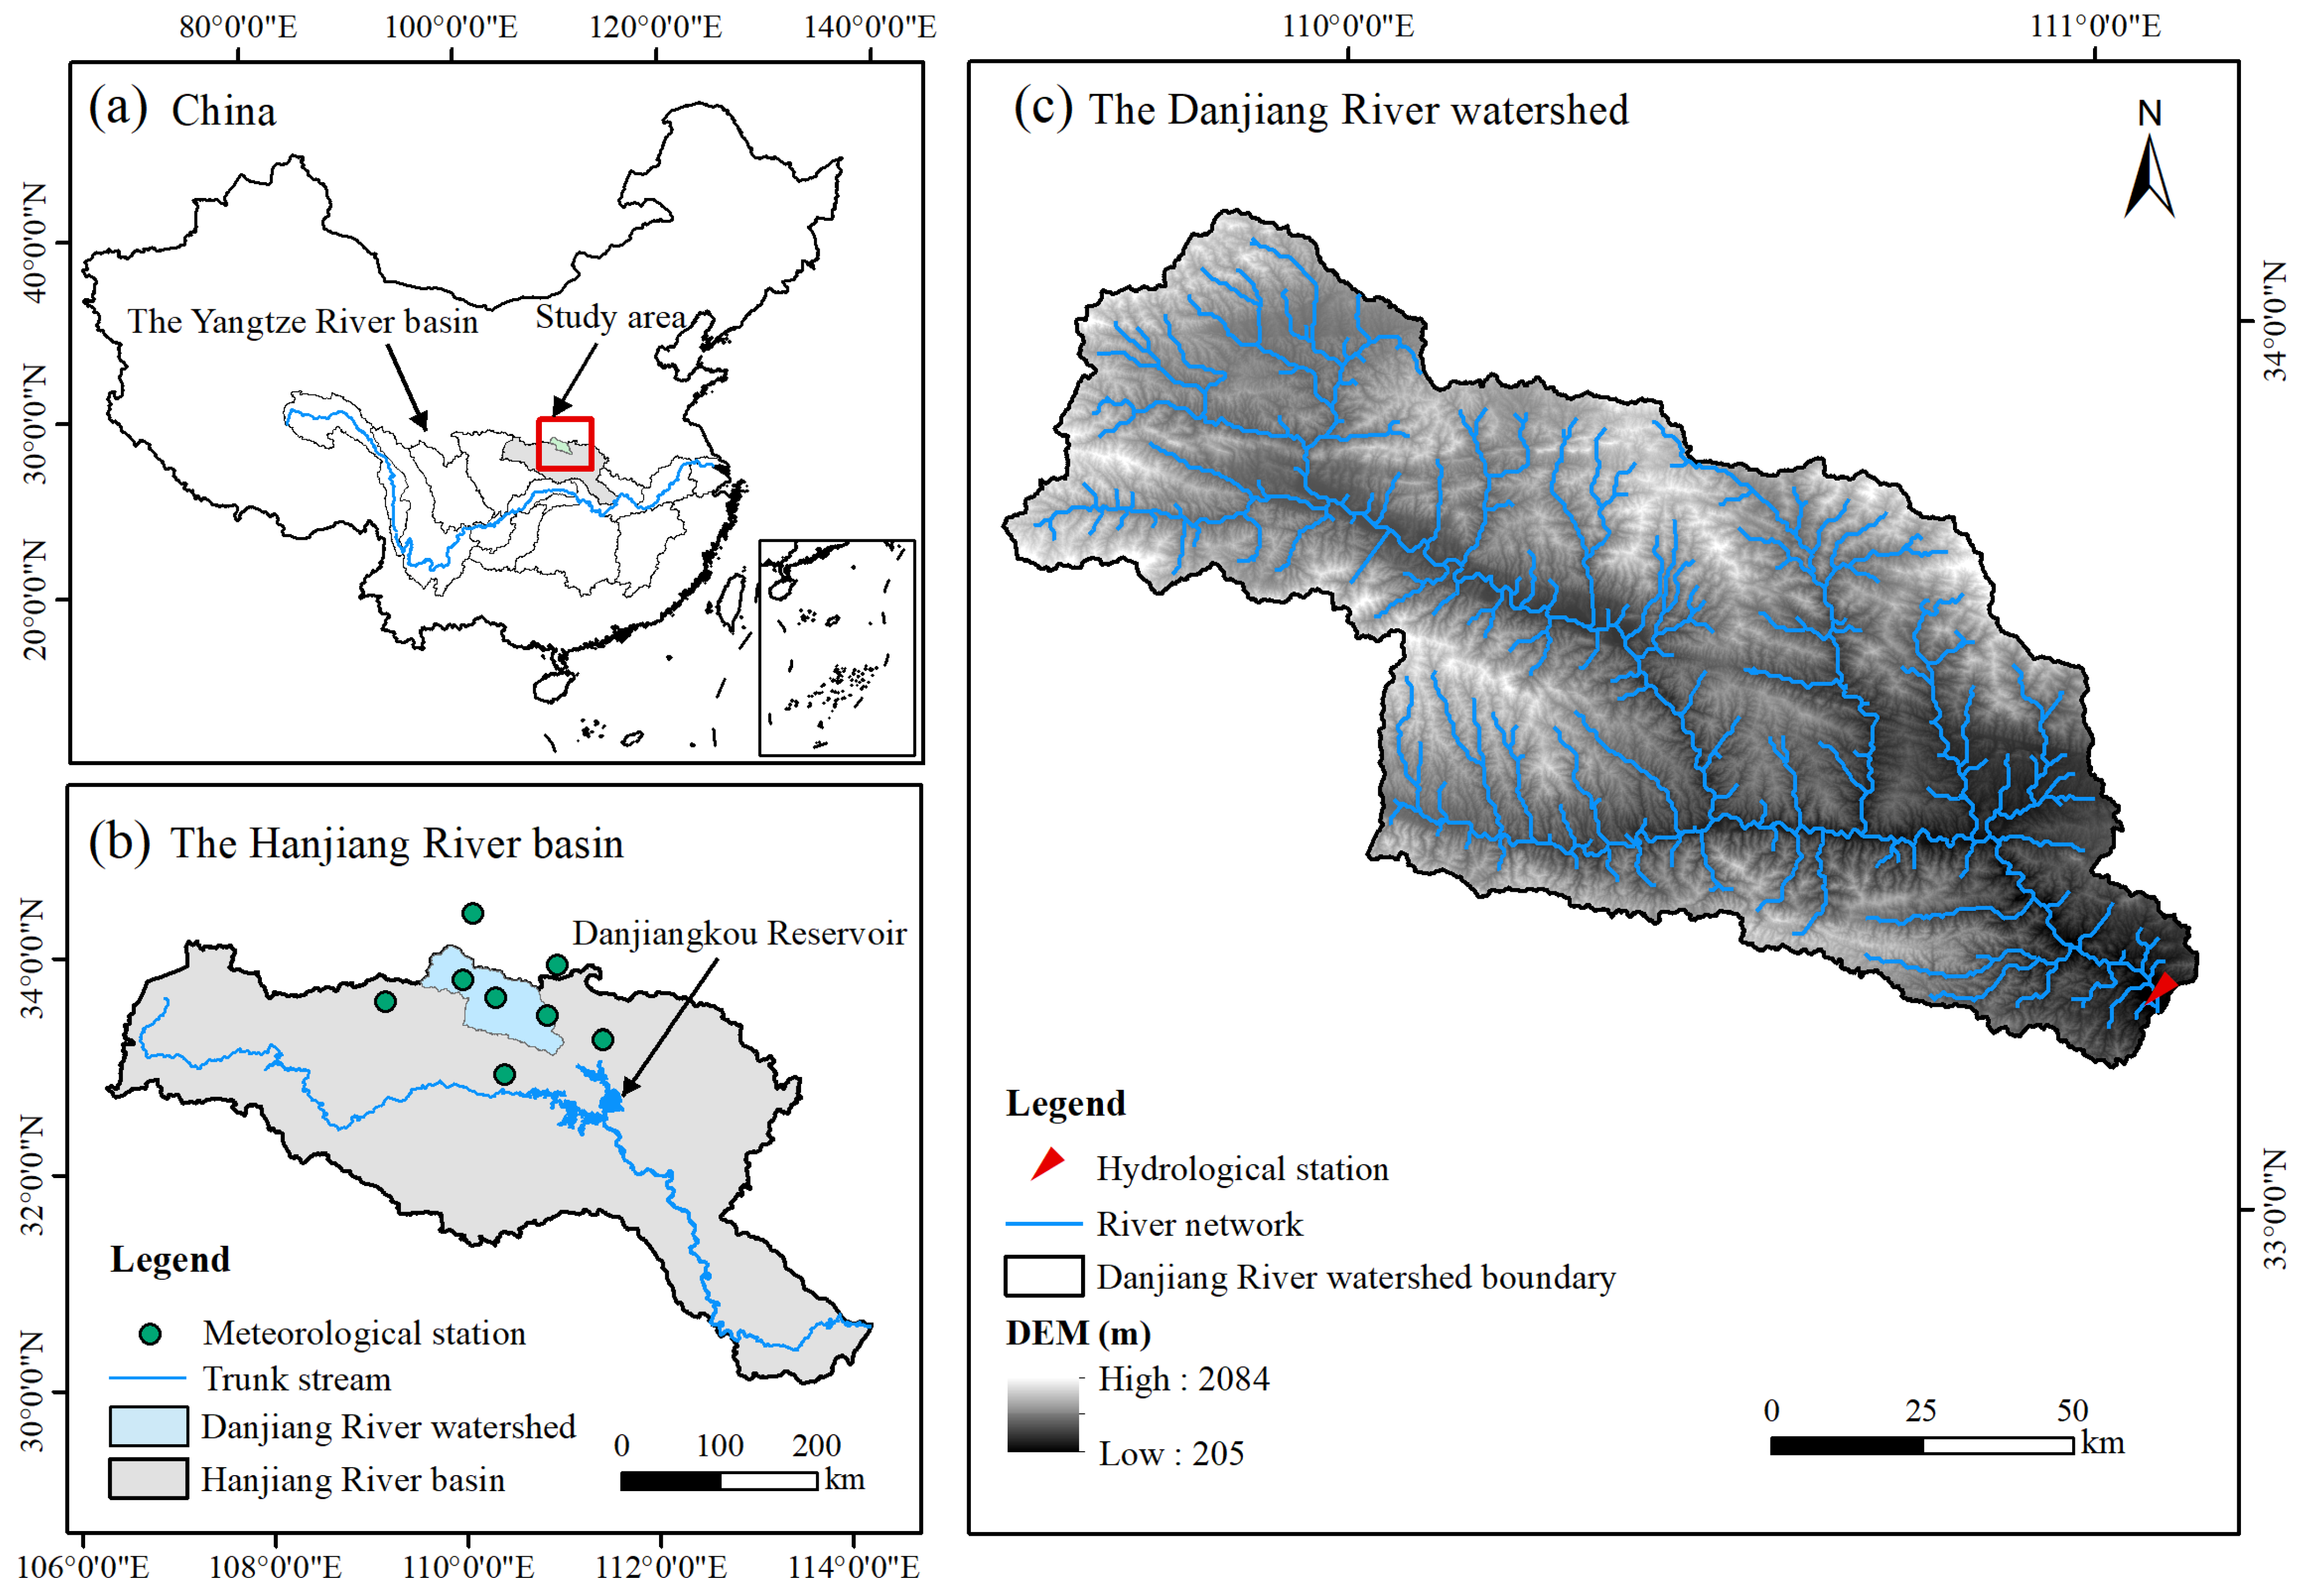
2.1. Study Area

The Danjiang River, located in the upstream of Danjiangkou Reservoir, is the first-order and longest tributary of the Hanjiang River, a tributary of the Yangtze River, China (Figure 1). The river originates from the southern foothills of the Qinling Mountains and converges with the Hanjiang River in Hubei Province, China. The Danjiang River watershed in this study refers to the area controlled by the Jingziguan hydrological station (7086 km2). The geographical range of the Danjiang River watershed selected in this study is 33°10′ N–34°12′ N and 109°28′ E–111°08′ E.
The topography of the Danjiang River watershed shows the characteristics of high in the northwest and low in the southeast. The watershed has a subtropical climate and warm temperate climate with an annual average precipitation of 791 mm and the annual average temperature of approximately 14 °C [31]. Controlled by the interaction of the terrain, underlying surface conditions, and climate, precipitation increased from the northwest to the southeast, whereas the central part of the watershed has two high-value areas of ET0 spatially (Figure 2). The precipitation mostly occurs in the form of rainstorms and is unevenly distributed throughout the year, which causes large floods with a steep rise and fall, high flood peaks, and a short duration.

2.2. Data Source

Observed annual runoff data at the Jingziguan hydrological station from 1960 to 2017 was collected from the Hydrological Yearbook of the People’s Republic of China, provided by the Yangtze River Water Conservancy Committee. The meteorological data series at eight stations within and around the Danjiang River watershed in the study period were obtained from the China Meteorological Data Service Centre (http://data.cma.cn (accessed on 23 May 2018)), including daily precipitation, temperature (mean temperature and maximum and minimum temperature), wind speed, relative humidity, actual vapor pressure, and sunshine duration. All the long-period datasets above were checked for quality assurance by corresponding agencies before delivery. The information on hydrological and meteorological stations used in the study is listed in Table 1. ET0 data were derived by the FAO-modified Penman–Monteith formula. Multi-period (1980, 1990, 1995, 2000, 2005, 2010, and 2015) land use data were acquired from the Resource and Environmental Science Data Platform (http://www.resdc.cn/ (accessed on 1 January 2020)), whose spatial resolution is 1 km. The land use was divided into six classifications, including arable land, forest land, grassland, construction land, water, and unused land. The normalized difference vegetation index (NDVI) data from 1982 to 2015 with a time resolution of 15 d and a spatial resolution of 8 km were obtained from (https://ecocast.arc.nasa.gov/data/pub/gimms/3g.v1 (accessed on 19 August 2020)).

2.3. Methodology

2.3.1. The Identification of Change Trend

To test the hypothesis that the runoff in the Danjiang River watershed has decreased, the nonparametric Mann–Kendall (MK) method [35,36] was performed to indicate whether the hydro-meteorological series in the study region present a decreasing trend. The MK trend method was widely employed to detect the trends of hydro-meteorological time series. The positive Z-value obtained from the MK trend method meant an increasing trend and vice versa. The temporal trend is significant at the 0.05 significance level when the absolute value of the Z-value is greater than 1.96. The trend-free pre-whitening procedure [37] was conducted to remove the serial correlation before applying the MK trend method.

2.3.2. The Determination of Reference and Change Period

The effects of climate change and human activity on runoff variation are quantified in relative terms when applying many approaches; thus, the whole runoff time series should be divided into two or more periods. The first period is regarded as the reference period when relatively few human activities occurred, whereas the later period represents the change period when the watershed is in an intensive human disturbance. The mutation test method was a scientific and objective way to identify the transition year so as to determine the reference and change period. The Pettitt test [38] was applied to identify the abrupt year in the annual runoff time series.

2.3.3. The Quantization of the Effects

For the two empirical statistical methods, simple linear regression and double mass curve, as the whole study period was divided into the reference period and change period, the change in average annual runoff Δ R ¯ can be expressed as follows:
Δ R ¯ = R ¯ r R ¯ c
where R ¯ r represents the average annual runoff of the reference period and R ¯ c represents the average annual runoff of the change period. For a given independent hydrological area, the changes in runoff are attributed to climate change and human activity, which can be calculated as follows:
Δ R ¯ = Δ R ¯ c l i m a t e + Δ R ¯ h u m a n
where Δ R ¯ c l i m a t e and Δ R ¯ h u m a n represent the average change in runoff caused by climate change and human activity, respectively. The effects of climate change ( e c l i m a t e ) and human activity ( e h u m a n ) on the runoff then can be quantified by
e c l i m a t e = Δ R ¯ c l i m a t e Δ R ¯ × 100 ( % )
e h u m a n = Δ R ¯ h u m a n Δ R ¯ × 100 ( % )

Simple Linear Regression

Simple linear regression is a statistical method that describes a relationship between annual precipitation and runoff in the reference period [39]. The relationship is expressed by
R r = a P r + b
where R r is the annual runoff in the reference period; P r is the annual precipitation in the reference period; and a and b are the slope and intercept obtained by the least-squares method, respectively. Afterwards, the annual runoff in the change period can be reconstructed as follows:
R f = a P c + b
where R f is the annual runoff in the change period and P c is the annual precipitation in the change period. Then, the change in runoff caused by climate change (i.e., precipitation) and human activity can be evaluated as follows:
Δ R c l i m a t e = R ¯ r R ¯ f
Δ R h u m a n = R ¯ f R ¯ c
where R ¯ f is the average annual runoff in the change period estimated by R f .

Double Mass Curve

The double mass curve is a simple and popular method for identifying the consistency between long-term precipitation and runoff data [40]. The method is conceptually based on the fact that a plot of the cumulative precipitation and runoff series is expressed by a straight line in the same period. The relationship between the cumulative runoff and cumulative precipitation in the reference period can be estimated as
i = 1 M R i = a 1 i = 1 M P i + b 1       i = 1,2 , 3 , , M
and for the change period, the relationship is expressed as
i = 1 M R i = a 2 i = 1 M P i + b 2       i = M + 1 , M + 2 , , N
where a 1 and a 2 are the slopes and b 1 and b 2 are the intercepts. Then, the average annual runoff in the change period can be reconstructed as follows:
R ¯ f = a 1 i = 1 M P i + b 1 N M       i = M + 1 , M + 2 , , N
The runoff variations induced by climate change and human activity can be determined by Equations (7) and (8), and the contributions of climate change and human activity to runoff variation can be estimated by Equations (3) and (4).

The Elasticity Method Based on the Budyko Framework

The elasticity method based on the Budyko framework consists of two parts: first, sensitivity analysis (the elasticity coefficient of runoff to influencing factors) based on the water balance equation and then the quantitative contribution of each factor to runoff variations [19]. The specific calculation process is described below.
The water balance in an undamaged watershed can be simplified by the following equation:
P = E T a + R + Δ S
where P , E T a , R , and Δ S are precipitation, actual evapotranspiration, runoff, and the water storage change, respectively. For a long period, the value of Δ S is usually regarded as zero. In this study, the E T a can be estimated by the Choudhury–Yang equation [41,42], which is
E T a = P × E T 0 ( P n + E T 0 n ) 1 / n
where E T 0 is the potential evapotranspiration and n is the underlying surface condition parameter that determines the shape of the Budyko curve. The water balance equation of the watershed thus can be written as follows:
P = P × E T 0 ( P n + E T 0 n ) 1 / n + R
The n value at the annual scale then can be calculated by using the annual data of P , E T 0 , and R based on Equation (14).
Supposing that P , ET0, and n are independent of each other, the watershed water balance equation can be rewritten as R = f ( P , E T 0 , n ) , and the elasticity coefficient of runoff to a specific independent variable x can be expressed by the following formula [43]:
ε x i = R x i × x i R
where ε x i represents the elasticity coefficient and x i denotes P , ET0, or n . Let be equal to E T 0 P , and Equation (15) can be decomposed as follows:
ε P = 1 + n 1 n + 1 n + 1 1 + n 1 + n 1 / n
ε E T 0 = 1 1 + n 1 1 + n 1 / n
ε n = ln 1 + n + n ln 1 + n n 1 + n 1 1 + n 1 n
A positive (negative) value of the elasticity coefficient of a variable suggests that R increases (decreases) with the increase in the variable.
As for the quantification of contributions, the runoff variation caused by the affecting factor (i.e., precipitation, ET0, and underlying surface feature) can be reckoned by the product of the change value of the factor and its partial derivative. Hence, the contribution of each factor to runoff variations can be estimated by the following differentiating equation:
d R = R P d P + R E T 0 d E T 0 + R n d n
where d R , d P , d E T 0 , and d n are the change in runoff, precipitation, potential evapotranspiration, and underlying surface feature from the reference period to the change period, respectively. Equation (19) can be briefly expressed as follows:
d R = d R P + d R E T 0 + d R n
where d R P , d R E T 0 , and d R n are the runoff variations induced by changes in precipitation, potential evapotranspiration, and underlying surface feature, respectively. The sum of d R P , d R E T 0 and d R n can be expressed as d R s . If the calculated runoff variation ( d R s ) is similar to the observed runoff variation, it means that the elasticity method based on the Budyko framework was effective in detecting the contributions of the three factors to the runoff variation.
The relative contribution of each affecting factor to the runoff variations can be calculated as follows:
C x i = d R x i d R × 100 ( % )
where x i denotes each affecting factor.

Paired Year with Similar Climate Conditions

The general hydrological balance equation in a system within any period of period can be expressed as follows:
( P + W 1 + W 2 ) ( W 1 + W 2 + E T a + Q ) = Δ S
where P is precipitation; W 1 and W 2 are the amount of water flowing into the surface and underground, respectively; W 1 and W 2 are the amount of water flowing from the surface and underground, respectively; and E T a , Q , and Δ S represent the actual evapotranspiration, water consumption, and water storage change, respectively.
Applying the general formula to a closed watershed, there is no water inflow from the surface and underground. Then, based on the assumption that the values of Δ S can be regarded as zero for long-term analysis, the water balance equation in a closed watershed can be simplified to
P = E T a + R
ETa is an important component affecting water balance, and it is thought to be the main difference between different land surface conditions. According to the studies reported by Allen et al. [44], there is a proportional relationship between ETa and ET0. The water balance equation thus can be expressed as
P = β × E T 0 + R
where β is the reduction coefficient reflecting humidity conditions, which is usually supposed to be a function of soil moisture content. Therefore, we calculated ET0 using the FAO-modified Penman–Monteith equation in this study, as we supposed that the annual ETa in the same watershed in different years without human influence are identical under the same climate conditions, and once there is a faster change than natural evolution, it is the result of human impact [23]. ET0 is used to describe the overall features of the other meteorological factors except for precipitation, reflecting the combined results of climate variability.
Then, we determined the paired years with similar conditions (i.e., same or similar precipitation and ET0) according to the following three requirements [22]: (1) the difference between annual values of precipitation as well as ET0 or the selected two years is less than 2.0%, (2) the monthly distributions of precipitation and ET0 for the selected two years are significantly similar (p < 0.05), and (3) the difference between the selected two years is greater than five years.
Finally, the difference in runoff between the paired years with similar climate conditions can be ascribed to human activity, which can be estimated by
e h u m a n = R o 2 R o 1 R o 1 × 100 ( % )
where R o 1 and R o 2 represent the runoff observed in the earlier year and the later year in the paired years, respectively. Since human activity is constantly changing, the results emphasized the relative changes in human activity between the paired years with similar climate conditions.

2.4. The Evaluation of Methods

The method performance was evaluated based on the Nash–Sutcliffe efficiency ( N S E ) and relative error ( R E ) in this study, which are computed as follows:
N S E = 1 i = 1 n R s R o 2 i = 1 n R o R o ¯ 2
R E = i = 1 n ( R o R s ) i = 1 n R o × 100 %
where R s and R o are the simulated and observed runoff, respectively, and R 0 ¯ is the mean value of R o .
The NSE and RE values are primarily used to examine the goodness of fit between the simulated and observed values for the reference period to make sure that the method is suitable to simulate hydrologic conditions and provide reasonable results during the period. Generally, simulation results are considered satisfactory when the NSE is greater than 0.5 and the RE is less than 25%.

3. Results

3.1. Hydro-Meteorological Characteristics Variations

The runoff, precipitation, and ET0 experienced differences in various periods of the Danjiang River watershed (Table 2). The average annual runoff depth, precipitation, and ET0 were 216.8 mm, 792.6 mm, and 989.6 mm, respectively. The variation in runoff depth from 1960 to 2017 showed high variability with coefficients of variation being 0.69 and the extreme ratio being 21.52, whereas the changes in precipitation and ET0 were relatively stable. The average decadal runoff depth peaked in the 1960s (369.3 mm) and bottomed in the 1990s (127.7 mm). A significant change point was detected for an annual runoff depth at Jingziguan hydrological station in 1989 (p < 0.05). Compared with the reference period (1960–1989), the average annual runoff depth was reduced by 46.11% during the change period (1990–2017), whereas precipitation and ET0 decreased by 2.67% and 1.04%, respectively.
The study region experienced a comparatively drying and warming period over the past 58 years (Figure 3). The annual runoff depth of the Danjiang River watershed presented a significant decreasing trend (p < 0.05) with an average annual change rate of −3.88 mm year−1. The trends of the climate variables from 1960 to 2017 were analyzed to better understand climate change in the watershed. The annual precipitation and ET0 both showed non-significant change trends (p > 0.05), while the annual temperature exhibited a significant increasing trend with the increasing rate of 0.1 °C decade−1 (p < 0.05).

3.2. Changes in Land Use and Vegetation Cover

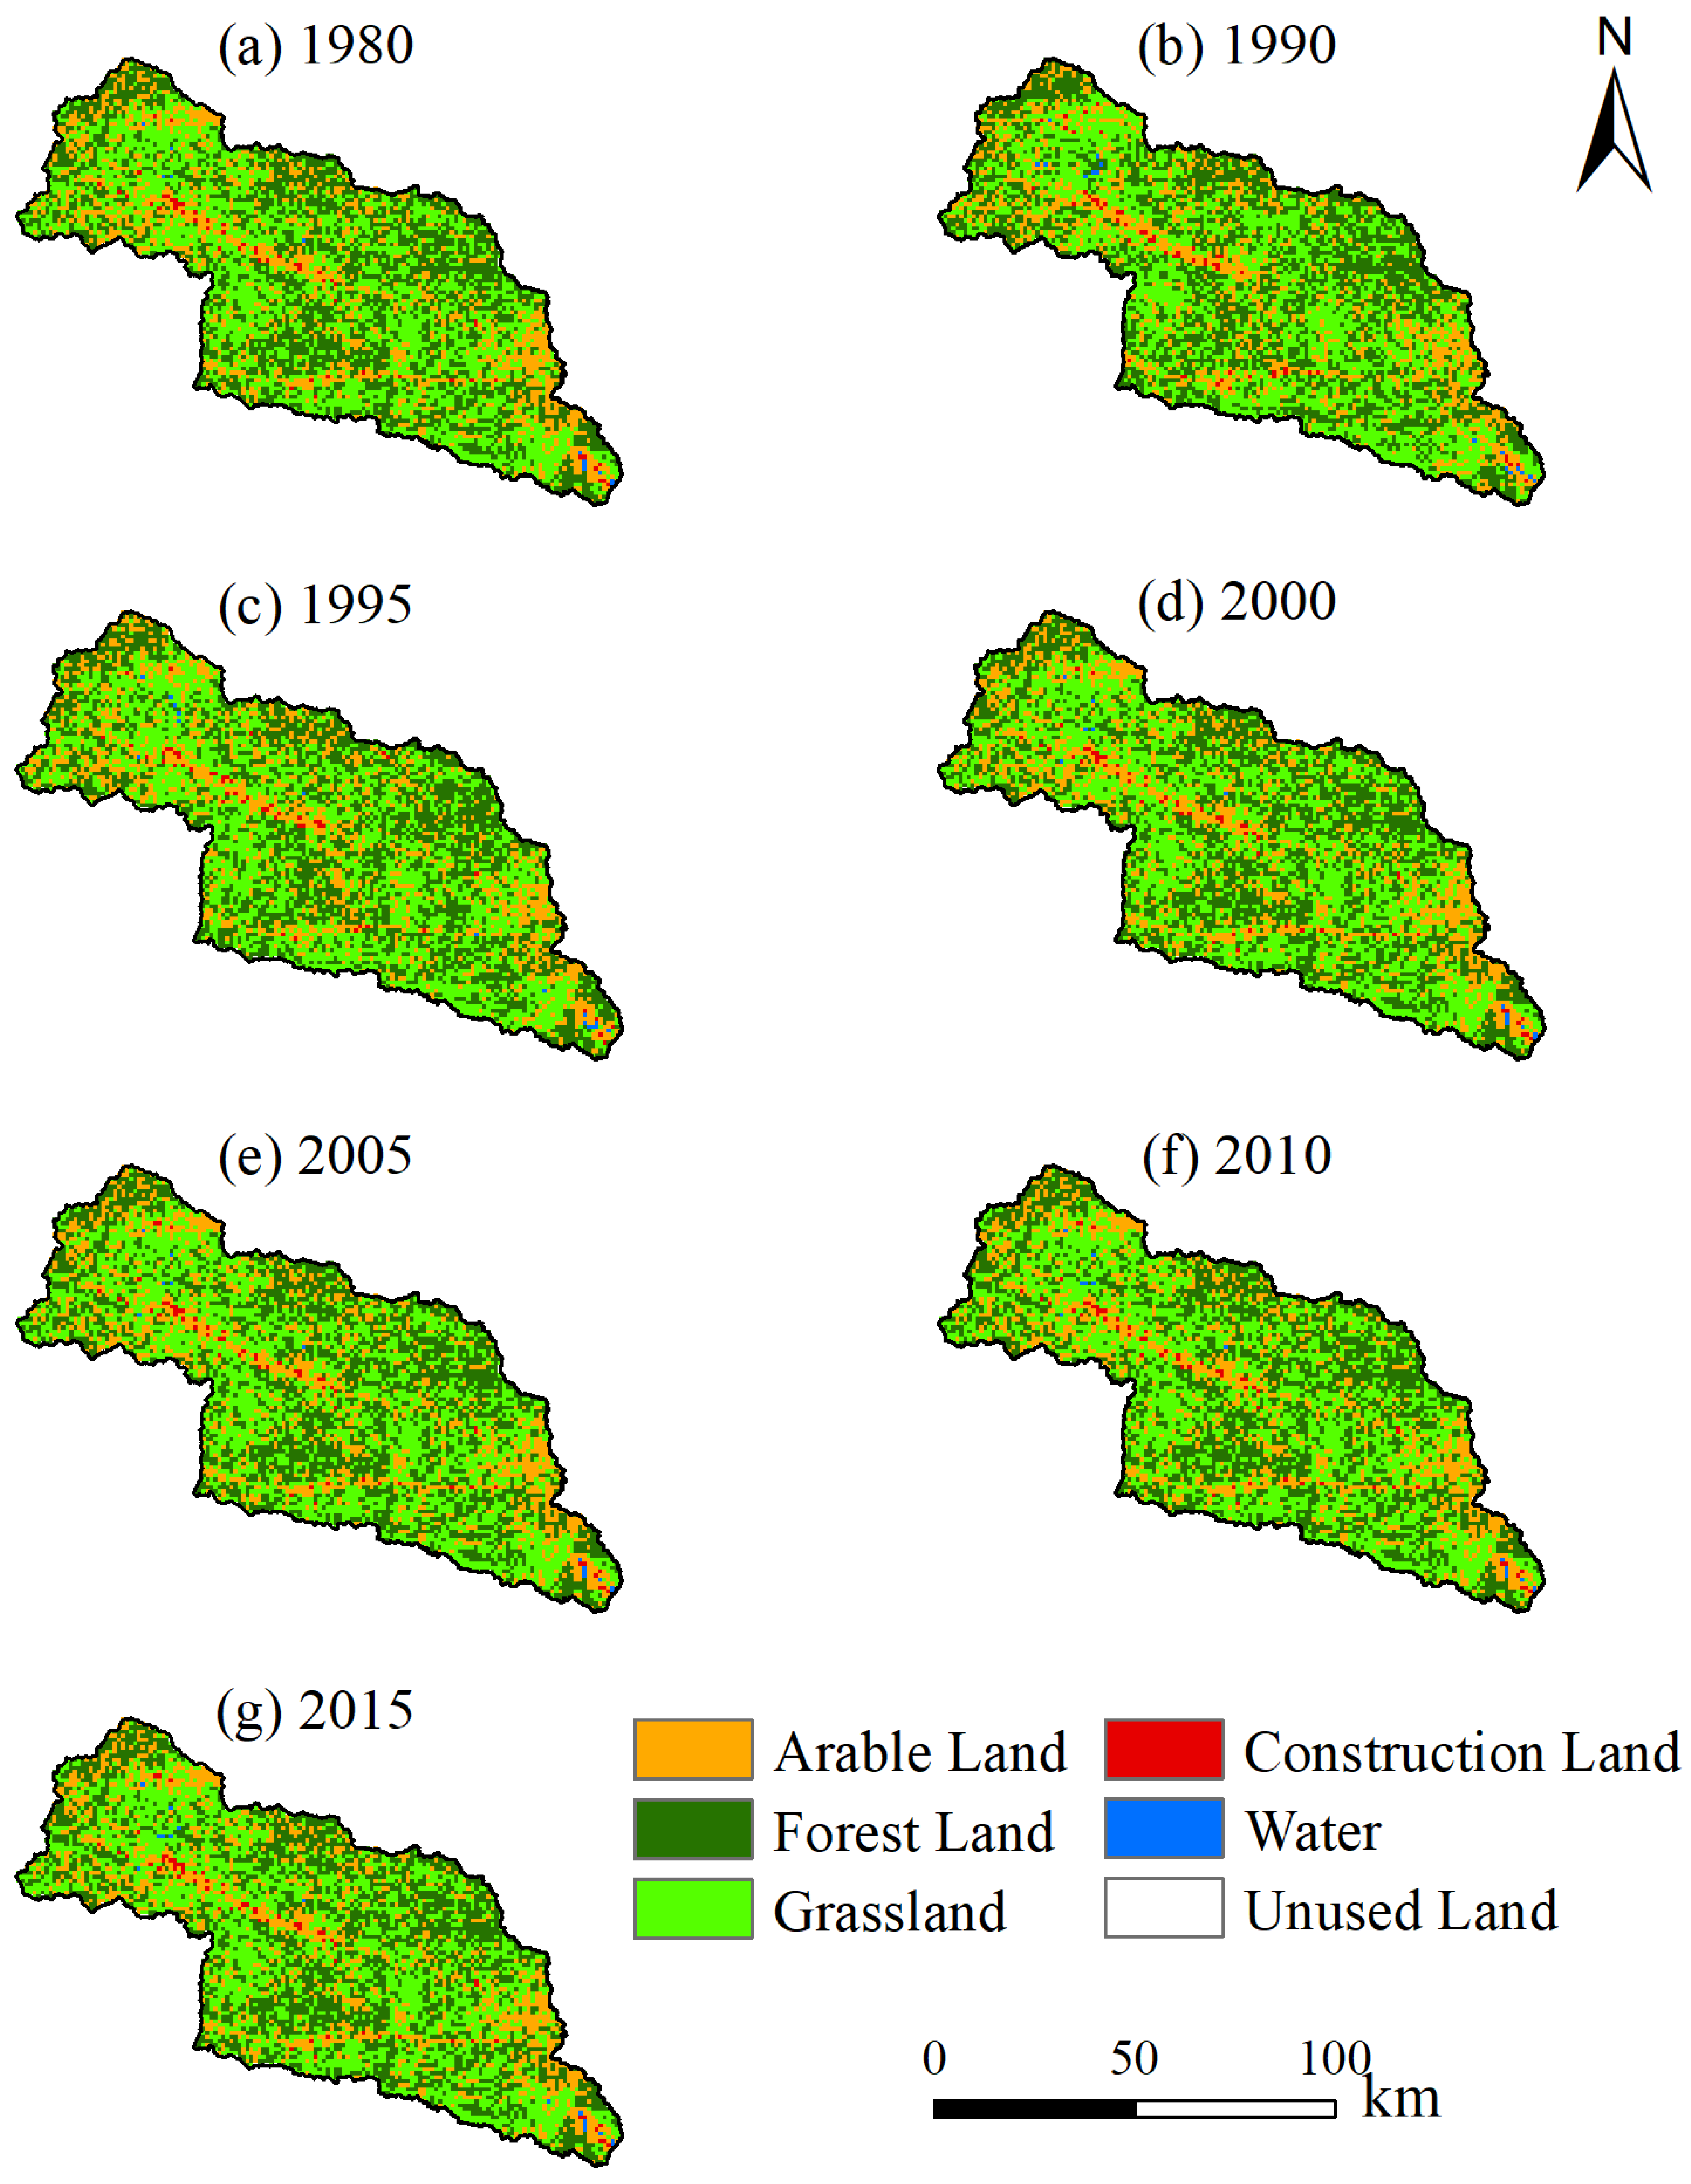
3.2.1. Land Use Changes

The land use types in the Danjiang River watershed were arable land, forest land, and grassland (Figure 4). The grassland was the largest, followed by forest land, and the area of unused land was the smallest in each period. Spatially, the grassland was distributed widely, while the arable land and construction land were mainly distributed adjacent to the river system. From 1980 to 2015, the area of the arable land followed a pattern of decrease–increase–decrease–increase, reaching its maximum value (1557 km2) in 2000, accounting for 21.97% of the drainage area, whereas the change pattern of the forest land and grassland area was opposite to that of the arable land area generally. Although the area of the construction land and water in each period was less than 1% of the total watershed area, the area of construction land has continued to increase and reached 0.91% in 2015.

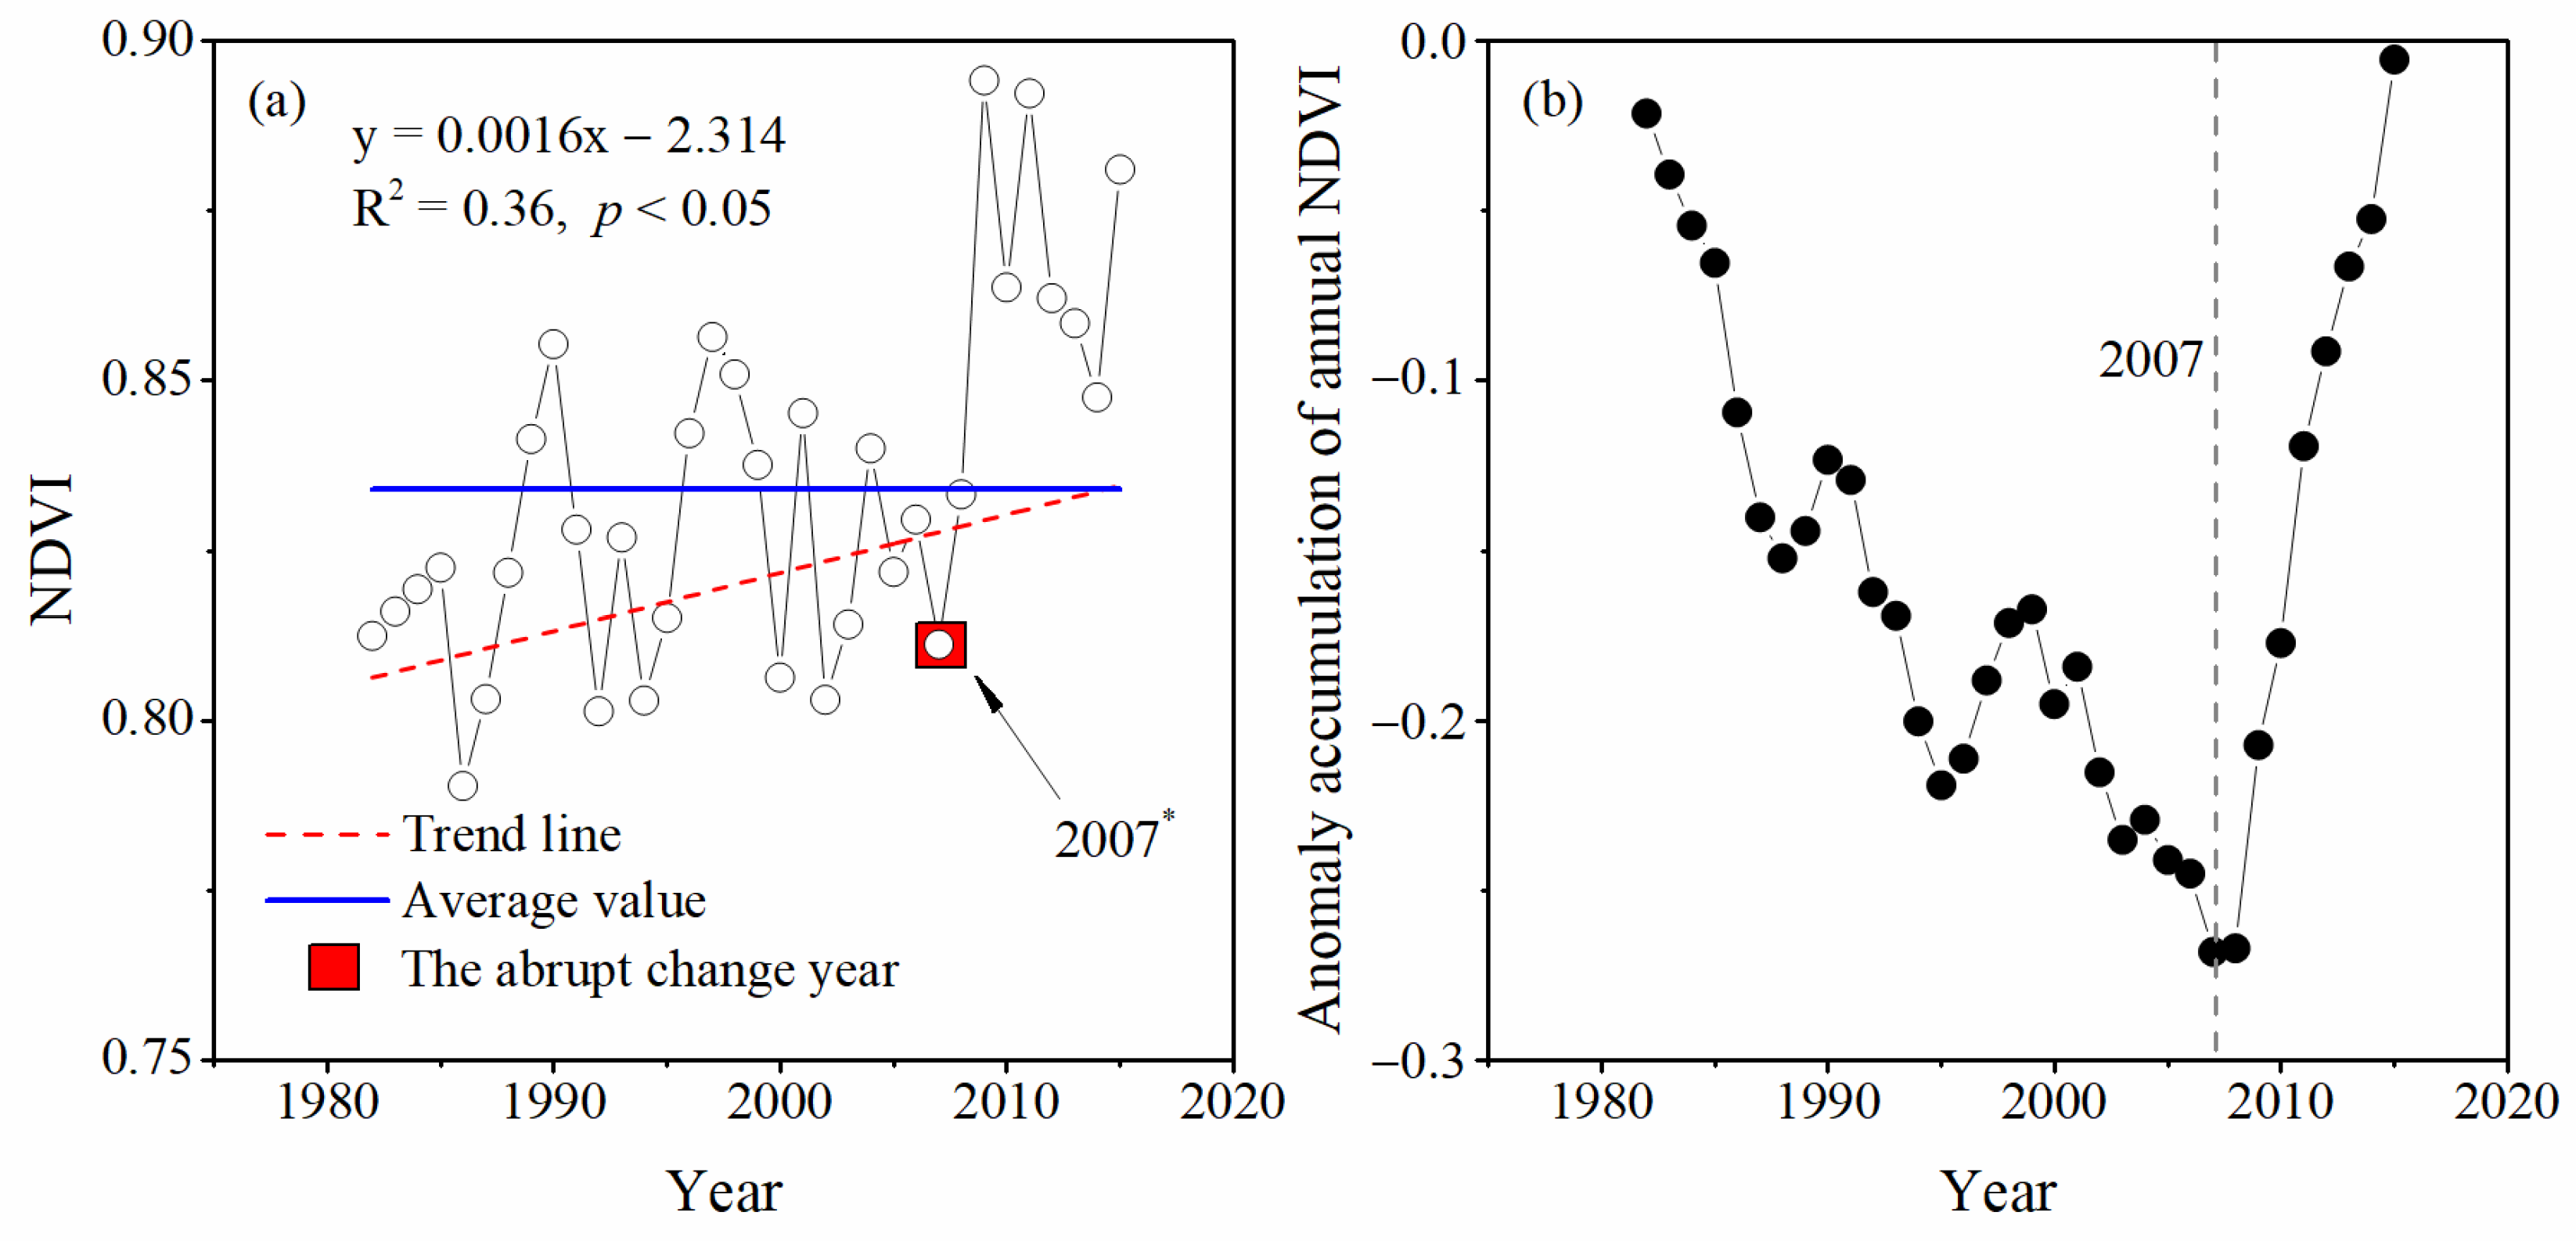
3.2.2. Spatiotemporal Variations of NDVI Vegetation Patterns

As shown in Figure 5a, the vegetation coverage in the Danjiang River watershed was generally dense from 1982 to 2015, with a multi-year average of 0.83, ranging from 0.79 (1986) to 0.89 (2009). Annual NDVI presented a significant increasing trend (p < 0.05) during the period of 1982–2015, with an increase rate of 0.16% year−1. Three mutation test methods revealed that the significant mutation change year of the annual NDVI value was 2007 (p < 0.05). Figure 5b intuitively shows that the annual NDVI in the watershed exhibited obvious phased characteristics, which can be divided into 1982–2007 (relatively low vegetation cover) and 2008–2015 (relatively high vegetation cover), further confirming that the annual NDVI had an abrupt change year in around 2007.
Corresponding to the spatial distribution of land use and to better understand vegetation cover changes, the spatial distribution of the annual NDVI in 1982, 1985, 1990, 1995, 2000, 2005, 2010, and 2015 were selected and presented (Figure 6). The overall spatial distribution of the annual NDVI showed obvious heterogeneity, with the characteristics of annual NDVI values low in the middle and high in the periphery. Although the overall vegetation coverage of the Danjiang River watershed was luxuriant and the average NDVI was relatively high, the upstream area and the outlet, especially the northwest corner, have always been low-value areas for the NDVI, with NDVI values around 0.6. From 1982 to 1985 and then to 1990, the vegetation coverage in the watershed continued to increase, while from 1990 to 1995, the vegetation coverage decreased slightly, which was consistent with that shown in Figure 5a. The comparison of Figure 6a,h shows that the vegetation coverage of the watershed has been improved on the original basis.

3.3. Hydrological Simulations

For simple linear regression, there was a great agreement between simulated and observed runoff in the Danjiang River watershed during the reference period, with the NSE value being greater than 0.5 and the RE being less than 20%, whereas for the double mass curve, the NSE value was less than 0.5, and the RE was exactly 20%. However, the capability of the two methods to simulate runoff is similar in the reference period with a similar coefficient of determination (R2) being 0.59 and 0.6, respectively (Figure 7). For the Budyko framework, the RE between calculated d R and measured d R s was less than 5%.

3.4. Quantifications of Effects on Runoff Variation

When applying three of the four selected methods in this study to quantify the effects of climate change and human activity on runoff change, the entire study period needed to be divided into a reference period (with little human activity influence) and a change period (with intensive human activity effects). As the significant transition year in 1989 was detected, the reference period and the change period were 1960–1989 and 1990–2017, respectively.

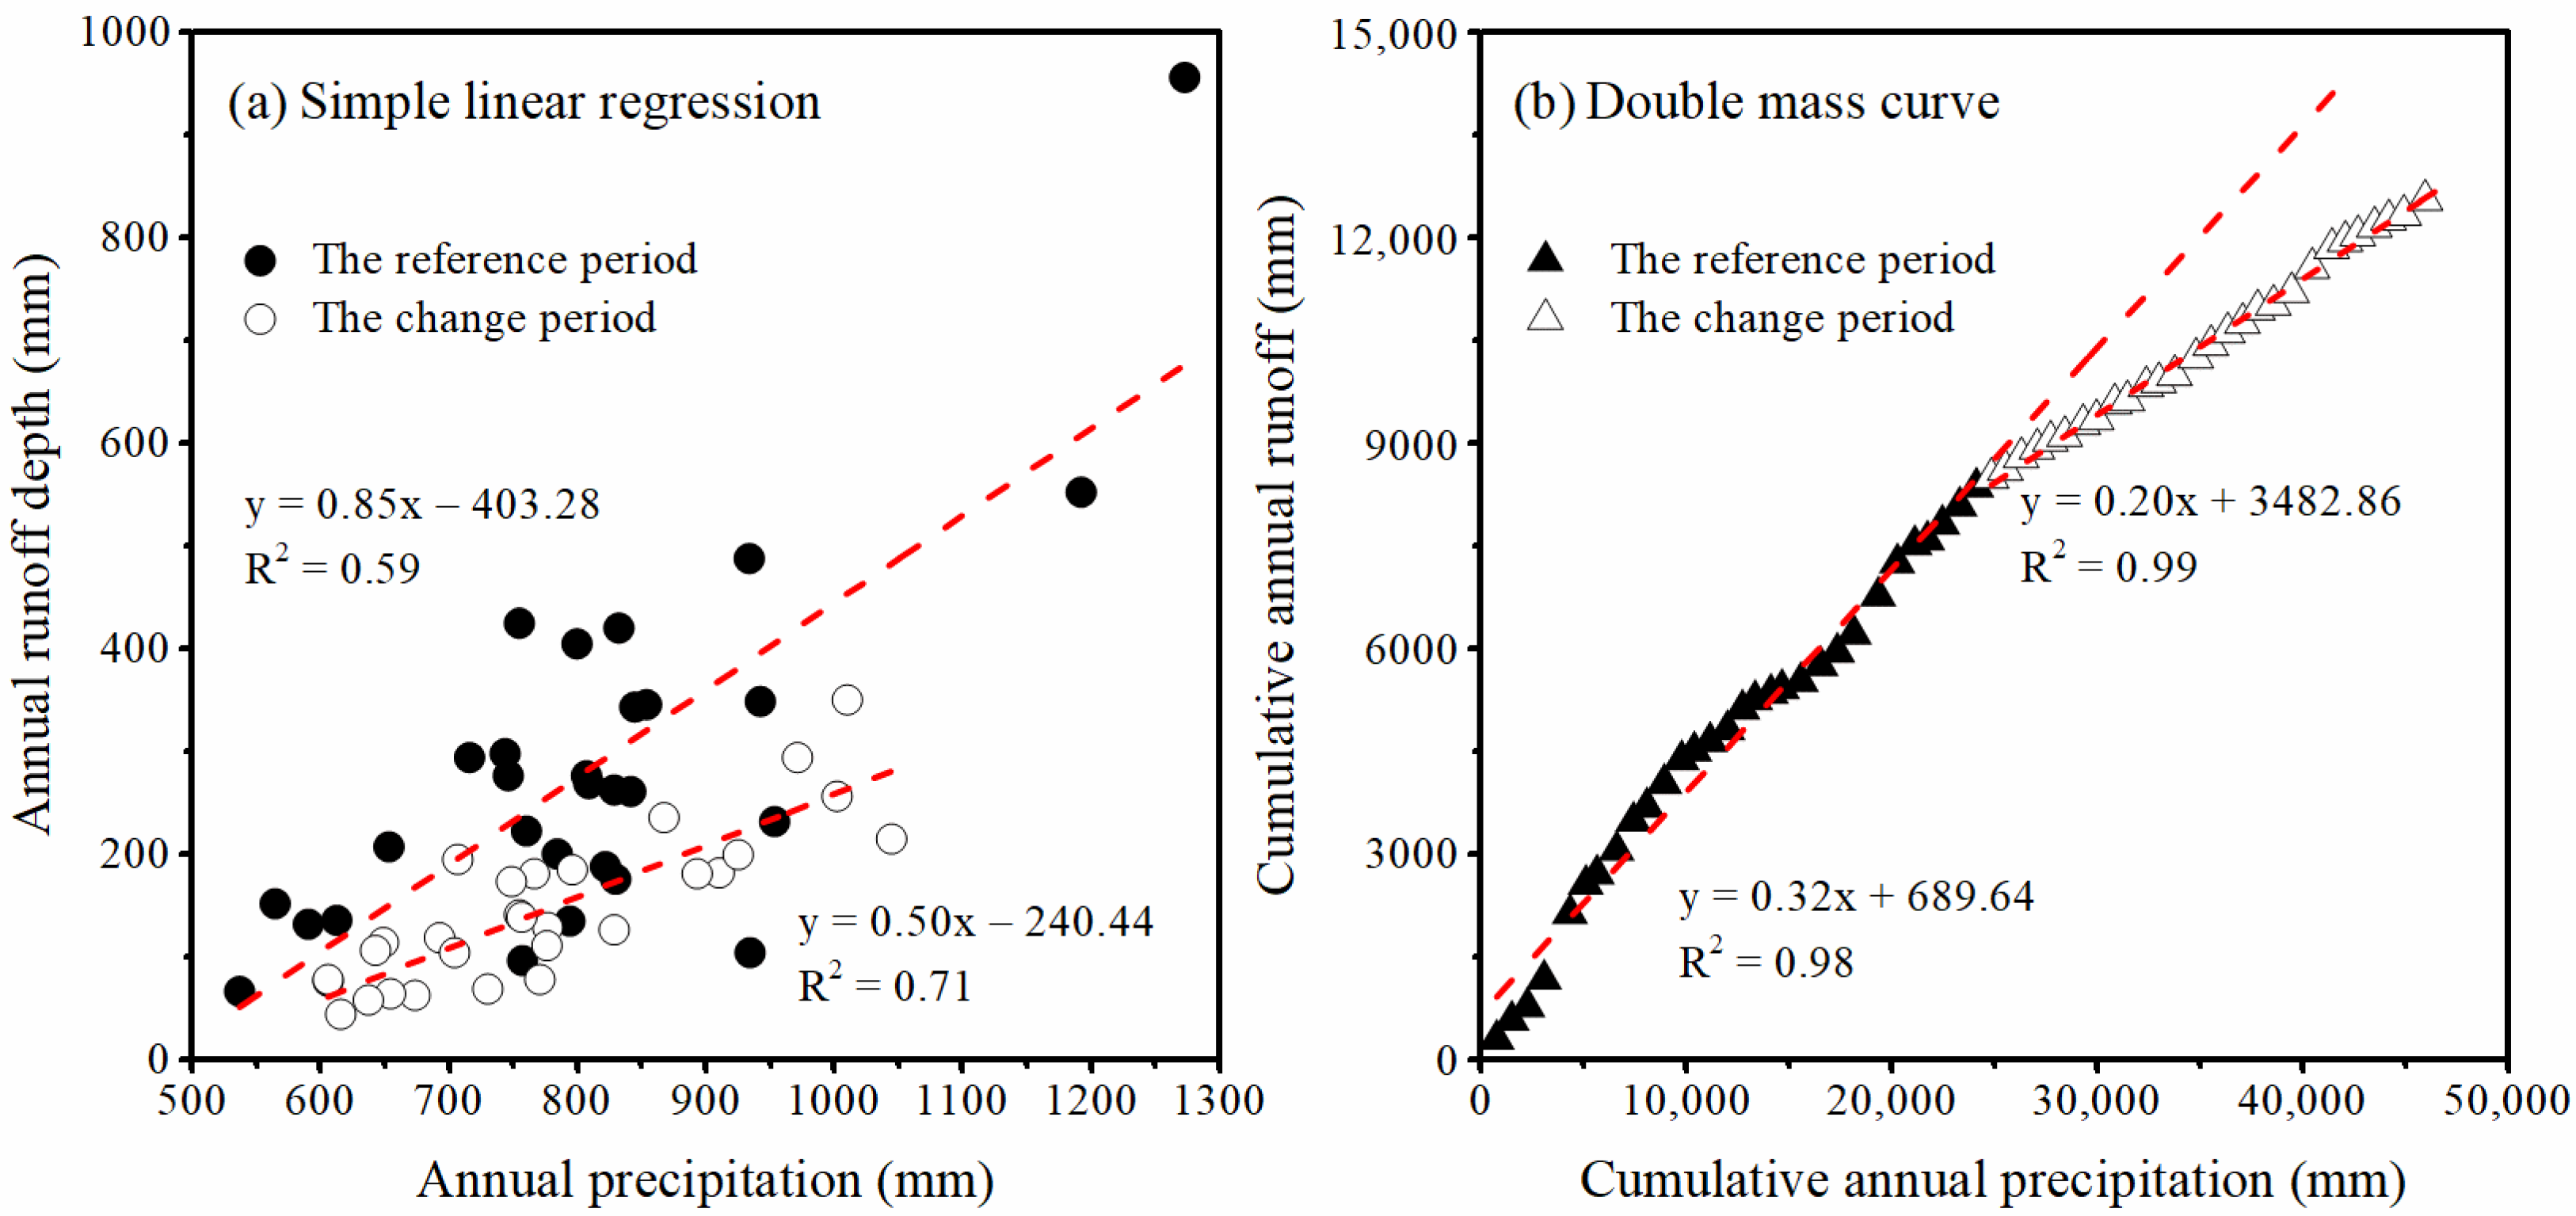
3.4.1. Simple Linear Regression

The variation in the runoff–precipitation relationship was influenced by human activity. It can be seen in Figure 8a that the correlation points of the change period lie below those of the reference period, which suggests the runoff in the change period was less than that in the reference period under the same precipitation condition. It was detected that human activity led to a great reduction (85.88%) in annual runoff in the Danjiang River watershed, with 14.12% of the decrease caused by precipitation during the change period (Table 3).

3.4.2. Double Mass Curve

The slope of the regression line in the change period is lower than that of the reference period (Figure 8b). The dominant driving factor for annual runoff reduction was human activity, with a contribution of 80.22% in the change period (1990–2017) for the study region, and the remaining 19.78% was attributed to climate change (Table 3).

3.4.3. The Budyko Framework

The absolute value of elasticity coefficients in the change period were all greater than those in the reference period, and the elasticity coefficient of runoff to precipitation was the largest for both in the two periods (Table 4). The elasticity coefficients ranged from 1.81 to 2.58 for precipitation, from −0.81 to −1.58 for ET0, and from −0.97 to −1.26 for underlying surface feature, indicating a 1% increase in precipitation, ET0, or underlying surface factor would lead to a 1.81–2.58% increase, 0.81–1.58% decrease, or 0.97–1.26% decrease in runoff.
Underlying surface alterations played a major role in runoff reduction for the period of 1990–2017, with a contribution of 92.88%, whereas the contributions of precipitation and ET0 were 8.91% and −1.79%, respectively (Table 5).

3.4.4. Paired Year with Similar Climate Conditions

There were nine pairs of years and the temporal difference varied from 6 to 42 years (Table 6). Runoff in all sets showed declining trends, which meant runoffs in Year2 in all paired years were less than those in Year1. Among these sets, the two years in Pair-3 and Pair-5 were in the reference period, and the two years in Pair-8 and Pair-9 were in the change period. The contribution of human activity then can be estimated by comparing the differences in runoff between paired years with similar climate conditions. The relative decreasing amplitude of all sets ranged from 29.80% (Pair-9) to 74.69% (Pair-7), while for Pair-1, Pair-2, Pair-4, Pair-6, and Pair-7, where Year1 was in the reference period and Year2 was in the change period, the relative degree of change was between 54.19% and 74.69%, with an average of 64.87%.

4. Discussion

4.1. Comparison of the Results

A comparison of the results obtained by the three different methods applied in this study (i.e., simple linear regression, double mass curve, and the elasticity method based on the Budyko framework) suggested that the dominant factor resulting in runoff reduction in the Danjiang River watershed was human activity, while there were still some differences in terms of the specific values of the contribution. In recent decades, a series of water conservancy projects and soil and water conservation measures have been carried out in the Danjiang River watershed, which had an impact on land use structure (Figure 4) and vegetation cover (Figure 6), directly or indirectly affecting the hydrological process. The effect of human activity on runoff variations estimated from the elasticity method was the greatest with a value of 92.88%, and the estimate made by the double mass curve method was 80.22%. Yang et al. [45] reported that a decreasing ET0 or increasing precipitation resulted in an underestimate of the climatic effects when detecting the climatic contributions to runoff based on the Budyko hypothesis. In this study, the annual precipitation increased by 0.002 mm decade−1 and ET0 decreased by 0.68 mm year−1 in the Danjiang River watershed (Figure 3), which can partly explain why the climatic contribution to runoff reduction calculated by the elasticity method based on the Budyko framework was the smallest. For the paired year with similar climate conditions method, great differences were observed among paired years with the contributions of human activity to the decrease in runoff ranging from 29.80% to 74.69%. If only viewed from the pairs when Year1 was in the reference period and Year2 was in the change period, the comparison between Year2 and Year1 also showed that human activity was the main factor affecting runoff reduction.
It has to be noticed that although human activity played a leading role in runoff changes in the watershed, the role of climate variability cannot be ignored. Xu et al. [46] addressed that the decrease in precipitation was the main cause of runoff reduction based on the runoff data at the Jingziguan station and precipitation data from rainfall gauge stations between 1958 and 2015 in the Danjiang River watershed. Climate change leads to shifts in precipitation, evapotranspiration, and temperature, further resulting in notable variations in the hydrological characteristics of the river [47]. The results in this study showed precipitation presented an upward trend and ET0 displayed a downward trend (p > 0.05), whereas temperature significantly increased (p < 0.05), which was consistent with the findings of Li et al. [48]. They elucidated that temperature in the Hanjiang River basin showed a significantly increased trend, while no significant trend was found for precipitation and ET0. Based on Budyko’s hypothesis, under constant energy conditions, as precipitation increases, ET0 will decrease slightly. As for temperature, Hu et al. [13] revealed that the increased temperature trend might be driven by increased concentrations of carbon dioxide and other human-induced emissions released into the atmosphere. Ren and Zhou [49] reported that the mean temperature in mainland China was significantly affected by urbanization, reaching an increase of 0.047 °C every 10 years. It can be seen from Figure 4 that the area of construction land has continued to increase in the watershed. Urbanization would lead to an increase in runoff due to the increase in impermeable areas. In this sense, the contribution of climate change to the long-term reduced runoff might be partially offset by the contribution of rising temperature to the increased runoff in certain years.
Different methods have different principles and computational characteristics, thus considering the results of various quantitative methods could be more convincing than using just one method [29,39,50]. Generally, the results of the attribution analyses in this study indicated that human activity played a leading role in runoff reduction in the watershed, which is consistent with the findings in other basins, such as the Itacaiúnas River basin in the Amazon [51], Iranian basins [52], the Lancang-Mekong River [47], the Wuding River basin of the Yellow River [53], and the Jialing River of the Yangtze River [24]. Several studies have been conducted to analyze the runoff variations and the driving factors in the Hanjiang River basin [54,55]. Li et al. [56] reported that runoff reduction in the upper reaches of the Hanjiang River basin from 1991 to 1999 was mainly influenced by climate change, whereas human activity was the main factor for runoff reduction during the period of 2000–2008 via three methods (i.e., double mass curve, the sensitivity analysis, and the cumulative slope change rate comparison method). Xia et al. [57] used a hydrological model, the Distributed Time-Variant Gain Model (DTVGM), and six elasticity methods to analyze the inflow runoff variations from 1986 to 2013 in the Danjiangkou Reservoir and found that the effect of human activity on the runoff reduction was greater than that of climate change, which is consistent with the results obtained by our study. Li et al. [48] reported that climate change was the major factor for runoff reduction in the upper Hanjiang River basin via a Budyko-based covariate analysis. The differences were attributed to different study regions, available data sources, the length of time series, and methods [16].

4.2. Applicability and Limitations of the Chosen Methods

We conducted a case study of the Danjiang River watershed to detect the response of runoff variations to climate change and human activity. The results showed that the quantitative estimations were consistent across the selected methods, including empirical statistics methods, the elasticity method based on the Budyko framework, and the paired year with similar climate conditions method. These methods are accessible and exhibit their own merits and limitations.
Empirical statistics methods (i.e., simple linear regression and double mass curve) are simple and practical, and the primary requirement is the long time series of annual runoff and precipitation data. Consequently, the physical mechanism of hydrological processes cannot be revealed when applying these methods. However, empirical statistics methods are applicable to quantify the hydrological impacts of precipitation and human activity in basins based on long-term hydro-meteorological observations [24,40]. In this study, the R2 of the simple linear regression and double mass curve in the reference period was 0.59 and 0.6, respectively, and the two methods produced similar magnitude estimates compared with the elasticity method. This may be ascribed to the strong relationship between precipitation and runoff in the Danjiang River watershed. Wu et al. [39] reported empirical statistics were not suitable methods when focusing on assessing the effects of climate change and human activity on runoff alteration in the Yanhe River basin because there were poor performances of the reconstructed regression equation in the reference period. It is thus suggested that empirical statistics can be applied in areas where precipitation and runoff are closely related since they generally evaluate the effects of climate change by building a relationship between precipitation and runoff based on long-term historical datasets.
As for the paired year with the similar climate conditions method, it is simple and easily applicable to the selected periods with similar climate conditions covering one or more meteorological elements in most areas. The method avoids the assumption of ‘‘no or few effects of human activity’’ in the reference period and only compares two years in paired years with similar climate conditions without considering the reference period and change period, which is more flexible compared to the other methods [23]. The result estimated by this method can corroborate the results obtained by other approaches. It is possible to apply this method to assess the impact of human activity in more detail (i.e., daily and hourly scales) and the contribution of various types of human activities to runoff variation over time if more detailed data is procurable. The drawback of the method may be that the number of paired years is unknown. As the number of paired years increases, the difficulty of selecting representative paired years increases, and the accuracy of calculating the degree of human activity impact will decrease. When determining the paired years with similar conditions, it is desirable to include erosive rainfall and rainfall erosivity factors to improve the accuracy and representativeness of paired years.
The elasticity method based on the Budyko framework expresses sensitivities of runoff variations to precipitation, ET0, and n by elasticity coefficients. The method is based on the principle of watershed water balance with a simple but more physical background [10,58], which is in accordance with the hydrological cycle. Therefore, it is paramount to estimate ET0 accurately to avoid the occurrence of significant errors [59]. Nevertheless, since the climate elasticity varies with climate change, the elasticity method is only suitable where long periods of hydro-meteorological records are available. In addition, there are multiple Budyko-based methods to distinguish the relative contributions of climate change and human activities to runoff variation [20,21]. Furthermore, Li et al. [60] revealed that the residuals between the observed and estimated changes induced by the first-order Taylor expansion might affect the assessment results of the elasticity method based on the Budyko framework. It has to be noticed that if precipitation, ET0, and n change significantly in a watershed, the result obtained by this method would be overestimated.
It was reported by Sun et al. [10] and Wu et al. [39] that there were limitations and uncertainties in quantitative analysis methods. For instance, detecting quantitative responses of runoff variation to climate change and human activities is based on the assumption that the two factors are independent, whereas they are mutually affected and inseparable [48,52]. Another uncertainty is that some methods assume that the water storage change in the watershed is negligible over long periods, whereas water storage change may not be ignored, and the time-delayed effect of runoff on rainfall also needs to be considered [61]. Wang [62] indicated that if the water storage change in the change period was greater than that in the reference period, the runoff variation induced by climate change was probably overestimated and vice versa. Moreover, these methods attempt to capture the long-term impacts of climate change and human activity on the runoff alteration at the annual scale, while inter-annual and intra-annual effects of climate change especially the changes in climate extremes, which have significant effects on runoff [63,64], have not been taken into account. In addition, uncertainties in the structure and parameters of the elasticity method based on the Budyko framework and the thresholds setting of screening similar climate conditions in the paired year with the similar climate conditions method would also affect the quantitative results. The quality and quantity of the meteorological data are an additional source of uncertainty [65,66]. All of these uncertainties can influence the obtained results to some extent, and we will investigate these estimation uncertainties in our future research.

4.3. Implications of This Study

Riverine runoff is an important form of water resources, reflecting the abundance and scarcity of water resources in a watershed to a certain extent. The runoff reduction in the Danjiang River would exacerbate the shortage of agricultural, industrial, and drinking water downstream, directly affecting the water supply of the Danjiangkou Reservoir, and further influencing the stability and sustainability of the operation of the water diversion project. The combined warming and drying climate and continuously increasing vegetation coverage are projected to result in substantial decreases in water availability in the watershed. Although the dominant factor causing the decline in runoff of the Danjiang River watershed is human activity, it does not mean that the climate change factors are dispensable. We argue that when proposing water management strategies to mitigate water shortages, it is necessary to consider the combined impacts of climate change and enhanced human activities. It appears that the selected four methods in this study have certain applicability to determine the main factors affecting riverine runoff variation and the relative contributions of driving factors to the alterations in the Danjiang River watershed, which permits an estimation of hydrological responses to climate variability and human activity by only requiring long series of meteorological and hydrological data in a changing environment.
Actually, water shortage and soil erosion have posed challenges for the Danjiang River watershed in recent decades, and the watershed has been listed as a key area for river basin management in China [33]. Several small- and medium-sized water conservancy and hydropower projects have been built in the watershed, and a total of 14 reservoirs still maintain their functions. As the effects of n (produced by the elasticity method based on the Budyko framework) on runoff reduction would increase with the development of vegetation coverage and engineering construction [19] and the reservoir would affect watershed features of n [13], it is suggested that more attention should be attached to the implementation of soil conservation measures and the construction of hydraulic engineering. As shown in Figure 5 and Figure 6, the vegetation coverage increased significantly in the Danjiang River watershed, which might be ascribed to the actualization of major ecological projects, such as the “Returning Farmland to Forests and Grasslands Project” and the “Natural Forest Protection Project” [32]. Investigations indicated that large-scale vegetation recovery could reduce annual average water availability and runoff [67]. Although these projects have successfully controlled soil erosion in the watershed, the runoff has decreased significantly. Balancing soil conservation and water supply is important for sustainable development in the Danjiang River watershed.

5. Conclusions

This study assessed the impacts of climate change and human activity on the runoff variations in the Danjiang River watershed over the past several decades using the simple linear regression, double mass curve, paired year with similar climate conditions, and the elasticity method based on the Budyko framework. The main conclusions can be summarized as follows:
(1)
Annual runoff in the Danjiang River watershed significantly decreased by 3.88 mm every year (p < 0.05) from 1960 to 2017. The significant change point was identified as the year of 1989, dividing the entire period into the reference period (1960–1989) and the change period (1990–2017).
(2)
As for the method of paired year with similar climate conditions, the contribution of human activity estimated varied greatly among paired years, whereas the other three approaches produced a similar result that significant runoff reduction was mainly attributed to human activity, with a contribution of 80.22–92.88% (mean 86.33%).
(3)
By taking into account principles of isolating the hydrological impacts in each method, four approaches produced consistent estimations. In comparison, empirical statistical methods could be applied to quantify hydrological responses to climate change and human activity in watersheds where runoff is closely related to precipitation. When employing the paired year with the similar climate conditions method, more representative paired years can be selected based on more detailed meteorological data. The elasticity method based on the Budyko framework provides valuable references for evaluating the contribution of land surface alteration to runoff variation. The result is critical for water resource management, and it has implications for maintaining sustainable water resource supplies from similar watersheds.

Author Contributions

Conceptualization, Y.S. and X.M.; methodology, D.S.; software, X.Z.; validation, Y.S.; formal analysis, S.Z. and X.Z.; investigation, Y.S., X.Z. and D.S.; resources, Y.S. and X.M.; data curation, X.Z.; writing—original draft preparation, Y.S.; writing—review and editing, Y.S. and X.M.; visualization, D.S.; supervision, S.Z.; project administration, J.Q. and X.M.; funding acquisition, Y.S., J.Q. and X.M. All authors have read and agreed to the published version of the manuscript.

Funding

This research was financially funded by the National Natural Science Foundation of China (42077075, U214320036), Zhejiang Provincial Joint Fund Key Projects (LZJWZ24E090003), and Huzhou Public Welfare Application Research Project (2023GZ70).

Institutional Review Board Statement

Not applicable.

Informed Consent Statement

Not applicable.

Data Availability Statement

Restrictions apply to the availability of these data. The meteorological data series are available from the China Meteorological Data Service Centre (http://data.cma.cn). Runoff data have been obtained from the Hydrological Yearbook of the People’s Republic of China, provided by the Yangtze River Water Conservancy Committee.

Conflicts of Interest

The authors declare no conflicts of interest.

References

  1. Coppola, E.; Verdecchia, M.; Giorgi, F.; Colaiuda, V.; Tomassetti, B.; Lombardi, A. Changing hydrological conditions in the Po basin under global warming. Sci. Total Environ. 2014, 493, 1183–1196. [Google Scholar] [CrossRef]
  2. Liu, K.; Li, X.; Wang, S. Characterizing the spatiotemporal response of runoff to impervious surface dynamics across three highly urbanized cities in southern China from 2000 to 2017. Int. J. Appl. Earth Obs. Geoinf. 2021, 100, 102331. [Google Scholar] [CrossRef]
  3. Li, Z.; Huang, S.; Liu, D.; Leng, G.; Zhou, S.; Huang, Q. Assessing the effects of climate change and human activities on runoff variations from a seasonal perspective. Stoch. Environ. Res. Risk Assess. 2020, 34, 575–592. [Google Scholar] [CrossRef]
  4. Moragoda, N.; Cohen, S. Climate-induced trends in global riverine water discharge and suspended sediment dynamics in the 21st century. Glob. Planet. Chang. 2020, 191, 103199. [Google Scholar] [CrossRef]
  5. Yin, S.; Gao, G.; Li, Y.; Xu, Y.J.; Turner, R.E.; Ran, L.; Wang, X.; Fu, B. Long-term trends of streamflow, sediment load and nutrient fluxes from the Mississippi River Basin: Impacts of climate change and human activities. J. Hydrol. 2023, 616, 128822. [Google Scholar] [CrossRef]
  6. Tian, S.; Xu, M.; Jiang, E.; Wang, G.; Hu, H.; Liu, X. Temporal variations of runoff and sediment load in the upper Yellow River, China. J. Hydrol. 2019, 568, 46–56. [Google Scholar] [CrossRef]
  7. Zhao, Y.; Zou, X.; Gao, J.; Xu, X.; Wang, C.; Tang, D.; Wang, T.; Wu, X. Quantifying the anthropogenic and climatic contributions to changes in water discharge and sediment load into the sea: A case study of the Yangtze River, China. Sci. Total Environ. 2015, 536, 803–812. [Google Scholar] [CrossRef]
  8. Mahmoodi, N.; Osati, K.; Salajegheh, A.; Saravi, M.M. Assessing the trends of streamflow and its linkages with climate variables in the Dez river basin, Iran. Int. J. Environ. Sci. Technol. 2021, 19, 107–120. [Google Scholar] [CrossRef]
  9. Quang, N.H.; Viet, T.Q.; Thang, H.N.; Hieu, N.T.D. Long-term water level dynamics in the Red River basin in response to anthropogenic activities and climate change. Sci. Total Environ. 2024, 912, 168985. [Google Scholar] [CrossRef]
  10. Sun, Y.; Tian, F.; Yang, L.; Hu, H. Exploring the spatial variability of contributions from climate variation and change in catchment properties to streamflow decrease in a mesoscale basin by three different methods. J. Hydrol. 2014, 508, 170–180. [Google Scholar] [CrossRef]
  11. Bloeschl, G.; Hall, J.; Viglione, A.; Perdigao, R.A.P.; Parajka, J.; Merz, B.; Lun, D.; Arheimer, B.; Aronica, G.T.; Bilibashi, A.; et al. Changing climate both increases and decreases European river floods. Nature 2019, 573, 108–111. [Google Scholar] [CrossRef] [PubMed]
  12. Berihun, M.L.; Tsunekawa, A.; Haregeweyn, N.; Dile, Y.T.; Tsubo, M.; Fenta, A.A.; Meshesha, D.T.; Ebabu, K.; Sultan, D.; Srinivasan, R. Evaluating runoff and sediment responses to soil and water conservation practices by employing alternative modeling approaches. Sci. Total Environ. 2020, 747, 141118. [Google Scholar] [CrossRef]
  13. Hu, Y.; Duan, W.; Chen, Y.; Zou, S.; Kayumba, P.M.; Sahu, N. An integrated assessment of runoff dynamics in the Amu Darya River Basin: Confronting climate change and multiple human activities, 1960–2017. J. Hydrol. 2021, 603, 126905. [Google Scholar] [CrossRef]
  14. Wang, S.; Chen, F.; Hu, M.; Chen, Y.; Cao, H.; Yue, W.; Zhao, X. Past, present and future changes in the annual streamflow of the Lancang-Mekong River and their driving mechanisms. Sci. Total Environ. 2024, 947, 174707. [Google Scholar] [CrossRef] [PubMed]
  15. Ahn, K.-H.; Merwade, V. Quantifying the relative impact of climate and human activities on streamflow. J. Hydrol. 2014, 515, 257–266. [Google Scholar] [CrossRef]
  16. Dey, P.; Mishra, A. Separating the impacts of climate change and human activities on streamflow: A review of methodologies and critical assumptions. J. Hydrol. 2017, 548, 278–290. [Google Scholar] [CrossRef]
  17. Zhang, A.; Zhang, C.; Fu, G.; Wang, B.; Bao, Z.; Zheng, H. Assessments of Impacts of Climate Change and Human Activities on Runoff with SWAT for the Huifa River Basin, Northeast China. Water Resour. Manag. 2012, 26, 2199–2217. [Google Scholar] [CrossRef]
  18. Brighenti, T.M.; Bonuma, N.B.; Grison, F.; Mota, A.d.A.; Kobiyama, M.; Borges Chaffe, P.L. Two calibration methods for modeling streamflow and suspended sediment with the swat model. Ecol. Eng. 2019, 127, 103–113. [Google Scholar] [CrossRef]
  19. Ning, T.; Li, Z.; Liu, W. Separating the impacts of climate change and land surface alteration on runoff reduction in the Jing River catchment of China. Catena 2016, 147, 80–86. [Google Scholar] [CrossRef]
  20. Zheng, J.; He, Y.; Jiang, X.; Nie, T.; Lei, Y. Attribution Analysis of Runoff Variation in Kuye River Basin Based on Three Budyko Methods. Land 2021, 10, 1061. [Google Scholar] [CrossRef]
  21. Yang, L.; Zhao, G.; Tian, P.; Mu, X.; Tian, X.; Feng, J.; Bai, Y. Runoff changes in the major river basins of China and their responses to potential driving forces. J. Hydrol. 2022, 607, 127536. [Google Scholar] [CrossRef]
  22. Wang, F.; Hessel, R.; Mu, X.; Maroulis, J.; Zhao, G.; Geissen, V.; Ritsema, C. Distinguishing the impacts of human activities and climate variability on runoff and sediment load change based on paired periods with similar weather conditions: A case in the Yan River, China. J. Hydrol. 2015, 527, 884–893. [Google Scholar] [CrossRef]
  23. He, Y.; Wang, F.; Mu, X.; Guo, L.; Gao, P.; Zhao, G. Human activity and climate variability impacts on sediment discharge and runoff in the Yellow River of China. Theor. Appl. Climatol. 2017, 129, 645–654. [Google Scholar] [CrossRef]
  24. Shao, Y.; He, Y.; Mu, X.; Zhao, G.; Gao, P.; Sun, W. Contributions of climate change and human activities to runoff and sediment discharge reductions in the Jialing River, a main tributary of the upper Yangtze River, China. Theor. Appl. Climatol. 2021, 145, 1437–1450. [Google Scholar] [CrossRef]
  25. Gao, G.; Fu, B.; Wang, S.; Liang, W.; Jiang, X. Determining the hydrological responses to climate variability and land use/cover change in the Loess Plateau with the Budyko framework. Sci. Total Environ. 2016, 557–558, 331–342. [Google Scholar] [CrossRef] [PubMed]
  26. Zhao, Q.; Wang, L.; Liu, H.; Zhang, Q. Runoff and sediment variation and attribution over 60 years in typical Loess Plateau basins. J. Soils Sediments 2019, 19, 3631–3647. [Google Scholar] [CrossRef]
  27. Zhang, Q.; Sun, P.; Singh, V.P.; Li, J.; Tu, X. Evaluation of transitional behavior of wetness/drought regimes in the Poyang Lake Basin, China. Theor. Appl. Climatol. 2016, 126, 631–642. [Google Scholar] [CrossRef]
  28. Ye, X.; Zhang, Q.; Liu, J.; Li, X.; Xu, C. Distinguishing the relative impacts of climate change and human activities on variation of streamflow in the Poyang Lake catchment, China. J. Hydrol. 2013, 494, 83–95. [Google Scholar] [CrossRef]
  29. Wang, S.; Zhang, Z.; McVicar, T.R.; Guo, J.; Tang, Y.; Yao, A. Isolating the impacts of climate change and land use change on decadal streamflow variation: Assessing three complementary approaches. J. Hydrol. 2013, 507, 63–74. [Google Scholar] [CrossRef]
  30. Zhou, Y.; Guo, S.; Hong, X.; Chang, F.-J. Systematic impact assessment on inter-basin water transfer projects of the Hanjiang River Basin in China. J. Hydrol. 2017, 553, 584–595. [Google Scholar] [CrossRef]
  31. Li, M.; Liang, D.; Xia, J.; Song, J.; Cheng, D.; Wu, J.; Cao, Y.; Sun, H.; Li, Q. Evaluation of water conservation function of Danjiang River Basin in Qinling Mountains, China based on InVEST model. J. Environ. Manag. 2021, 286, 112212. [Google Scholar] [CrossRef] [PubMed]
  32. Wang, Y.; Ding, W.; Zhang, G. Study on the Impact of Land Use Change on Runoff in Danjiang Watershed Based on SWAT Model. Res. Soil Water Conserv. 2022, 29, 62–67+74. [Google Scholar] [CrossRef]
  33. Zhou, X. Research on Characteristics and Control of Non-Point Source Pollution of Danjiang River Basin Based on MIKE Model. Master’s Thesis, Xi’an University of Technology, Xi’an, China, 2022. [Google Scholar]
  34. Kuo, Y.; Liu, W.; Zhao, E.; Li, R.; Munoz-Carpena, R. Water quality variability in the middle and down streams of Han River under the influence of the Middle Route of South-North Water diversion project, China. J. Hydrol. 2019, 569, 218–229. [Google Scholar] [CrossRef]
  35. Mann, H.B. Nonparametric test against trend. Econometrica 1945, 13, 245–259. [Google Scholar] [CrossRef]
  36. Kendall, M.G. Rank Correlation Mothods; Griffin: London, UK, 1975. [Google Scholar]
  37. Yue, S.; Wang, C. The Mann-Kendall test modified by effective sample size to detect trend in serially correlated hydrological series. Water Resour. Manag. 2004, 18, 201–218. [Google Scholar] [CrossRef]
  38. Pettitt, A.N. A Non-Parametric Approach to the Change-Point Problem. J. R. Stat. Soc. 1979, 28, 126–135. [Google Scholar] [CrossRef]
  39. Wu, J.; Miao, C.; Zhang, X.; Yang, T.; Duan, Q. Detecting the quantitative hydrological response to changes in climate and human activities. Sci. Total Environ. 2017, 586, 328–337. [Google Scholar] [CrossRef] [PubMed]
  40. Zhao, Y.; Zou, X.; Liu, Q.; Yao, Y.; Li, Y.; Wu, X.; Wang, C.; Yu, W.; Wang, T. Assessing natural and anthropogenic influences on water discharge and sediment load in the Yangtze River, China. Sci. Total Environ. 2017, 607, 920–932. [Google Scholar] [CrossRef]
  41. Yang, H.; Yang, D.; Lei, Z.; Sun, F. New analytical derivation of the mean annual water-energy balance equation. Water Resour. Res. 2008, 44, 893–897. [Google Scholar] [CrossRef]
  42. Choudhury, B. Evaluation of an empirical equation for annual evaporation using field observations and results from a biophysical model. J. Hydrol. 1999, 216, 99–110. [Google Scholar] [CrossRef]
  43. McCuen, R.H. A sensitivity and error analysis of procedures used for estimating evaporation. Water Resour. Bull. 1974, 10, 486–498. [Google Scholar] [CrossRef]
  44. Allen, R.G.; Pereira, L.S.; Raes, D.; Smith, M. Crop Evapotranspiration—Guidelines for Computing Crop Water Requirements—FAO Irrigation and Drainage Paper 56; Food and Agriculture Organization of the United Nations: Rome, Italy, 1998. [Google Scholar]
  45. Yang, H.; Yang, D.; Hu, Q. An error analysis of the Budyko hypothesis for assessing the contribution of climate change to runoff. Water Resour. Res. 2014, 50, 9620–9629. [Google Scholar] [CrossRef]
  46. Xu, J.; Ding, W.; Lin, Q. Characteristics Analysis of Runoff and Sediment Variation in Danjiang River Watershed. Resour. Environ. Yangtze Basin 2019, 28, 1956–1964. [Google Scholar]
  47. Zhang, K.; Morovati, K.; Tian, F.; Yu, L.; Liu, B.; Olivares, M.A. Regional contributions of climate change and human activities to altered flow of the Lancang-mekong river. J. Hydrol. Reg. Stud. 2023, 50, 101535. [Google Scholar] [CrossRef]
  48. Li, S.; Zhang, L.; Du, Y.; Zhuang, Y.; Yan, C. Anthropogenic Impacts on Streamflow-Compensated Climate Change Effect in the Hanjiang River Basin, China. J. Hydrol. Eng. 2020, 25, 04019058. [Google Scholar] [CrossRef]
  49. Ren, G.; Zhou, Y. Urbanization Effect on Trends of Extreme Temperature Indices of National Stations over Mainland China, 1961–2008. J. Clim. 2014, 27, 2340–2360. [Google Scholar] [CrossRef]
  50. Li, H.; Zhang, Y.; Vaze, J.; Wang, B. Separating effects of vegetation change and climate variability using hydrological modelling and sensitivity-based approaches. J. Hydrol. 2012, 420–421, 403–418. [Google Scholar] [CrossRef]
  51. Cavalcante, R.B.L.; Pontes, P.R.M.; Souza-Filho, P.W.M.; de Souza, E.B. Opposite Effects of Climate and Land Use Changes on the Annual Water Balance in the Amazon Arc of Deforestation. Water Resour. Res. 2019, 55, 3092–3106. [Google Scholar] [CrossRef]
  52. Ashraf, S.; AghaKouchak, A.; Nazemi, A.; Mirchi, A.; Sadegh, M.; Moftakhari, H.R.; Hassanzadeh, E.; Miao, C.; Madani, K.; Baygi, M.M.; et al. Compounding effects of human activities and climatic changes on surface water availability in Iran. Clim. Chang. 2019, 152, 379–391. [Google Scholar] [CrossRef]
  53. Dang, C.; Zhang, H.; Singh, V.P.; Yu, Y.; Shao, S. Investigating Hydrological Variability in the Wuding River Basin: Implications for Water Resources Management under the Water-Human-Coupled Environment. Water 2021, 13, 184. [Google Scholar] [CrossRef]
  54. Jiang, C.; Wang, J.; Li, C.; Wang, X.; Wang, D. Understanding the hydropower exploitation’s hydrological impacts through a len of change in flow-sediment relationship: A case study in the Han River Basin, China. Ecol. Eng. 2019, 129, 82–96. [Google Scholar] [CrossRef]
  55. Li, L.; Zhang, L.; Xia, J.; Gippel, C.J.; Wang, R.; Zeng, S. Implications of Modelled Climate and Land Cover Changes on Runoff in the Middle Route of the South to North Water Transfer Project in China. Water Resour. Manag. 2015, 29, 2563–2579. [Google Scholar] [CrossRef]
  56. Li, L.; Zhang, L.; Xia, J.; Shan, L.; Liu, L. Quantitative assessment of impacts of climate variability and human activities on runoff change in the typical basin of the Middle Route of the South-to-North Water Transfer Project. Progress. Inquisitiones De Mutat. Clim. 2014, 10, 118–126. [Google Scholar] [CrossRef]
  57. Xia, J.; Ma, X.; Zou, L.; Wang, Y.; Jing, Z. Quantitative analysis of the effects of climate change and human activities on runoff in the Upper Hanjiang River basin. South North Water Transf. Water Sci. Technol. 2017, 15, 1–6. [Google Scholar] [CrossRef]
  58. Budyko, M.I. Climate and Life; Academic Press: New York, NY, USA, 1974. [Google Scholar]
  59. Xu, X.; Yang, D.; Yang, H.; Lei, H. Attribution analysis based on the Budyko hypothesis for detecting the dominant cause of runoff decline in Haihe basin. J. Hydrol. 2014, 510, 530–540. [Google Scholar] [CrossRef]
  60. Li, Z.; Ning, T.; Li, J.; Yang, D. Spatiotemporal variation in the attribution of streamflow changes in a catchment on China’s Loess Plateau. Catena 2017, 158, 1–8. [Google Scholar] [CrossRef]
  61. Chen, H.; Huang, S.; Xu, Y.; Teegavarapu, R.S.V.; Guo, Y.; Nie, H.; Xie, H. Using Baseflow Ensembles for Hydrologic Hysteresis Characterization in Humid Basins of Southeastern China. Water Resour. Res. 2024, 60, e2023WR036195. [Google Scholar] [CrossRef]
  62. Wang, X. Advances in separating effects of climate variability and human activity on stream discharge: An overview. Adv. Water Resour. 2014, 71, 209–218. [Google Scholar] [CrossRef]
  63. Fang, J.; Kong, F.; Fang, J.; Zhao, L. Observed changes in hydrological extremes and flood disaster in Yangtze River Basin: Spatial-temporal variability and climate change impacts. Nat. Hazards 2018, 93, 89–107. [Google Scholar] [CrossRef]
  64. Wu, Y.; Liu, S.; Yan, W.; Xia, J.; Xiang, W.; Wang, K.; Luo, Q.; Fu, W.; Yuan, W. Climate change and consequences on the water cycle in the humid Xiangjiang River Basin, China. Stoch. Environ. Res. Risk Assess. 2016, 30, 225–235. [Google Scholar] [CrossRef]
  65. Rostamian, R.; Jaleh, A.; Afyuni, M.; Mousavi, S.F.; Heidarpour, M.; Jalalian, A.; Abbaspour, K.C. Application of a SWAT model for estimating runoff and sediment in two mountainous basins in central Iran. Hydrol. Sci. J. J. Des Sci. Hydrol. 2008, 53, 977–988. [Google Scholar] [CrossRef]
  66. Meng, Z.; Wang, Y.; Zheng, S.; Wang, X.; Liu, D.; Zhang, J.; Shao, Y. Abnormal Monitoring Data Detection Based on Matrix Manipulation and the Cuckoo Search Algorithm. Mathematics 2024, 12, 1345. [Google Scholar] [CrossRef]
  67. Wang, D.; Hejazi, M. Quantifying the relative contribution of the climate and direct human impacts on mean annual streamflow in the contiguous United States. Water Resour. Res. 2011, 47, W00J02. [Google Scholar] [CrossRef]
Figure 1. The location of the study area and the hydro-meteorological stations. (a) The geographical location of the Danjiang River watershed (study area) in the Yangtze River basin, China. (b) The location of the selected eight meteorological stations and the location of the study area relative to the Danjiangkou Reservoir in the Hanjiang River basin. (c) The digital elevation model (DEM), river network, and hydrological station of the study area.
Sustainability 16 07600 g001
Figure 2. The spatial distribution of annual (a) precipitation and (b) potential evapotranspiration (ET0) in the Dan-jiang River watershed during the period of 1960–2017.
Sustainability 16 07600 g002
Figure 3. Change trends of the annual (a) runoff depth, (b) precipitation, (c) potential evapotranspiration and (d) temperature in the Danjiang River watershed from 1960 to 2017. The red dashed lines indicate linear trend lines; the gray solid lines and red solid lines represent the average values in the reference period and change period, respectively; the Z values are the results of the Mann–Kendall test (* significant at p < 0.05; NS not significant at p < 0.05).
Sustainability 16 07600 g003
Figure 4. Spatial patterns of land use types of the Danjiang River watershed in different periods.
Sustainability 16 07600 g004
Figure 5. (a) Variations in the annual NDVI and (b) anomaly accumulation curve of the annual NDVI in the watershed from 1982 to 2015 (* significant at p < 0.05).
Sustainability 16 07600 g005
Figure 6. Spatial patterns of the annual NDVI in the Danjiang River watershed in different periods.
Sustainability 16 07600 g006
Figure 7. The scatterplots of observed and simulated runoff in the reference period (1960–1989) calculated with (a) the simple linear regression method and (b) the double mass curve method.
Sustainability 16 07600 g007
Figure 8. The runoff variation analysis with (a) the simple linear regression method and (b) the double mass curve method from 1960 to 2017.
Sustainability 16 07600 g008
Table 1. Basic information on hydrological and meteorological stations used in the study.
Station NameLongitude (E)Latitude (N)
Jingziguan *111°01′33°15′
Huashan110°05′34°29′
Lushi111°01′34°
Zhashui109°07′33°40′
Shangxian109°58′33°52′
Danfeng110°20′33°42′
Shangnan110°54′33°32′
Xixia111°30′33°18′
Yunxi110°25′33°
* Hydrological station.
Table 2. Basic characteristics of runoff, precipitation, and potential evapotranspiration during different periods in the Danjiang River watershed from 1960 to 2017.
PeriodsRunoffPrecipitationPotential Evapotranspiration
Average (mm)RMMCVAverage (mm)RMMCVAverage (mm)RMMCV
1960s369.36.280.59805.72.260.231023.81.280.06
1970s183.95.170.54748.71.740.161030.51.140.03
1980s283.57.210.47854.51.970.17929.41.200.05
1990s127.75.300.45735.11.480.13979.51.180.05
2000s158.24.370.36800.31.570.13978.01.160.05
2010s168.65.040.59816.21.730.20998.01.100.04
1960–1989278.914.270.63803.02.380.20994.51.330.07
1990–2017150.37.890.49781.61.730.16984.21.210.05
1960–2017216.821.520.69792.62.380.18989.61.330.06
Note: RMM denotes the ratio of maximum and minimum values; CV indicates coefficient of variation; 2010s represents the period of 2010–2017.
Table 3. Basic characteristics of runoff during different periods in the Danjiang River watershed from 1960 to 2017.
Empirical Statistical MethodPeriodReconstruction EquationObserved Mean Annual Runoff (mm)Reconstructed Mean Annual Runoff (mm)Climate Change (%)Human Activity (%)
Simple linear regressionP1y = 0.85x − 403.28278.91278.92
P2 150.26260.7414.1285.88
Double mass curveP1y = 0.32x + 689.64278.91283.39
P2 150.26253.4619.7880.22
Note: P1 and P2 represent the reference period and the change period, respectively.
Table 4. Statistical characteristics in hydro-climatic variables of the Danjiang River watershed during the period of 1960–2017.
PeriodR (mm)P (mm)ET0 (mm)nR/PET0/PElasticity Coefficients
ε P ε E T 0 ε n
P1278.91802.96994.531.320.351.241.81−0.81−0.97
P2150.26781.57984.242.210.191.262.58−1.58−1.26
Note: P1 and P2 represent the reference period and the change period, respectively; R represents the runoff depth; P denotes precipitation; ET0 means the annual average potential evapotranspiration; n indicates underlying surface feature parameters; R/P is the runoff coefficient; ET0/P is the drought index; ε P , ε E T 0 , and ε n are the elasticity coefficient of precipitation, potential evapotranspiration, and underlying surface feature parameters, respectively.
Table 5. The attribution recognition of runoff variation in the Danjiang River watershed from 1960 to 2017.
Period d R P d R E T 0 d R n d R d R s δ C p (%) C E T 0 (%) C n (%)
P1
P2−12.222.45−127.31−128.65−137.07−8.428.91−1.7992.88
Note: P1 and P2 represent the reference period and the change period, respectively. d R P , d R E T 0 , and d R n represent runoff variations caused by precipitation, potential evapotranspiration, and underlying surface feature; d R and d R s represent the observed and calculated runoff depth, respectively; δ represents the difference between d R and d R s ; C p , C E T 0 , and C n denote the contribution of precipitation, potential evapotranspiration, and underlying surface feature to runoff alteration, respectively.
Table 6. The runoff variation among paired years in the Danjiang River watershed.
Paired YearsAnnual Precipitation (mm)Annual ET0 (mm)Runoff (mm)
Pair-1Year11963798.83987.21405.8
Year22005795973.05185.9
Difference (%) a42−3.83−14.16−219.9(54.19)
Pair-2Year11965753.771044.64425.9
Year22004747.771025.3174.3
Difference (%)39−6−19.34−251.6(59.07)
Pair-3Year11967941.671019.18349.7
Year21979933.771039.26104.5
Difference (%)12−7.920.08−245.2(70.12)
Pair-4Year11969652.131068.29207.9
Year21997653.531068.964.4
Difference (%)281.40.61−143.5(69.02)
Pair-5Year11976611.31018.2136.4
Year21986604.51006.1776.8
Difference (%)10−6.8−12.03−59.6(43.70)
Pair-6Year11976611.31018.2136.4
Year21999614.51013.1744.5
Difference (%)233.2−5.03−91.9(67.38)
Pair-7Year11980952.63944.32232.3
Year22001970.6962.9458.8
Difference (%)2117.9718.62−173.5(74.69)
Pair-8Year11992765.63980.1181.8
Year22008769.93993.9178.2
Difference (%)164.313.81−103.6(56.99)
Pair-9Year12002775.33992.57111.4
Year22008769.93993.9178.2
Difference (%)6−5.41.34−33.2(29.80)
Note: The difference is the value of Year2 minus Year1 within paired years. As the latter year is Year2 in the table, the negative value in the difference means the relative values are decreasing with the time change and vice versa. The relative degree of change is expressed in brackets.
Disclaimer/Publisher’s Note: The statements, opinions and data contained in all publications are solely those of the individual author(s) and contributor(s) and not of MDPI and/or the editor(s). MDPI and/or the editor(s) disclaim responsibility for any injury to people or property resulting from any ideas, methods, instructions or products referred to in the content.

