Article

Can the Reform of the Commercial System Enhance the Resilience of Enterprises? Evidence Based on Quasi Natural Experiments

1
School of Law and Business, Wuhan Institute of Technology, No. 206 Guanggu 1st Road, Wuhan 430205, China
2
School of Marxism, Central South University, No. 932 South Lushan Road, Changsha 410083, China
*
Author to whom correspondence should be addressed.
Sustainability 2024, 16(17), 7616; https://doi.org/10.3390/su16177616
Submission received: 4 July 2024 / Revised: 25 July 2024 / Accepted: 26 July 2024 / Published: 2 September 2024

Abstract

:
Enterprise resilience refers to the capacity of businesses to effectively respond to crises and achieve sustainable development over the long term. It serves as a crucial assurance for businesses to attain high-quality growth. The current worry among policy makers and academia revolves around the impact of commercial system change on the resilience of firms. This article examines the reform of the commercial system as a “quasi natural experiment” by comparing manually collected data on the reform with data on Chinese A-share listed companies from 2011 to 2022. It thoroughly analyses the effects and mechanisms of the reform on corporate resilience. The research findings suggest that implementing reforms in the commercial system can improve the ability of firms to withstand and recover from challenges. This is primarily accomplished by decreasing limitations on obtaining funding, minimising expenses associated with institutional transactions, and strengthening the capacity for technological innovation. This conclusion remains strong and reliable even after conducting a series of experiments to ensure its robustness and addressing any potential issues related to endogeneity. Furthermore, the reformation of the commercial system has a more potent impact on bolstering the resilience of private firms, large-scale enterprises, highly competitive enterprises, and high-tech enterprises. The research findings of this article have significant implications for advancing the reform of the commercial system, strengthening enterprise resilience, and achieving high-quality development of firms.

1. Introduction

In recent years, new technologies continue to break through, and market competition continues to increase. After the outbreak of the Russia–Ukraine conflict and the Middle East conflict, the international situation is unpredictable. Enterprises are facing huge operational challenges, and each enterprise is in an increasingly complex and rapidly changing business environment [1]. After the outbreak of the global pandemic, China’s economic resilience and vitality have shown a strong momentum. Faced with sudden external shocks, excellent economic resilience can promote economic recovery, maintain employment rates, stabilise people’s quality of life, and maintain social stability [2]. Enterprise resilience is crucial for strengthening a country’s economic resilience, as it forms the basis at a local level. Enterprise resilience is centred around effectively using both internal and external resources and adapting to the changing environment to overcome challenges and achieve growth [3].
Corporate resilience is influenced by multiple factors [4,5]. From a micro perspective of internal personnel, employee personality traits and leadership traits affect the performance of corporate resilience. Reverse quotient refers to an individual’s ability to overcome difficulties and find solutions to problems when facing adversity [6]. Employees with high reverse intelligence can actively take action and find solutions in difficult situations, while employees with low reverse intelligence may not be able to adapt and lack resilience in crisis situations [7]. In addition, the leadership of a leader also affects the decision-making of a company, which in turn affects its resilience. Leadership refers to the use of personal influence and the exercise of leadership power by leaders under their role responsibilities. People with strong leadership can quickly lead employees and businesses back to a stable operating state in crisis and stressful environments [3]. Meanwhile, leaders with high mindfulness can influence employees by conveying positive emotions [8], enhancing their awareness of difficulties, and cultivating their resilience, which will help improve the resilience of the enterprise [9].
At the micro level of corporate operations, the structured relationships of each company [10], including departmental relationships within the organization [11], task collaboration relationships [12], and responsibility relationships [13], all directly or indirectly affect corporate resilience. Furthermore, capital resources are essential in establishing organisational resilience, a quality that is reinforced by having an adequate amount of capital resources. The reduction of corporate financing constraints can significantly enhance corporate resilience [14]. On the other hand, rich and balanced knowledge resources are crucial factors for enterprises to maintain stability in crisis situations [15]. Wide and evenly distributed knowledge resources can enhance a company’s ability to identify strategic opportunities and integrate innovative resources [16]. After technological innovation, a company can bring differentiated competitive advantages, thereby enhancing its competitiveness, better responding to external shocks, and ultimately demonstrating better corporate resilience [17]. Scholars have pointed out that companies willing to take on more social responsibility recover faster in economic crises [18], and good ESG performance can promote the improvement of corporate resilience [19]. From a macro standpoint, the resilience performance of businesses is impacted by the volatility of economic policy. In particular, there is a threshold effect whereby low-resilience firms will decrease innovation activities when economic policy uncertainty increases, whereas high-resilience enterprises will boost innovation activities [20]. In addition, innovation-driven policies can promote the resilience performance of enterprises [21].
Currently, there is a scarcity of research that examines the key determinants that influence the capacity of firms to withstand and recover from challenges, specifically from the standpoint of institutional economics. Reformation of the commercial system is one of the important contents of domestic market economy reform, which helps to transform government functions and build an efficient service-oriented government. The commercial system’s reform is a derivative institutional innovation that has emerged in the development process of the administrative approval system reform [22]. It promotes the improvement of the business environment and the friendliness of policy systems by optimizing and reengineering the administrative approval process. This reform not only enhances the ability of enterprises to resist external environmental shocks but also strengthens their resilience [23]. In addition, the reform has reduced the financing costs of enterprises, improved their ESG performance [24], promoted technological innovation [25], and increased total factor productivity, promoting the upgrading of the social industrial structure. These factors have greatly helped companies improve operational performance, stabilise cash flow, and enhance their resilience in the face of external shocks [26,27]. The hypothesis that exploring reforming the commercial infrastructure can enhance the resilience of enterprises is in line with the macro theme of the Chinese government’s current promotion of high-quality economic development [2]. Therefore, this article explores whether the commercial system has a positive effect on enterprise resilience and its mechanism from the perspective of the impact of the commercial system’s reform on company resilience.
The domestic market economy reform includes the reform of the commercial system as one of its key components. Currently available research mostly concentrates on the macroeconomic effects of commercial system reform, including how it affects market entrance rates, business system costs, draws in foreign investment, and levels of urban innovation. According to Xu & Ma [28], one of the main reasons for the rise in the market participation rate is the calibre of the reform of the commercial system. Zhang et al.‘s research [29] shows that modifications to the commercial system can also help businesses cut their internal expenses. According to Huang et al. [30], the commercial system’s reform greatly aided in attracting foreign investment. Xia & Liu [31] found that the spirit of contract and commercial reform can promote the improvement of urban innovation level. Liu & Yang found that the establishment of a market supervision bureau promoted the improvement of the specialisation level [32]. In recent times, researchers have initiated the examination of the influence of commercial system reform on a smaller scale. According to Li & Yu [25], commercial system reform can raise an organization’s level of innovation by lowering entry and institutional costs and allocating more resources and time for research and development. The main factor promoting the impact of commercial system reform on the overall factor productivity of businesses is the decrease in institutional transaction costs [22]. Nevertheless, there is a significant dearth of research literature with respect to the impact of reforming the commercial system on the resilience of businesses at the micro level. Given this, this article considers business system reform to be a “quasi-natural experiment”. It employs a double difference model to empirically test the impact of business system reform on enterprise resilience by matching manually collected commercial system reform data with enterprise data of Chinese A-share listed companies from 2011 to 2022.
This article primarily makes marginal contributions in the following areas: first, it examines the consequences of reforming the commercial system on the resilience of micro-listed enterprises from the perspective of institutional economics. This article employs the DID empirical method to assess the impact of commercial system reform on the resilience of listed enterprises. It employs the experimental group and control group methodologies, with the experimental group sample being the city in which the enterprise is located at a specific time when commercial system reform is implemented. This article concludes by conducting a comprehensive examination of the mechanism by which the impact of commercial system reform on corporate resilience is influenced from both theoretical and empirical perspectives. Additionally, it investigates the heterogeneity of the impact of commercial system reform on corporate resilience among various enterprises. The high-quality development of enterprises is significantly influenced by these investigations.

2. Theoretical Analysis and Research Hypotheses

2.1. The Impact of Commercial System Reform on Enterprise Resilience

To endure and expand, enterprises must acquire resources from external sources, as per stakeholder theory and resource dependence theory. Loose and abundant financial resources can effectively promote the improvement of enterprise resilience [33]. Reforming the commercial system is a significant practice for the government, which is shifting towards a service-oriented approach. It reduces the intensity of government intervention, reduces resistance to enterprise development, reduces transaction costs of enterprise systems, accelerates enterprise entrepreneurship and development, effectively drives market freedom and vitality, improves the market business environment, promotes the construction of a stable financing environment, and effectively reduces financing constraints for enterprises [24]. The reform of the commercial system aids and directs market entities to actively rectify and repair illegal and dishonest behaviours to circumvent limitations on finance, thereby enabling businesses to have adequate funds for operational activities [25]. Consequently, this builds corporate resilience.
When looking at performance in terms of corporate social responsibility, a favourable business environment facilitates the establishment of strong relationships with a variety of stakeholders, the enhancement of investor confidence, the mitigation of information asymmetry, and the acquisition of the necessary resources for corporate development [34]. Enterprises with better social responsibility performance recover faster in economic crises. From the perspective of competitive advantages in the enterprise market, according to Schumpeter’s innovation theory and differentiated competition theory, the technological accumulation formed by enterprise technological innovation serves as a stock resource, bringing better production functions to enterprises, launching new products, expanding and penetrating the market, and bringing differentiated competitive advantages [35], enhancing enterprise competitiveness and forming better enterprise resilience. The reform of the commercial system can effectively promote technological and green innovation in enterprises, improve their total factor productivity [25], bring better input-output ratios, enhance their comprehensive market competitiveness, and form better corporate resilience. This article suggests research hypothesis 1 in accordance with the aforementioned analysis:
Hypothesis 1. 
Reform of the commercial system helps to enhance corporate resilience.

2.2. The Mechanism of the Impact of Commercial System Reform on Enterprise Resilience

(a) Financing constraints. The commercial system’s overhaul can optimise the business environment, promote the healthy development of local financial markets, open up channels for enterprises to obtain funds, reduce their financing consumption, create a balanced and stable financing environment, and thus solve the problem of financing restrictions for enterprises. The improvement of the business environment can reduce the dependence of enterprises on internal cash flow and alleviate financing constraints [36]. The financing constraints of enterprises can be alleviated to a greater extent by a more favourable financial ecological environment [37]. When a company is impacted by adverse events, the richer its financing channels, the lower its financing threshold and cost. The company will have sufficient funds for turnover and disposal, which can reduce the losses caused by adverse events and prevent the deterioration of adverse conditions [38,39]. The reform of the commercial system fosters a more favourable business environment, enabling enterprises to forge strong relationships with a variety of stakeholders, enhance investor confidence, mitigate the issue of information asymmetry, and subsequently acquire the resources necessary for enterprise growth. The restructuring of the commercial system has alleviated the financing constraints on enterprises, enabling them to secure additional funds for development and operational activities. Consequently, this has enhanced the resilience of enterprises.
(b) Institutional transaction costs. The reform of the commercial system has simplified the registration process, relax the conditions for commercial registration, shorten the time for enterprise establishment and business execution [40], and reduce the transaction costs of enterprises [31,41]. Zhang et al. found that the company’s research and innovation level will be substantially enhanced by this reduction in institutional costs [29]. As the commercial system reform progresses further, the time spent on commercial processing and approval will be reduced, non-productive costs will be reduced, and the time and investment in research and development innovation will be increased [25], thereby improving the innovation ability of enterprises and promoting their resilience. In addition, the increase in institutional transaction costs leads companies to allocate limited resources to non-productive activities, which not only widens the financing gap for production activities but also hinders the improvement of production efficiency [42,43]. This phenomenon inhibits the improvement of green total factor productivity of enterprises and is not conducive to their sustainable development [44]. Reducing institutional transaction costs can release more economic resources within the enterprise, help alleviate financial pressure, and ensure its cash flow, thereby promoting larger-scale production activities and improving the ability of the enterprise to withstand and recover from challenges. [45]. Reforming the commercial systems can effectively improve the business environment. The unfavorable business environment not only hinders interregional trade but also increases institutional transaction costs [46], which can reduce the performance and resilience of enterprises.
(c)Technological innovation. The restructuring of the commercial system can promote the reduction of entry costs and non-productive costs for enterprises. In addition, it can enhance market competitiveness and enhance innovation capabilities for enterprises [25]. The innovation of the commercial system has, to some extent, clarified the protection of property rights, created a fair market innovation environment, increased the expected benefits of innovative development, helped to avoid the risk of innovative achievements being encroached upon, and thus promoted enterprise innovation. According to the resource-based theory, through innovation, companies can integrate their own resources and transform them into competitiveness [47]. Through technological innovation, companies can avoid the problem of their existing systems not functioning properly in new environments, improve their crisis warning and response capabilities, and thus enhance their risk resistance and resilience [48]. Besides, when facing external economic shocks, enterprises can not only improve employee motivation but also enhance product quality by actively engaging in technological innovation. These improvements help to enhance customer satisfaction, promote sustainable development of the enterprise, and strengthen its resilience [49]. When enterprises face the risk of supply chain disruptions, increasing innovation investment is an effective strategy to reduce the impact of such disruptions. This not only effectively ensures the resilience of enterprises but also further enhances their resilience [50,51]. Furthermore, corporate resilience is substantially enhanced by dual innovation [15]. Additionally, The commercial system’s overhaul can encourage enterprises to invest in environmental protection and green innovation, thereby enhancing corporate social responsibility and ESG performance and promoting the improvement of corporate resilience [19,24]. This article suggests the subsequent research hypothesis 2 in accordance with the aforementioned analysis:
Hypothesis 2. 
Commercial system reform can enhance corporate resilience by reducing financing constraints and institutional transaction costs and enhancing technological innovation.

3. Model Construction, Variables and Data

3.1. Model Construction

The following is the specific model construction used in this article for empirical evaluation: a multi-period double difference model:
R e s i l e t c = a 0 + a 1 P o l i c y e c t + β X e c t + η e + δ c + μ t + ϵ e c t
In Equation (1), the subscript e represents Chinese A-share listed companies, c represents the city, t represents the year. R e s i l e t c represents the resilience performance variable of A-share listed companies, and P o l i c y e c t is a dummy variable for commercial system reform. If the company’s city starts implementing commercial system reform in a certain year, P o l i c y e c t is assigned a value of 1. Conversely, P o l i c y e c t is assigned a value of 0. X e c t represents the control variable, which refers to those variables that may affect the resilience of enterprises at the macro city level or micro-enterprise level, η e is the fixed effect of the company, δ c is the fixed effect of the city, μ t is the fixed effect of the year, and ϵ e c t is the disturbance term.

3.2. Variable Selection

3.2.1. Dependent Variable

The approach of Ortiz & Bansal [52] and Xiao [53] is followed in this article, which conceptualises a two-dimensional structure with low financial volatility and high long-term performance growth to measure corporate resilience. The cumulative sales revenue growth within three years is the indicator utilised to evaluate long-term performance, and cumulative growth is a reliable indicator of long-term performance. The standard deviation of stock returns for each month within a year is the metric used to quantify financial volatility. Lastly, the Resil index is constructed by combining the aforementioned two indicators using the entropy method to provide a comprehensive representation of the overall resilience performance of each enterprise.

3.2.2. Core Explanatory Variables

This article refers to the method of Li et al. [25] and identifies a city that simultaneously implemented the “registered capital subscription registration system” and “multi-certificate integration” in the first half of a certain year as a sample of commercial system reform cities for that year. A city that simultaneously implemented the “registered capital subscription registration system” and “multi-certificate integration” in the second half of a certain year is identified as a sample of commercial system reform cities for the next year.

3.2.3. Control Variables

Control variable at the enterprise level: Enterprise size, measured using the natural logarithm of year-end total assets [17]). The asset–liability ratio (Lev) is measured using the ratio of a company’s total year-end debt to total assets [54]. The cash flow of a company is measured by the ratio of net cash flows generated from operating activities to total assets [55]. Profitability (ROA) is evaluated using the ratio of a company’s net profit to its average total assets [56]. Book to Market Ratio (BM) is calculated by dividing the company’s book value by its market value [57]. The listing age is evaluated based on the company’s listing age [58]. The institutional investor shareholding ratio (INST) is measured by dividing the number of institutional investor holdings by the total number of shares [59]. Tobin’s Q value, evaluated by the ratio between a company’s market value and its asset replacement cost [60]. Return on Equity (ROE) is evaluated as the ratio of a company’s net profit to its average net assets [33]. The largest shareholder’s shareholding ratio (TOP1) is evaluated based on the proportion of shares held by the company’s largest shareholder [61].
Control variables at the urban level: economic development (pgdp), evaluated by taking the logarithm of per capita GDP of each city [40]. Industrial structure (stru) is expressed as the proportion of the secondary industry. Foreign direct investment (FDI) is evaluated by obtaining the logarithm of the actual utilization of outward foreign direct investment [40]. Marketization degree (mark) is expressed as the proportion of urban private and individual employees in the total number of employees in each city.

3.3. Data Description

We process all data in this article as follows:
  • Manually collect commercial system reform data from 286 prefecture level and above cities in China from 2011 to 2022 on the industrial and commercial bureaus and government official websites of various cities, and organise data on the implementation of reforming the commercial system in the cities where listed companies are located.
  • We drew on the methods of [54] to process the data of Chinese A-share listed companies from 2011 to 2022, removing samples of incomplete core variables and financial companies. We also excluded samples of financial outliers (including samples with total assets less than 0, net assets less than 0, asset–liability ratio greater than 1, and abnormal operations).
  • The rest of the digital comes from CSMAR database and cnrds database.
  • To acquire empirical data for this study, we will compare the pertinent data on the reform of the commercial system in cities at or above the prefecture level with the data of A-share listed companies based on their respective addresses. Ultimately, 18,483 study samples were examined.
Table 1 illustrates the descriptive statistics of the primary variables in this article.

4. Empirical Analysis

4.1. Benchmark Regression Results

To determine whether there is severe multicollinearity between variables, the Pearson correlation coefficient test and the Variance Inflation Factor (VIF) test were conducted before regression. The results showed that the core explanatory variables and control variables were significantly correlated with the enterprise resilience index at the 1% level, consistent with the expected hypothesis, and the vast majority of coefficients were less than 0.8. The VIF test results show that the maximum VIF value of each variable is 8.46, and the average VIF value is 2.67, both of which are less than the critical value of VIF = 10, indicating that the model does not have serious multicollinearity problems.
The fixed effects setting in econometric models can affect the regression coefficients and their standard errors. In some cases, controlling for different fixed effects in regression equations may even lead to completely opposite conclusions. Thus, this article investigated the influence of various fixed effects conditions on the research findings to guarantee their reliability. The regression results of the impact of commercial system reform on firm resilience are presented in Table 2. The dependent variable is firm resilience (Resil). The estimated results without control variables are presented in Columns (1) through (3) in Table 2. The estimated results with control variables considered are presented in Columns (4) through (6). Columns (1) and (4) control for time effects, Columns (2) and (5) control for time and firm fixed effects, and Columns (3) and (6) control for time, city, and firm fixed effects. It is not difficult to determine that the estimated coefficients of commercial system reform (Policy) are significantly positive, regardless of whether control variables are included or different fixed effects are controlled for. This suggests that commercial system reform promotes corporate resilience, thereby verifying hypothesis 1. This is primarily due to the fact that the reform can reduce the establishment and approval time of enterprises, cut non-productive expenses, and allocate more funding for research on technological issues and production factors [62]. This is beneficial for the development and business activities of enterprises and promotes the formation and improvement of enterprise resilience. Furthermore, an improved business environment has resulted from the reform of the commercial system [34]. Establishing strong relationships with a variety of stakeholders, bolstering investor confidence, mitigating information imbalances, and securing the essential resources for enterprise growth are all facilitated by a favourable business environment. Enterprises can exhibit greater resilience and recuperate more rapidly during crises.

4.2. Robustness Testing

4.2.1. Replacing Variables in Commercial System Reform

This article employs pilot cities for reforming the commercial system as reform samples and is informed by the methodologies of Huang et al. [40]. Experimental groups are employed in pilot cities for commercial system reform, while control groups are employed in other cities. The regression results are presented in Table 3, and robust-ness tests are implemented. It is not challenging to determine that the estimated coefficient of reforming the commercial system remains significantly positive even after the core explanatory variables are altered, regardless of whether control variables are included or distinct fixed effects are controlled. This further confirms that the research conclusion of the article is supported by the fact that commercial system reform helps to enhance corporate resilience.

4.2.2. Replacing Enterprise Resilience Variables
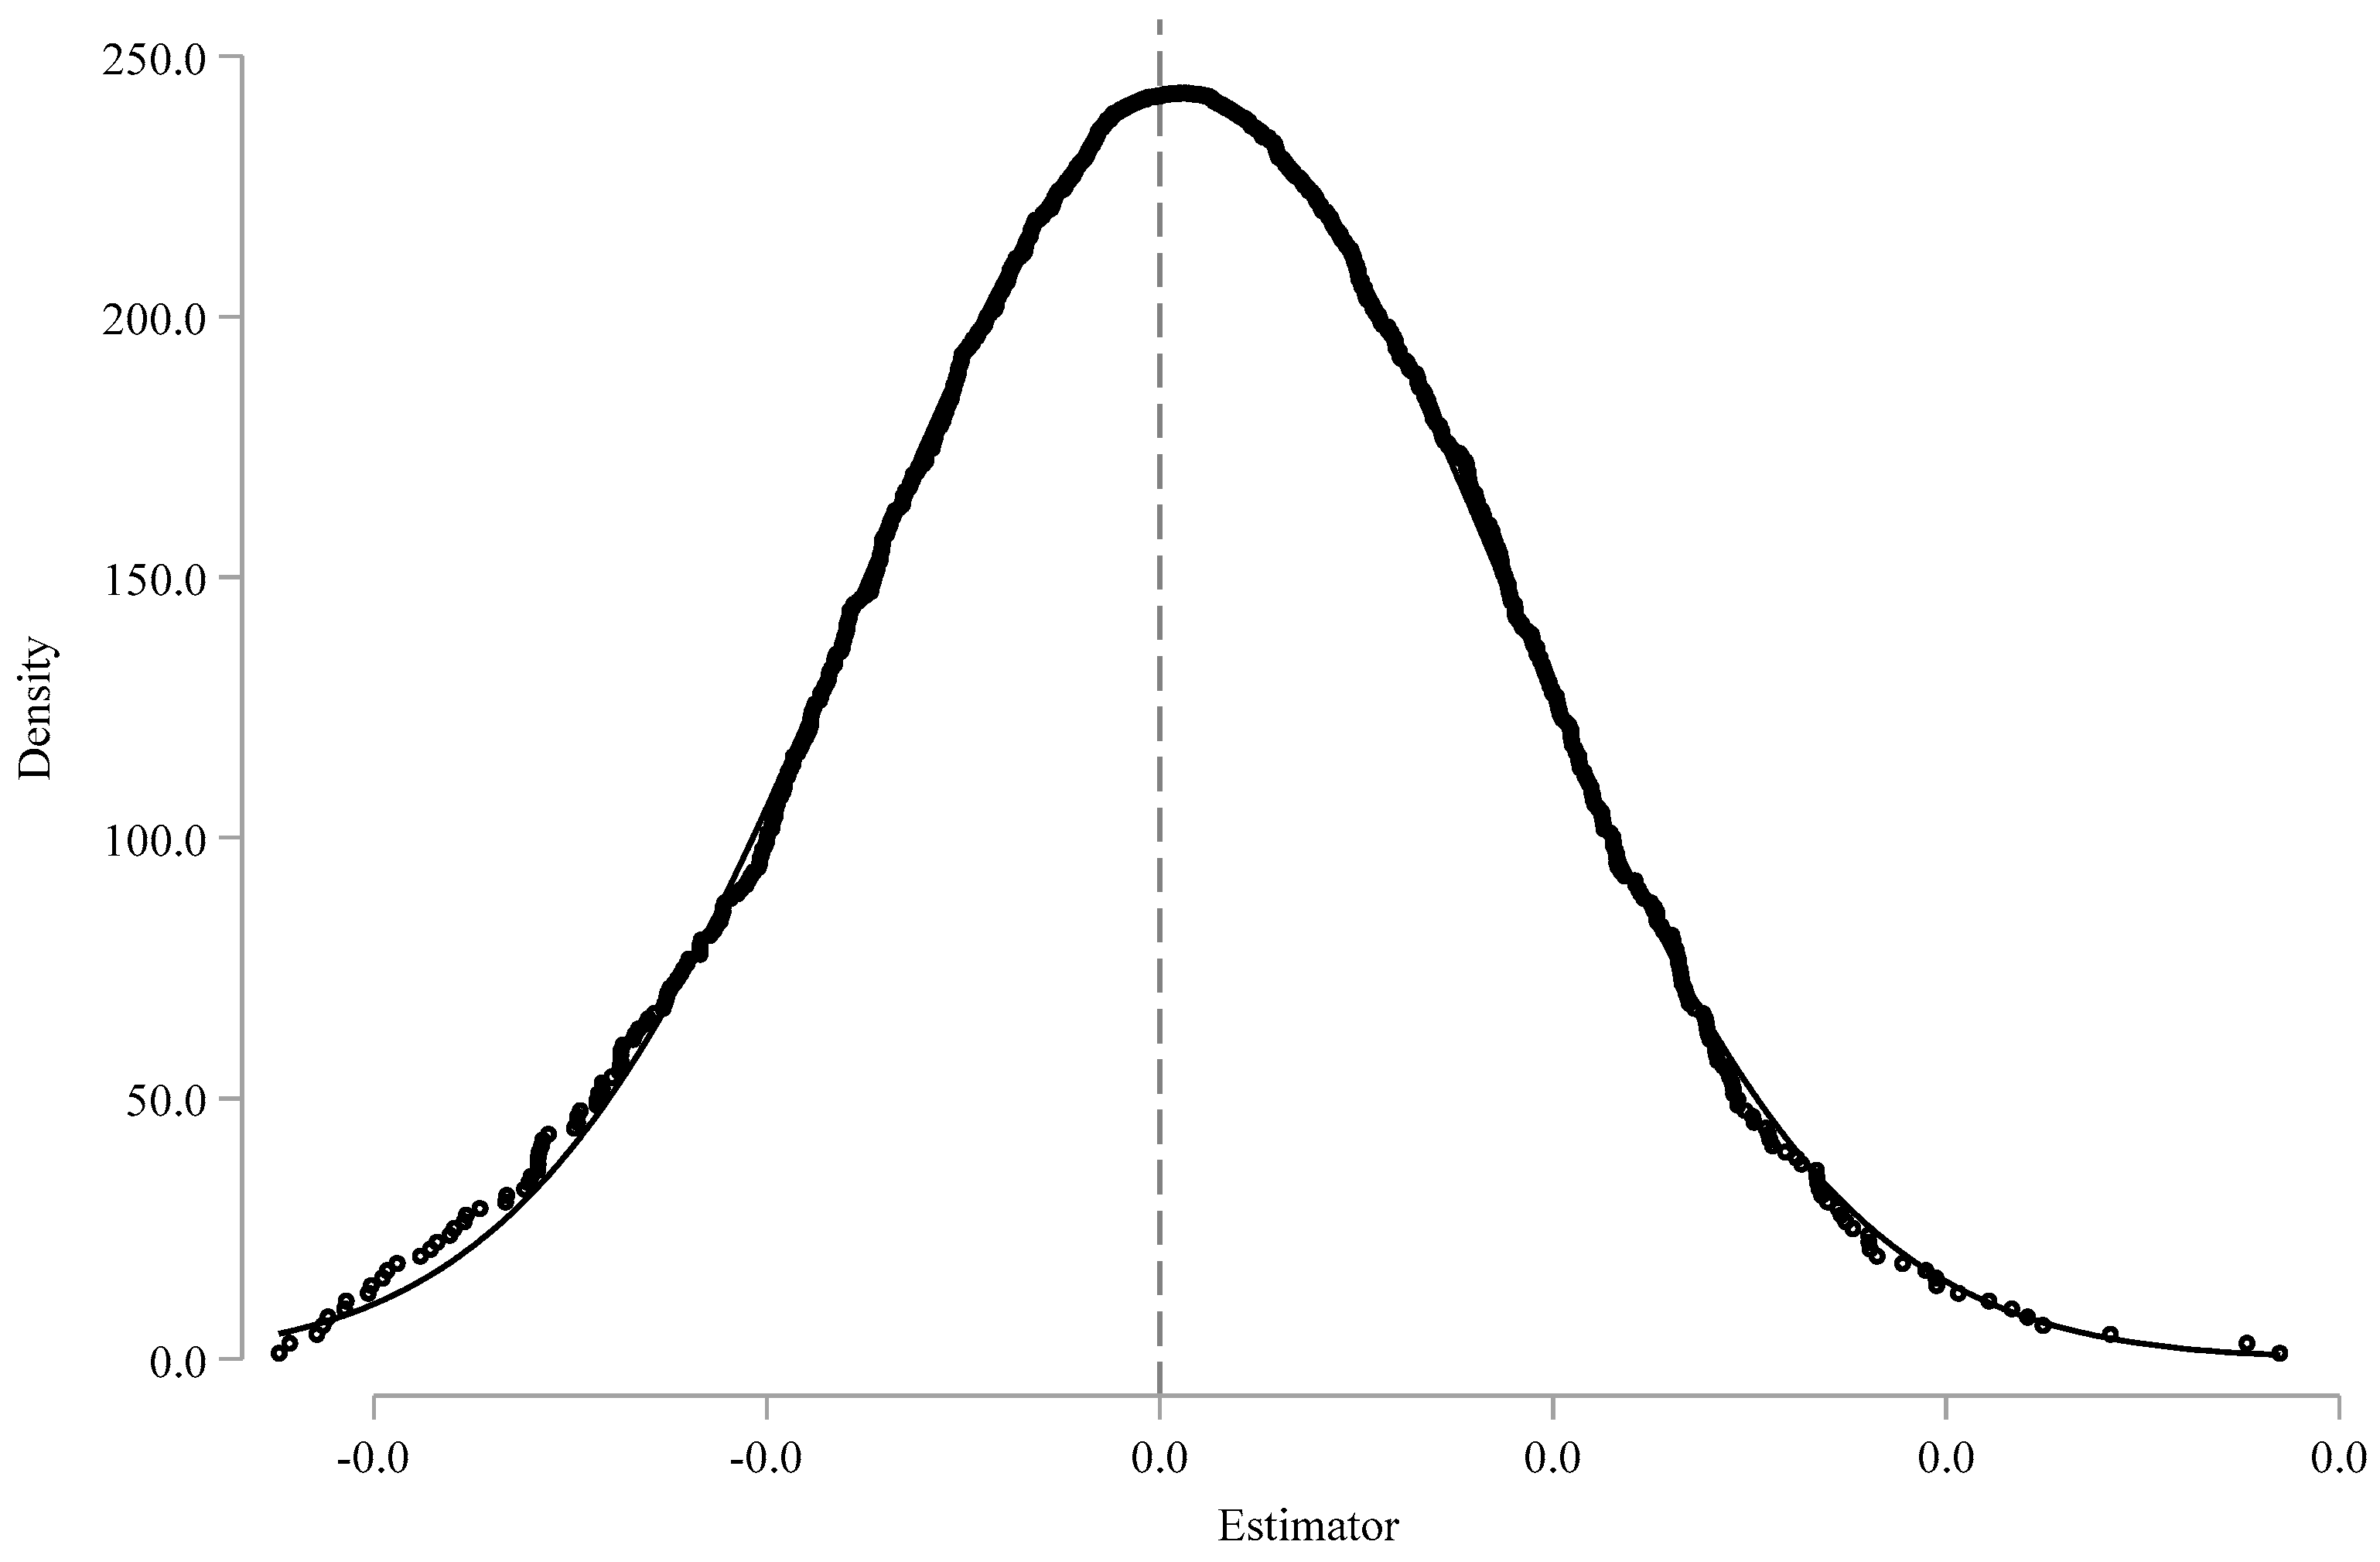
The method of Chen et al. [33] is further utilised in this article, which substitutes corporate resilience for robustness testing with the performance growth of listed companies. Table 4 illustrates the regression findings. It is not difficult to determine that the estimated coefficient of the reform on the performance growth of listed companies is substantially positive, regardless of whether control variables are added or different fixed effects are controlled after changing the dependent variable. This further supports the research conclusion of the article by demonstrating that the implementation of the reforming of the commercial system promotes performance growth and enhances corporate resilience.

4.2.3. Placebo Test

This article refers to the research method of Zhou et al. [63] and adopts an indirect placebo test: we randomly select pilot cities for commercial system reform, resulting in an incorrect estimation of the coefficient value of the multiplier term. We iterate this procedure 1000 times, yielding a matching estimation of 1000 coefficients. If extraneous variables do not have a substantial influence on the genuine “quasi-natural experiment” of commercial system reform, then the multiplier coefficient values of the randomly generated “quasi natural experiment” on the corporate resilience activities of companies should align with a mean of 0. Figure 1 presents the results of the placebo test for 1000 estimated coefficients. Figure 1 clearly demonstrates that the average estimated value of the 1000 estimated coefficients is approximately 0 and does not surpass the true value. Hence, any additional hidden variables that could potentially impact the resilience of the enterprise, as discussed in this article, can be disregarded, thereby reinforcing the strength and validity of our research findings.

4.2.4. PSM-DID

To minimise the adverse effects caused by selective bias, this article uses the PSM matching method to address the systematic differences in individual characteristics between two groups of enterprises. This article uses a one-on-one nearest neighbor matching method with replacement to match two groups of samples and obtains Logit regression results. It was found that the estimated value of the treatment effect (ATT) in the experimental group was 0.0359, with a t-value of 4.25, which is significant at the 1% significance level. This indicates a significant difference in the outcome variables between the matched treatment group and the control group, indirectly indicating that commercial system reform can significantly improve corporate resilience. Table 5 reports the estimation results of PSM-DID. The estimation coefficients of Columns (1)–(6) for commercial system reform (Policy) in Table 5 are significantly positive, and there is no significant difference from the estimation results of DID in Table 2. This indicates that after controlling for sample selection bias, commercial system reform still helps to enhance firm resilience, once again supporting the conclusion in the benchmark regression.

4.2.5. Excluding Interference from Other Policies

To eliminate the impact of the Belt and Road Initiative policy shock in 2013 in the research interval, this paper will delete the sample of listed enterprises under the jurisdiction of the node cities along the Belt and Road Initiative. Table 6 shows the regression results excluding policy interference. From Columns (1)–(6) in Table 6, it can be seen that the regression coefficients of commercial system reform on corporate resilience are significantly positive. This shows that after removing the policy interference of the “the Belt and Road” initiative, the reform of the commercial system still helps to enhance enterprise resilience, which further supports the conclusions of this study.

4.3. Endogenous Processing

This article aims to overcome the potential endogeneity issues in the model and further draw on the approach of Liu & Xia [64], using the reform situation of other cities in the province as instrumental variables for commercial system reform. In an effort to mitigate the influence of economic and social connections between cities on the efficacy of instrumental variables, geographically adjacent cities were eliminated in order to mitigate city correlations. Finally, the reform situation of other cities in the same province, excluding neighboring cities, is used as the IV of reforming the commercial system. The policy requirements and institutional culture of the same province are similar, and the cities they belong to are all influenced by provincial government policies. Therefore, instrumental variable IV satisfies the correlation. At the same time, the commercial reforms in other cities can only affect the resilience of local enterprises by attracting them to flow in (or flowing out due to lagging reforms) earlier in the city, that is, only through the channel of commercial reforms in the city can the resilience of enterprises be affected, which largely meets exogenous requirements. This article uses the two-stage least squares method to estimate two sets of samples. The estimation results are shown in Table 7, where IV is the instrumental variable. In the first stage of regression, the IV regression coefficient is significant at the 1% significance level, and the p-values corresponding to the last two Wald and LM statistics are far less than 1%. This indicates that the instrumental variable is highly correlated with the original endogenous variable, and there is no issue with unidentifiable or weak instrumental variables. The coefficient of commercial system reform in the second stage of regression is significantly positive at the 1% significance level, indicating that after alleviating the endogeneity issues that may exist in policy implementation, commercial system reform still helps to enhance corporate resilience.

4.4. Inspection of Intermediary Mechanisms

This article draws on the methods of Wang & Feng [65] to construct a mediation effect test model to identify the mechanisms of corporate financing constraints, institutional transaction costs, technological innovation, and the impact of the reform on corporate resilience. The design of the test model is as follows:
R e s i l e t c = a 0 + a 1 P o l i c y e c t + X e c t + η 1 + δ 1 + μ 1 + ϵ 1 M e t c = ϑ 0 + ϑ 1 P o l i c y e c t + X e c t + η 2 + δ 2 + μ 2 + ϵ 2 R e s i l e t c = τ 0 + τ 1 P o l i c y e c t + τ 2 M e t c + X e c t + η 3 + δ 3 + μ 3 + ϵ 3
In Equation (2), the subscript e represents Chinese A-share listed companies, c represents the city, t represents the year, R e s i l e t c is the resilience variable of A-share listed companies, and P o l i c y e c t is the dummy variable of commercial system reform, which is consistent with the definition of model (1). M e t c represents the intermediary mechanism variable, representing corporate financing constraints, institutional transaction costs, and technological innovation. Financing Constraints (KZ), this study used the KZ index proposed by Kaplan & Zingales and widely accepted by the academic community. The construction of this model relies on financial data such as operating net cash flow, cash dividends, cash holdings, asset–liability ratio, and Tobin’s Q value of the firm. In addition, although the WW index is estimated using the Euler investment equivalence formula and is more suitable for mature capital markets, China’s capital market is still in the development stage, and further research is needed on the effectiveness and applicability of this index. In addition, the SA index is only calculated based on the size and years of establishment of the enterprise and may not accurately measure the degree of financing constraints of the enterprise [66]. Therefore, this study chooses to use the KZ index to measure the financing constraints of enterprises. Institutional transaction costs, this article mainly draws on the method of Wang & Feng [65] to evaluate the non-productive costs of a company, namely institutional transaction costs, by using the proportion of the sum of sales, management, and financial expenses in the company’s total profit. Technological innovation (R&D) is measured in this article using enterprise R&D investment. η e is the fixed effect of the enterprise, δ c is the fixed effect of the city, μ t is the fixed effect of the year, and ϵ e c t is the disturbance term.
Table 8 reports the intermediate mechanism test results of the impact of commercial system reform on corporate Resilience. Column (1) in Table 8 is the benchmark regression result, and the estimated coefficient of the reform (Policy) in Column (2) is significantly negative, indicating that commercial system reform can significantly reduce the degree of corporate financing constraints. The estimated coefficient of financing constraint (KZ) in Column (3) is also significantly negative, indicating that the reduction of financing constraints can significantly enhance corporate resilience. The implementation of commercial system reform has alleviated the financing constraints faced by firms, allowing them to secure additional cash for business development. This has effectively enhanced their financial stability and ability to withstand risks, thus enhancing their resilience. The estimated coefficient for the policy of commercial system reform in Column (4) of Table 8 is significantly negative, indicating that the reform has reduced the institutional transaction costs faced by enterprises. The regression coefficient for the institutional transaction costs in Column (5) is significantly negative, indicating that the reduction in institutional transaction costs significantly enhances the resilience of enterprises. This is mainly because the institutional transaction costs faced by enterprises are reduced, which can enable them to retain more economic resources within the enterprise, alleviate the pressure of funding shortages, and facilitate more productive activities. In addition, enterprises may actively research and innovate [67] to enhance their market competitiveness and enhance their resilience. The estimated coefficient of Policy in Column (6) of Table 8 is significantly positive, indicating that the reform of the commercial system has significantly promoted technological innovation in enterprises. The estimated coefficient of R&D in Column (6) is also significantly positive, indicating that the improvement of the level of technological innovation in enterprises significantly enhances their resilience. This is because the reforms to the commercial system have shortened the time required for enterprise establishment and business processing [40], increased investment in innovation and research and development [29], and improved enterprises’ capacity for technological innovation [25]. This has improved enterprises’ resilience. In conclusion, the reform of the commercial system has the potential to enhance the resilience of enterprises, improve their technological innovation, and validate hypothesis 2 by reducing financing constraints and institutional transaction costs.

4.5. Heterogeneity Analysis

4.5.1. Distinguishing the Nature of Property Rights

The heterogeneity regression results of the resilience subsample of state-owned and private enterprises under the reform are presented in Table 9. The estimated results for state-owned enterprises are presented in Columns (1) through (2) of Table 9. The positive impact of commercial system reform on the resilience of state-owned enterprises is not significant, as evidenced by the estimated coefficient for the policy of commercial system reform. The estimated coefficient for commercial system reform (Policy) is significantly positive, indicating that commercial system reform has a considerable positive impact on the resilience of private enterprises. Columns (3) and (4) are the estimated results for private enterprises. The primary reason for this is that the degree of decentralisation in commercial system reform has a minimal impact on the investment and production of state-owned enterprises, and the communication between the government and state-owned enterprises is extremely close. In contrast, private enterprises require the government to reduce regulations in order to reduce transaction costs, alleviate financing restrictions, and promote long-term and high-quality development through improved intellectual property protection. This, in turn, enhances the resilience of private enterprises.

4.5.2. Differentiate Enterprise Size

Table 10 presents the heterogeneity test of enterprise size and reports the heterogeneity regression results of reforming the commercial system on the resilience of enterprises of different sizes. This article uses the “Classification Method for Large, Medium, Small, and Micro Enterprises in Statistics” (Guotongzi [2017] No. 213) standard released by the National Bureau of Statistics to classify enterprises that meet the criteria for large-scale enterprises as large-scale companies, while the remaining types of enterprises are classified as small and medium-sized companies. In Table 10, Columns (1) and (2) present estimated results for large-scale enterprises. The estimated coefficients for commercial system reform (Policy) are considerably positive, suggesting that commercial system reform has a positive promoting effect on the resilience of large-scale enterprises. For minor and medium-sized enterprises, the estimated results are listed in Columns (3) through (4). The estimated coefficient for commercial system reform (Policy) is positive but not statistically significant, suggesting that the positive impact of commercial system reform on the resilience of small and medium-sized enterprises is not statistically significant. This may be due to the fact that large-scale enterprises possess a greater number of resources than small and medium-sized enterprises, which enables them to more effectively manage external environmental fluctuations and guarantee their ability to recover after being impacted [68]. In addition, the expansion of enterprise scale generates agglomeration effects, links more innovative entities, and enhances the diversity of innovation systems. This allows large-scale enterprises to exert diverse coping abilities when facing instability, and they have more trial-and-error space than small and medium-sized enterprises.

4.5.3. Differentiate Industry Competitiveness Differences

The heterogeneity regression results of the impact of reforming the commercial system on the resilience of enterprises with varying levels of competition in various industries are presented in Table 11. Enterprise revenue is employed to compute the HHI Index in this article. The enterprise is categorised as a highly competitive industry if the competition level of the industry in which it is located exceeds the average of the sample HHI Index. Otherwise, it is classified as a low-competition industry. The estimated coefficients for commercial system reform (Policy) are considerably positive, and Columns (1) and (2) in Table 11 represent the estimated results for highly competitive enterprises. This suggests that the resilience of highly competitive enterprises is positively influenced by the reform of the commercial system. Columns (3) and (4) are estimated results for low-competition enterprises. The estimated coefficient for the reform (Policy) is positive but not significant, suggesting that the positive impact of commercial system reform on the resilience of low-competition enterprises is not significant. This may be due to the fact that companies in highly competitive industries have a greater sense of crisis and are more inclined to continuously improve their internal governance systems and enhance their self-innovation capabilities [69]. Additionally, commercial system reform can effectively encourage the behaviour of enterprise technological innovation, thereby enhancing the resilience of companies in highly competitive industries. Furthermore, industries that are subject to greater competition necessitate an enhanced business environment. Commercial system reform has the potential to increase the resilience of enterprises, mitigate the risk of market turbulence induced by vicious competition, and promote fair competition in the market.

4.5.4. Distinguishing Industry Technical Differences

This article also utilises the methods of [25] to categorise the sample of listed companies into high-tech and low-tech industry enterprises. It then investigates the heterogeneous impact of commercial system reform on the resilience of high-tech and low-tech enterprises. The heterogeneity regression results of the impact of commercial system reform on the resilience of enterprises in various technology industries are presented in Table 12. The estimated results of high-tech industry enterprises are represented in Columns (1) and (2) in Table 12. The estimated coefficients of commercial system reform (Policy) are significantly positive, suggesting that commercial system reform has a positive promoting effect on the resilience of high-tech industry enterprises. The results of Columns (3) through (4) are estimated for enterprises in low-tech industries. The positive impact of commercial system reform on the resilience of enterprises in low-tech industries is not considerable, as evidenced by the estimated coefficient for the policy of commercial system reform. This may be due to the fact that high-tech industry enterprises have a relatively substantial R&D investment, which may entail legal issues such as intellectual property rights. In addition to enhancing enterprise resilience, commercial system reform can also reduce transaction costs for high-tech industry enterprises in terms of intellectual property protection, contract execution, and market competitiveness. It can also assist enterprises in better managing internal governance and social responsibility, promote sustainable development, and implement environmental protection measures. Furthermore, in terms of industrial digitization, high-tech enterprises are more robust than low-tech enterprises. Industrial digitization can empower enterprises with enhanced resource-linking capabilities [70], improve internal and external information communication methods, increase enterprise transparency [71], and, as a result, improve enterprise resilience.

5. Conclusions and Policy Implications

5.1. Conclusions

Corporate resilience is a critical guarantee for businesses to achieve high-quality development, as it enables them to respond to crises and achieve long-term sustained development. At present, there are only a handful of articles that examine the causal relationship between corporate resilience and commercial system reform. The impact and mechanism of commercial system reform on corporate resilience are the subject of this article, which examines the “quasi-natural experiment” of commercial system reform in Chinese prefecture-level cities and data on listed companies from 2011 to 2022. The resilience of enterprises can be substantially and positively enhanced by the commercial system reform, as evidenced by empirical research. Following the replacement of the dependent variable, the core explanatory variable, placebo test, PSM-DID, excluding other policy interference, and endogeneity treatment, the research conclusion of this article remains as is. Intermediary mechanism testing revealed that the commercial system’s overhaul could improve the resilience of enterprises by reducing financing constraints and institutional transaction costs and enhancing technological innovation capabilities. Furthermore, the resilience of enterprises is influenced by the heterogeneous policy effects of business system reform. In particular, the resilience of private enterprises, large-scale enterprises, highly competitive enterprises, and high-tech enterprises is more significantly influenced by the promotion effect of commercial system reform.

5.2. Policy Implications

The following are the policy implications of this study. In the present stage, it is imperative to maintain a strong sense of confidence and resolve, further develop the commercial system reform, promote the transformation of government functions, minimise government intervention in the market, optimise the activation of the system, improve the company’s awareness and capacity to manage crises, cultivate new competitive advantages, and strengthen the enterprise’s resilience. Secondly, to ensure that government responsibilities are better fulfilled and to prevent issues such as mutual accountability among government departments, the integration of reforms such as the government authority list system is enhanced. The implementation of a statutory time-limited processing system can significantly reduce the approval time for enterprises, improve government efficiency, reduce the burden of institutional transaction costs on enterprises, optimise the business environment for enterprises, and enhance their resilience. Thirdly, the enhancement of enterprise resilience is contingent upon the optimisation of the internal governance system, the continuous enhancement of its own governance level, the establishment of a positive internal control environment, the enhancement of the internal risk management system, the reinforcement of talent cultivation and incentive mechanisms, and the mitigation of the external environment’s impact on the enterprise. Fourthly, the government should increase investment in digital technology infrastructure to provide the company with strong fundamental conditions for its digital transformation, thereby improving corporate resilience and enhancing the company’s ability to respond to crises, given the significant positive impact of the rapid development of digital technology at present.

Author Contributions

Conceptualization, H.L.; Software, Z.K.; Formal analysis, H.L. and J.Y.; Data curation, Z.K.; Writing—original draft, H.L.; Writing—review & editing, H.L. and J.Y. All authors have read and agreed to the published version of the manuscript.

Funding

This research received no external funding.

Institutional Review Board Statement

Not applicable.

Informed Consent Statement

Not applicable.

Data Availability Statement

The data that support the findings of this study are available from the corresponding author upon reasonable request.

Conflicts of Interest

The authors declare no conflict of interest.

References

  1. Foris, T.; Tecău, A.S.; Dragomir, C.C.; Foris, D. The Start-Up Manager in Times of Crisis: Challenges and Solutions for Increasing the Resilience of Companies and Sustainable Reconstruction. Sustainability 2022, 14, 9140. [Google Scholar] [CrossRef]
  2. Wang, Y.; Gao, J. Shocks of 2019-nCoV, Economic Resilience and China’s High Quality Development. Bus. Manag. J. 2020, 42, 5–17. [Google Scholar] [CrossRef]
  3. Hillmann, J.; Guenther, E. Organizational resilience: A valuable construct for management research. Int. J. Manag. Rev. 2020, 23, 7–44. [Google Scholar] [CrossRef]
  4. Lengnick-Hall, C.A.; Beck, T.E.; Lengnick-Hall, M.L. Developing a capacity for organizational resilience through strategic human resource Management. Hum. Resour. Manag. Rev. 2011, 21, 243–255. [Google Scholar] [CrossRef]
  5. Zhang, Q.; Ge, F.; Zhang, L.; Qi, L.; Hao, B. Review and Outlook on the Resilience of Domestic and Foreign Enterprises. Sci. Technol. Prog. Countermeas. 2024, 1–12. [Google Scholar]
  6. Li, P.; Zhu, J. Organizational Resilience: Latest Literature Review. Foreign Econ. Manag. 2021, 43, 25–41. [Google Scholar]
  7. Tian, Y.; Fan, X. Adversity quotients, environmental variables and career adaptability in student nurses. J. Vocat. Behav. 2014, 85, 251–257. [Google Scholar] [CrossRef]
  8. Liu, S.; Xin, H. Mindfulness research in the field of organizational management: Based on a multi-level perspective. China Hum. Resour. Dev. 2019, 36, 37–53+93. [Google Scholar]
  9. Donaldson-Feilder, E.; Lewis, R.; Yarker, J.; Whiley, L.A. Interpersonal Mindfulness in Leadership Development: A Delphi Study. J. Manag. Educ. 2022, 46, 816–852. [Google Scholar] [CrossRef]
  10. Zhang, J.; Long, J.; Von Schaewen, A.M.E. How Does Digital Transformation Improve Organizational Resilience?—Findings from PLS-SEM and fsQCA. Sustainability 2021, 13, 11487. [Google Scholar] [CrossRef]
  11. Kahn, W.A.; Barton, M.A.; Fisher, C.M.; Heaphy, E.D.; Reid, E.M.; Rouse, E.D. The geography of strain: Organizational resilience as a function of intergroup relations. Acad. Manag. Rev. 2018, 43, 509–529. [Google Scholar] [CrossRef]
  12. Keum, D. Cog in the wheel:resource release and the scope of interdependencies in corporate adjustment activities. Strateg. Manag. J. 2019, 41, 175–197. [Google Scholar] [CrossRef]
  13. Greenwood, R. The Professional Partnership: Relic or Exemplary Form of Governance? Organ. Stud. 2003, 24, 909–933. [Google Scholar] [CrossRef]
  14. Lu, R.; Xu, L.; Ye, Q.; Hai, T. Study on Resilience of Chinese Private Enterprises and Influencing Factors. Econ. Manag. 2021, 43, 56–73. [Google Scholar]
  15. Feng, W.; Chen, H. The impact of binary innovation on the organizational resilience of high-tech enterprises: The moderating effect of knowledge scope and knowledge balance. Sci. Technol. Manag. 2022, 43, 117–135. [Google Scholar]
  16. Chattopadhyay, S.; Bercovitz, J. When one door closes, another door opens for some: Evidence from the post-TRIPS Indian pharmaceutical industry. Strateg. Manag. J. 2020, 41, 988–1022. [Google Scholar] [CrossRef]
  17. Jia, Y.; Fu, Q.; Wang, L.; Li, D. Technological Innovation and Enterprise Resilience: Based on the COVID-19 Scenario. Manag. Sci. 2023, 36, 17–34. [Google Scholar]
  18. Hess, T.; Matt, C.; Benlian, A. Options for formula ting a digital transformation strategy. Publ. Darmstadt Tech. Univ. Inst. Bus. Stud. 2016, 15, 123–139. [Google Scholar]
  19. Liu, J.; Xu, Y. ESG Performance and Corporate Resilience. Audit Econ. Res. 2024, 39, 54–64. [Google Scholar]
  20. Li, E.; Zhang, C.; Wan, X. Innovative decision-making under economic policy uncertainty: A perspective on corporate resilience. Contemp. Financ. Econ. 2022, 102–114. [Google Scholar] [CrossRef]
  21. Song, Y.; Zhang, X. Can innovation driven policies enhance the resilience of enterprises in the global value chain? World Econ. Res. 2023, 89–104+134. [Google Scholar] [CrossRef]
  22. Li, H.; Yu, D.; Yu, J. Commercial System Reform and Total Factor Productivity of Enterprises: Evidence from Quasi Natural Experiments. Sci. Res. Manag. 2023, 44, 151–157. [Google Scholar]
  23. Fu, L.; Shi, Y.; Yang, X.; Zhang, W. Enterprise resilience to the COVID-19 pandemic: The role of business environment. PLoS ONE 2023, 18, e0288722. [Google Scholar] [CrossRef] [PubMed]
  24. Li, H.; Yu, D.; Ke, Z. Commercial System Reform, Enterprise Green Innovation and Enterprise ESG Performance. Sustainability 2023, 15, 14469. [Google Scholar] [CrossRef]
  25. Li, X.; Yu, D. The Effect of Commercial System Reform on Enterprise Innovation. Econ. Dyn. 2021, 49, 116–131. [Google Scholar]
  26. Yujuan, W.; Jacquline, T. The impact of environmental regulation, Environment, Social and Government Performance, and technological innovation on enterprise resilience under a green recovery. Heliyon 2023, 9, e20278. [Google Scholar]
  27. Velic, P.A.; Jahic, H.; Krndzija, L. Firm resilience as a moderating force for SMEs’ innovation performance: Evidence from an emerging economy perspective. Reg. Sci. Policy Pract. 2024, 16, 100033. [Google Scholar] [CrossRef]
  28. Xu, X.; Ma, J. Commercial System Reform and Market Entity Entry Rate—Quantity Competition or Quality Competition. J. Sun Yat Sen Univ. 2019, 59, 191–202. [Google Scholar]
  29. Zhang, L.; Chen, Q.; Bi, Q. Commercial System Reform and Institutional Costs of Enterprises. J. Sun Yat Sen Univ. 2019, 59, 167–177. [Google Scholar]
  30. Huang, L.; Sun, X.; Wang, X. Commercial System Reform and Foreign Direct Investment. J. Sun Yat Sen Univ. 2019, 59, 178–190. [Google Scholar]
  31. Xia, J.; Liu, C. Contract Spirit, Commercial Reform and Innovation Level. Manag. World 2020, 36, 26–36+48+242. [Google Scholar]
  32. Liu, C.; Yang, J. Commercial System Reform and Industrial Specialization. China Ind. Econ. 2020, 385, 135–153. [Google Scholar]
  33. Chen, Y.; Li, C.; Tan, H.; Wang, Y. Research on the Impact of Enterprise ESG Performance on Enterprise Resilience. Financ. Theory Pract. 2024, 45, 128–135. [Google Scholar]
  34. Zhang, W.; Xia, L. The Impact of Business Environment on Mass Entrepreneurship: Evidence from Commercial System Reform. Reform 2020, 36, 94–103. [Google Scholar]
  35. Zhang, S.; Xu, M.; Zhu, Y.; Wang, Z. Technological Innovation, Organizational Resilience and High-quality Development of Manufacturing Enterprises. Sci. Technol. Prog. Countermeas. 2023, 40, 81–92. [Google Scholar]
  36. Lian, J.; Yu, B. Research on the Impact of Enterprise Business Environment on Financing Constraints. Price Theory Pract. 2019, 422, 88–91. [Google Scholar]
  37. Li, B. Correlation Analysis between Financial Ecological Environment and Innovation Capability of Commercial Circulation Enterprises: Based on the Perspective of Financing Constraints. Bus. Econ. Res. 2021, 834, 9–12. [Google Scholar]
  38. Li, B.; Gong, S.; Zeng, Y.T. Digital Financial Inclusion, Financial Constraints and Financial Sustainability of SMEs. Reform 2022, 38, 126–142. [Google Scholar]
  39. Si, D.; Li, X.; Kong, D.; Jiang, C. Does Interest Rate Liberalization Lower the Operational Risks of Enterprises? Dual Perspectives of Financing Constraints and Financialization. Financ. Res. 2023, 46, 113–130. [Google Scholar]
  40. Huang, L.; Sun, X.; Wang, X. Has the reform of the commercial system effectively stimulated entrepreneurship—Evidence from prefecture level cities. Financ. Res. 2020, 46, 142–155. [Google Scholar]
  41. Fisman, R.; Wang, Y. The mortality cost of political connections. Rev. Econ. Stud. 2015, 82, 1346–1382. [Google Scholar] [CrossRef]
  42. Liu, X.; Li, X. Pyramid Structure, Tax Burden, and Enterprise Value: Evidence Based on Local State Owned Enterprises. Manag. World 2012, 8, 91–105. [Google Scholar]
  43. Zhang, M.; Lijun, M.; Zhang, B.; Yi, Z. Pyramidal Structure, Political Intervention and Firms’tax Burden: Evidence from China’s Local SOEs. J. Corp. Financ. 2016, 36, 15–25. [Google Scholar] [CrossRef]
  44. Zhang, S.; Zhang, M.; Meng, S. Corporate transaction costs and corporate green total factor productivity. Financ. Res. Lett. 2024, 61, 105041. [Google Scholar] [CrossRef]
  45. Cardillo, G.; Bendinelli, E.; Torluccio, G. COVID-19, ESG investing, and the resilience of more sustainable stocks: Evidence from European firms. Bus. Strategy Environ. 2022, 32, 602–623. [Google Scholar] [CrossRef]
  46. Qiliang, M.; Xianzhuang, M. The shaping of inter-regional industrial linkages by institutional and cultural division in China: Characteristics and differences. Econ. Anal. Policy 2024, 81, 1113–1132. [Google Scholar] [CrossRef]
  47. Zhang, Z.; Yao, C.; Yu, C. The “double-edged sword” effect of management innovation implementation on the growth of small and medium-sized enterprises. Sci. Res. 2018, 36, 1325–1333. [Google Scholar]
  48. Dubey, R.; Gunasekaran, A.; Childe, S.J.; Fosso Wamba, S.; Roubaud, D.; Foropon, C. Empirical investigation of data analytics capability and organizational flexibility as complements to supply chain resilience. Int. J. Prod. Res. 2019, 59, 110–128. [Google Scholar] [CrossRef]
  49. Restrepo-Morales, J.A.; Valencia-Cárdenas, M.; García-Pérez-de-Lema, D. The role of technological innovation in the mitigation of the crisis generated by COVID-19: An empirical study of small and medium-sized businesses (SMEs) in Latin America. Int. Stud. Manag. Organ. 2024, 54, 120–136. [Google Scholar] [CrossRef]
  50. Ghomi, V.; Nooraei, S.V.R.; Shekarian, N.; Shokoohyar, S.; Parast, M. Improving supply chain resilience through investment in flexibility and innovation. Int. J. Syst. Sci. Oper. Logist. 2023, 10, 2221068. [Google Scholar] [CrossRef]
  51. Piprani, A.Z.; Khan, S.A.R.; Salim, R.; Khalilur Rahman, M. Unlocking sustainable supply chain performance through dynamic data analytics: A multiple mediation model of sustainable innovation and supply chain resilience. Environ. Sci. Pollut. Res. Int. 2023, 30, 90615–90638. [Google Scholar] [CrossRef] [PubMed]
  52. Ortiz-de-Mandojana, N.; Bansal, P. The long term benefits oforganizational resilience through sustainable business practices. Strateg. Manag. J. 2016, 37, 1615–1631. [Google Scholar] [CrossRef]
  53. Xiao, X.; Lin, Y. ESG Performance and Corporate Resilience: Effects and Mechanisms. Ind. Econ. Rev. 2024, 1–19. [Google Scholar] [CrossRef]
  54. Wang, G.J.; Lu, X.X. The the Belt and Road Initiative and the Upgrading of Chinese Enterprises. China Ind. Econ. 2019, 372, 43–61. [Google Scholar]
  55. Bi, Q.; Chen, X.; Xu, X.; Li, S. Administrative Approval Reform and Enterprise Entry. Econ. Res. 2018, 53, 140–155. [Google Scholar]
  56. Heino, N.; Alimov, N.; Tuominen, P. Family firm employment behavior during a financial crisis: Does generational stage matter? J. Fam. Bus. Strategy 2024, 15, 100624. [Google Scholar] [CrossRef]
  57. Wang, S.; Yang, Z.; Zhang, W.; Zhang, S. Research on the impact of heterogeneous environmental regulations on the economic resilience of carbon neutral enterprises. J. Manag. 2023, 20, 1771–1780. [Google Scholar]
  58. Tian, D.; Ding, B. Measurement and Mechanism of High Quality Development of Enterprises: From the Perspective of Organizational Resilience. China Soft Sci. 2023, 37, 154–170. [Google Scholar]
  59. Guo, C.; Luo, J. “Dual role” suppliers for major clients and enterprise supply chain resilience. Contemp. Financ. 2024, 139–152. [Google Scholar] [CrossRef]
  60. Alhajjeah, D.; Besim, M. Firms’ Capital Structure during Crises: Evidence from the United Kingdom. Sustainability 2024, 16, 5469. [Google Scholar] [CrossRef]
  61. Possebon, E.A.G.; Cippiciani, F.A.; Savoia, J.R.F.; de Mariz, F. ESG Scores and Performance in Brazilian Public Companies. Sustainability 2024, 16, 5650. [Google Scholar] [CrossRef]
  62. Zhang, K.; Lei, Z.; Li, H. Market Access Control and Total Factor Productivity of Enterprises: Evidence from Negative Lists. World Econ. 2023, 46, 152–176. [Google Scholar]
  63. Zhou, M.; Lu, Y.; Du, Y.; Yao, X. Establishment of Development Zones and Upgrading of Regional Manufacturing Industry. China Ind. Econ. 2018, 33, 62–79. [Google Scholar]
  64. Liu, C.; Xia, J. Business System Reform, Human Capital, and Entrepreneurial Choices. Financ. Trade Econ. 2021, 42, 113–129. [Google Scholar] [CrossRef]
  65. Wang, Y.; Feng, X. Administrative Approval System Reform and Enterprise Innovation. China Ind. Econ. 2018, 24–42. [Google Scholar] [CrossRef]
  66. Charles, J.H.; Joshua, R.P. New Evidence on Measuring Financial Constraints: Moving Beyond the KZ Index. Rev. Financ. Stud. 2010, 23, 1909–1940. [Google Scholar]
  67. Xia, J.; Liu, C. Administrative Approval Reform, Transaction Costs, and China’s Economic Growth. Manag. World 2017, 47–59. [Google Scholar]
  68. Bishop, P. Knowledge Diversity and Entrepreneurship Following an Economic Crisis: An Empirical Study of Regional Resilience in Great Britain. Entrep. Reg. Dev. 2019, 31, 496–515. [Google Scholar] [CrossRef]
  69. Lin, Z.; Liu, L. Exploratory Study on the Competency Characteristics of Chinese Entrepreneurs during the Transformation Period. Manag. World 2007, 98–104. [Google Scholar] [CrossRef]
  70. Gong, X.; Yu, J. How does digital transformation of enterprises affect the share of labor income? Mod. Econ. Explor. 2023, 24–35. [Google Scholar] [CrossRef]
  71. Hu, J.; Han, Y.; Zhong, Y. How Digital Transformation of Enterprises Affects ESG Performance: Evidence from Chinese Listed Companies. Ind. Econ. Rev. 2023, 54, 105–123. [Google Scholar]
Figure 1. Placebo test.
Sustainability 16 07616 g001
Table 1. Descriptive Statistics.
VariableVariable SymbolVariable DefinitionNMeanSdMinMax
Enterprise resilienceResilSynthesise enterprise resilience indicators using the entropy method based on the standard deviation of cumulative sales revenue growth within three years and monthly stock returns within one year18,4830.9020.06860.02420.998
Reform of the commercial systemPolicyThe reform of the commercial system was introduced as 1 by the city where the enterprise is located in a certain year, and otherwise 018,4830.2040.40301
Enterprise sizeSizeTake the logarithm of the total assets of the company at the end of the period18,48323.181.27220.3626.4
The asset–liability ratioLevTotal liabilities/total assets at the end of the period18,4830.4760.1970.05890.895
The cash flow of a companyCashflowNet cash flow/total assets18,4830.05990.0677−0.1490.246
ProfitabilityROAEnterprise net profit/average total assets18,4830.05070.0603−0.1760.23
The listing ageListAgeSubtract the year of establishment of the enterprise from the statistical year and add 118,4832.4810.67303.367
Institutional investor shareholding ratioINSTThe number of shares owned by institutional investors/total number of shares18,4830.5060.2160.01210.882
Book-to-market ratioBMBook value of the company/market value of the company18,4831.431.5820.087610.12
Tobin QTobinQMarket value/asset replacement cost of the enterprise18,4831.9841.3980.8259.598
Return on equityROEEnterprise net profit/average net assets18,4830.08850.117−0.580.383
The largest shareholder’s shareholding ratioTOP1Shareholding percentage of the largest shareholder in the enterprise18,4830.370.1590.08730.751
Foreign direct investmentfdiThe foreign direct investment’s actual utilisation logarithm18,48312.441.3577.94814.66
Economic developmentpgdpLogarithmic calculation of per capita GDP in cities18,48311.180.47610.0112.12
Industrial structurestruproportion of the secondary industry18,4830.45970.1120.08850.8934
Marketization degreemarkThe proportion of urban private and individual employees in the total number of employees in each city18,4830.9020.06860.02420.998
Table 2. Benchmark Regression Results.
Variables(1)(2)(3)(4)(5)(6)
ResilResilResilResilResilResil
Policy0.0119 **0.0347 ***0.0347 ***0.0053 ***0.0383 ***0.0383 ***
(0.005)(0.013)(0.012)(0.002)(0.011)(0.011)
Size 0.0142 ***0.0229 **0.0229 **
(0.002)(0.010)(0.010)
Lev −0.1372 ***−0.1526 ***−0.1526 ***
(0.016)(0.037)(0.037)
Cashflow 0.0460−0.0383−0.0383
(0.042)(0.049)(0.049)
Roa 0.4460 ***0.25110.2511
(0.124)(0.185)(0.185)
BM 0.0152 ***0.0204 ***0.0204 ***
(0.002)(0.003)(0.003)
ListAge 0.0175 ***0.0611 ***0.0611 ***
(0.005)(0.020)(0.020)
Inst 0.0641 ***0.0483 **0.0483 **
(0.013)(0.023)(0.023)
TobinQ −0.0237 ***−0.0278 ***−0.0278 ***
(0.002)(0.004)(0.004)
Roe −0.1697 ***−0.1653 *−0.1653 *
(0.059)(0.098)(0.098)
Top1 0.0106−0.0350−0.0350
(0.017)(0.047)(0.047)
Constant4.5116 ***4.5024 ***4.5024 ***4.0777 ***3.9632 ***3.9632 ***
(0.002)(0.006)(0.006)(0.073)(0.397)(0.397)
city control variablesnononoyesyesyes
Time fixed effectyesyesyesyesyesyes
city fixed effectsnonoyesnonoyes
Corporate fixed effectsnoyesyesnoyesyes
R-squared0.6870.7590.7590.7110.7680.768
Observations18,48318,36718,36718,48318,36718,367
Note: ***, **, * respectively represent significance at the 1%, 5%, and 10% levels, and the values in parentheses represent the standard error of robustness.
Table 3. Replacing variables of commercial system reform.
Variables(1)(2)(3)(4)(5)(6)
ResilResilResilResilResilResil
Policy0.0101 **0.0193 **0.0193 **0.0110 **0.0142 ***0.0142 ***
(0.005)(0.009)(0.009)(0.005)(0.004)(0.004)
Size 0.0142 ***0.0224 **0.0224 **
(0.002)(0.010)(0.010)
Lev −0.1373 ***−0.1514 ***−0.1514 ***
(0.016)(0.037)(0.037)
Cashflow 0.0472−0.0350−0.0350
(0.042)(0.049)(0.049)
Roa 0.4458 ***0.25090.2509
(0.124)(0.186)(0.186)
BM 0.0152 ***0.0205 ***0.0205 ***
(0.002)(0.003)(0.003)
ListAge 0.0175 ***0.0601 ***0.0601 ***
(0.005)(0.020)(0.020)
Inst 0.0648 ***0.0477 **0.0477 **
(0.013)(0.023)(0.023)
TobinQ −0.0238 ***−0.0277 ***−0.0277 ***
(0.002)(0.004)(0.004)
Roe −0.1694 ***−0.1634 *−0.1634 *
(0.059)(0.098)(0.098)
Top1 0.0097−0.0406−0.0406
(0.017)(0.048)(0.048)
Constant4.5099 ***4.5110 ***4.5110 ***4.0711 ***4.0505 ***4.0505 ***
(0.002)(0.002)(0.002)(0.073)(0.392)(0.392)
city control variablesnononoyesyesyes
Time fixed effectyesyesyesyesyesyes
city fixed effectsnonoyesnonoyes
Corporate fixed effectsnoyesyesnoyesyes
R-squared0.6550.7830.7830.7090.7750.775
Observations18,48318,36718,36718,48318,36718,367
Note: ***, **, * respectively represent significance at the 1%, 5%, and 10% levels, and the values in parentheses represent the standard error of robustness.
Table 4. Replacing Enterprise Resilience Variables.
Variables(1)(2)(3)(4)(5)(6)
GrowthGrowthGrowthGrowthGrowthGrowth
Policy0.02490.3193 ***0.2742 ***0.0508 *0.03730.0848
(0.046)(0.102)(0.077)(0.030)(0.077)(0.067)
Size 1.0268 ***1.0356 ***1.1988 ***
(0.015)(0.017)(0.037)
Lev −1.6110 ***−1.4511 ***−1.5276 ***
(0.132)(0.141)(0.177)
Cashflow 0.09420.27880.6707 ***
(0.219)(0.224)(0.240)
Roa 4.8666 ***4.0143 ***5.2858 ***
(0.891)(0.941)(0.977)
BM −0.0563 ***−0.0569 ***0.0392 ***
(0.012)(0.013)(0.014)
ListAge 0.2865 ***0.2988 ***0.3482 ***
(0.020)(0.023)(0.069)
Inst 0.3459 ***0.3880 ***0.1848 **
(0.068)(0.071)(0.092)
TobinQ 0.00350.0044−0.0162
(0.009)(0.010)(0.013)
Roe −0.8771 *−1.2108 **−0.8138 *
(0.472)(0.498)(0.486)
Top1 0.14270.11130.0340
(0.092)(0.100)(0.203)
Constant3.0891 ***3.0279 ***3.0417 ***20.1447 ***18.8904 ***19.5650 ***
(0.023)(0.028)(0.020)(0.444)(0.811)(0.998)
city control variablesnononoyesyesyes
Time fixed effectyesyesyesyesyesyes
city fixed effectsnonoyesnonoyes
Corporate fixed effectsnoyesyesnoyesyes
R-squared0.6550.7830.7830.7090.7750.775
Observations18,48318,36718,36718,48318,36718,367
Note: ***, **, * respectively represent significance at the 1%, 5%, and 10% levels, and the values in parentheses represent the standard error of robustness.
Table 5. PSM-DID Regression Results.
Variables(1)(2)(3)(4)(5)(6)
ResilResilResilResilResilResil
Policy0.0159 ***0.1213 ***0.0070 ***0.0129 ***0.0665 ***0.0076 ***
(0.002)(0.006)(0.002)(0.002)(0.006)(0.002)
Size 0.0172 ***0.0231 ***0.0044 **
(0.001)(0.003)(0.002)
Lev 0.0090−0.00220.0407
(0.034)(0.045)(0.031)
Cashflow −0.0653 ***−0.0695 ***−0.0288 *
(0.015)(0.021)(0.017)
Roa −0.0441 ***−0.0599 ***−0.0306 ***
(0.005)(0.010)(0.007)
BM 0.0401 ***−0.0335 **−0.0078
(0.013)(0.015)(0.010)
ListAge −0.0036 ***−0.0104 ***0.0042 ***
(0.001)(0.001)(0.001)
Inst −0.00080.0044−0.0076
(0.005)(0.014)(0.009)
TobinQ 0.0033 ***0.0039 ***−0.0051 ***
(0.001)(0.001)(0.001)
Roe −0.0148 ***−0.0263 ***0.0089 *
(0.004)(0.007)(0.005)
Top1 0.0161 ***0.0372 ***0.0120 ***
(0.001)(0.005)(0.004)
Constant0.8986 ***0.8770 ***0.9005 ***0.1596 ***−0.5141 ***0.8020 ***
(0.001)(0.002)(0.001)(0.023)(0.070)(0.080)
city control variablesnononoyesyesyes
Time fixed effectyesyesyesyesyesyes
city fixed effectsnonoyesnonoyes
Corporate fixed effectsnoyesyesnoyesyes
R-squared0.1090.1870.7600.1650.3800.768
Observations18,43218,31618,31618,43218,31618,316
Note: ***, **, * respectively represent significance at the 1%, 5%, and 10% levels, and the values in parentheses represent the standard error of robustness.
Table 6. Regression Results Excluding the Interference of the “the Belt and Road” Initiative.
Variables(1)(2)(3)(4)(5)(6)
ResilResilResilResilResilResil
Policy0.0146 ***0.0200 ***0.0200 ***0.0032 ***0.0249 ***0.0249 ***
(0.006)(0.005)(0.005)(0.001)(0.006)(0.006)
Size 0.0132 ***0.0199 *0.0199 *
(0.002)(0.011)(0.011)
Lev −0.1372 ***−0.1382 ***−0.1382 ***
(0.018)(0.036)(0.036)
Cashflow 0.0648−0.0374−0.0374
(0.043)(0.053)(0.053)
Roa 0.4091 ***0.22700.2270
(0.132)(0.198)(0.198)
BM 0.0165 ***0.0216 ***0.0216 ***
(0.002)(0.003)(0.003)
ListAge 0.0211 ***0.0552 ***0.0552 ***
(0.006)(0.021)(0.021)
Inst 0.0527 ***0.0452 **0.0452 **
(0.013)(0.022)(0.022)
TobinQ −0.0234 ***−0.0270 ***−0.0270 ***
(0.002)(0.004)(0.004)
Roe −0.1514 **−0.1523−0.1523
(0.062)(0.106)(0.106)
Top1 0.0242−0.0496−0.0496
(0.018)(0.053)(0.053)
Constant4.5122 ***4.5058 ***4.5058 ***4.0982 ***4.0625 ***4.0625 ***
(0.002)(0.005)(0.005)(0.076)(0.432)(0.432)
city control variablesnononoyesyesyes
Time fixed effectyesyesyesyesyesyes
city fixed effectsnonoyesnonoyes
Corporate fixed effectsnoyesyesnoyesyes
R-squared0.6810.7560.7560.7060.7640.764
Observations957995189518957995189518
Note: ***, **, * respectively represent significance at the 1%, 5%, and 10% levels, and the values in parentheses represent the standard error of robustness.
Table 7. Estimated results of endogeneity treatment.
First-Stage RegressionSecond-Stage Regression
(1)(2)
VariablesPolicyResil
IV0.0687 ***
(0.012)
Policy 0.0342 ***
(0.007)
control variablesyesyes
R-squared0.6650.744
Number18,48318,483
Kleibbergen-Paap Wald689.18 ***
[0.000]
Kleibbergen-Paap LM320.46 ***
[0.000]
Note: The values in parentheses below the coefficients in the table represent the standard error of robustness, while the values in square brackets represent p-values. *** represents statistical significance levels of 1%.
Table 8. Testing the Mechanism of the Impact of Commercial System Reform on Enterprise Resilience.
Variables(1)(2)(3)(4)(5)(6)(7)
ResilKZResilCostResilR&DResil
Policy0.0383 ***−0.0384 ***0.0448 ***−0.0505 **0.0453 *0.0266 ***0.0131
(0.011)(0.013)(0.013)(0.024)(0.027)(0.007)(0.006)
KZ −0.0044 **
(0.002)
Cost −0.0104 **
(0.005)
R&D 0.0116 ***
(0.003)
Size0.0229 **−0.5903***0.0220 *−0.2387 ***0.0206 *0.8060 ***0.0133
(0.010)(0.047)(0.011)(0.022)(0.011)(0.042)(0.013)
Lev−0.1526 ***6.6054 ***−0.05352.5980 ***−0.0628−0.3432 **−0.0724
(0.037)(0.229)(0.051)(0.116)(0.051)(0.166)(0.059)
Cashflow−0.0383−13.7288 ***−0.06770.4772 ***−0.00390.0975−0.0166
(0.049)(0.233)(0.070)(0.133)(0.052)(0.222)(0.061)
Roa0.2511−15.3502 ***0.7371 *−2.3910 ***0.8027 *1.61310.9650 *
(0.185)(1.346)(0.430)(0.700)(0.412)(1.265)(0.535)
BM0.0204 ***0.01560.0192 ***0.0534 ***0.0197 ***0.0436 **0.0223 ***
(0.003)(0.013)(0.003)(0.008)(0.003)(0.021)(0.004)
ListAge0.0611 ***0.9745 ***0.03170.1108 ***0.0603 ***−0.07170.0910 ***
(0.020)(0.085)(0.020)(0.041)(0.020)(0.060)(0.021)
Inst0.0483 **0.00220.0305−0.04260.0385−0.02260.0274
(0.023)(0.104)(0.024)(0.052)(0.024)(0.089)(0.026)
TobinQ−0.0278 ***0.4706 ***−0.0220 ***0.0323 ***−0.0240 ***−0.0025−0.0226 ***
(0.004)(0.021)(0.003)(0.007)(0.004)(0.014)(0.004)
Roe−0.1653 *2.2103 ***−0.5981 **−8.2874 ***−0.7084 ***0.2820−0.7516 **
(0.098)(0.632)(0.260)(0.377)(0.259)(0.717)(0.346)
Top1−0.0350−0.0592−0.0398−0.2891 **−0.03260.0099−0.0433
(0.047)(0.227)(0.048)(0.129)(0.048)(0.261)(0.048)
Constant3.9632 ***7.0584 ***3.8719 ***5.3390 ***3.9130 ***0.10184.3171 ***
(0.397)(2.006)(0.427)(1.154)(0.427)(1.992)(0.461)
city control variablesyesyesyesyesyesyesyes
Time fixed effectyesyesyesyesyesyesyes
city fixed effectsyesyesyesyesyesyesyes
Corporate fixed effectsyesyesyesyesyesyesyes
R-squared0.7680.8720.7800.8480.7720.8730.778
Observations18,36718,36718,36718,36718,36718,36718,367
Note: ***, **, * respectively represent significance at the 1%, 5%, and 10% levels, and the values in parentheses represent the standard error of robustness.
Table 9. Heterogeneity estimation results for distinguishing property rights.
Variables(1)(2)(3)(4)
State-OwnedState-OwnedPrivatePrivate
ResilResilResilResil
Policy0.01710.02290.0403 ***0.0415 ***
(0.021)(0.021)(0.014)(0.013)
Size 0.0345 *** −0.0041
(0.012) (0.012)
Lev −0.1570 *** −0.0661
(0.040) (0.042)
Cashflow 0.0630 −0.0873
(0.051) (0.074)
Roa −0.1142 0.6767 *
(0.215) (0.368)
BM 0.0207 *** 0.0189 ***
(0.003) (0.006)
ListAge 0.0438 0.0840 ***
(0.037) (0.021)
Inst 0.0432 0.0343
(0.026) (0.029)
TobinQ −0.0378 *** −0.0251 ***
(0.008) (0.004)
Roe −0.0488 −0.3268
(0.071) (0.216)
Top1 −0.0317 −0.0105
(0.054) (0.074)
Constant4.5103 ***3.8103 ***4.5084 ***4.2505 ***
(0.004)(0.567)(0.008)(0.598)
city control variablesnoyesnoyes
Time fixed effectyesyesyesyes
city fixed effectsyesyesyesyes
Corporate fixed effectsyesyesyesyes
R-squared0.7980.8090.7470.754
Observations9301930191369136
Note: ***, * respectively represent significance at the 1%, and 10% levels, and the values in parentheses represent the standard error of robustness.
Table 10. Heterogeneity estimation results for distinguishing enterprise size.
Variables(1)(2)(3)(4)
Large-ScaleLarge-ScaleSmall & MediumSmall & Medium
ResilResilResilResil
Policy0.0373 *0.0422 *0.01080.0047
(0.023)(0.022)(0.030)(0.030)
Size 0.0209 * −0.0083
(0.012) (0.034)
Lev −0.1350 *** −0.1064
(0.032) (0.097)
Cashflow 0.0329 −0.0767
(0.053) (0.113)
Roa 0.2607 0.0139
(0.214) (0.330)
BM 0.0199 *** 0.0971 ***
(0.003) (0.033)
ListAge 0.0630 *** 0.0461
(0.023) (0.050)
Inst 0.0347 −0.0277
(0.022) (0.044)
TobinQ −0.0308 *** −0.0233 ***
(0.006) (0.005)
Roe −0.1886 * 0.0826
(0.114) (0.187)
Top1 0.0269 −0.2418
(0.048) (0.183)
Constant4.5330 ***3.9388 ***4.3642 ***5.1223 ***
(0.005)(0.460)(0.007)(1.603)
city control variablesnoyesnoyes
Time fixed effectyesyesyesyes
city fixed effectsyesyesyesyes
Corporate fixed effectsyesyesyesyes
R-squared0.7550.7640.8230.830
Observations15,28515,28530823082
Note: ***, * respectively represent significance at the 1%, and 10% levels, and the values in parentheses represent the standard error of robustness.
Table 11. Heterogeneity estimation results for distinguishing industry competition levels.
Variables(1)(2)(3)(4)
HighHighLowLow
ResilResilResilResil
Policy0.0397 **0.0478 ***0.00840.0104
(0.019)(0.012)(0.030)(0.030)
Size 0.0284 ** 0.0345
(0.014) (0.035)
Lev −0.1541 *** −0.1018
(0.046) (0.097)
Cashflow −0.0316 0.0427
(0.055) (0.120)
Roa 0.2544 0.4767
(0.222) (0.545)
BM 0.0236 *** 0.0198 **
(0.004) (0.009)
ListAge 0.0854 *** 0.0255
(0.027) (0.050)
Inst 0.0682 ** −0.0196
(0.031) (0.038)
TobinQ −0.0282 *** −0.0121
(0.004) (0.014)
Roe −0.1935 −0.2847
(0.122) (0.196)
Top1 −0.0142 −0.0568
(0.065) (0.119)
Constant4.5776 ***4.1991 ***4.1747 ***−1.8924
(0.011)(0.497)(0.006)(3.847)
city control variablesnoyesnoyes
Time fixed effectyesyesyesyes
city fixed effectsyesyesyesyes
Corporate fixed effectsyesyesyesyes
R-squared0.6990.7120.7810.787
Observations14,89914,89934683468
Note: ***, ** respectively represent significance at the 1%, and 5% levels, and the values in parentheses represent the standard error of robustness.
Table 12. Heterogeneity estimation results for distinguishing industry technologies.
Variables(1)(2)(3)(4)
High-TechHigh-TechLow-TechLow-Tech
ResilResilResilResil
Policy0.0852 **0.0818 **0.03070.0321
(0.041)(0.039)(0.019)(0.020)
Size −0.0138 0.0364 **
(0.011) (0.017)
Lev −0.0237 −0.1893 ***
(0.043) (0.053)
Cashflow −0.1325 ** 0.0032
(0.060) (0.056)
Roa 0.1701 0.0852
(0.222) (0.205)
BM 0.0308 *** 0.0184 ***
(0.008) (0.003)
ListAge 0.0657 *** 0.0444
(0.023) (0.031)
Inst 0.0126 0.0655 *
(0.026) (0.035)
TobinQ −0.0167 *** −0.0403 ***
(0.003) (0.007)
Roe −0.0167 −0.1098
(0.096) (0.078)
Top1 −0.0211 −0.0612
(0.057) (0.068)
Constant4.5055 ***5.2302 ***4.5024 ***3.3408 ***
(0.005)(0.572)(0.009)(0.589)
city control variablesnoyesnoyes
Time fixed effectyesyesyesyes
city fixed effectsyesyesyesyes
Corporate fixed effectsyesyesyesyes
R-squared0.8610.8650.7360.748
Observations6985698511,38211,382
Note: ***, **, * respectively represent significance at the 1%, 5%, and 10% levels, and the values in parentheses represent the standard error of robustness.
Disclaimer/Publisher’s Note: The statements, opinions and data contained in all publications are solely those of the individual author(s) and contributor(s) and not of MDPI and/or the editor(s). MDPI and/or the editor(s) disclaim responsibility for any injury to people or property resulting from any ideas, methods, instructions or products referred to in the content.

