Article

Perceived and Physical Quality of Drinking Water in Pavlodar and Akmola Rural Regions of Kazakhstan

1
Environmental Management and Engineering Department, Faculty of Natural Sciences, L.N. Gumilyov Eurasian National University, Astana 010001, Kazakhstan
2
Landscape Ecology and Ecosystem Science Laboratory, Department of Geography, Michigan State University, East Lansing, MI 48824, USA
3
High School of Ecology, Yugra State University, Khanty Mansysk 628000, Russia
4
Department of Ecology, Kh. Dosmukhamedov Atyrau University, Atyrau 060011, Kazakhstan
5
Department of Botany, E.A. Buketov Karaganda University, Karaganda 100027, Kazakhstan
6
Department Biology, Astana International University, Astana 010017, Kazakhstan
7
State Audit Department, L.N. Gumilyov Eurasian National University, Astana 010008, Kazakhstan
*
Author to whom correspondence should be addressed.
Sustainability 2024, 16(17), 7625; https://doi.org/10.3390/su16177625
Submission received: 25 July 2024 / Revised: 18 August 2024 / Accepted: 28 August 2024 / Published: 3 September 2024

Abstract

:
Water quality in rural areas of developing countries is a notable problem. In this article, drinking water quality from eleven villages in the Pavlodar and the Akmola region of Kazakhstan was analyzed. Questionnaires of village respondents and chemical components of drinking water were analyzed to identify the quality of drinking water. In each of the villages, the chemical content varied depending on the source of drinking water. In the rural Pavlodar region, we observed that some cations and anions exceed the MPC. Respondents’ perceptions of water quality are associated with water sources and physical components. For example, respondents’ satisfaction by inside tap of central water systems’ water was high, the answers of those whose water source was private wells showed more mixed satisfaction levels. The drinking water physical quality indicators are closely related to water mineralization and general hardness. The total microbial count of drinking water has a significant relationship with respondents’ complaints about unpleasant taste, odor, and salinity. The relationship between perceived and physical water quality is a critical aspect of water resource management. By bridging the gap between scientific assessments and public perceptions, we can enhance public health, build trust in water management systems, and promote sustainability of water use.

1. Introduction

Access to clean drinking water and adequate sanitation facilities are fundamental human rights, essential for maintaining public health. However, rural areas often face significant challenges in ensuring these necessities due to infrastructural, economic, and environmental constraints [1]. In regions like Pavlodar and Akmola in Kazakhstan, these challenges are particularly pronounced, affecting the quality of life and health outcomes of the residents. Sanitation infrastructure in rural areas is typically underdeveloped compared to urban centers. Studies have shown that inadequate sanitation can lead to significant public health issues, including the spread of waterborne diseases and environmental contamination [2]. In rural Kazakhstan, many households still rely on outdoor toilets and basic sanitation facilities, which are often insufficiently managed and maintained [3].
In addition to sanitation challenges, water quality in rural areas is often compromised by both natural and anthropogenic factors. Groundwater, a primary source of drinking water in many rural regions, is susceptible to contamination from agricultural runoff, industrial pollutants, and inadequate waste disposal practices [4]. The presence of contaminants such as nitrates, heavy metals, and microbial pathogens in drinking water poses significant health risks. Previous research has highlighted the critical need for improved water quality monitoring and sanitation management in rural areas to mitigate these risks [5]. Effective interventions require a comprehensive understanding of the local context, including the types and conditions of sanitation facilities, the quality of drinking water sources, and the perceptions and practices of the local population regarding water and sanitation. Industrial and economic development in some developing countries has increased its impact on human health, agricultural activities, and ecosystems due to rising air and water pollution [6]. Moreover, rural areas in many countries continue to face serious problems caused by bacterial contamination of drinking water, perpetuating waterborne disease transmission, and highlighting the fecal–oral route as a common mode of transmission.
In Kazakhstan, as in other developing countries, issues are associated with ensuring equal access to drinking water and sanitation facilities in rural areas. State programs like “Ak Bulak” and “Nurly Zher” in Kazakhstan have been implemented to address these critical issues; however, their effectiveness is uncertain. Reliance on surface water and groundwater as primary drinking water sources, along with alternative collection methods like capturing precipitation, means there is a diversity of water sources of varying initial quality in rural Kazakhstan, often necessitating extensive treatment, especially of surface waters due to their generally poor condition. Works by foreign scientists have also highlighted water pollution in rural areas; for example, Organic amine pesticides (OAPs) are widely used in modern agriculture, and these compounds can contaminate drinking water sources in various ways. In the study Yang et al., samples of tap water (TW) and bottled water (BW) were collected from eight cities in the Yangtze River Delta urban agglomeration in China, and their total amine pesticide (TAP) levels were analyzed and showed that the total TAP concentration (∑TAP) in TW (mean 11.06 ± 4.99 ng/L) was 29.4% higher than in BW (mean 8.55 ± 3.98 ng/L), and fewer species were detected OAP in BW. Moreover, long-term use of TW in some regions was associated with carcinogenic risk even in the acceptable range of TAPs, especially in men, with molinate being the major contributor (61.3%) to TAP exposure. Further analysis showed that the occurrence and health risks of OAPs in drinking water are mainly influenced by the quality of water sources and the technologies used at drinking water treatment plants (DWTPs) [7]. Sources of pollution are varied: industrial and household waste, agricultural runoff, as well as seepage from polluted surface reservoirs, oil wells, and water intakes [8].
Despite being of better quality compared to surface water, groundwater is not immune to contamination risks from various sources such as agricultural runoff and the improper disposal of liquid wastes, including industrial waste and leachates from municipal solid waste landfills. This highlights not only the complexities surrounding water source management but also the critical need for comprehensive water treatment solutions to ensure safety and potability [9]. This underscores the urgent need for comprehensive strategies to mitigate pollution, protect water resources, and ensure sustainable water management practices in Kazakhstan [10]. Rural areas face pressing environmental and public health challenges, particularly related to inadequate waste management and sanitation infrastructure. The lack of established public services in most populated areas and the loss of private sector waste collection services in rural areas of Kazakhstan have made significant contribution to environmental degradation. The situation is aggravated by the appearance of spontaneous dumps of household and industrial waste, as well as livestock farms near water bodies. This practice not only pollutes the environment but also poses a significant risk to water quality and public health [11]. Insufficient attention to wastewater disposal and quality wastewater treatment in rural areas of Kazakhstan is explained by the relatively high costs of constructing rural sewerage systems and treatment facilities [12]. This financial barrier hinders the development of basic infrastructure, thereby jeopardizing water quality and the overall well-being of these rural communities.
Misalignment between perceived and actual water quality can lead to health risks. For example, if water appears clean but contains harmful microorganisms, it poses a threat to human health. Conversely, water that is safe but perceived to be of poor quality may lead people to use alternative, possibly unsafe sources. Public trust in water management authorities depends on the ability of such authorities to maintain high physical water quality and address public concerns effectively. Transparency in reporting water quality and addressing public concerns can enhance trust. Misperceptions about water quality can influence public support for environmental initiatives and policies. Accurate perceptions help foster responsible water use and conservation practices. Perceived poor water quality can impact tourism, property values, and economic activities in regions dependent on water resources. Ensuring high water quality and addressing perceptions can promote economic stability and community well-being. Moving forward, a balanced approach that integrates technical expertise with community engagement and education is essential for ensuring the long-term quality and availability of water.
Social science research typically uses the analysis of survey data, while research on chemical or biological monitoring of drinking water and surface waters uses the analysis of empirical or field data. This paper synthesizes a comprehensive method to show the relationship between the perceived quality and the basic chemical composition of drinking water from different sources.
The main research question is as follows: How does the water source type influence the quality of drinking water in rural areas and how does population perceive the water quality? The hypothesis is that the perceived water quality of residents is related to the physical quality of drinking water in rural areas depending on the sources of drinking water. By analyzing both the physical infrastructure and the residents’ experiences and perceptions, we seek to identify key areas for intervention and improvement. The findings contribute to the development of targeted strategies to enhance water and sanitation services in these regions, ultimately improving public health outcomes and quality of life. The purpose of this study is to assess the quality of drinking water in rural areas of the Pavlodar and Akmola regions, considering different types of water supply systems. This water quality study is especially relevant given the diversity of water supply sources in the study areas.

2. Materials and Methods
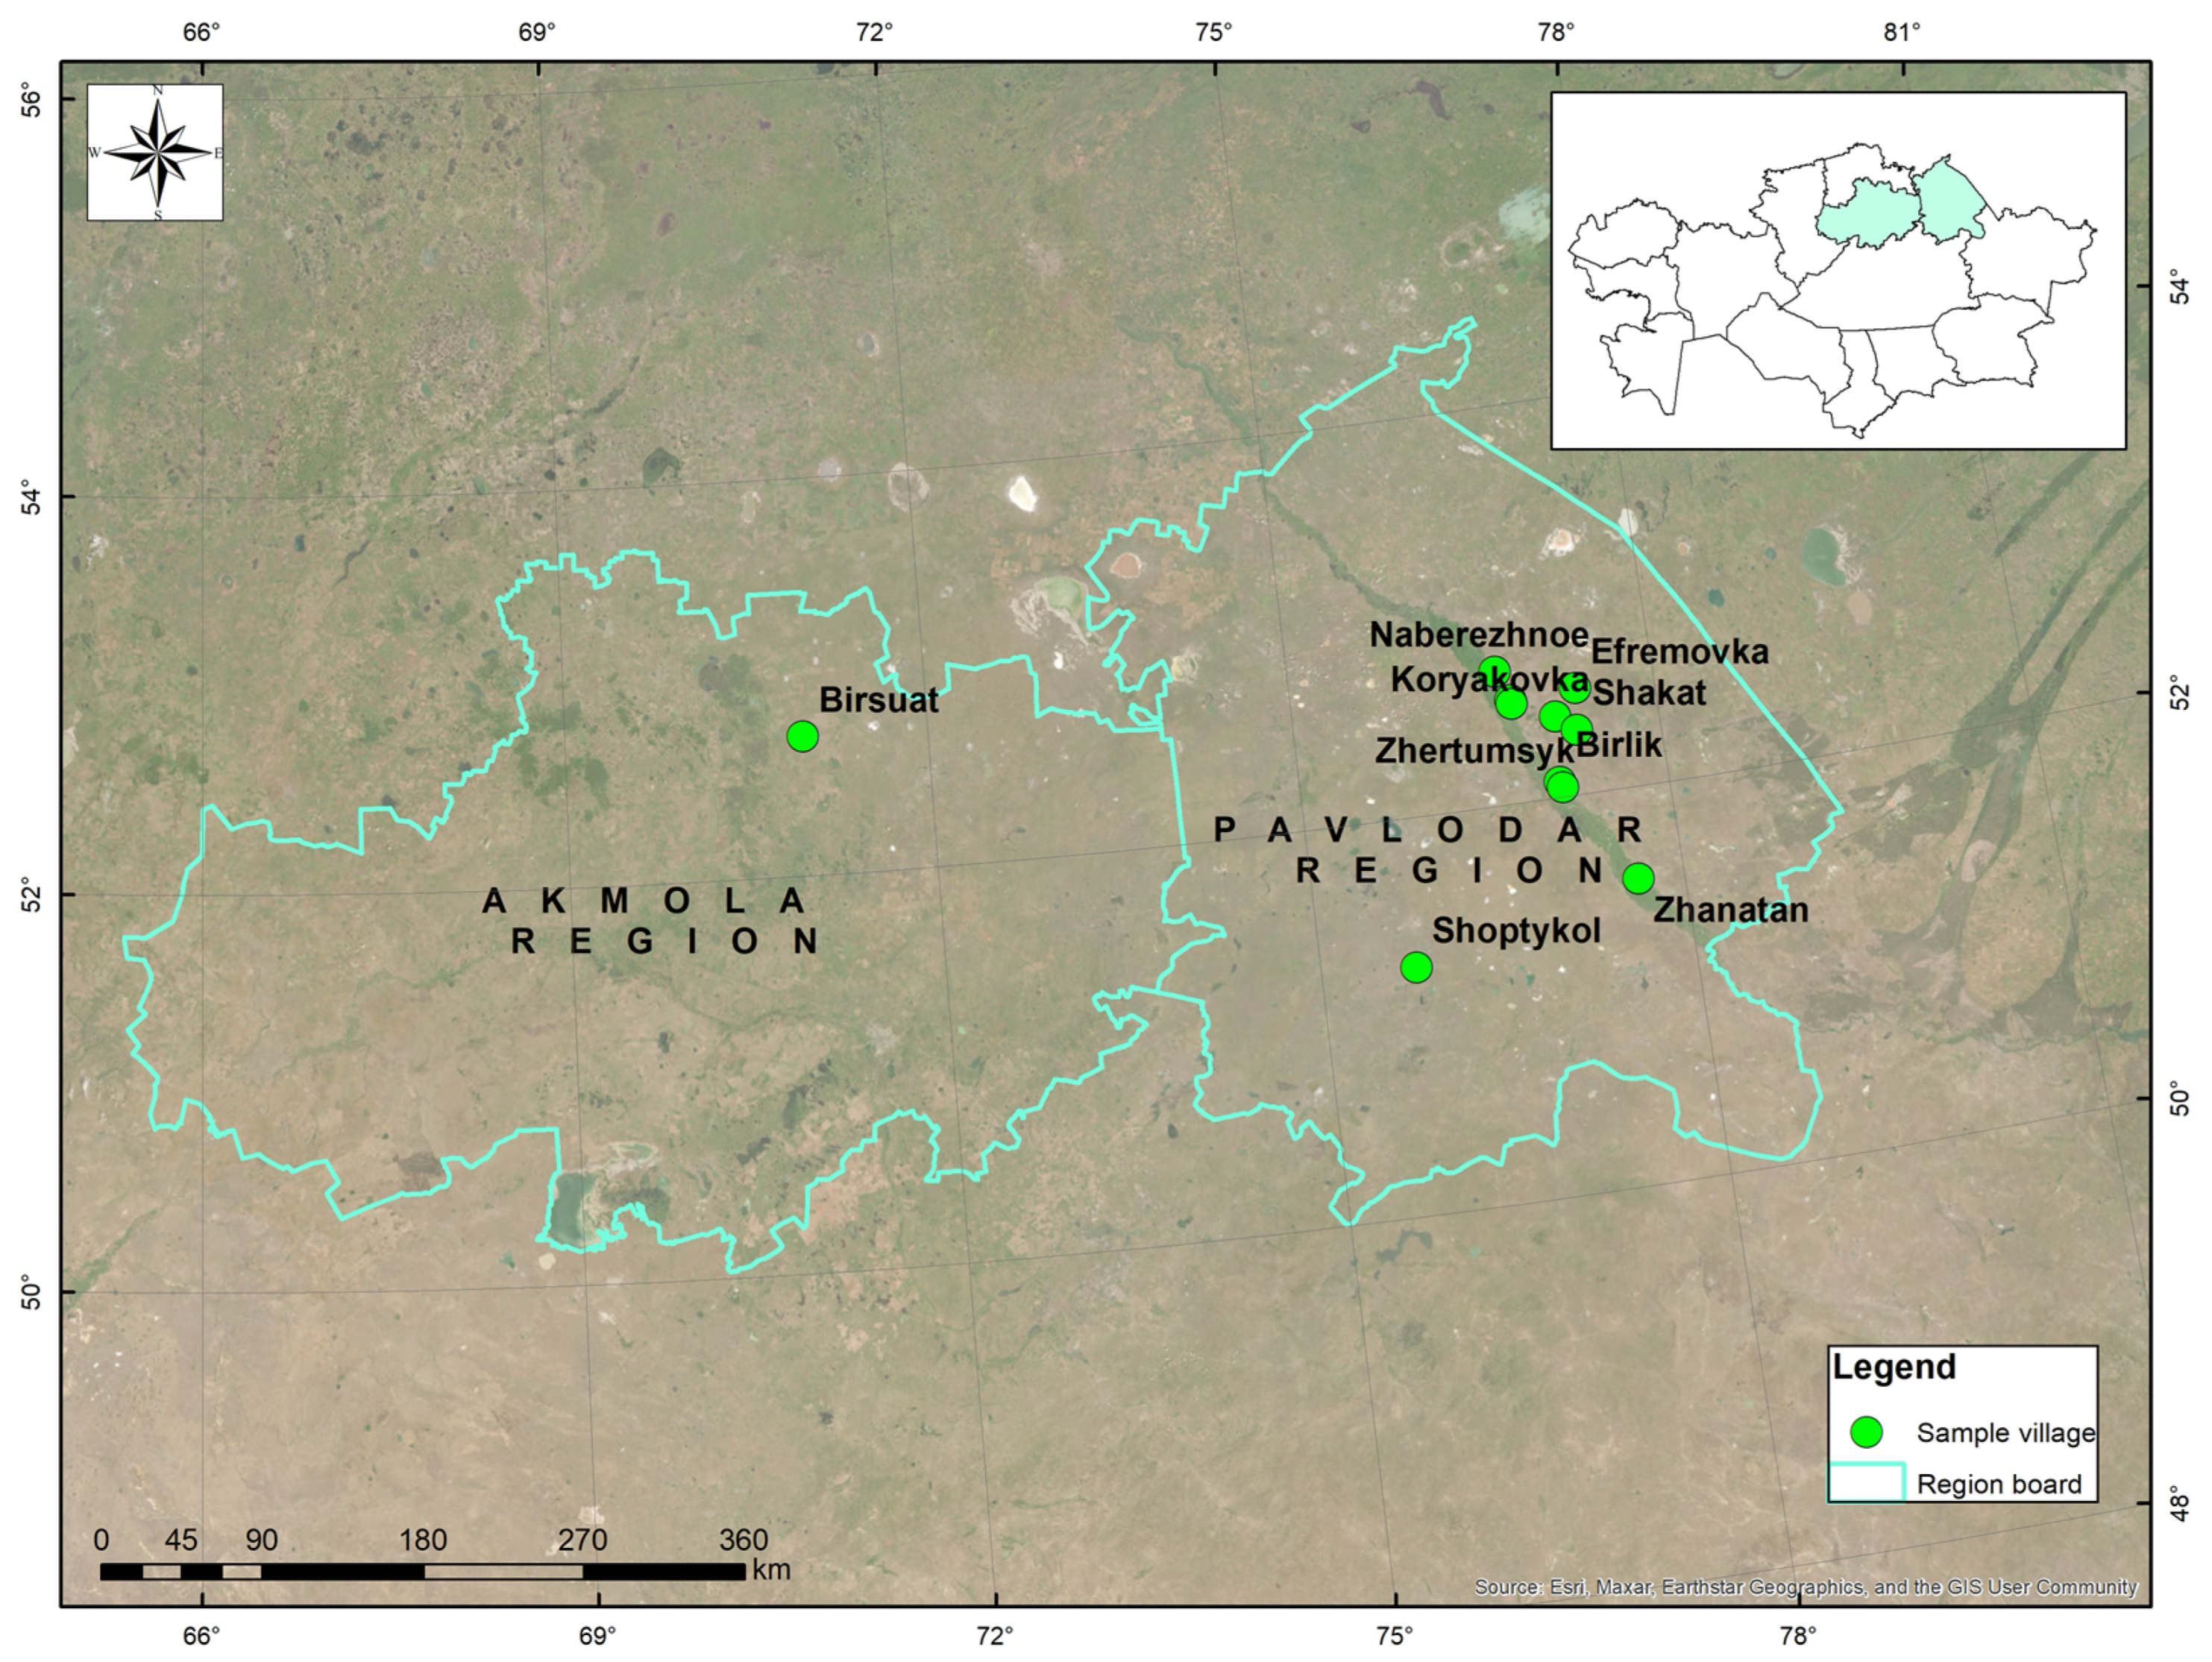
2.1. Research Area

This study focuses on assessing the quality of drinking water within rural settlements of the Pavlodar and Akmola regions in Kazakhstan, which had substantial populations of 220,722 and 342,264 individuals in 2024, respectively [13]. Geographically, the Pavlodar region is situated in the northeast and the Akmola region is in the north of the Republic of Kazakhstan. The Pavlodar region’s administrative structure comprises ten districts and multiple cities, settlements, rural districts, and villages, underscoring its significant spatial expanse and demographic diversity (Figure 1). The rural villages targeted in this study—Naberezhnoye, Chernoyarka, Gosplemstantsiya, Birlik, Efremovka, Zhertumsyk, Koryakovka, Shakat, Shoptykol, and Zhanatan in the Pavlodar region—represent a cross-section of the region’s rural demographic, each with unique challenges and contexts in terms of water access and quality. Village Birsuat is in the Akmola region (Figure 1). The village Birsuat was chosen for comparison in the sources of water supply from the other administrative region.
The population of our research area of eleven villages in the Pavlodar and Akmola regions was 7469 individuals, but villages differ with populations ranging from 187 in Soptykol to 3058 in Birsuat (Table 1). In the research area, population was surveyed by a questionnaire that has four different types of questions. In Pavlodar and Akmola rural areas, 485 respondents were surveyed from eleven villages. From the entire population of 9810 people, 485 households of 2115 people were randomly selected to sample every fourth household of the population as respondents. Geographically, they also vary, but most of both regions’ landscape is steppe. The main economic sphere is agro-industrial complex in these areas. The people mainly grow wheat, and our villages lie closer to the floodplain of the Irtysh River in Pavlodar area and the Ishim in the Akmola region.
The Pavlodar region is located in the northeast of the Republic of Kazakhstan. It borders the Omsk region in the north, the Novosibirsk region in the northeast, the Altai Territory of the Russian Federation in the east, the Abay and Karaganda regions in the south, Akmola and North Kazakhstan regions of the Republic of Kazakhstan in the west [15]. The territory of the Pavlodar region, like the territories of other regions of Northern Kazakhstan, belongs to the West Siberian climatic region of the temperate zone with a sharply continental climate. It is characterized by cold, long winters (5.5 months), hot and short summers (3 months) [15]. Most of the region is located within the southern West Siberian Plain, which is the largest plain on the globe. The relief of the southwestern part of the region is very interesting. Among the yellow–brown semi-desert steppe and small hills, with sparse vegetation, a small mountain forest oasis can be observed [16]. More than 140 rivers flow through the region. The only large river, Irtysh, flows from the south-east to the north-west for about 500 km and has several oxbow channels and islands. The rivers Tundyk, Aschisu, Shiderty, Olenty (Olenti) and others begin in the small hills, but do not reach Irtysh and end in drainless lakes. The Irtysh–Karaganda canal was built from Irtysh, on which several dams and reservoirs were built. There are many lakes in the region, mainly salty: Seletyteniz, Kyzylkak, Zhalauly, Shureksor, Karasor, Zhamantuz, Kalkaman, etc., on the left bank; Maraldy, Moildy, Bolshoi Azhbulat, etc., on the right bank. There are 1200 small lakes in the Pavlodar region. About a hundred of them are freshwater, and the rest are saltwater. Eleven groundwater deposits with operational reserves of 3.8 million cubic meters per day have been explored in the region. All are suitable for drinking and irrigation [17]. In the Irtysh valley, there are cereal–forb and floodplain meadows, flooded hayfields and ribbon forests. Around the lakes and in the valleys of drying up rivers there are grass–sedge meadows and reed thickets. In the southern part of the left bank of Irtysh, there are fescue–wormwood and wormwood–hodgepodge semi-deserts on light chestnut soils with patches of solonetzes and solonchaks used for pastures; on the sandy areas of the right bank there are ribbon pine forests [18]. The Pavlodar region is subject to high technogenic pollution, since the basic industries are mining, oil refining, chemical industry, ferrous and non-ferrous metallurgy, and energy. The main sources of pollution are thermal power plants that use the technology of burning high-ash Ekibastuz coal in the furnaces of boiler units. The bulk of emissions comes from industrial enterprises located in the cities of Ekibastuz (46%), Aksu (26.5%), and Pavlodar (25.5%), and all other districts of the region account for only about 2% of emissions [19].
The Karaganda region (Kazakh: Karaganda oblysy/Qarağandy oblysy) is a region in the central part of Kazakhstan. The climate is sharply continental and extremely dry. The region occupies the most elevated part of the Kazakh small hills––Saryarka. The climate is continental, winters are cold, and in some years severe, with snowstorms. Average temperatures in January are −16–−17 °C. Summer is hot, dry and windy. Average temperatures in July are 20–21 °C. The annual precipitation in the north of the region is 250–300 mm, in the south—150–210 mm, in low mountainous areas—300–400 mm. Rainfall mainly occurs from April to October [20].
The Nura River, which originates from the Balkhash–Irtysh watershed and flows into Lake Tengiz, and its tributaries, particularly the Sherubaynura, are of great economic importance. The Kulanotpes River, which also flows into Lake Tengiz, is also of economic importance. Along with this, the rivers of the Lake Karasor basin, as well as Ishim, Shiderty and other tributaries of Irtysh, are also important. The rivers of the Karaganda region are predominantly low water. There are 1910 lakes in the region, with a total area of 926 km2. The water level in most lakes rises sharply in the spring and falls in the summer, and because of this characteristic salt marshes—sors—form along the shores by autumn. The largest lake is Balkhash. In the steppe belt, wormwood, fescue, feather grass, yellow clover, bluegrass, biurgun, and thyme grow; on flat lands acacia, spirea, rose hips are found. Fescue, feather grass, and other grasses and ephemerals grow in the semi-desert zone of the region. Sagebrush predominates on rocky hillsides. Various shrubs grow in the inter-hill depressions; birch and alder grow in the Ulytau, Karagash, and Bektau-Ata mountains; wormwood and various saltworts grow in the desert of the southern part of the region [20]. The basic sectors of the economy include electric power, fuel, ferrous metallurgy, mechanical engineering, and the chemical industry.
Table 1. General information of the research Pavlodar and Akmola rural areas with geographical and administration features.
Name of VillagePopulation 1Geographical and Administrative Location
Gosplemstancya1308Part of the Michurinsky rural district
Chernoyarka653It is part of the Chernoyarsk rural district.
Naberezhnoe1552Administrative center of the Grigorievsky rural district.
Zhanatan352Part of the Zhambyl rural district
Zhertumsyk234It is part of the Zarinsky rural district.
Birlik426Located approximately 38 km north of the district center, the village of Bayanaul.
Koryakovka176Approximately 17 km northeast of Pavlodar on the shore of the Koryakovka Lake.
Shakat774Administrative center of the Shakatsky rural district.
Efremovka1090Administrative center of the Efremovsky rural district.
Shoptykol18760 km north of Bayanaul and 160 km northwest of Pavlodar.
Birsuat3058The village is located near the lake, in the central part of the region, at approximately 18 km (as the crow flies) southeast of the administrative center of the region—the city of Stepnyak.
1 Population of villages was taken from official site of the Committee on Statistics of the Bureau of National statistics Agency for Strategic planning and reforms of the Republic of Kazakhstan [21].
The samples were preserved according to standard protocols to maintain sample viability for accurate laboratory analysis. Samples were stored at a temperature of 4 °C to safeguard against degradation before analysis [22]. In field study, water samples from each village from five houses around the perimeter of the village were collected. Water samples were collected from a total of 55 households from eleven villages; sampling was repeated 3 times. A survey of residents and water samples was taken during the months of July–August 2021. The study’s analytical phase incorporated a variety of standard protocols to evaluate a range of physical and chemical parameters of the water samples. The utilization of a 2100P moving turbidimeter for on-site turbidity measurements and a moving multimeter for determining pH and total dissolved solids exemplifies the application of precise and reliable instruments in field conditions. Further laboratory analysis included the measurement of anions using a photo colorimeter among other physicochemical parameters, adhering to standardized methods to ensure consistency and accuracy in the results obtained.

2.2. Chemical Analysis of Drinking Water Samples

The methodological approach combining rigorous field sampling with detailed laboratory analysis offers a robust framework for assessing drinking water quality in the rural Pavlodar and Akmola regions. Water samples were analyzed in the chemical laboratory of L.N. Gumilyov Eurasian National University and in the Laboratory “Azimut” Karaganda with analytical methods of determination. The main chemical substances observed in this drinking water were cations (natrium and kalium, magnesium, iron, calcium) and anions (carbonates, bicarbonates, chlorides, sulfates, and nitrates), general hardness, mineralization, pH, smell, color, and turbidity. A concentration of manganese (mg/dm3) was detected as a soil pollutant in this area [23]. The comparative analysis of the average values of these physical and chemical parameters against the Sanitary Norms of the Republic of Kazakhstan (SN of RK) drinking water standards provided a comprehensive evaluation of water quality (Table 2). Additionally, the investigation of correlations between the tested parameters provided deeper insights into the water quality dynamics and potential health implications for the local population.
The quality of drinking water is one of the most important aspects of ensuring public health. Various countries have standards that determine the safety of water for consumption. These standards are based on scientific research and recommendations from international organizations such as the World Health Organization (WHO). Drinking water quality analysis includes a comprehensive study of microbiological, chemical, and physical characteristics. These parameters allow us to assess the safety of water for human consumption and compliance with current regulations. Chemical indicators characterize the chemical composition of water. These indicators include water pH, hardness and alkalinity, mineralization (dry residue), anionic and cationic composition (inorganic substances), and content of organic substances. In rural areas, water standards are not always regulated since the main source is decentralized water supplies. Therefore, the main chemical indicators were chosen for research.

2.3. WQI Index Calculation

For the total assessment of water quality, the WQI was calculated using the expression given in Equation [24].
W Q I = q n × W n / W n ,
where qn = quality rating of nth water quality parameter, Wn = unit weight of the nth water quality parameter [24].
q n = [ ( V n V i d ) / ( S n V i d ) ] 100 ,
where Vn= estimated value of the nth water quality parameter at a given sample location.
Vid= ideal value for the nth parameter in pure water (Vid for pH = 7 and 0 for all other parameters); Sn = standard permissible value of the nth water quality parameter [24].
W n = k / S n ,
where Sn = standard permissible value of the nth water quality parameter; k = constant of proportionality calculated using the expression given in Equation (4) [24].
k = [ 1 / ( 1 / S n = 1,2 , . . . n ) ]
WQI and corresponding water quality status by Horton has five types and they are described in the Table 3.

2.4. Statistical Methods

All results are presented as means. Statistical analysis was conducted using analysis of variance (one-way ANOVA). Significance test of the probability level was carried out on all data. Differences were considered significant at p < 0.05. Since the data had a normal distribution (Kolmogorov–Smirnov test), one-way analysis of variance (ANOVA), with Tukey’s post hoc test was used to identify significant differences (p < 0.05) between the different sources and chemical parameters and between those with or without the presence of CAF. Statistical analysis of questionnaire data for categorical variables involved determining frequency distributions and proportions in a contingency table. A chi-square test of independence was conducted to examine the relationship between categorical variables from the questionnaire and between categorical questionnaire variables and numerical variables of chemicals. Spearman’s Rank correlation matrix was computed to assess the relationship between variables. The R studio and Python3 software were used for statistical and visualization processes of all the experimental data. For statistical analysis of numerical data of chemical substances of drinking water, the next packages of R studio software (RStudio-2024-04.2-764) were used: “ggplot2”, “dplyr”, “tidyr”, “tidyverse”, “Matrix”, “carData”, “emmeans”, “mvtnorm”, “survival”, “TH. data”. For analysis of categorical data of the questionnaire and the correlation matrix between categorical and numerical data, the contingency table of categorical data Python software packages (matplotlib.pyplot as plt, scipy.stats as stats, seaborn as sns, networkx as nx, numpy as np, ternary, matplotlib.gridspec, GridSpec, matplotlib.lines, Line2D, matplotlib.patches, Polygon) were used.

3. Results

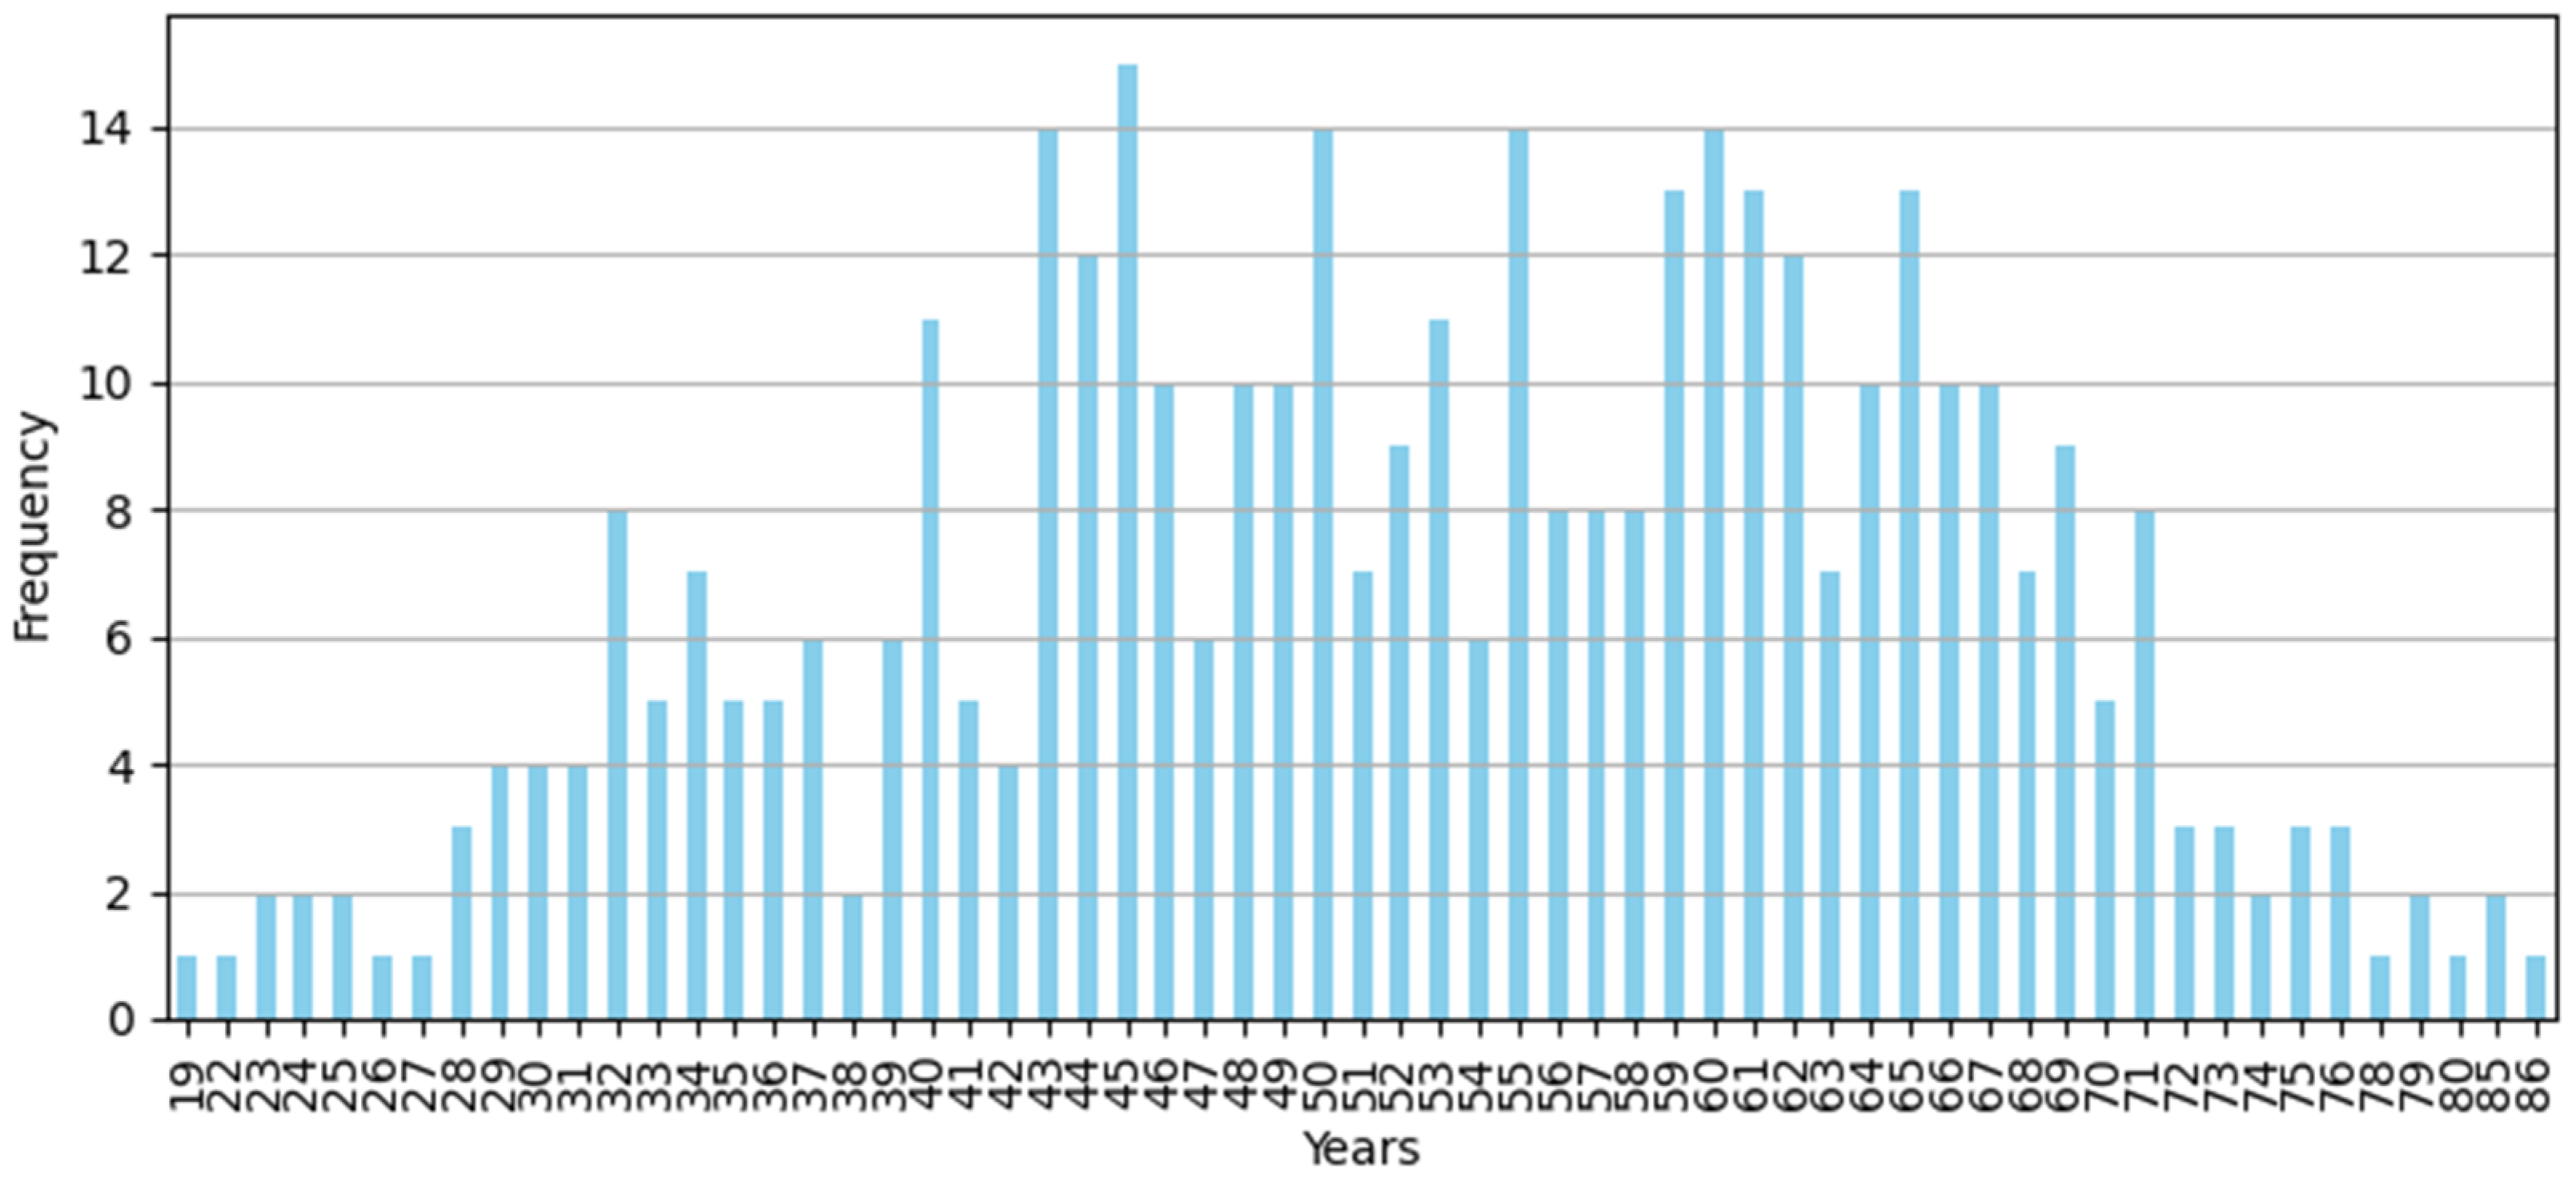
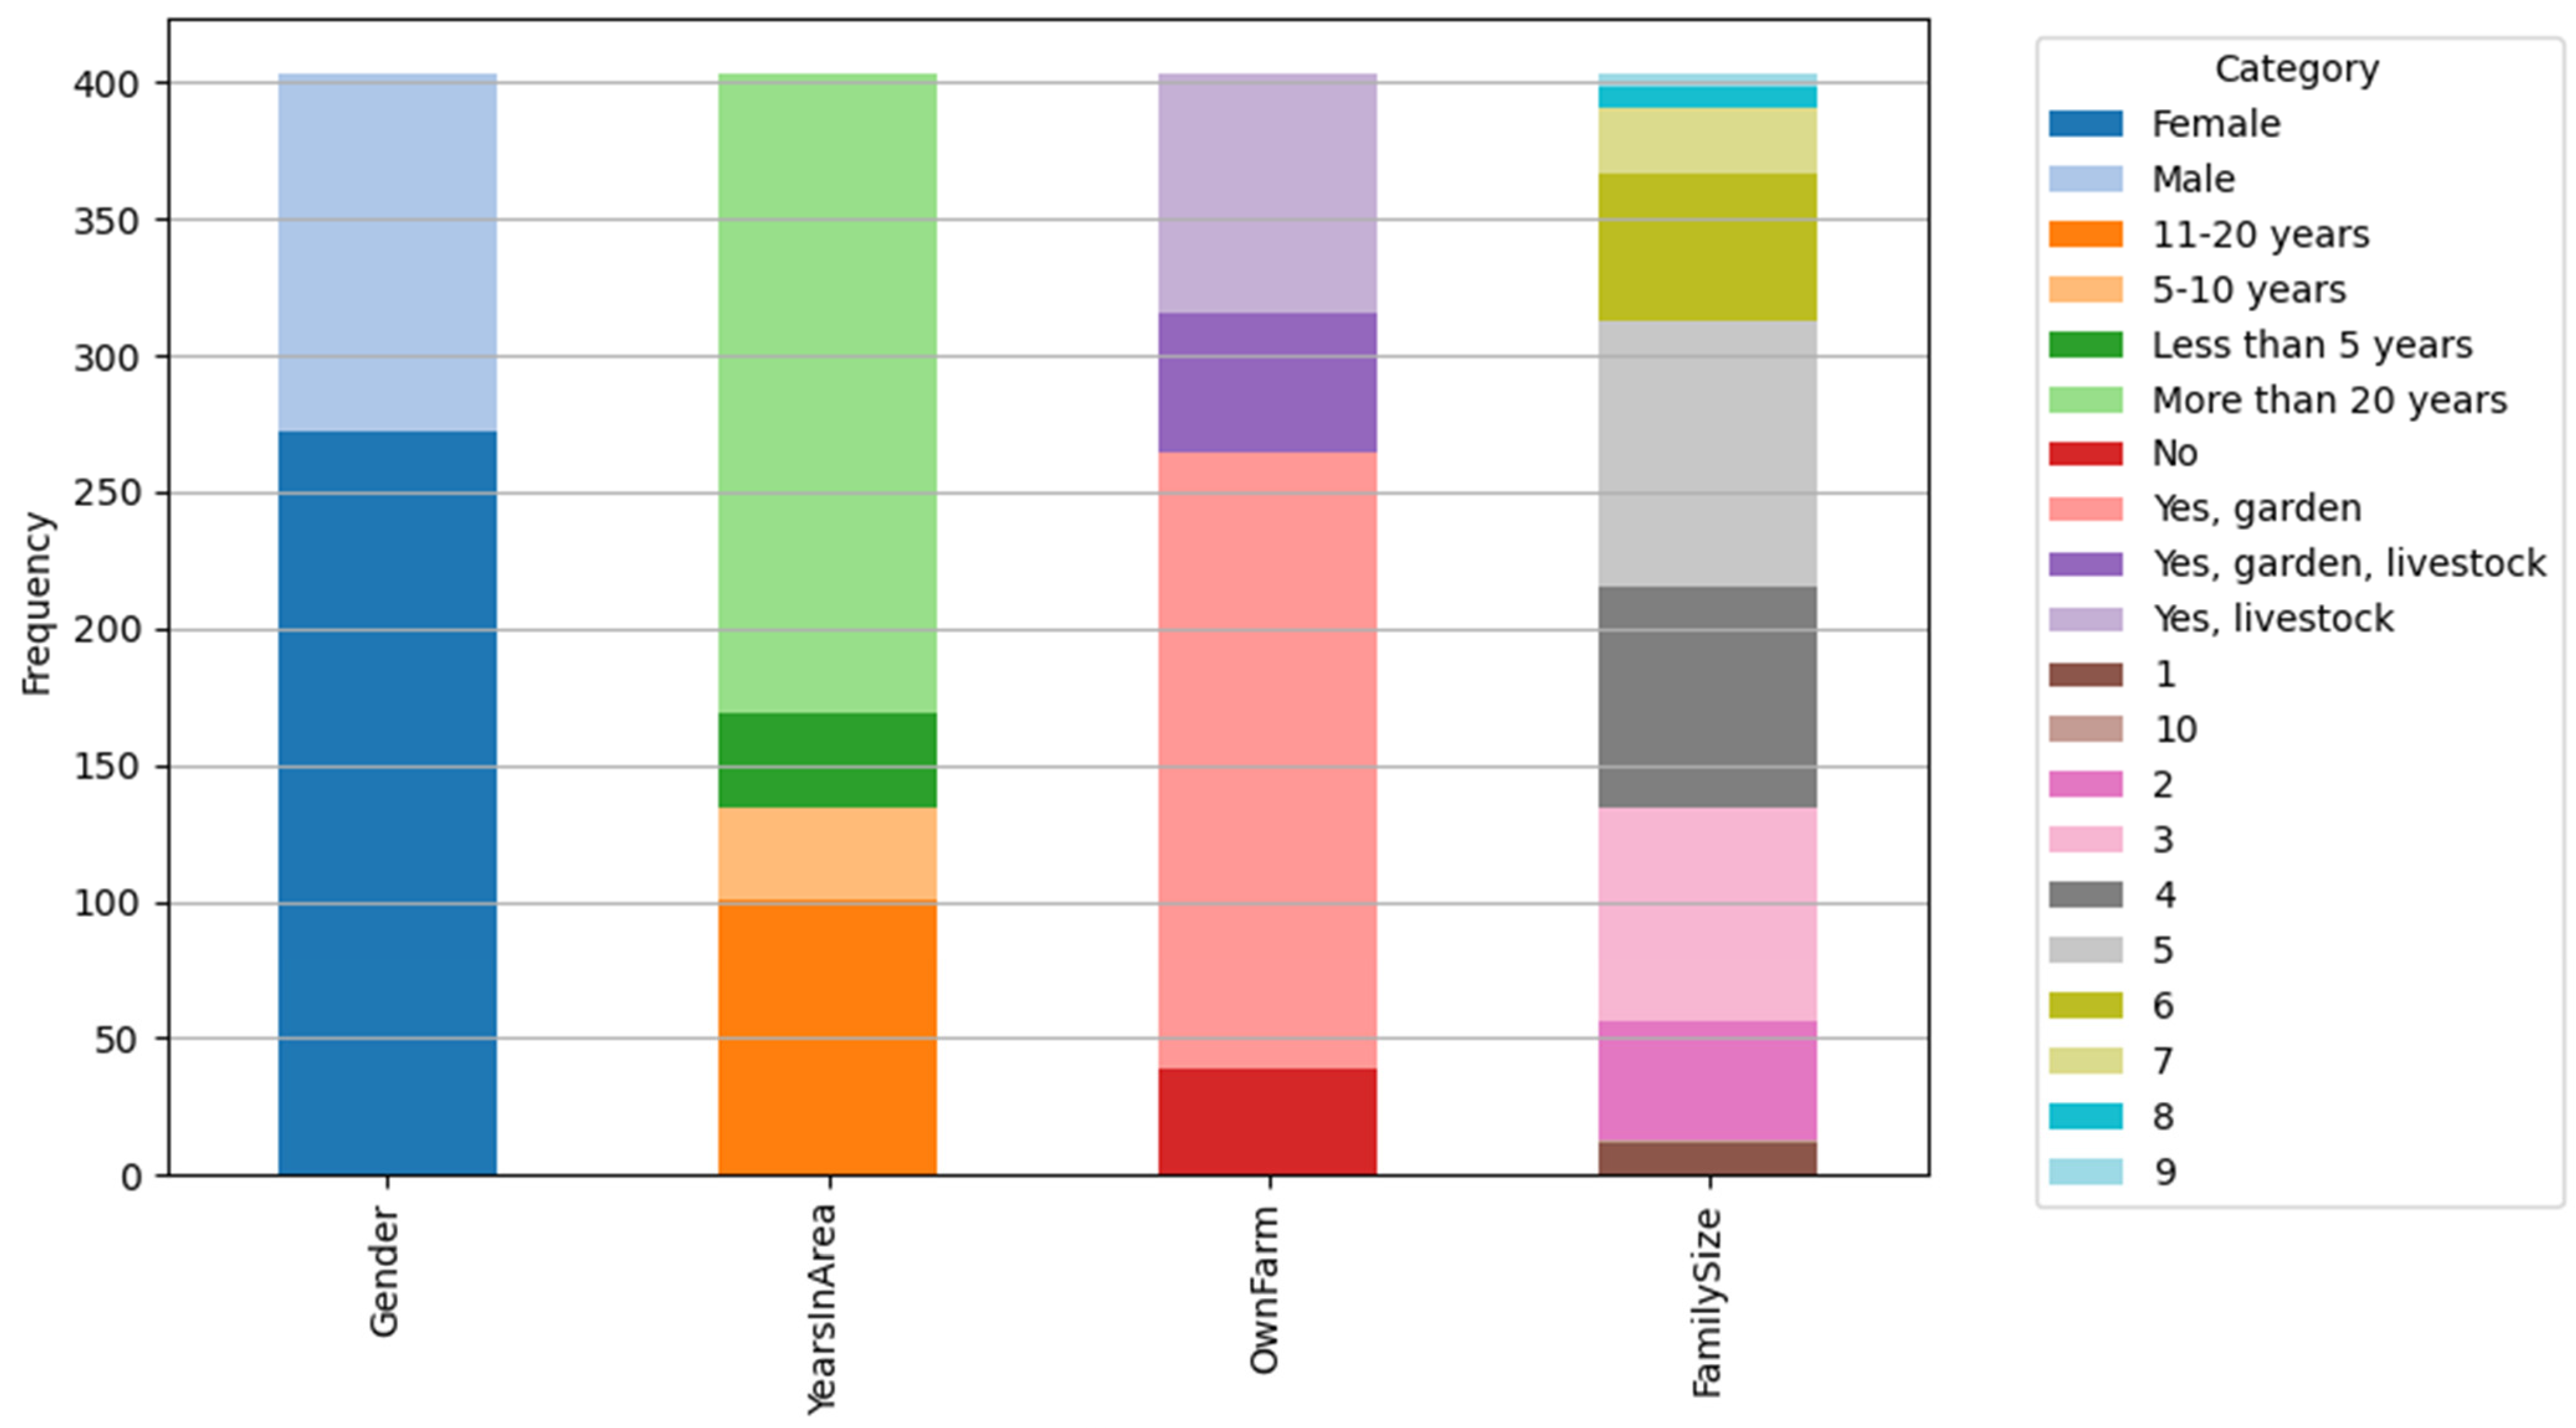
3.1. Statistical Data of Residents of Pavlodar and Akmola Regions

The distribution of respondents’ ages across the villages varied. In the Pavlodar region, surveyed respondents’ age varied from 19 to 86, and in Birsuat village of the Akmola region it ranged from 22 to 85 (Figure 2 and Figure 3). In both regions, the main age group of respondents was 40 to 67 years old. In terms of gender, in Akmola’s Birsuat village, women were slightly more predominant than men (47.5% men and 52.5% women) (Figure 3b). In the Pavlodar region, the gender composition included significantly more women (67.5%) than men (32.5%) (Figure 4). This difference of the gender composition is explained by the fact that in recent decades, a lot of young people in large cities migrate from rural areas. This is mainly due to a lack workplaces and opportunities to study at universities. The old generation usually remains in the village, and the gender component of the older generation is shifted towards women due to the longer life expectancy of women in Kazakhstan than men [25].
More than half of the respondents in the Pavlodar region have lived in the area for more than 20 years, one-fourth have lived 11–20 years, 8% have lived from 5 to 10 years, and 8% up to 5 years. Of the respondents, 62% have garden farms, while 8% do not have farms, and 30% have livestock farms. The distribution of the number of people in a family showed that most families have 5 family members; the numbers of people with 3–4 and 6 members are also significant, while 7–10 members in a family are rare (Figure 4).
For domestic use in the Pavlodar area, almost half of the respondents use a central water supply system (48%), while 36% use both private wells without (18%) and with (18%) water supply to the house, 7% use private boreholes without water supply to the house, 9% use other types of water sources (Figure 5). The distribution of drinking water supply sources across the Pavlodar villages varied, while in Birsuat village of the Akmola region there was only one source—a well (Figure 5 and Figure 6). 20% use private wells without water supply to the house, 7% use private boreholes without water supply to the house, 13% use public boreholes, and 7.5% use river water.
A minority of respondents (11.5%) use bottled water from the stores, public wells, free trucked-in water, public water intake pump on the street, public boreholes and wells, and other sources (Figure 5).
More than half of respondents from the Pavlodar area did not complain about water quality (52%). However, 16.15% of respondents complained about sediments, 14.97% about hard water, 7.74% about bad taste, 7.14% about muddy water, 1.2% about salty water, and 0.8% about bad smell of drinking water (Figure 5). In Birsuat village of the Akmola area, half of residents complained about salty water, 29% about flat slate, 12% about bad smell, and 9% about bad taste (Figure 6).
Respondents from Pavlodar villages preferred to store water in different containers, although half of the respondents did not indicate water storage. A total of 18.55% preferred to store water in buckets, 18.07% in metallic containers, 12.55% in plastic containers, 1.15% in closed tanks, and 0.96% in open tanks. In Birsuat village, more than half of respondents (62.2%) preferred to store water in buckets, and 37.8% stored water in plastic containers (Figure 5 and Figure 6). In the Pavlodar region, respondents’ satisfaction with drinking water was distributed as follows: fully satisfied—34.24%, rather satisfied—23.07%, rather unsatisfied—24.31%, fully unsatisfied—11.16%, and difficult to answer—7.22%. In Birsuat village, most respondents (91.47%) were rather satisfied, while the remaining 8.53% were completely satisfied with drinking water quality (Figure 5 and Figure 6). Half of the respondents in the Pavlodar region used purification methods (51%) and half did not (49%). Of those who used purification methods, 48.39% boiled their water, 30.63% did not use any purification method, 8.04% filtered water, 2.8% passed water through gauze, and the remaining used various other methods. In Birsuat village, respondents indicated only boiling as a purification method (Figure 5 and Figure 6).
In Pavlodar villages, 73% of respondents had private toilet outside in the yard, 19.78% had toilets inside the house without access to central sewerage, and 7.22% had toilets inside the house with access to central sewerage (Figure 7). In Birsuat, all toilets were outdoor and their location was more than 50 m away from the source of drinking water. The location of toilets with respect to drinking water source in Pavlodar villages, according to respondents, was as follows: 25.06% was more than 50 m away, 36.22% was 31–50 m away, 25% was 11–30 m away, and 11.23% was inside the house. The construction materials of toilets were reported to be wood by 76.35% of respondents, brick by 1.48%, metal by 1.23%, flat slate by 2.29%, and other materials by 3.45%. Regarding toilet utilization types, 76.22% of respondents used backfilling of cesspools, 9.27% used mechanical cleaning with fecal pumps or sewerage machine, 0.74% used chemical cleaning, and 25.9% used other methods.
In Birsuat village of the Akmola region, respondents indicated that the frequency of wastewater collection ranges from two to seven times per year (Figure 6 and Figure 7). In Pavlodar villages, more than half of the respondents indicated various ingredients in the toilet waste paper: 28.54% indicated other materials and 0.49% reported plastics. The location of wastewater collectors was as follows: half of the respondents used a storage tank in the yard, less than 1% used a centralized storage tank or a shared storage tank with neighbors, 35% had no designated collection place, and 12.14% used the wastewater for other household needs, such as watering the garden or for pets (Figure 7).
In Pavlodar villages, 76.92% of respondents indicated that state representatives are responsible for both public pump and central water supply system, 22.59% indicated private companies, 82% believed the state is responsible for drinking water safety, 10.36% indicated private companies, and 7.23% believed household owners are responsible. Additionally, 99% of respondents indicated that household owners are responsible for the proper maintenance of toilets and wastewater utilization (Figure 8).

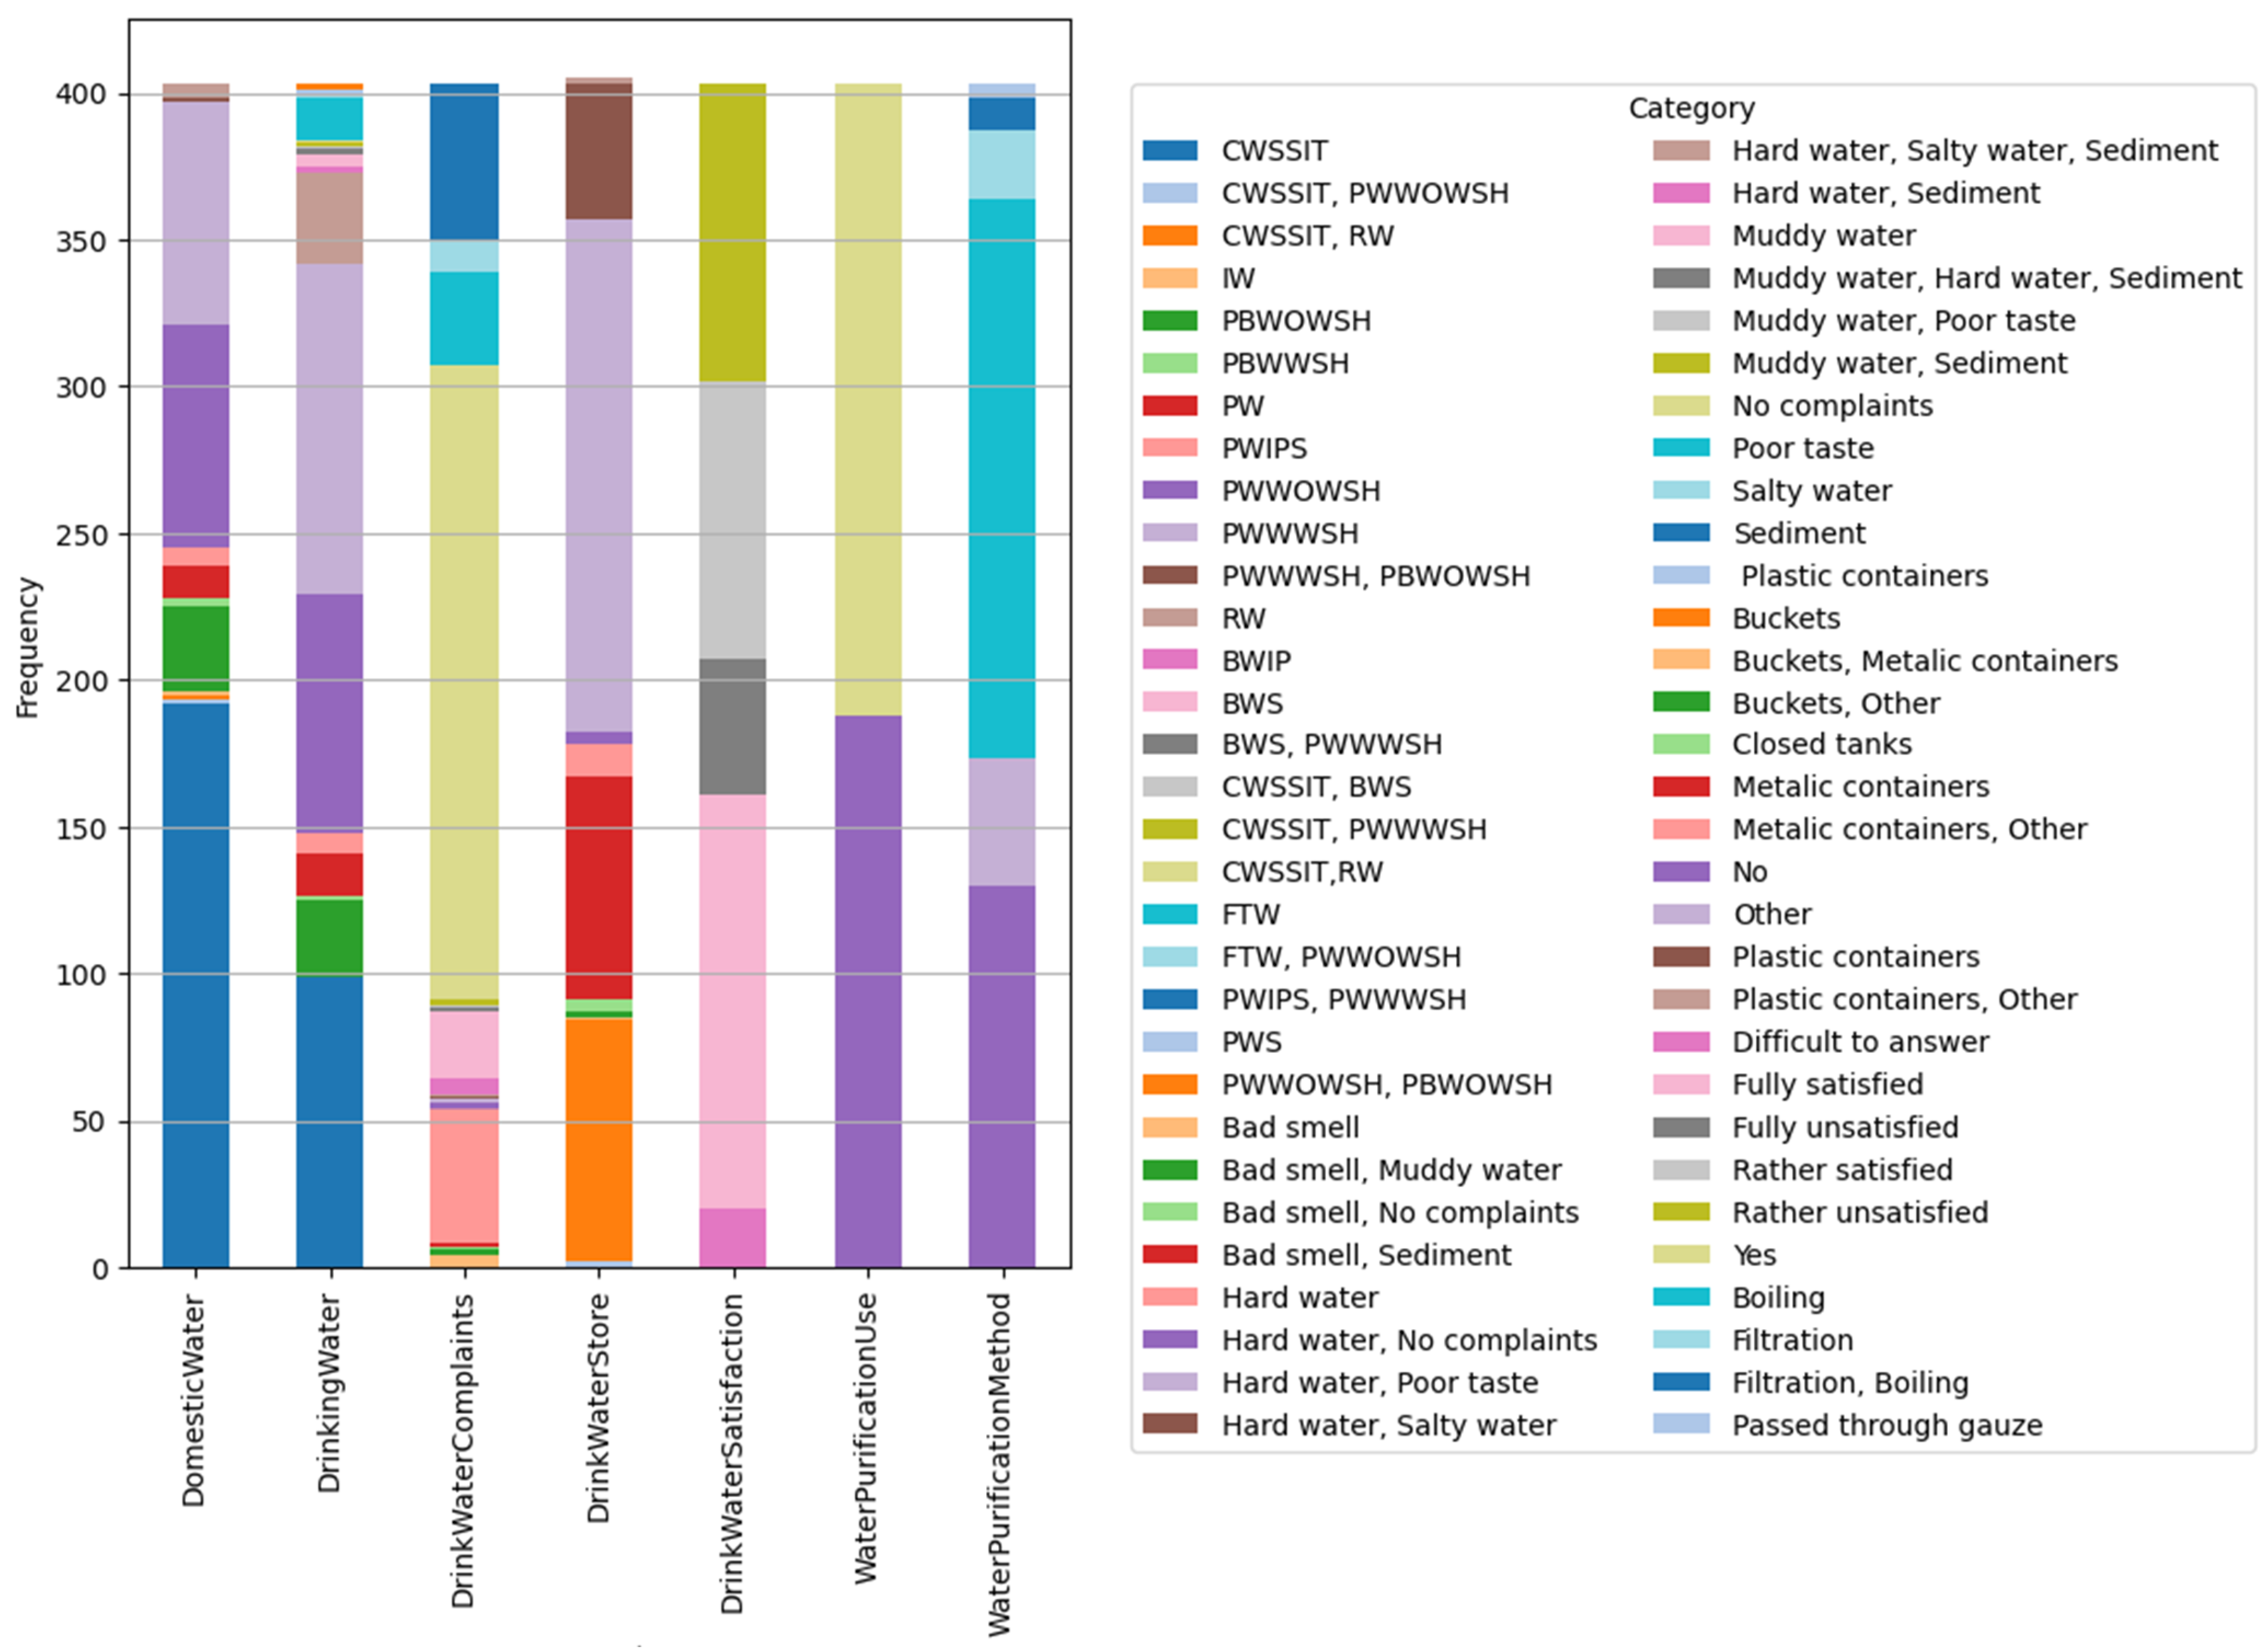
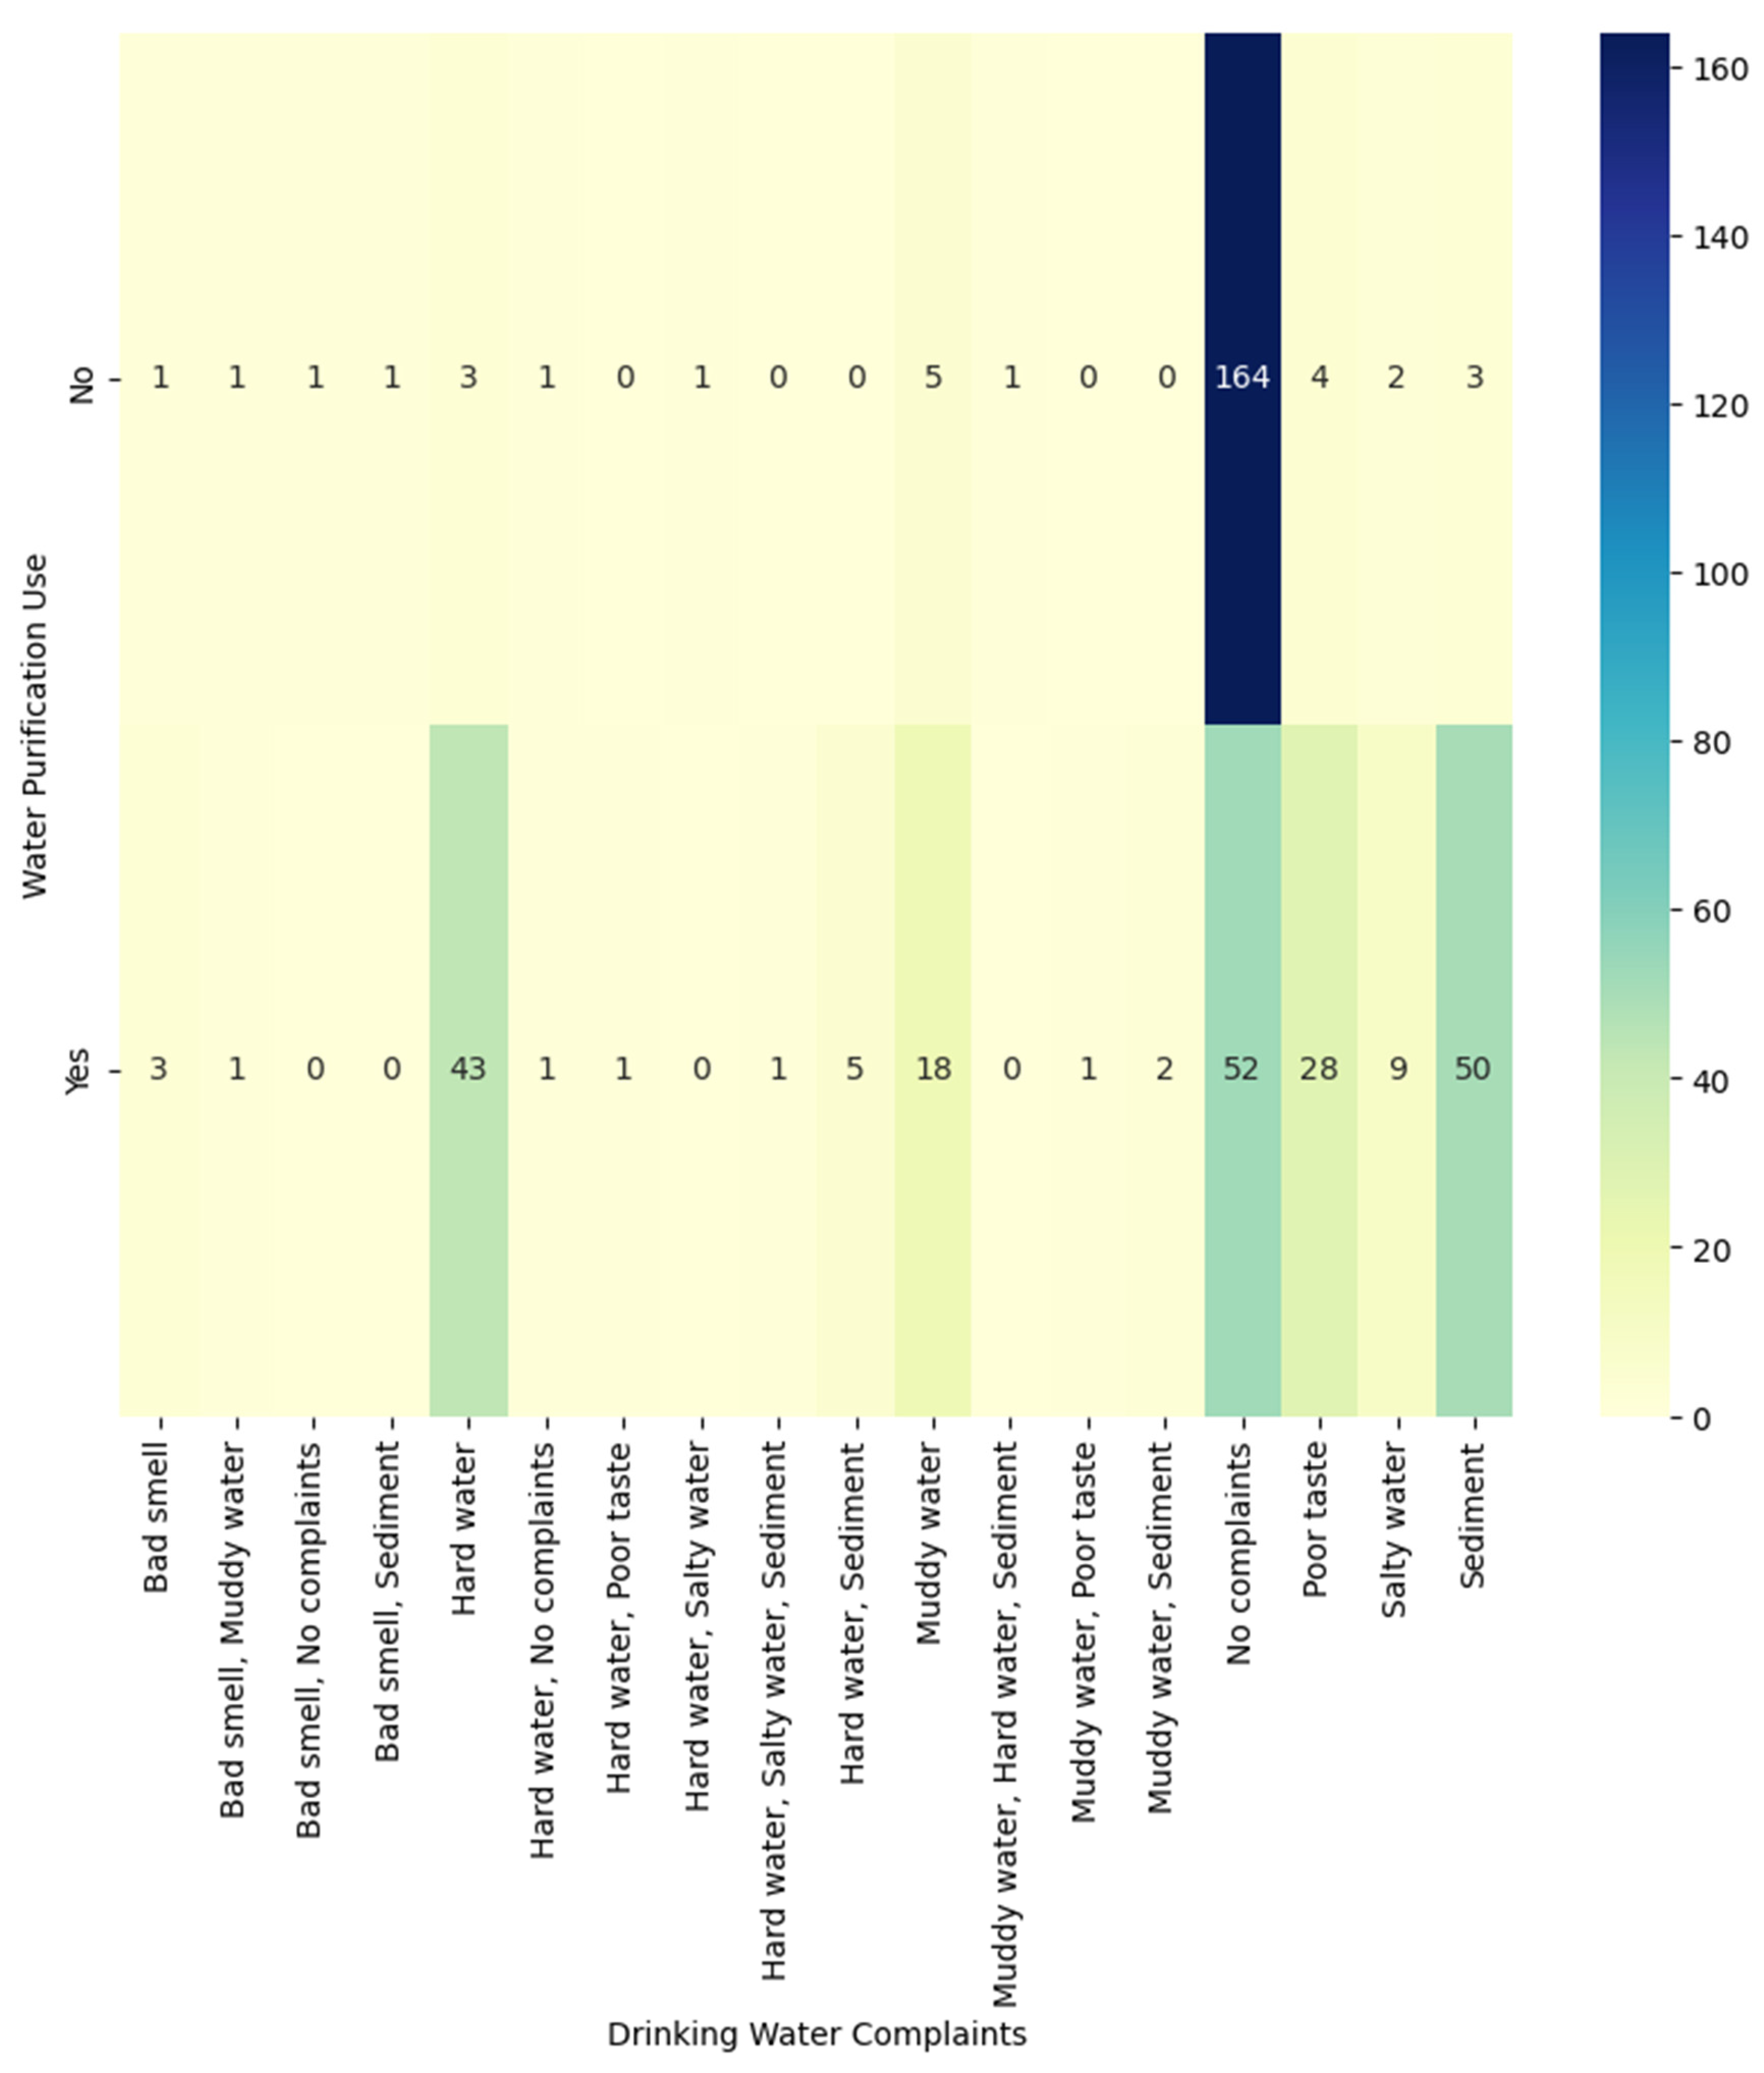
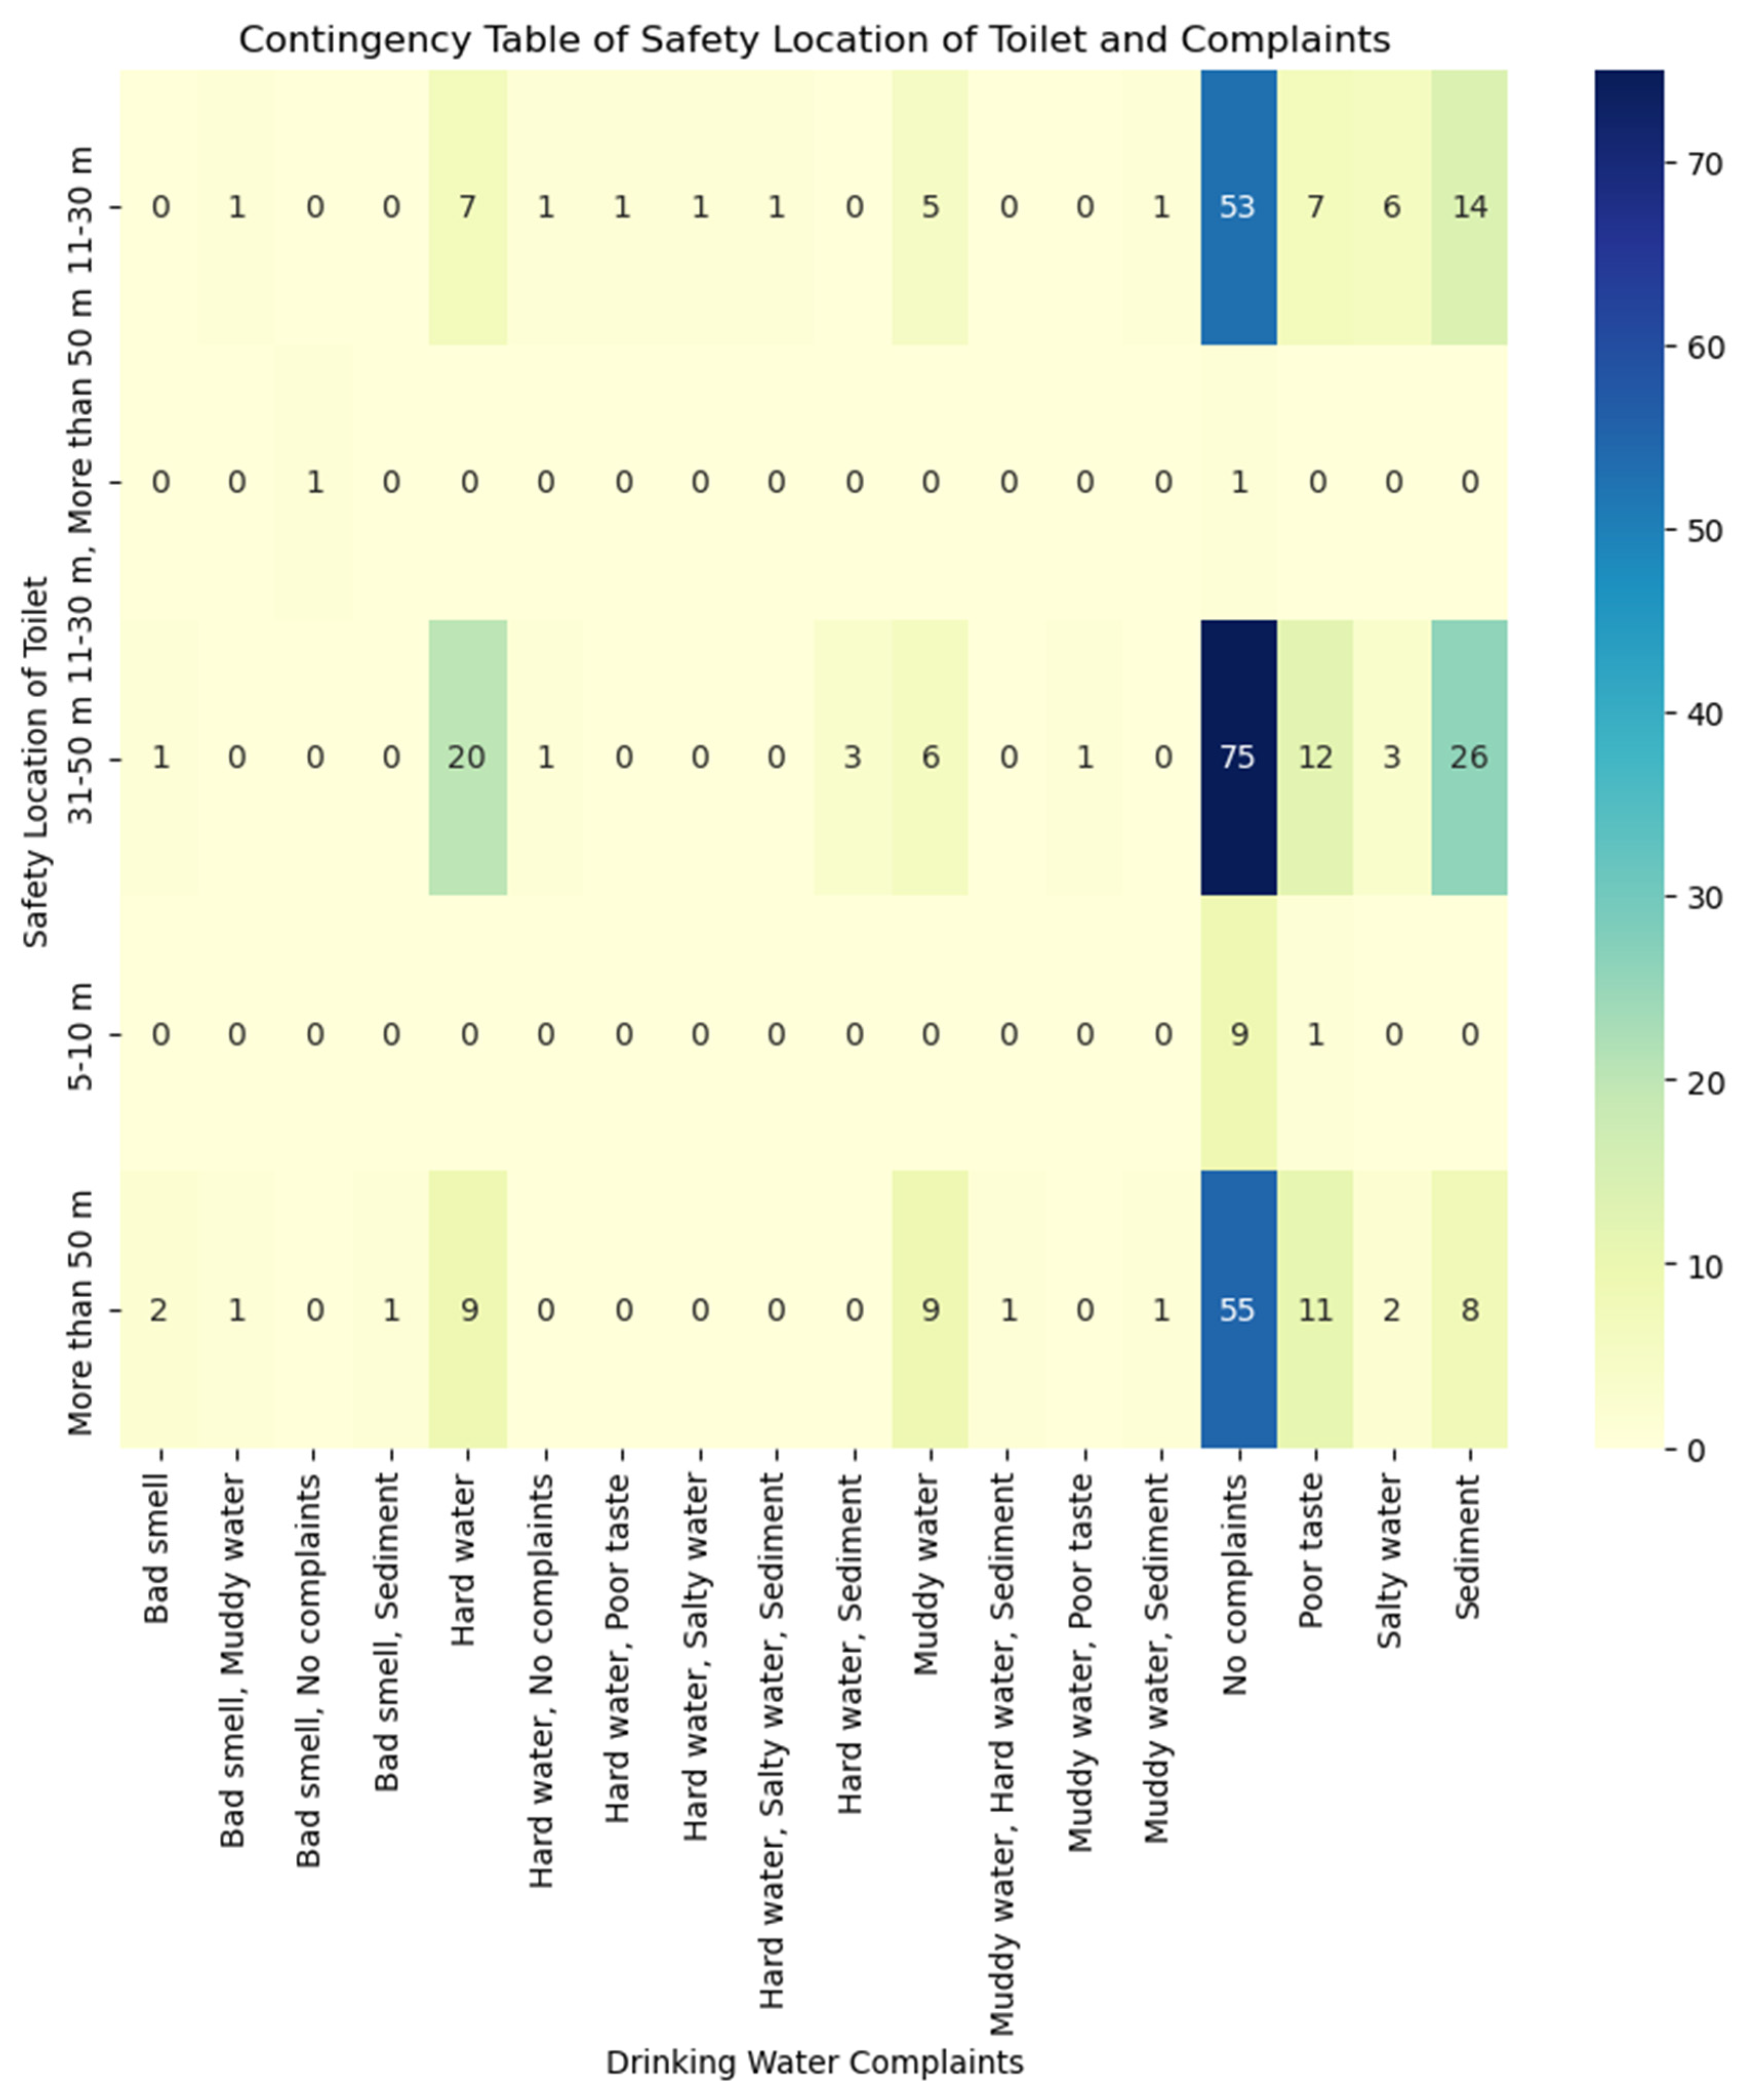
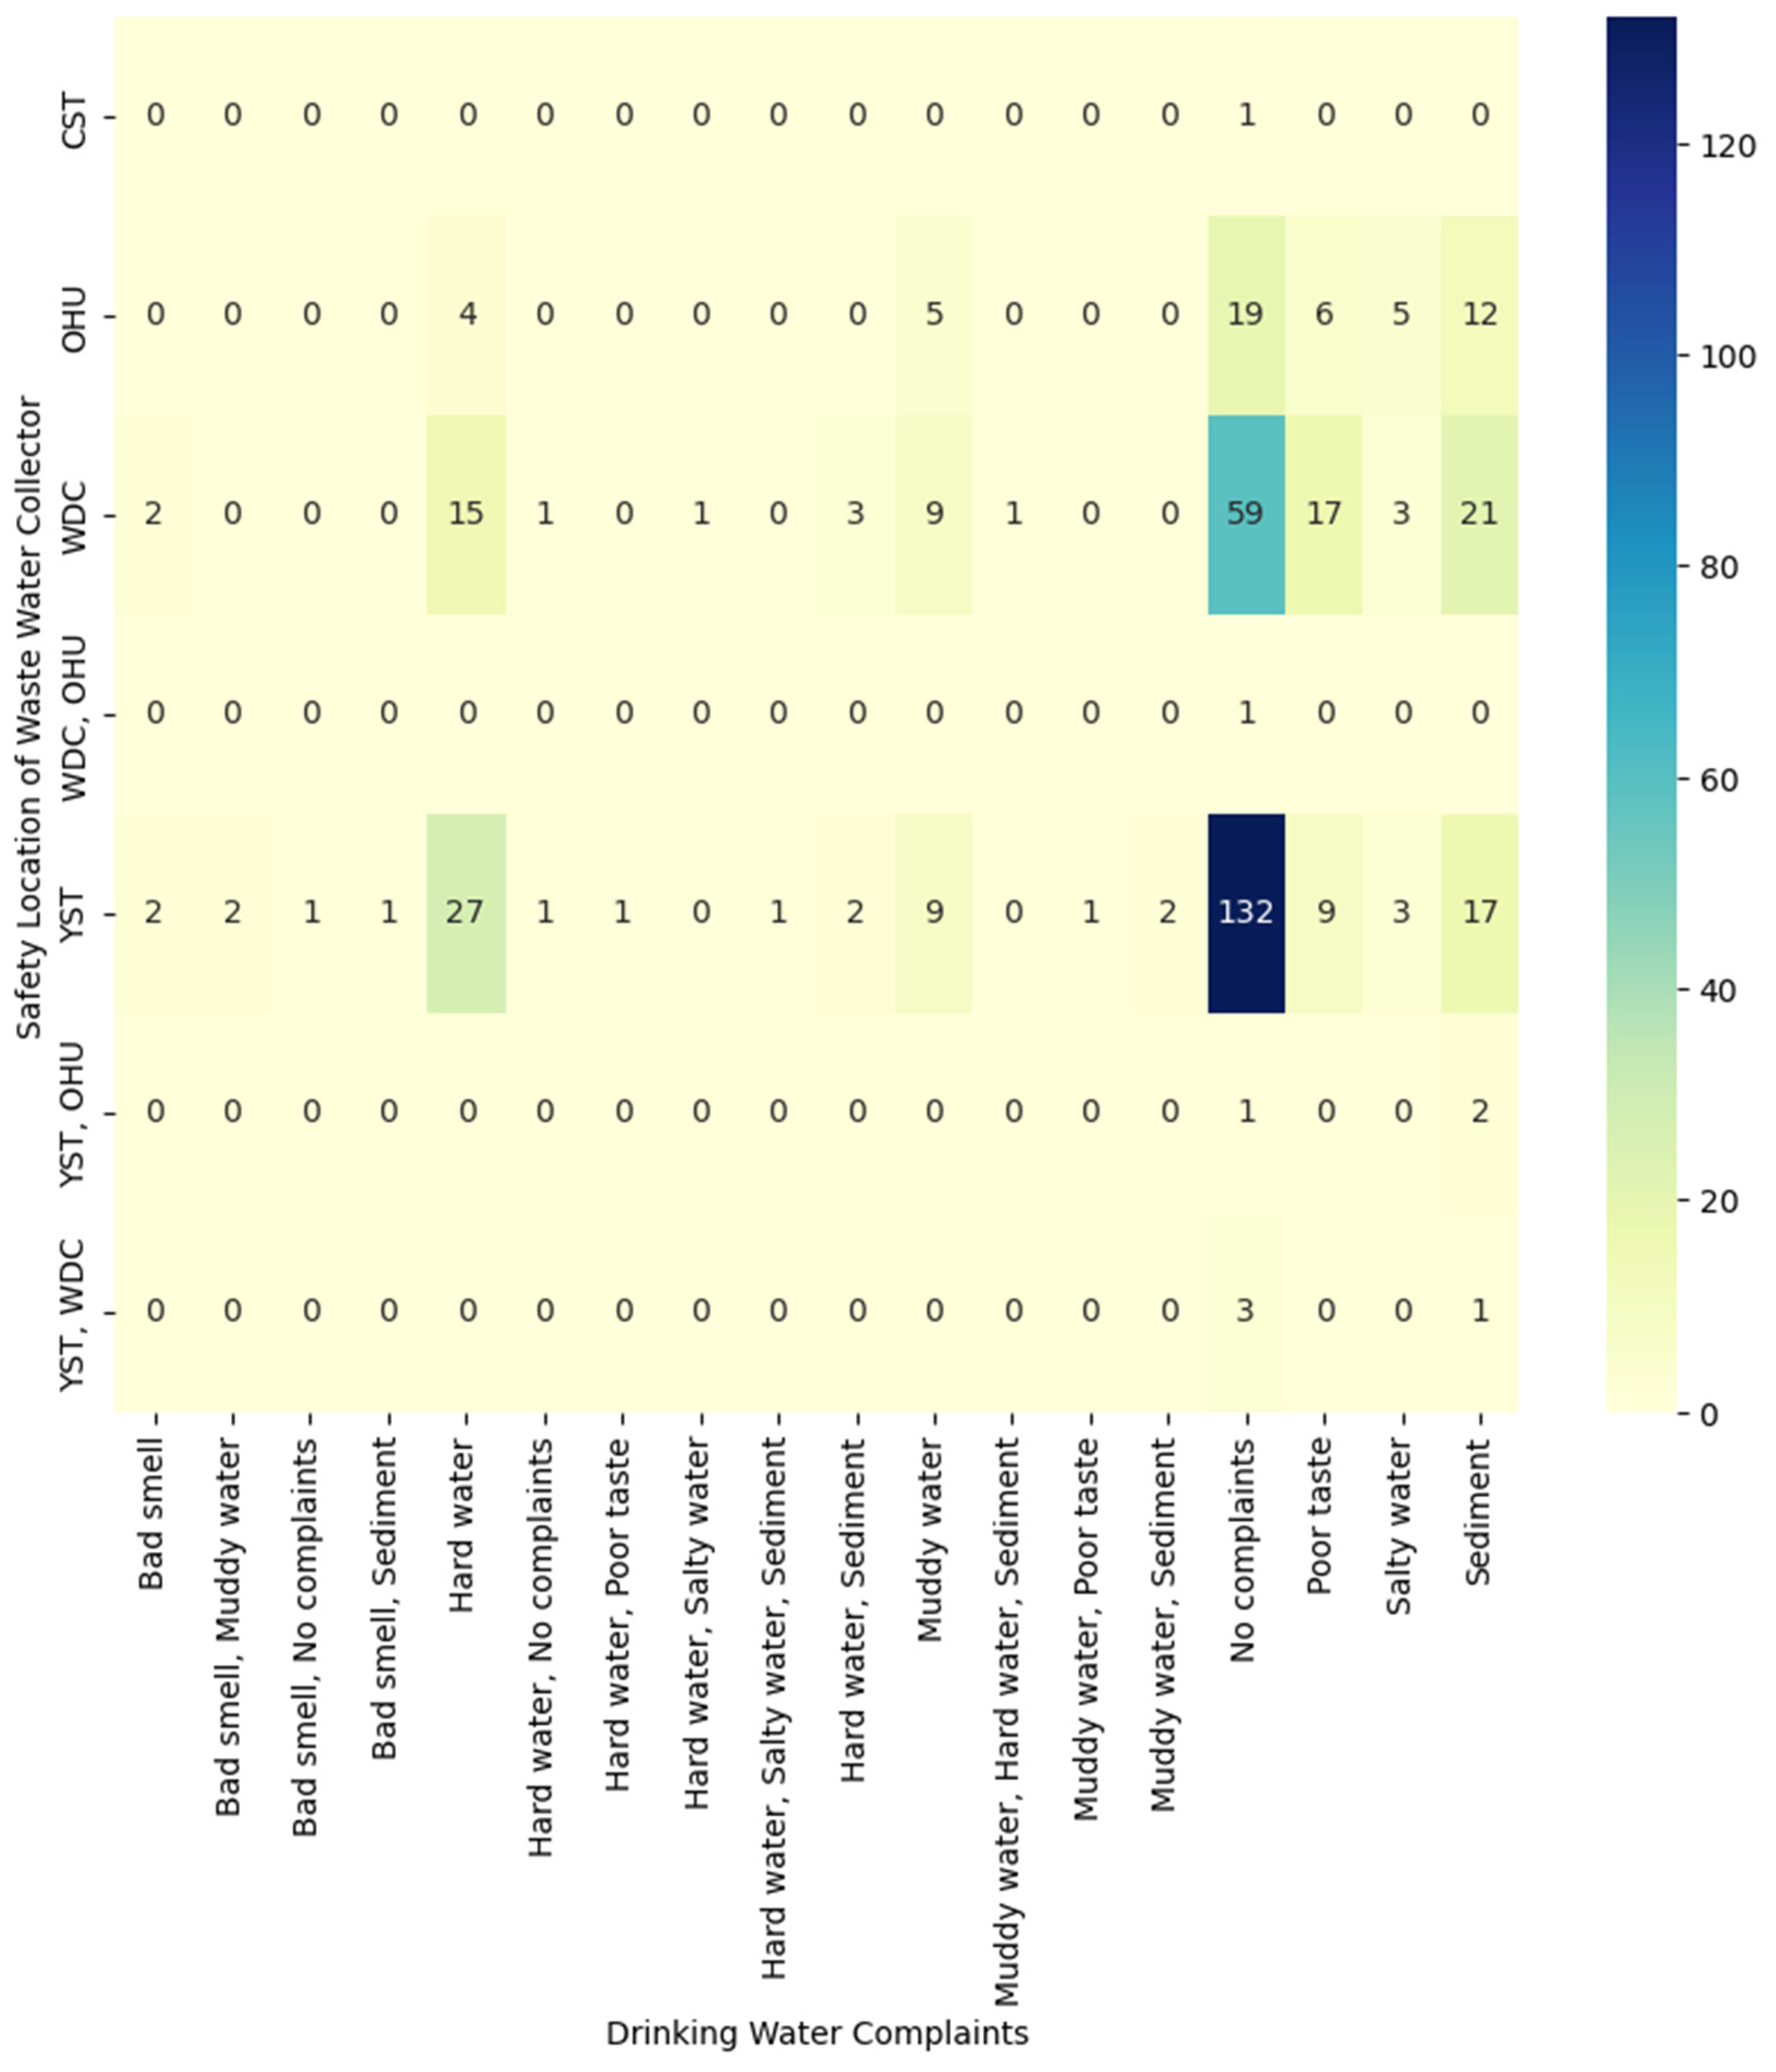
3.2. Perceiving Drinking Water Quality

Regarding satisfaction with drinking water, 52 respondents from Pavlodar villages are completely satisfied, 25 are rather satisfied, and 24 are rather unsatisfied with private wells water at private houses with water supply to the house. A total in 30 respondents are satisfied, 19 are satisfied, 21 are unsatisfied, and 12 are unsatisfied with private well water in private houses without water supply to the house. For the central water supply with an inside tap water, 28 respondents are completely satisfied, 25 are rather satisfied, 31 are rather unsatisfied, and 10 are completely unsatisfied (Figure 9).
Despite most respondents having no complaints about drinking water, there were some specific complaints. Respondents mentioned sediment in the water: 13 of central water supply system with inside tap, 12 in private wells at houses without and with water supply, 6 in private boreholes in houses without water supply, and 9 in river/lake water. Complaints about bad taste were indicated by 6–8 respondents in private wells without and with water supply, 11 in river source. A total of 22 respondents complained about hard water in the central water supply system with an inside tap, 8–7 in private wells in houses without and with water supply, 5 in public wells. In addition, muddy water was mentioned by 10 respondents regarding in river sources, by 7 in the central water supply system with an inside tap, and by 4 in private wells at houses without and with water supply (Figure 10).
A total of 67 respondents stated that water from the central water supply system with an inside tap was mostly purified, 38 and 41 stated that from private wells at houses without and with water supply was purified, and 29 stated that water from river source was also purified. In addition, 12 respondents indicated that water from private boreholes at houses without water supply to the house was also purified, and 9 respondents indicated that free trucked-in water was purified (Figure 11).
Regarding purification methods, 175 respondents used boiling, 23 used filtration, 11 used both boiling and filtration, and 5 passed water through gauze (Figure 12). Respondents who purify water complained about bad smell (3), muddy water (18), hard water (43), salty water (9), bad taste (28), and sediment (50) (Figure 13).
Complaints about sediment correlated with the distance of toilets to drinking water sources as follows: 26 respondents with 31–50 m, 14 with 11–30 m, 8 with more than 50 m, and 5 with inside toilets. Complaints about bad taste correlated with 12 respondents with 31–50 m, 11 with more than 50 m, 7 with 11–30 m. Hard water complaints correlated with a 31–50 m distance of toilets from drinking water source in 20 respondents, inside house toilets in 10 respondents, more than 50 m in 9 respondents, and with 11–30 m in 7 respondents. Complaints about salty water also were reported by nine respondents with a distance farther than 50 m, six with 31–50 m and five with 11–30 m from the toilet to the water source (Figure 14).
Complaints about sediment also correlated with the type of wastewater collectors: 21 respondents had no designated collection place, 17 had a storage tank in the yard, 12 used wastewater for other household needs. Hard water complaints correlated with a storage tank in the yard in 27 respondents, no designated collection place in 15 respondents, and wastewater used for other household needs in 4 respondents (Figure 15).
Bad taste complaints also correlated with no designated collection place (17 respondents), a storage tank in the yard (9 respondents), and use for other household needs (6 respondents). In general, the respondents’ answers did not show all types of collectors, indicating that there is no centralized sewerage system in Pavlodar villages.

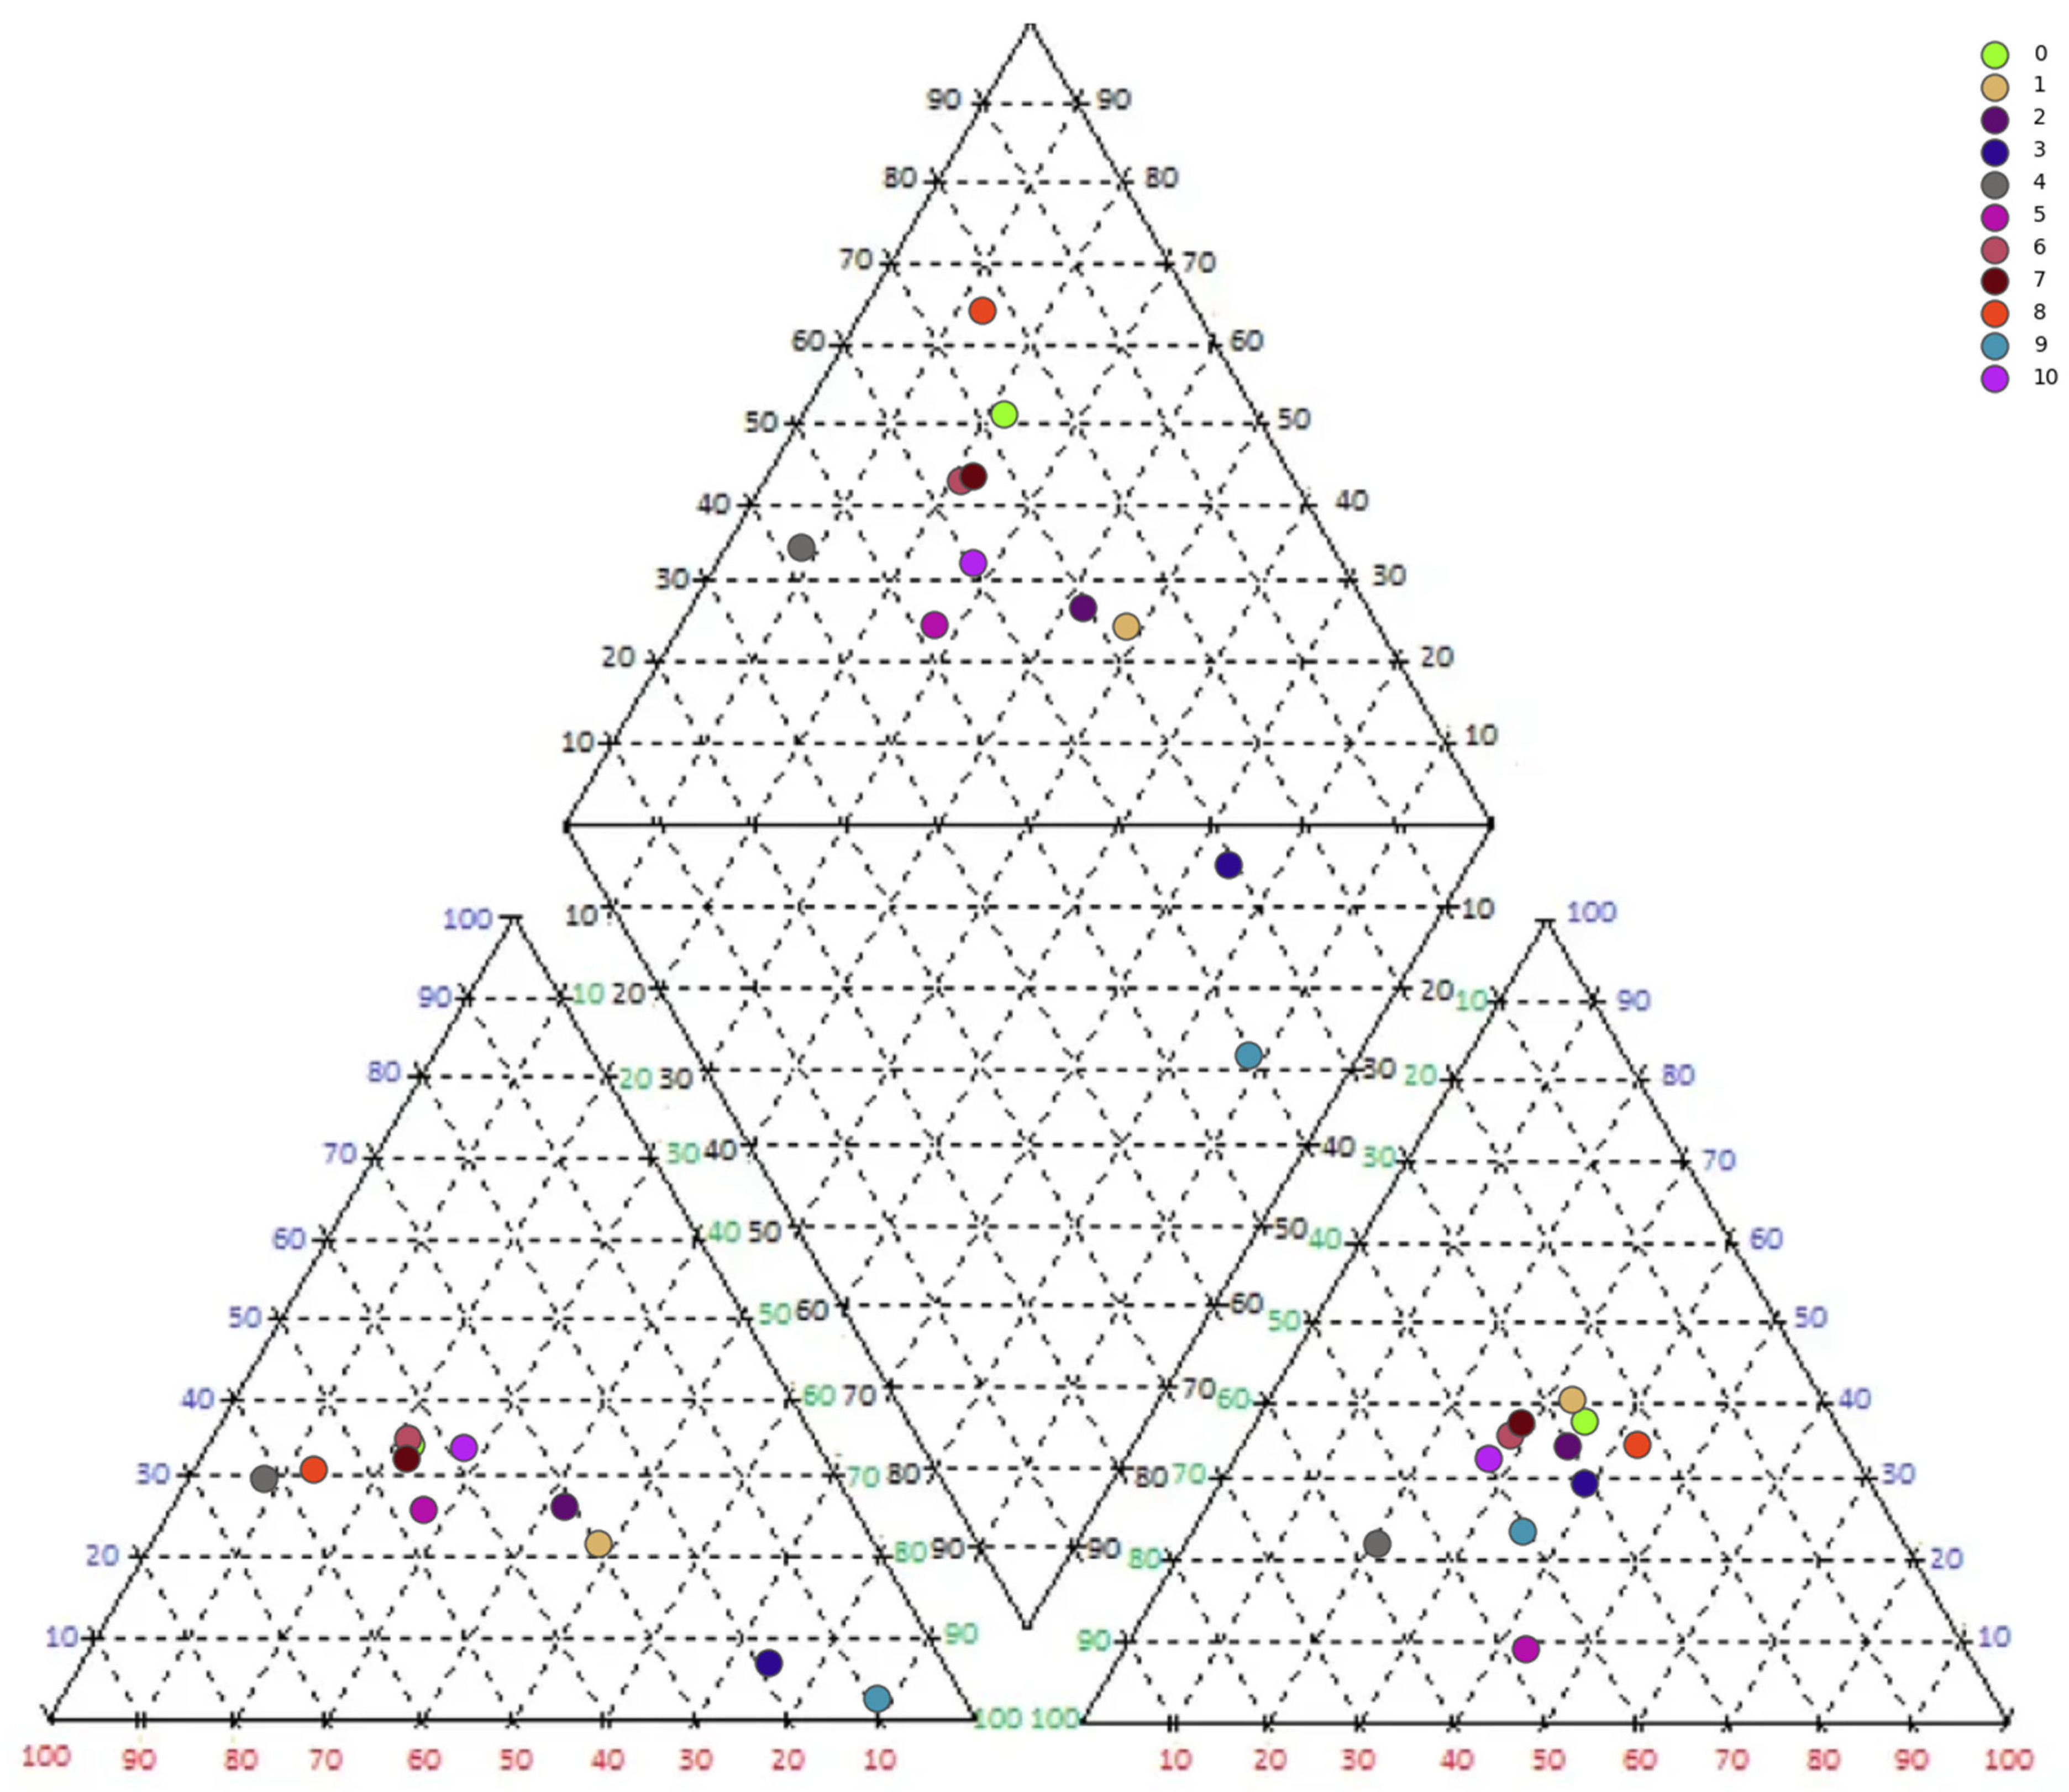
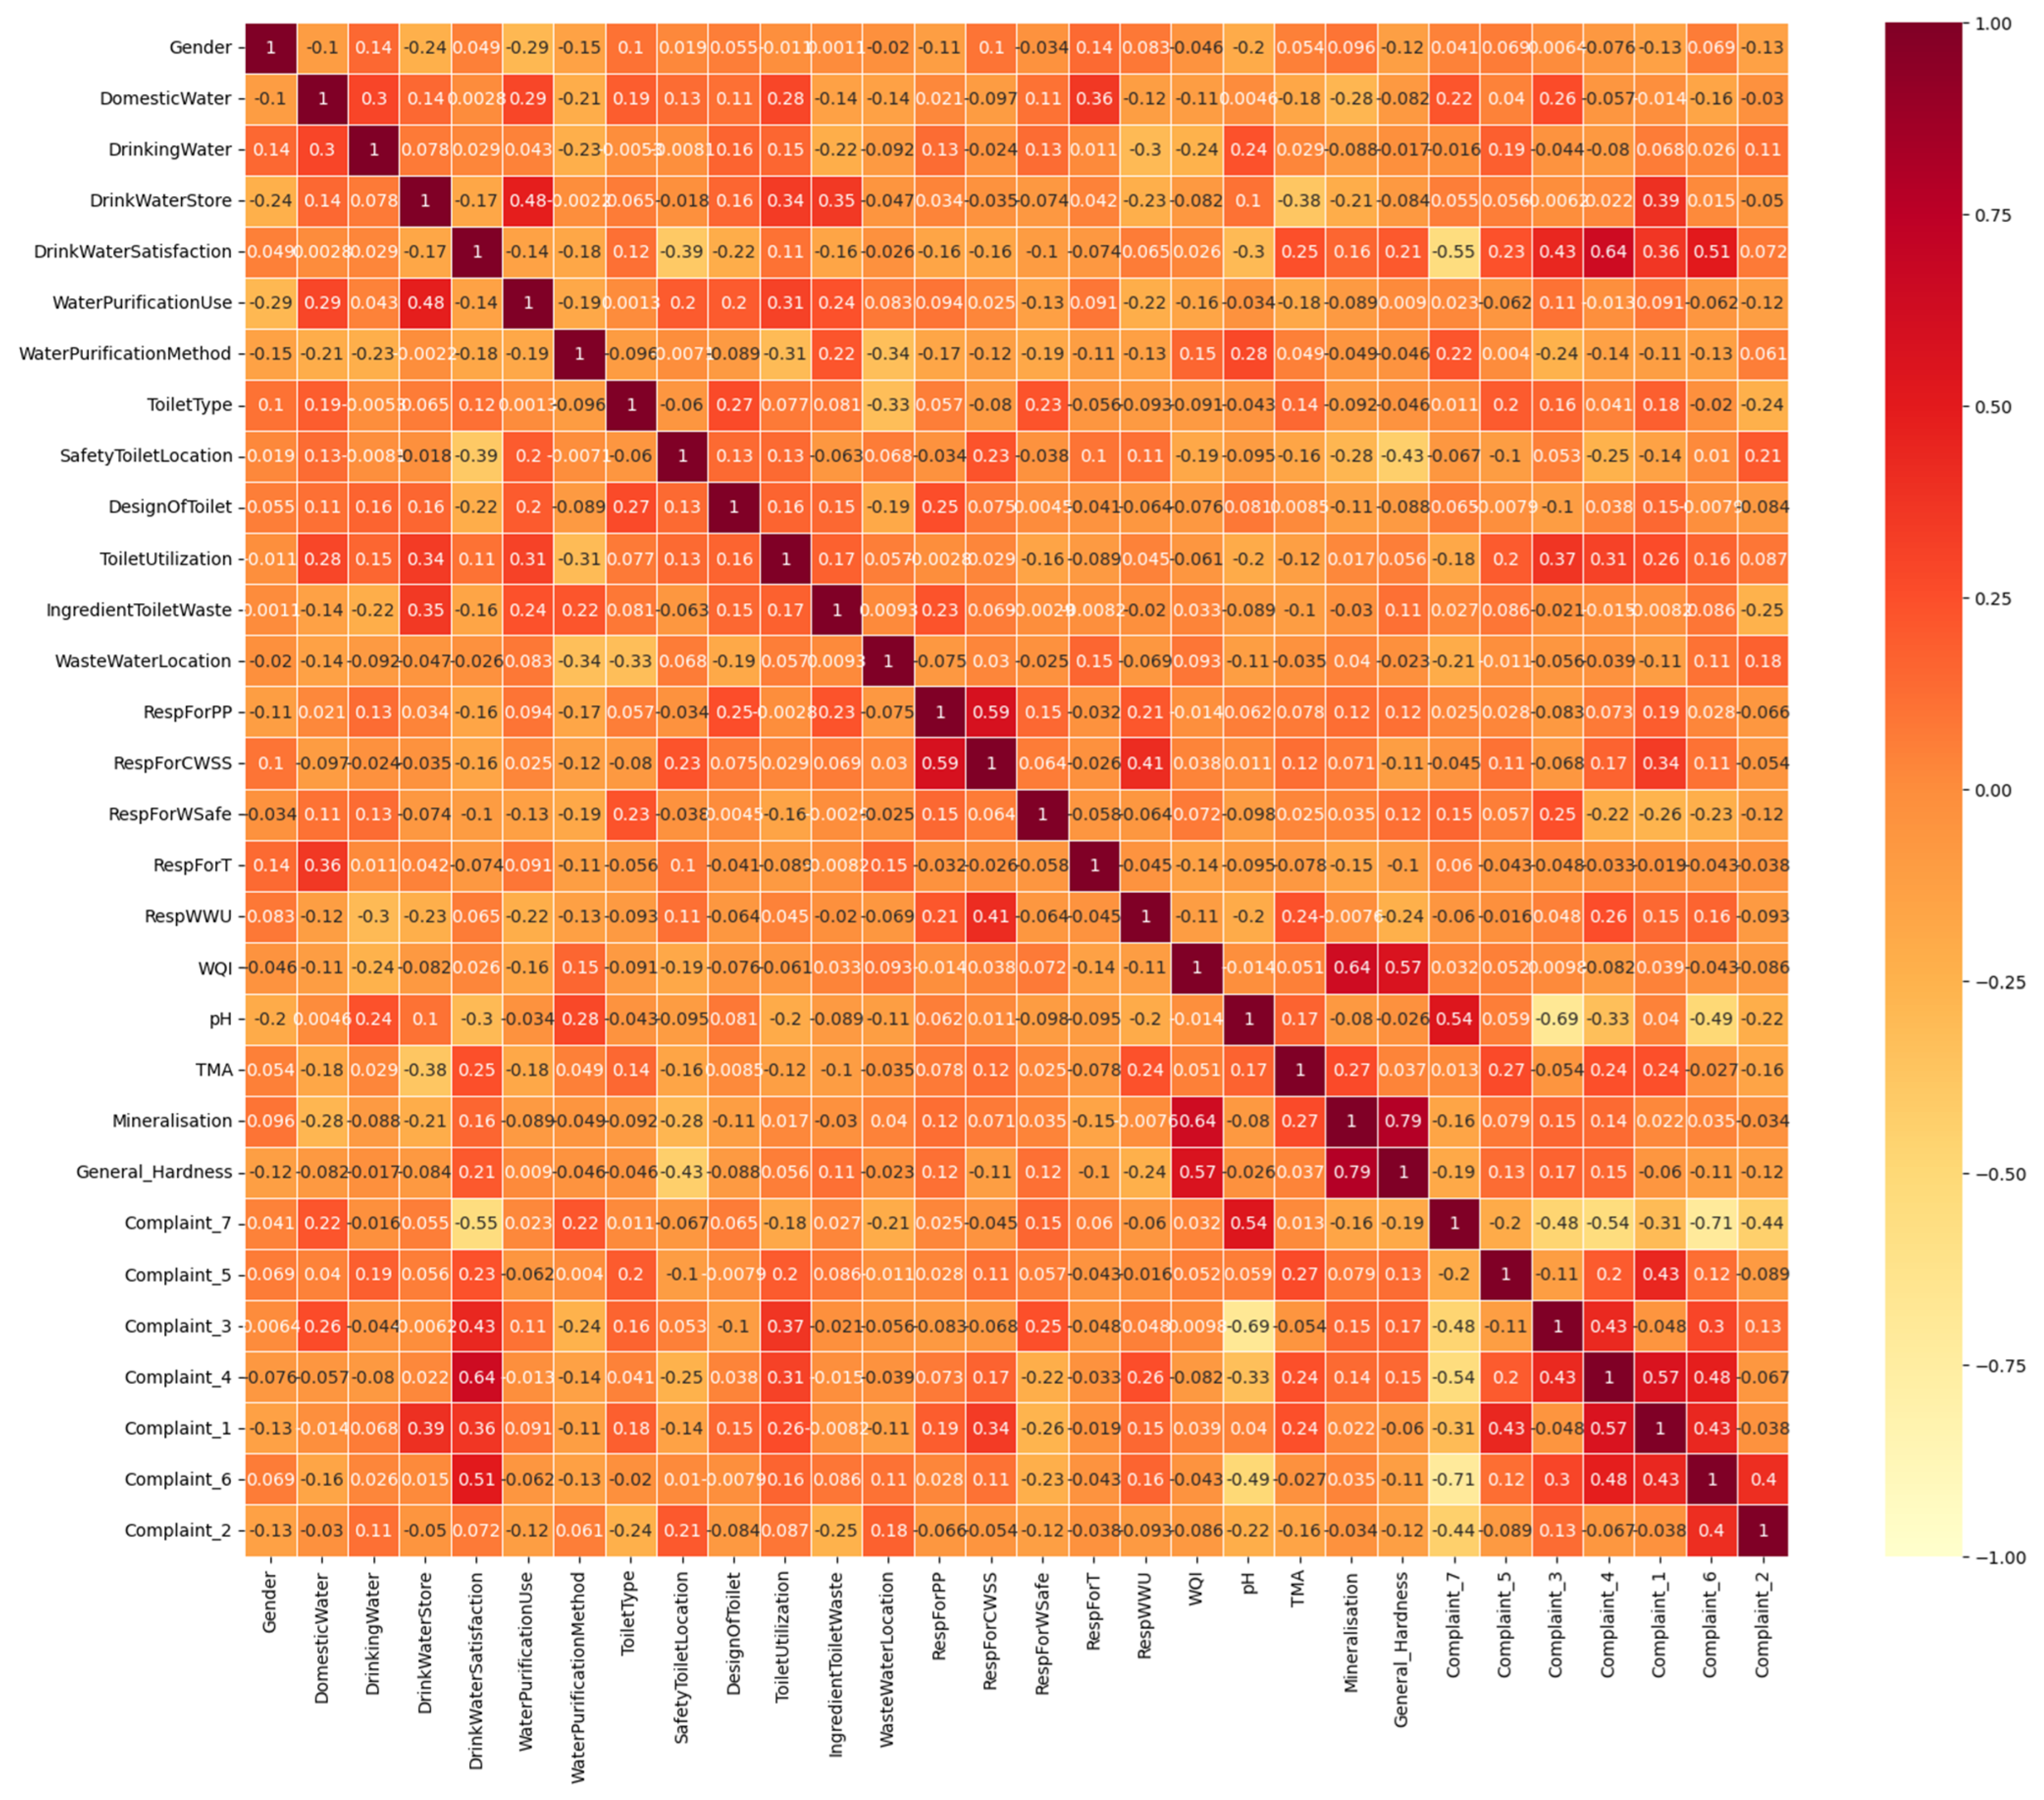
3.3. Hydro–Chemical Parameters of Pavlodar and Akmola Rural Area Drinking Water and Their Correlation with Perceived Quality of Water

Most water sources in Pavlodar villages do not have a dominant type of cations and anions, except for spring water, river/lake water, public wells, and Complex Block Module sources (Figure 16). Spring water and Complex Block Module sources have Na++K+, river sources and public wells have the Ca cation type of water, while spring water has the CO3 anion type water. Despite many samples having Ca2+, Mg2+, SO42+ mixed type of water, the river source has Ca2+, Mg2+, CO33+ type of water, and the spring water and the Complex Block Module source have Na+, K+, Cl type of water.
Calcium is the most common cation found in the rivers of the world. It is released by the weathering of sedimentary carbonate rocks and is often grouped with magnesium. In our studies, river sources and public wells have a dominant calcium cation due to this. Public wells supply water from a shallower depth than other sources. In contrast, CBM and spring water take water from deep artesian wells, where there is more sodium and potassium. Sodium is found in connection with chloride ions. Rocks containing NaCl are the most common source of sodium contained in river water. In coastal areas, Na+- and Cl-containing rainwater can be more widespread. Cable waters, fertilizers, and road salt are common sources of Na+ in water. Potassium (K+) is the least common cation in river water. It is released from silicate minerals, such as the field spar from potassium and mica. Important factors are depth, location of the drinking water source, distance of the source from surface water, and landscape of the area.
The heatmap (Figure 17) represents the concentration of various chemical substances in drinking water samples from research villages in the Pavlodar region. Our results show that several chemical substances are outside the standards in some Pavlodar villages. Dry residue is high in Gosplemstanciya, Shakat, and Zhertumsyk. Hardness exceeds the MPC in Chernoyarka, Gosplemstanciya, Zhanatan, and Zhertumsyk. Mineralization is above the MPC in Gosplemstanciya, Shakat, Zhanatan, and Zhertumsyk. Iron cations are above the MPC in Gosplemstanciya, Na and K in Gosplemstanciya, Shakat and Shoptykol. Nitrates exceed the MPC in Chernoyarka and Zhertumsyk, manganese in Chernoyarka and Zhanatan.
Based on the questionnaire data and chemical indicators, we observe strong correlations between various factors. For example, the source of drinking water has a weak relationship with pH (0.24) and complaints about bad taste (0.19). The drinking water source has a strong relationship with water purification use (0.48), toilet utilization type (0.34), and complaints about bad smell (0.39). Drinking water satisfaction weakly correlates with total microbial amounts (0.25), general hardness (0.25) and complaints about bad smell (0.36), hard water (0.43), salty water (0.64), bad taste (0.23) and sediment (0.51) (Figure 18). Responsibility for public pump correlates with responsibility for the central water supply system (0.59). Responsibility for the central water supply system correlates with responsibility for wastewater utilization type (0.41) and complaints about bad taste (0.34).
The Water Quality Index of drinking water has a strong relationship with mineralization (0.64) and general hardness (0.57). Drinking water mineralization strongly correlates with general hardness (0.79). Complaints about sediments are related to complaints about salty water (0.48), bad smell (0.43), muddy water (0.4), and hard water (0.3). Complaints about salty water have a strong relationship with complaints about bad smell (0.57) and hard water (0.43). Complaints about bad smell significantly correlate with complaints about bad taste (0.43).

4. Discussion

Most residents in the Pavlodar and Akmola regions have lived there for over 20 years. Most families consist of five members. The majority (48%) of respondents in the Pavlodar region rely on a central water supply system, while 36% use both private wells and the central system. In Pavlodar, 29% of respondents use water from private wells, and 25% use central water supplies for drinking. In contrast, residents in Birsuat only have access to a well. In the Pavlodar region, 16.15% of respondents complain about hard water, 14.97% about unpleasant taste, 7.74% about cloudy water, 7.14% about salty water, and 0.8% about unpleasant odors. In Birsuat, 50% of respondents complain about salty water, 29% about flat shale, 12% about unpleasant odors, and 9% about unpleasant taste.
In terms of water source satisfaction, respondents exhibit varying levels of satisfaction with different water supply types. Satisfaction levels are higher for those with inside tap water systems (28 completely satisfied), while private wells, both with and without water supply to the house, show more mixed satisfaction levels. These findings are consistent with previous research, indicating the importance of reliable and safe water sources in rural satisfaction [26]. In the Pavlodar region, 34.24% of respondents are completely satisfied with their drinking water, while 11.16% are completely dissatisfied. In Birsuat, 91.47% of respondents are rather satisfied, and 8.53% are completely satisfied with the quality of drinking water. In the Pavlodar region, 48.39% of respondents boil their water, 30.63% do not use any purification methods, 8.04% filter their water, 2.8% use cheesecloth, and the rest use other methods. In Birsuat, boiling is the only method used for water purification.
The findings of this study provide significant insights into the sanitation and water quality issues faced by rural areas in Pavlodar and Akmola regions. In Pavlodar villages, 73% of respondents have outdoor toilets, 19.78% have indoor toilets without access to a central sewerage system, and 7.22% have indoor toilets with access to the central sewerage system. In Birsuat, all toilets are located outdoors. In Pavlodar, 25.06% of toilets are located more than 50 m from the water source, 36.22% are 31–50 m away, 25% are 11–30 m away, and 11.23% are located inside the house. This spacing is crucial in mitigating contamination risks, as highlighted by Johnson et al. (2017) in their study on water safety in rural communities [27]. In the village of Birsuat, Akmola region, respondents indicate that the frequency of use of wastewater collectors ranges from two to seven times a year. This distribution aligns with previous studies highlighting the challenges in rural sanitation infrastructure [28].
According to our results, more than half of the respondents indicate paper, 28.54% other materials and 0.49% plastic as waste in toilets. The construction materials for toilets are predominantly wood (76.35%) with minimal use of brick, metal, or flat slate, which underscores the economic constraints and resource availability in these regions [29]. The prevalent toilet utilization method involves backfilling cesspools (76.22%), with fewer respondents using mechanical or chemical cleaning methods. This practice raises significant public health concerns due to the potential for groundwater contamination [30].
In Pavlodar villages, 76.92% of respondents believe that state representatives are responsible for both the public pump and the central water supply system, while 22.59% believe private companies are responsible. Additionally, 82% believe that the state is responsible for the safety of drinking water, 10.36% believe private companies are responsible, and 7.23% believe it is the responsibility of household owners. Almost all respondents (99%) indicate that household owners are responsible for maintaining toilets and disposing of wastewater.
The source of drinking water is positively associated with the use of water treatment products (correlation coefficient: 0.48), type of toilet used (0.34), and complaints about odor (0.39). Satisfaction with drinking water is correlated with hard water (0.43), salty water (0.64), bad taste (0.23), and precipitation (0.51). Responsibility for public pumps is correlated with responsibility for the central water supply system (0.59), and responsibility for central water supply correlates with responsibility for wastewater management (0.41) and complaints about bad taste (0.34).
The Water Quality Index is associated with salinity (0.64) and surface hardness (0.57). The relationship between the Water Quality Index and mineralization and general hardness highlights the critical parameters influencing water quality perceptions [31]. Mineralization of drinking water strongly correlates with total hardness (0.79). Complaints about sediments are correlated with complaints about salty water (0.48), foul odor (0.43), cloudy water (0.4), and hard water (0.3). Complaints about salty water are correlated with complaints about unpleasant odor (0.57) and water hardness (0.43). Complaints about unpleasant odor are significantly correlated with complaints about unpleasant taste (0.43). Furthermore, the strong correlations between complaints about sediments, bad taste, hard water, and salty water suggest a compounded impact of multiple water quality issues on user experience [32].
There are many studies in the literature on the perceived quality of drinking groundwater, groundwater, and surface water separately and chemically different pollutants separately. For instance, the literature contains data on perceived water quality in the context of hazardous water contamination, such as that of arsenic. A cross-sectional study examined arsenic water contamination in locations with varying water quality problems and the psychosocial status of respondents. The study showed a strong positive correlation with arsenic-based psychosocial distress [33].
A study assessed the self-perception of quality of life in the Anil Canal area and the adjacent area of the Anil district center in Rio de Janeiro and identified factors associated with the self-esteem of the population. A cross-sectional observational analytical study of socio-demographic characteristics, general health, and sanitation was carried out. The self-perception of the need to improve the quality of life in the Anil Channel community and the Anil Central District zone was influenced by several social and economic factors, as well as living practices and conditions. In terms of the need to improve environmental quality of life, both areas are highly modifiable (e.g., ascariasis/roundworms; having a water tank in the house; not drinking bottled water; not having sidewalks outside). Sociodemographic and environmental factors, in addition to health status, play a critical role in influencing people’s perceptions of the need to improve physical and environmental well-being [34].
Regarding the findings of this study, the perceived household water quality may influence bottled water consumption decisions in Greensboro, North Carolina neighborhoods across different income levels. Household surveys were used to examine residents’ consumption of bottled and tap water and their stated reasons for drinking bottled water. The results of this study showed that intra-city differences in household water quality perceptions are a major environmental justice issue as safety concerns force low-income residents to spend their limited income on bottled water [35]. Poor sanitation, insufficient safe drinking water, and poor hygiene are the main causes of waterborne diseases. A cross-sectional study was conducted to explore the knowledge, behavior, and factors associated with sanitation and hygiene of residents living along canal banks in Ho Chi Minh City. Canal water systems in Ho Chi Minh City exceeded the permissible thresholds of Vietnam standards for discharges of total coliforms and E. coli. The reason for water pollution in canals is low public awareness. Incorrect knowledge and behavior of the local population regarding sanitation and environmental protection of the canal has led to increased water pollution in the canal [36].
According to the literature, off-grid water supply systems are still widely used in Indonesia, such as in Metro City, Lampung, where only 5.05% of households are served with piped drinking water. Metro City is known to rank fourth in Indonesia as an area with clean water quality problems. The method used was longitudinal monitoring of drinking water sources in households with monthly surveys. The monitoring results show that after 6 months of research, it was determined that non-self-provisioning systems are more secure than self-provisioning systems with a percentage of 98% and 95%. The highest safety source of drinking water was refilled water and bottled water (100%), which provided the most consistent level of safety [37]. An early study aimed to examine the knowledge, beliefs, and behaviors among historic well owners in two communities in southeastern Ontario to limit the adoption of protective measures. Participants were more concerned about events and changes from the outside than events and interruptions in the environment. This study provides insight into the key social-cognitive factors influencing behavior, as well as their characteristics and the characteristics of the consumption context of modern well owners [38].
The Nubui River is the main source of water for drinking purposes and other household activities. The river is contaminated with chemicals, heavy metals, and has obvious aesthetic water quality problems and health implications. The results of a study examining it showed a pattern of Hg < Pb < Cd < Zn < Fe and high levels of cadmium compared to World Health Organization drinking water guideline values [39]. Groundwater pollution is a serious environmental problem and can persist in a variety of environmental conditions. The study described the seasonal influence on pollution characteristics in combination with the degree of risk to human health in the groundwater of the city of Pakistan Lahore. Drinking Water Quality Indices (DWQIs) and Heavy Metal Pollution Indices (HMEsI) during the summer and winter seasons showed pollution patterns ranging from mild to moderate. The Pollution Load Index (PLI) and Potential Environmental Risk Index (PERI) indicated average levels of pollution with low risks. Using Monte Carlo simulations, it was found that the carcinogenic risks associated with As, Cr, Cd, and Ni exceeded safer limits. The winter season was perceived to be more sensitive due to a significant increase in the release of pollutants into groundwater and posing a serious threat to humans [40].
Research was conducted on access to safe drinking water and its determinants among households in East Africa. Approximately three-quarters of East Africa’s population has access to improved drinking water, although water quality in the region is still considered poor [41]. Freshwater salinity syndrome (FSS), a concomitant increase in salinity, alkalinity, and concentrations of major cations and trace elements at the watershed scale were examined in relation to the potential influence of land use practices and wastewater treatment plant (WWTP) on the export of major ions and trace elements from a mixed-use watershed in south-eastern Pennsylvania. The positive relationship between the percentage of impervious surface cover, which ranged from 1.26% to 21.9% for the 13 sampled sites, and the concentrations of Ca2+, Mg2+, Na+, and Cl was consistent with reverse cation exchange caused by road salt and weathering of the built environment. Chloride-to-sulfate mass ratios (CSMRs) indicated serious corrosive potential. Observed exceedances of drinking water criteria for Na+ and Cl occurred during the winter months [42].
Ground water is the most reliable source of water for rural areas and small communities without access to national water supplies. A study was conducted to assess the quality and hydro-chemical control of such wells in the Ashanti, Upper East, and Central regions of Ghana. Analysis of ground water in the Ashanti region showed that its quality is negatively affected by iron, manganese, and arsenic. Water Quality Index was used to evaluate the suitability of ground water for domestic purposes, and based on this index, 80% of the water samples were classified as having excellent or good quality and about 7% were classified as unsuitable for domestic purposes across all regions [43].
Ground water from various aquifers in the Zhanjiang area suffers from varying degrees of nitrogen pollution, which poses a serious threat to the health of urban and rural residents as well as the surrounding aquatic ecological environment. The results show that the hydrochemistry of ground water in different aquifers is complex and diverse, which is mainly influenced by rock weathering and precipitation, and the cation exchange is strong. High NO3 concentration reduces microbial community richness (VRPFW). Ground water contains large numbers of bacteria associated with the nitrogen (N) cycle, and nitrification dominates nitrogen conversion. Overall, NO3/Cl data indicate that manure and wastewater (M&S) and soil organic nitrogen (SON) are the major sources of NO3 [44].
A study analyzing the functionality and sustainability of rural wells in Nigeria showed that while 49.8% of communities do not have improved water sources, 25.5% of communities rely on functioning wells, and 24.5% face problems [45]. A study of the quality of geospatial data for public drinking water distribution zones across all territorial authorities of Aotearoa New Zealand identified several differences in the quality of geospatial information that relate to population, area-level deprivation, ethnicity and, most notably, city classification/sat down [46]. In the US, drinking water violations are highest in low-income rural areas overall, and especially in Central Appalachia. An assessment was conducted of public and private drinking water sources and associated risk factors for exposure to waterborne pathogens among people living in rural Appalachian Virginia. The results showed that tap water in the region was generally safe, and that people in low-income households without public water or sanitation were more susceptible to exposure to waterborne pathogens [47].
Based on the data from the United States, exposures—air pollution, drinking water contamination, and temperature extremes—and responses to these exposures differ in urban and rural settings. Although previous research has addressed some aspects of these issues, significant gaps in knowledge remain, largely due to historical shortcomings in monitoring and reporting, particularly in rural areas. It was found that the urban–rural gap in fine particulate matter (PM2.5) has converged over the past two decades, and the remaining gap is small compared to the overall decline. Moreover, residents of urban counties are, on average, less vulnerable to the mortality effects of PM2.5 exposure [48].
In many countries, the provision of drinking water in rural areas is the responsibility of the users themselves, but in practice the condition of the components of the implied infrastructure managed by RWS varies considerably. Using the example of Chile, the relationship between the state of infrastructure, performance, and organizational characteristics was explored. In addition, comparing the RWS attributes of these three clusters allowed us to characterize them in terms of structural, organizational, governance, and environmental variables [49].
Strengthening the methods and frequency of water quality monitoring and increasing public awareness of the importance of drinking water standards can help bridge the gap between perceived and actual water quality [50]. This study evaluated the water quality in ten rural villages, revealing significant variances in water parameter values, particularly concerning MPC exceedances. The predominance of hardness and mineralization across most villages indicates a widespread issue likely attributable to natural geological factors and insufficient local water treatment facilities [51]. In Gosplemstantcyia, the presence of multiple parameters such as natrium, kalium, and iron above the MPC highlights a critical concern for public health and the need for urgent intervention. The high iron levels and potential pollution sources, such as the nearby Aksu ferroalloy plant, suggests an anthropogenic influence likely exacerbated by inadequate waste management practices common in rural settings [52,53]. The elevated levels of nitrates in Zhertumsyk are associated with agricultural runoff mirror findings from similar studies in agricultural regions where fertilizer use is prevalent [54]. This underscores the ongoing challenge of managing agricultural pollutants, which requires integrated approaches involving both water treatment enhancements and agricultural best practices [55]. The situation in Chernoyarka, Shakat, and Zhanatan, where parameters like manganese were found above the MPC, could be indicative of both industrial influences and natural mineral deposits. Manganese contamination is particularly concerning due to its neurotoxic effects, necessitating immediate attention to water treatment processes and potential source identification [56]. The specific case of Shoptykol, where elevated levels of natrium and kalium are attributed to the dissolution of indigenous rocks, highlights the geogenic origin of some contaminants. This points to the natural variability of water quality and the critical need for context-specific interventions [57].
The chemical analysis of water samples revealed several concerning exceedances of Maximum Permissible Concentrations (MPCs) for substances such as iron, manganese, sodium, potassium, and nitrates in various villages. These findings correlate with the complaints of respondents about bad taste, hard water, and sediments, indicating a direct impact of water quality on user satisfaction [58,59].
In conclusion, the study underscores the urgent need for improved sanitation infrastructure and water quality management in rural areas. The findings call for targeted interventions to address the identified issues, ensuring safe and satisfactory water and sanitation facilities for rural communities. Future research should focus on developing sustainable solutions that are economically viable and culturally acceptable for these regions. Given the diverse sources of contamination, ranging from natural geological conditions to anthropogenic activities, a multifaceted approach is essential. This includes improving local water treatment infrastructure, enhancing agricultural practices to minimize runoff, and implementing stringent industrial waste management protocols. Public awareness campaigns about the importance of water conservation and pollution prevention can further support these efforts.

5. Conclusions

Our study’s analysis identified several key findings regarding the chemical composition of drinking water in the Pavlodar and Akmola regions. In the Pavlodar region, we observed that certain cations (such as iron in Naberezhnoye, Birlik, Zhertumsyk, and Koryakovka, and manganese in Chernoyarka and Zhanatan) and anions (notably nitrates) exceed the Maximum Permissible Concentration (MPC). These variations in chemical composition are interconnected with the type of water supply systems in each village and the water quality perceived by respondents. Different types of water supply systems are linked with the water quality perceived by respondents. For example, the type of toilet facilities among respondents is associated with the safe location and responsibility for water safety, which correlates with complaints about the bad taste of water. The type of toilet disposal also correlates with complaints about unpleasant odor and taste, hardness, and salinity of water. Responsibility for public pumps correlates with responsibility for the central water supply system and the type of wastewater disposal. The central water supply system’s responsibility is linked to the type of wastewater disposal and complaints about unpleasant taste.
According to respondents, responsibility for water safety correlates with complaints about hard water, while responsibility for wastewater disposal correlates with the total microbial count of drinking water and complaints about salty water. The drinking Water Wuality Index is closely related to water mineralization and overall hardness. The total microbial count of drinking water has a significant relationship with respondents’ complaints about unpleasant taste, smell, and salinity. The mineralization of drinking water is closely related to its overall hardness. Respondents’ complaints about sediment in water are interrelated with complaints about hardness, salinity, turbidity, and unpleasant odor. Complaints about salty water are closely related to complaints about unpleasant odor and hard water, and complaints about unpleasant odor are related to complaints about unpleasant taste.
This study provided a comprehensive assessment of drinking water quality in rural areas of the Pavlodar and Akmola regions, highlighting significant issues related to water hardness, mineralization, and specific contaminants such as iron, nitrates, and manganese. The findings underscore the need for targeted interventions to address both natural and anthropogenic sources of water contamination. Ensuring safe drinking water in these regions requires a coordinated effort involving local authorities, industrial stakeholders, and the rural communities themselves. Regular monitoring, public education, and improved infrastructure are pivotal in safeguarding the health and well-being of the rural population.
This investigation also highlighted significant variances in water quality and sanitation infrastructure in the rural areas of the Pavlodar and Akmola regions. The findings indicate that a majority of residents rely on outdoor toilets and private water sources, with varying levels of satisfaction with drinking water quality. Key issues include water hardness, salinity, and contamination from nearby industrial activities. There is a strong need for improved sanitation infrastructure, better water treatment facilities, and increased public awareness of water quality standards. Future research should focus on sustainable, economically viable, and culturally acceptable solutions to address these challenges. To improve the quality of water related to the sanitary condition of villages, namely the location of toilets and cesspools, it is necessary to clearly regulate the location of toilets and their disposal points from the water supply source. It is also important for residents to be aware of the standards for safe disposal and maintaining toilets in sanitary conditions in villages.

Author Contributions

Conceptualization, R.B. and K.T.; methodology, R.T.; software, R.B.; validation, Z.R., A.O. and Y.A.; formal analysis, S.T. and R.B.; investigation, K.T.; resources, A.M.; data curation, A.Z.; writing—original draft preparation, R.B.; writing—review and editing, K.T.; visualization, A.N.; supervision, R.T.; project administration, Z.R.; funding acquisition, A.Z. All authors have read and agreed to the published version of the manuscript.

Funding

This research was funded by the Science Committee of the Ministry of High Education and Science of the Republic of Kazakhstan, grant number AP23486944 on the topic “Linking water quality and quantity of climate change condition in steppe zone of Kazakhstan”.

Institutional Review Board Statement

Ethical review and approval were waived for this study, due to all data will be anonymized, and respondents’ confidentiality will be strictly maintained.

Informed Consent Statement

Patient consent was waived due to all questionnaire responses were anonymized, and no personally identifiable information will be published or shared, data will be stored securely and only accessed by the research team.

Data Availability Statement

The original contributions presented in the study are included in the article, further inquiries can be directed to the corresponding author/s.

Conflicts of Interest

The authors declare no conflicts of interest.

References

  1. Travers, C.D.; Spencer, J.B.; Cwiak, P.A.C.; Howards, P.P. Urban-Rural Differences in Tubal Ligation Incidence in the State of Georgia, USA. J. Rural. Health 2018, 34, 122–131. [Google Scholar] [CrossRef]
  2. Cui, Z.; Vitousek, P.M.; Zhang, F.; Chen, X. Strengthening Agronomy Research for Food Security and Environmental Quality. Environ. Sci. Technol. 2016, 50, 1639–1641. [Google Scholar] [CrossRef]
  3. Tussupova, K.; Hjorth, P.; Berndtsson, R. Access to Drinking Water and Sanitation in Rural Kazakhstan. J. Environ. Res. Public Health 2016, 13, 1115. [Google Scholar] [CrossRef]
  4. Sharma, K.; Rajan, S.; Kanta Nayak, S. Water pollution: Primary sources and associated human health hazards with special emphasis on rural areas. In Water Resources Management for Rural Development. Challenges and Mitigation; Madhav, S., Srivastav, A.L., Chibueze Izah, S., Hullebusch, E., Eds.; Elsevier: Amsterdam, The Netherlands, 2023; pp. 3–14. [Google Scholar] [CrossRef]
  5. Baccour, S.; Goelema, G.; Albiac, J.; van Vliet, M.T.H.; Strokal, M. Water quality management could halve future water scarcity cost-effectively in the Pearl River Basin. Nat. Commun. 2024, 15, 5669. [Google Scholar] [CrossRef] [PubMed]
  6. Beisenova, R.; Zhumashev, B.; Turlybekova, G.; Yelikbayev, B.; Kakabayev, A.; Shamshedenova, S.; Nugmanov, A. Assessment of Atmospheric Air Quality in the Region of Central Kazakhstan and Astana. Atmosphere 2023, 14, 1601. [Google Scholar] [CrossRef]
  7. Chaza, C.; Sopheak, N.; Mariam, H.; David, H.; Baghdad, O.; Moomen, B. Assessment of pesticide contamination in Akkar groundwater, northern Lebanon. Environ. Sci. Pollut. R 2018, 25, 14302–14312. [Google Scholar] [CrossRef]
  8. Shamshedenova, S.; Beisenova, R.; Rakhymzhan, Z.; Zhaznaeva, Z.; Syzdykova, N.; Tazitdinova, R.; Khanturin, M. Ecological characteristics of groundwater in rural areas of the karaganda region. J. Ecol. Eng. 2019, 20, 67–75. [Google Scholar] [CrossRef] [PubMed]
  9. Angoua, K.; Dongo, M.R.; Templeton, J.; Zinsstag, B. Bonfoh Barriers to access improved water and sanitation in poor peri-urban settlements of Abidjan, Côte d’Ivoire. PLoS ONE 2018, 13, 0202928. [Google Scholar] [CrossRef] [PubMed]
  10. Andreev, A.; Andreev, M.; Kolesnihenko, D.; Dyganova, R.R.; Merzadinova, G.T.; Ibraev, I.K. Parametric identification algorithm for asynchronous electric motor inverter on the switching intervals of power transistors. Int. Sci. Tech. Conf. Smart Energy Syst. 2019, 124, 02017. [Google Scholar] [CrossRef]
  11. Akbayeva, L.; Bakeshova, Z.; Mamytova, N.; Tazitdinova, R.; Beisenova, R. Determination of the Microorganisms’ Resistance to Antibiotics in the Bacterioplankton Community in the Akmola Region Lakes. J. Ecol. Eng. 2024, 25, 99–108. [Google Scholar] [CrossRef]
  12. Alimgazin, A.; Merzadinova, G.; Sultanguzin, I.; Yavorovsky, Y.; Bartenev, A.; Berguzinov, A. Prospects for the use of absorption cooling and heating technologies to improve the energy efficiency of various facilities in the Republic of Kazakhstan. AIP Conf. Proc. 2022, 2650, 030026. [Google Scholar] [CrossRef]
  13. Results of the National Population Census of the Republic of Kazakhstan 2021. Agency of the Republic of Kazakhstan on Statistics. Available online: https://stat.gov.kz/en/national/2021/ (accessed on 5 May 2024).
  14. ArcGIS Online. Available online: https://www.arcgis.com/home/item.html?id=10df2279f9684e4a9f6a7f08febac2a9 (accessed on 1 June 2024).
  15. About the Region. Official Website of the Akimat of Pavlodar Region (June 2009). Archived from the Original on 1 June 2012. Available online: https://www.gov.kz/memleket/entities/pavlodar?lang=kk (accessed on 2 October 2009).
  16. General Information about the Pavlodar Region/Portal visitkazakhstan.nur.kz. Available online: https://welcome.kz/en/info-cities/pavlodar-region/ (accessed on 15 August 2024).
  17. Regions of Kazakhstan: ALL.BIZ: Kazakhstan. kz.all.biz. Retrieved 23 April 2022. Archived from the Original on 14 May 2021. Available online: https://web.archive.org/web/20210514164508/https:/kz.all.biz/regions (accessed on 15 August 2024).
  18. Natural Conditions and Natural Resources of the USSR. Available online: http://bse.sci-lib.com/article086155.html (accessed on 15 August 2024).
  19. Department of Statistics of Pavlodar Region. Archived 25 September 2020. Available online: https://ru.wikipedia.org/wiki (accessed on 15 August 2024).
  20. Kazakhstan. National Encyclopedia. Karaganda Region. Available online: https://www.wikiwand.com/ru/ (accessed on 15 August 2024).
  21. Population of the Republic of Kazakhstan by Gender by Regions, Cities, Districts and Regional Centers and Villages at the Beginning of 2024. The Bureau of National Statistics Agency for Strategic Planning and Reforms of the Republic of Kazakhstan. Available online: https://stat.gov.kz/industries/social-statistics/demography/publications/157719/ (accessed on 4 July 2024).
  22. Requirements for Drinking Water Quality (SanPin 2.1.4.1074-01). Available online: https://water2you.ru/n-docs/pdk_sanpin/ (accessed on 5 May 2024).
  23. Beisenova, R.; Rakhymzhan, Z.; Tazitdinova, R.; Auyelbekova, A.; Khussainov, M. Comparative characteristics of germination of some halophyte plants in Saline soils of Pavlodar region. J. Environ. Manag. Tour. 2020, 11, 1132–1142. [Google Scholar] [CrossRef] [PubMed]
  24. Horton, R.K. An index number for rating water quality. J. Water Pollut. Control Fed. 1965, 37, 300–306. [Google Scholar]
  25. Life Expectancy, Kazakhstan. Available online: https://data.who.int/countries/398 (accessed on 15 August 2024).
  26. Bull, C.; Nutr, B.; Byrnes, J.; Comm, B.; Econ, B.; Stud, E.; Econ, H.; Hettiarachchi, R.; Downes, M. A systematic review of the validity and reliability of patient-reported experience measures. Health Serv. Res. 2019, 54, 1023–1035. [Google Scholar] [CrossRef] [PubMed]
  27. Boelee, E.; Geerling, G.; Zaan, B.; Blauw, A.; Vethaak, A.D. Water and health: From environmental pressures to integrated responses. Acta Trop. 2019, 193, 217–226. [Google Scholar] [CrossRef]
  28. Adugna, D. Challenges of sanitation in developing counties—Evidenced from a study of fourteen towns, Ethiopia. Heliyon 2023, 9, e12932. [Google Scholar] [CrossRef]
  29. Khoshnava, S.M.; Rostami, R.; Mohamad Zin, R.; Štreimikienė, D.; Mardani, A.; Ismail, M. The Role of Green Building Materials in Reducing Environmental and Human Health Impacts. Int. J. Environ. Res. Public Health 2020, 17, 2589. [Google Scholar] [CrossRef]
  30. Li, P.; Karunanidhi, D.; Subramani, T.; Srinivasamoorthy, K. Sources and Consequences of Groundwater Contamination. Arch. Environ. Contam. Toxicol. 2021, 80, 1–10. [Google Scholar] [CrossRef]
  31. Kumar, D.; Kumar, R.; Sharma, R.M.; Awasthi, A.; Kumar, M. Global water quality indices: Development, implications, and limitations. Total Environ. Adv. 2024, 9, 200095. [Google Scholar] [CrossRef]
  32. Geng, M.; Qian, Z.; Jiang, H.; Huang, B.; Huang, S.; Deng, B.; Peng, Y.; Xie, Y.; Li, F.; Zou, Y.; et al. Assessing the impact of water-sediment factors on water quality to guide river-connected lake water environment improvement. Sci. Total Environ. 2024, 912, 168866. [Google Scholar] [CrossRef]
  33. Khan, N.; Hoque, S.F.; Mahmud, Z.H.; Islam, M.R.; Alam, M.A.; Islam, M.S.; Charles, K.J. Water quality and unseen health outcomes: A cross-sectional study on arsenic contamination, subclinical disease and psychosocial distress in Bangladesh. SSM Ment. Health 2024, 6, 100344. [Google Scholar] [CrossRef]
  34. Barros, R.; Ohnuma, A.A., Jr.; Manso, M.C. Self-Perceived Quality of Life (WHOQOL-Bref), and Self-Reported Health, Social and Environmental Factors Related to Its Improvement among Residents of Anil, Rio de Janeiro—Cross-Sectional Study. Healthcare 2024, 12, 1520. [Google Scholar] [CrossRef] [PubMed]
  35. Stephens, S.; Praskievicz, S. Bottled Water Consumption and Perceptions of Household Water Quality:An Intra-Urban Analysis of Greensboro, North Carolina. Southeast. Geogr. 2024, 64, 203–219. [Google Scholar] [CrossRef]
  36. Le, L.-T.; Dao, T.-V.-H.; Tran, G.-H.N.; Nguyen, T.-M.T.; Lam, M.-Q.; Vo, T.-B.T.; Nguyen, P.-T.; Tran, Y.-N.P.; Nguyen, N.T.; Lens, P.N.L.; et al. Investigation of canal water quality, sanitation, and hygiene amongst residents living along the side of the canals—A cross—Sectional epidemiological survey at Ho Chi Minh city, Vietnam. Case Stud. Chem. Environ. Eng. 2024, 9, 100700. [Google Scholar] [CrossRef]
  37. Lampung-Aswirta, V.F.; Priadi, C.R. Assessment of the Level of Drinking Water Services that Are Perceived as Safe in Metro City. The 1st International Symposium on Environmental and Energy Policy (ISEEP 2023), Section Environmental Policy Formulation and Evaluation. E3S Web Conf. 2024, 506, 06010. [Google Scholar] [CrossRef]
  38. Lavallee, S.; Latchmore, N.; Egan, R.; Hynds, P.D.; Brown, R.S.; Majury, A. ‘If it works, don’t fix it’: A qualitative study of knowledge, perception, and behaviour among private well owners in southeastern Ontario. Groundw. Sustain. Dev. 2024, 24, 101057. [Google Scholar] [CrossRef]
  39. Norvivor, A.; Azizi, S.; Fuku, X.; Atibu, E.K.; Idris, A.O.; Sibali, L.; Maaza, M.; Kamika, I. Ecological and human health risk of heavy metals in Nubui River: A case of rural remote communities. Front. Water 2024, 6, 1397853. [Google Scholar] [CrossRef]
  40. Jia, C.; Altaf, A.R.; Li, F.; Ashraf, I.; Zafar, Z.; Nadeem, A.A. Comprehensive assessment on groundwater quality, pollution characteristics, and ecological health risks under seasonal thaws: Spatial insights with Monte Carlo simulations. Groundw. Sustain. Dev. 2023, 22, 100952. [Google Scholar] [CrossRef]
  41. Terefe, B.; Jembere, M.M.; Assimamaw, N.T. Access to drinking safe water and its associated factors among households in East Africa: A mixed effect analysis using 12 East African countries recent national health survey. J. Health Popul. Nutr. 2024, 43, 72. [Google Scholar] [CrossRef]
  42. Marks, N.K.; Cravotta, C.A.; Rossi, M.L.; Silva, C.; Kremer, P.; Goldsmith, S.T. Exploring spatial and temporal symptoms of the freshwater salinization syndrome in a rural to urban watershed. Sci. Total Environ. 2024, 947, 174266. [Google Scholar] [CrossRef]
  43. Tabi, R.N.; Gibrilla, A.; Boakye, P.; Agyemang, F.O.; Foaah, A.A.; Oduro-Kwarteng, S. Appraisal of groundwater quality and hydrochemistry in three regions of Ghana: Implications for drinking purposes. Groundw. Sustain. Dev. 2024, 26, 101193. [Google Scholar] [CrossRef]
  44. Liu, R.; Qiu, J.; Wang, S.; Fu, R.; Qi, X.; Jian, C.; Hu, Q.; Zeng, Z.; Liu, N. Hydrochemical and microbial community characteristics and the sources of inorganic nitrogen in groundwater from different aquifers in Zhanjiang, Guangdong Province, China. Environ. Res. 2024, 252 Pt 3, 119022. [Google Scholar] [CrossRef]
  45. Adeoti, O.S.; Kandasamy, J.; Vigneswaran, S. Water infrastructure sustainability challenge in Nigeria: A detailed examination of infrastructure failures and potential solutions. Water Supply 2024, 24, 2066–2076. [Google Scholar] [CrossRef]
  46. Hobbs, M.; Puente-Sierra, M.; Marek, L.; Broadbent, J.M.; Chambers, T. Examining the Structural Inequities in the Quality of Nationwide Drinking Water Data in Aotearoa New Zealand: A Geospatial Cross-Sectional Study. Appl. Spat. Anal. Policy 2024, 17, 951–962. [Google Scholar] [CrossRef]
  47. Cohen, A.; Rasheduzzaman, M.; O’Connell, B.; Brown, T.; Taniuchi, M.; Krometis, L.-A.; Hubbard, A.; Scheuerman, P.; Edwards, M.; Darling, A.; et al. Drinking water sources, quality, and associated health outcomes in Appalachian Virginia: A risk characterization study in two counties. Int. J. Hyg. Environ. Health 2024, 260, 114390. [Google Scholar] [CrossRef] [PubMed]
  48. Molitor, D.; White, C. Do cities mitigate or exacerbate environmental damages to health? Reg. Sci. Urban Econ. 2024, 107, 103973. [Google Scholar] [CrossRef]
  49. Bopp, C.; Nicolas-Artero, C.; Blanco, E.; Fuster, R. Infrastructure Conditions and Service Quality in Rural Drinking Water Systems: A Cluster Analysis ofCommunity-Based Organizations in Chile. J. Water Resour. Plan. Manag. 2024, 150, 05024003. [Google Scholar] [CrossRef]
  50. Burkhanova, G.S.; Roshana, N.R.; Gorbunova, S.V.; Kas’yanova, V.S.; Kuterbekov, K.A.; Bekmyrza, K.Z.; Merzadinova, G.T. Operational Stability of the Pd–6 wt% In–0.5 wt% Ru–1 wt% Co Membrane during Its Cyclic Operation in Manufacturing High-Purity Hydrogen. Russ. Metall. 2021, 3, 313–319. [Google Scholar] [CrossRef]
  51. Brown, R.; Jones, M. Impact of agricultural runoff on water quality. J. Environ. Qual. 2020, 49, 395–402. [Google Scholar]
  52. Smith, L.; Taylor, P.; Anderson, D. Geological sources of minerals in water and their health implications*. J. Environ. Sci. Health 2018, 53 Pt A, 1123–1134. [Google Scholar]
  53. Johnson, S.; Anderson, M. Industrial contributions to groundwater pollution. J. Hydrol. 2017, 580, 124567. [Google Scholar]
  54. Doe, J.; Roe, M.; Smith, L. Water contamination and associated health risks in rural environments. Environ. Health Perspect. 2019, 127, 345–354. [Google Scholar]
  55. Green, S.; Blue, T.; White, L. Sustainable agricultural practices for water quality improvement. Water Resour. Manag. 2021, 35, 1777–1790. [Google Scholar]
  56. White, K.; Black, J.; Grey, I. Health risks associated with manganese exposure. Neurotoxicology 2019, 73, 230–241. [Google Scholar]
  57. Miller, R.; Davis, S. Geological influences on groundwater chemistry. Groundwater 2020, 58, 75–88. [Google Scholar]
  58. Akcaalan, R.; Devesa-Garriga, R.; Dietrich, A.; Steinhaus, M.; Dunkel, A.; Mall, V.; Manganelli, M.; Scardala, S.; Testai, E.; Codd, G.A.; et al. Water taste and odor (T&O): Challenges, gaps and solutions from a perspective of the WaterTOP network. Chem. Eng. J. Adv. 2022, 12, 15–100409. [Google Scholar] [CrossRef]
  59. Yang, Z.; Zhang, S.; Wang, F.; Dong, B.; Cai, M. Occurrence and health risk assessment of organic amine pesticides in drinking water of the Yangtze River delta urban agglomeration. J. Environ. Sci. 2025, 152, 99–110. [Google Scholar] [CrossRef]
Figure 1. Research area: Location of the 10 drinking water sample villages in the Pavlodar region of northeast Kazakhstan; Location of the water sample village Birsuat in the Akmola region of north Kazakhstan. To create a map of the study area, the ArcGIS software platform version 10.4 was used. Base map source: Esri, Maxar, Earthstar Geographics, and the GIS User Community. The maps show the administrative boundaries of the Akmola region and the location of the village of Birsuat, where sampling took place [14].
Sustainability 16 07625 g001
Figure 2. Distribution of population age of respondents in rural Pavlodar area. Note: x axis is respondents’ ages, y axis is frequency.
Sustainability 16 07625 g002
Figure 3. Distribution of population age (a) and gender (b) of respondents in rural Akmola area (village Birsuat). Note: (a) x axis is respondents’ ages in years, y axis is frequency; (b) x axis is respondents’ genders, y axis is frequency.
Sustainability 16 07625 g003
Figure 4. Distribution of general parameters of respondents in rural Pavlodar area. Note: y axis is frequency of categorical variables: x axis are categorical variables: Gender: male, female; Years in Area (length of living in area): Less than 5 years, 5–10 years, 11–20 years, More than 20 years; Own Farm (presence of household farm in the house): No, Yes, livestock, Yes, garden; Family Size—number of people in the family.
Sustainability 16 07625 g004
Figure 5. Distribution of water supply system and quality parameters of respondents in Pavlodar rural area. Note: y axis is frequency of categorical variables: x axis are categorical variables: Domestic Water and Drinking Water (Water sources): CWSSIT—central water supply system with inside tap, CWSSOT—central water supply system with outside tap, PWIPS—public water intake pump on the street, PWWOWSH—private well without water supply to the house, PWWWSH—private well with water supply to the house, PW—public well, PBWWSH—private borehole with water supply to the house, PBWOWSH—private borehole without water supply to the house, PB—public borehole, IW—imported water, BWS—bottled water from the stores, SW—spring water, RW—river water, BWS—bottled water from the stores, PWS—purified water from the stores, BWIP—bottled water, imported and paid for, FTW—free trucked-in water, SW—spring water; Other; Drink Water Complaints (complaints of respondents): Bad smell, Muddy water, Hard water, Salty water, Poor taste, Sediment, No complaints; Drink Water Store (where respondents store the drinking water): Closed tanks, Buckets, Plastic containers, Open tanks, Glass containers, Ceramic containers, Metallic containers, Other; Drinking Water Satisfaction (respondents’ satisfaction with drinking water): Fully satisfied, Rather satisfied, Rather unsatisfied, Fully unsatisfied, Difficult to answer; Water Purification Use: Yes—Respondents use purification, No—Respondents do not use purification; Water Purification Method: Filtration, Boiling, Passed through gauze, Other.
Sustainability 16 07625 g005
Figure 6. Distribution of water supply system and quality parameters of respondents in rural areas of Akmola. Note: y axis is frequency of categorical variables: x axis are categorical variables: Drinking Water (source): well; Water Store (were respondents save water): closed tanks, buckets, plastic containers, open containers; Purification Method—Boiling; Water Complaints (respondent complaints): Bad smell, Cloudy, Salty, Hard, Poor taste, Has sediment, Other; Water Satisfaction (respondents’ satisfaction with drinking water quality): Completely satisfied, Rather satisfied, Rather unsatisfied, Completely unsatisfied; WW Utilization Year—Respondents’ cleaning frequency of waste water per year.
Sustainability 16 07625 g006
Figure 7. Distribution of sanitation parameters of respondents in rural areas of Pavlodar rural area. Note: y axis is frequency of categorical variables: x axis are categorical variables: Toilet Type: HTWCS—house toilet with access to central sewerage, HTWOCS—house toilet without access to central sewerage, POT—private outside toilet in the yard, ST—sharing toilet with neighbors; Other; Safety of Toilet Location (how far away the toilet is from drinking water source): 5–10 m, 11–30 m, 31–50 m, more than 50 m; Design of Toilet (construction of toilet): Wood, Brick, Metal, Flat slate, Plastic, Other; Toilet Utilization (type): Backfilling of cesspool, Manual cleaning, Mechanical cleaning using fecal pumps, sewerage machine, Biological cleaning, Chemical cleaning, Other; Ingredient Toilet Waste: Plastic, Domestic wastes, Paper, Food waste, Other; Waste Water Location (where waste water flows down): CSS—centralized sewer system, YST—yard Storage tank, CST—centralized storage tank or storage tank is shared with neighbors, WDC—without designated collector, OHU—other household usage (watering the garden, for pets), 6—other.
Sustainability 16 07625 g007
Figure 8. Distribution of responsibility parameters of respondents in rural areas of Pavlodar area. Note: y axis is frequency of categorical variables: x axis are categorical variables: Resp For PP (Responsibility for public pumps), Resp For CWSS (Responsibility for central water supply system), Resp For WSafe (Responsibility for drinking water supply safety), Resp ForT (Responsibility for proper maintenance of toilet) and Resp For WWU (Responsibility for waste water utilization): Household owner, The state, Private company, Village residents council, Other.
Sustainability 16 07625 g008
Figure 9. Cross-tabulation of drinking water source and satisfaction of respondents in rural areas of Pavlodar rural area. Note: y axis is Drinking Water (source): Drinking Water (Water sources): CWSSIT—central water supply system with inside tap, CWSSOT—central water supply system with outside tap, PWIPS—public water intake pump on the street, PWWOWSH—private wells without water supply to the house, PWWWSH—private wells with water supply to the house, PW—public well, PBWWSH—private borehole with water supply to the house, PBWOWSH—private borehole without water supply to the house, PB—public borehole, IW—imported water, BWS—bottled water from the stores, SW—spring water, RW—river water, BWS—bottled water from the stores, PWS—purified water from the stores, BWIP—bottled water imported and paid for, FTW—free trucked-in water, SW—spring water; Other; x axis is Drinking Water Satisfaction (respondents’ satisfaction on drinking water): Fully satisfied, Rather satisfied, Rather unsatisfied, Fully unsatisfied, Difficult to answer.
Sustainability 16 07625 g009
Figure 10. Cross-tabulation of drinking water source and complaints of respondents in rural areas of Pavlodar rural area. Note: y axis is Drinking Water (source): CWSSIT—central water supply system with inside tap, CWSSOT—central water supply system with outside tap, PWIPS—public water intake pump on the street, PWWOWSH—private well without water supply to the house, PWWWSH—private well with water supply to the house, PW—public well, PBWWSH—private borehole with water supply to the house, PBWOWSH—private borehole without water supply to the house, PB—public borehole, IW—imported water, BWS—bottled water from the stores, SW—spring water, RW—river water, BWS—bottled water from the stores, PWS—purified water from the stores, BWIP—bottled water imported and paid for, FTW—free trucked-in water, SW—spring water; Other; x axis is Drink Water Complaints (complaints of respondents): Bad smell, Muddy water, Hard water, Salty water, Poor taste, Sediment, No complaints.
Sustainability 16 07625 g010
Figure 11. Cross-tabulation of drinking water source and purification of respondents in rural areas of Pavlodar rural area. Note: y axis is Drinking Water (source): CWSSIT—central water supply system with inside tap, CWSSOT—central water supply system with outside tap, PWIPS—public water intake pump on the street, PWWOWSH—private well without water supply to the house, PWWWSH—private well with water supply to the house, PW—public wells, PBWWSH—private borehole with water supply to the house, PBWOWSH—private borehole without water supply to the house, PB—public borehole, IW—imported water, BWS—bottled water from the stores, SW—spring water, RW—river water, BWS—bottled water from the stores, PWS—purified water from the stores, BWIP—bottled water imported and paid for, FTW—free trucked-in water, SW—spring water; Other; Water Purification Use: Yes—respondents use purification, No—respondents do not use purification.
Sustainability 16 07625 g011
Figure 12. Cross-tabulation of drinking water purification and methods of respondents in rural areas of Pavlodar rural area. Note: y axis is Water Purification Use: Yes—respondents use purification, No—respondents do not use purification; x axis is Water Purification Method: Filtration, Boiling, Passed through gauze, Other.
Sustainability 16 07625 g012
Figure 13. Cross-tabulation of drinking water purification and complaints of respondents in rural areas of Pavlodar rural area. Note: y axis is Water Purification Use: Yes—respondents use purification, No—respondents do not use purification; x axis is Drink Water Complaints (complaints of respondents): Bad smell, Muddy water, Hard water, Salty water, Poor taste, Sediment, No complaints.
Sustainability 16 07625 g013
Figure 14. Cross-tabulation of Location of Toilets and complaints of respondents in Pavlodar rural area. Note: y axis is Safety Location of Toilet (how many meters toilet locates from drinking water source): 5–10 m, 11–30 m, 31–50 m, More than 50 m; x axis is Drink Water Complaints (complaints of respondents): Bad smell, Muddy water, Hard water, Salty water, Poor taste, Sediment, No complaints.
Sustainability 16 07625 g014
Figure 15. Cross-tabulation of sanitary Wastewater Collector Location and complaints of respondents in Pavlodar rural area. Note: y axis is Waste Water Location (where waste water flows down): CSS—centralized sewer system, YST—yard storage tank, CST—centralized storage tank or storage tank is shared with neighbors, WDC—without designated collector, OHU—other household usage (watering the garden, for pets), 6—other; x axis is Drink Water Complaints (complaints of respondents): Bad smell, Muddy water, Hard water, Salty water, Poor taste, Sediment, No complaints.
Sustainability 16 07625 g015
Figure 16. Piper diagram of drinking water source samples of Pavlodar rural area. the ternary plot of cations is on the left (x axis with red numbers—Ca2+, y axis with blue numbers—Mg2+, z axis with green numbers—Na++K+); the ternary plot on anions is on the right side (x axis with red numbers—Cl, y axis with blue numbers—SO42+, z axis with green numbers—HCO32−+CO33−). Drinking water sources: 0—private wells at private houses with water supply to the house, 1—central water supply system with inside tap, 2—water tower, 3—spring water, 4—river/lake water, 5—free trucked-in water, 6—private boreholes at private houses without water supply to the house, 7—private wells at private houses without water supply to the house, 8—public wells, 9—Complex Block Module, 10—private hand well.
Sustainability 16 07625 g016
Figure 17. Chemical substances in drinking water samples of rural areas of Pavlodar region that are above the Maximum Permissible Concentration (MPC). Darker shaded areas are above the maximum, green colors are below MPC.
Sustainability 16 07625 g017
Figure 18. Correlation matrix of complaints and water source supply and sanitation conditions of respondents in Pavlodar rural area. Questionary Data: Gender, Domestic Water (type), Drinking water (source), Drink Water Store (where respondents store the drinking water), Drinking Water Satisfaction (respondents’ satisfaction with drinking water), Water Purification Use, Water Purification Method, Toilet Type, Safety Toilet Location (how far away the toilet is from the drinking water source), Design of Toilet (construction of toilet), Toilet Utilization (type), Ingredient Toilet Waste, Waste Water Location (where waste water flows down), Resp For PP (responsibility for public pumps), Resp For CWSS (responsibility for central water supply system), Resp For WSafe (responsibility for drinking water supply safety), Resp ForT (responsibility for proper maintenance of toilet), Resp For WWU (responsibility for waste water utilization); Chemical parameters of drinking water: General Hardness, meq/L, TMA (total microbial amount), *104/L, pH, WQI (Water Quality Index); Complaint (complaints of respondents): 1—bad smell, 2—muddy water, 3—hard water, 4—salty water, 5—bad taste, 6—sediment, 7—no complaints.
Sustainability 16 07625 g018
Table 2. Drinking water sanitary norm of the chemical substances of Kazakhstan [22].
Hydro-Chemical CompositionDrinking Water Maximum Permissible ConcentrationHydro-Chemical CompositionDrinking Water Maximum Permissible Concentration
Chlorides, mg/L350Dry residue mg/L1000 (1500)
Phosphates, mg/L3.5pH6–9
Hydro carbonates30–400Mineralization, mg/L1000 (1500)
Carbonates, mg/L Iron, mg/L0.3
Nitrates, mg/L45Carbonates hardness, meq/L7 (10)
Sulfates, mg/L500Calcium, mg/L
Total anions Magnesium, mg/L
Color, º20 (35)Natrium, mg/L, Kalium, mg/L200
Manganese, mg/L0.1 (0.5)Total cations
Table 3. WQI and corresponding water quality status by Horton.
NWQIStatusPossible Usages
10–25ExcellentDrinking, Irrigation and Industrial
226–50GoodDomestic, Irrigation and Industrial
351–75FairIrrigation and Industrial
476–100PoorIrrigation
5101–150Very PoorRestricted use for Irrigation
6Above 150Unfit for DrinkingProper treatment required before use
Disclaimer/Publisher’s Note: The statements, opinions and data contained in all publications are solely those of the individual author(s) and contributor(s) and not of MDPI and/or the editor(s). MDPI and/or the editor(s) disclaim responsibility for any injury to people or property resulting from any ideas, methods, instructions or products referred to in the content.

