Article

The Mediating Role of Environmental Uncertainty in the Impact of Information Technology on Supply Chain Performance

by
Ibrahim Ethem Dağdeviren
*,† and
Sakir Mirza
Department of Logistics, Eşme Vocational School, Uşak University, Uşak 64000, Turkey
*
Author to whom correspondence should be addressed.
These authors contributed equally to this work.
Sustainability 2024, 16(17), 7667; https://doi.org/10.3390/su16177667
Submission received: 4 June 2024 / Revised: 4 August 2024 / Accepted: 27 August 2024 / Published: 4 September 2024

Abstract

:
In a period in which competition and globalization are increasing day by day, the competition of companies exists among supply chains. To have and sustain competitiveness in the supply chain context, information technologies should be used, supply chain performance should be measured at certain intervals, and environmental uncertainty should be taken into account. In this framework, the purpose of this study is to examine the relationship between information technologies and supply chain performance and to investigate whether environmental uncertainty has a mediating role in this relationship. For this purpose, 192 data points were obtained via a survey obtained from the top 500 international companies active in Turkey and analyzed with SAS software. Resulting from the analysis, it was determined that there is a significant relationship between information technologies, environmental uncertainty, and supply chain performance, and between information technologies and environmental uncertainty. It is concluded that environmental uncertainty has a significant effect on supply chain performance, and information technologies have a significant effect on environmental uncertainty. In addition, it has been determined that information technologies have a significant effect on supply chain performance, and environmental uncertainty has a medi-ating role in this effect. According to the results of this study, managers are suggested to increase their supply chain performance by using information technologies and to consider environmental uncertainty to achieve a sustainable competitive advantage.

1. Introduction

With globalized and digitalized world trade, supply chains (SCs) have strategic importance for companies. To be successful in the field of SCs, information flow must be carried out precisely, continually, and smoothly. In this framework, companies can create a virtual network with SC members by using information technologies (ITs) [1]. As the complexity of SC activities and number of SC members increase, the need for IT increases [2]. With the introduction of Industry 4.0, IT has caused great changes [3], especially in the decision-making phase and critical management of SCs. Therefore, with the digital transformation provided by Industry 4.0, digital SCs have emerged recently, and many companies, especially sector leaders that intend to be successful in information flow, have started to invest in IT considerably [4]. Today, those companies that are able to adapt the changes are successful and they are in competition with each other to benefit more from the IT.
With the increasing importance of the SC, it has become critical to regularly measure the SC’s performance for its success. By measuring the SC performance, companies can have the opportunity to compare their performance with past periods. Improvements should be made if low performance results are obtained; thus, productivity and quality can be increased [5]. In addition, new goals can be set by strategic planning [6]. Although companies use IT to measure their SC performance, environmental uncertainties can affect the decisions and results. Environmental uncertainties can be defined as “changes in internal and external conditions that affect the SC structure, performance, and strategy” [7]. Due to the rapid changes in technology and environmental uncertainties [8], it is difficult for companies to forecast the innovations that might be introduced by the competitors [9]. Increasing levels of uncertainty cause difficulties in the decision-making process, which may lead to erroneous decisions. Although environmental uncertainties can cause crises in companies, they may create some opportunities as well [10]. To this end, companies need to analyze the environment accurately and act swiftly against opportunities and threats [11]. This strategy has been supported by the studies conducted by several researchers in the literature. If companies are agile, strategically flexible, and entrepreneurial, they can perform better in the case of high environmental uncertainty. Additionally, they may seize various opportunities by acting innovatively and properly [12,13,14,15,16]. Therefore, IT and environmental uncertainty have a significant impact on the success of companies in SCs. In this context, this study aims to examine the relationship between IT and SC performance and to investigate whether environmental uncertainty has a mediating role in this relationship. To this end, we focus on the question “Does information technology affect supply chain performance and is there a mediating role of environmental uncertainty on this effect?”.
In the literature, there is no study examining the relationship between the variables and the subdimensions of them in the mediator variable dimension. Therefore, we intend to contribute to this field by presenting a robust model that can predict the variables accurately and precisely. The top 500 companies, which have great impact on the economy and a functional SC structure, are selected as the research population. The results of this study may play a critical role in the decision-making process of these companies. The first step is to gather data about IT, SC performance, and environmental uncertainty and then to devise a model based on the obtained findings. At the final stage, the contributions of the model to theory and practice, its limitations, and possible suggestions are discussed.

2. Conceptual Framework

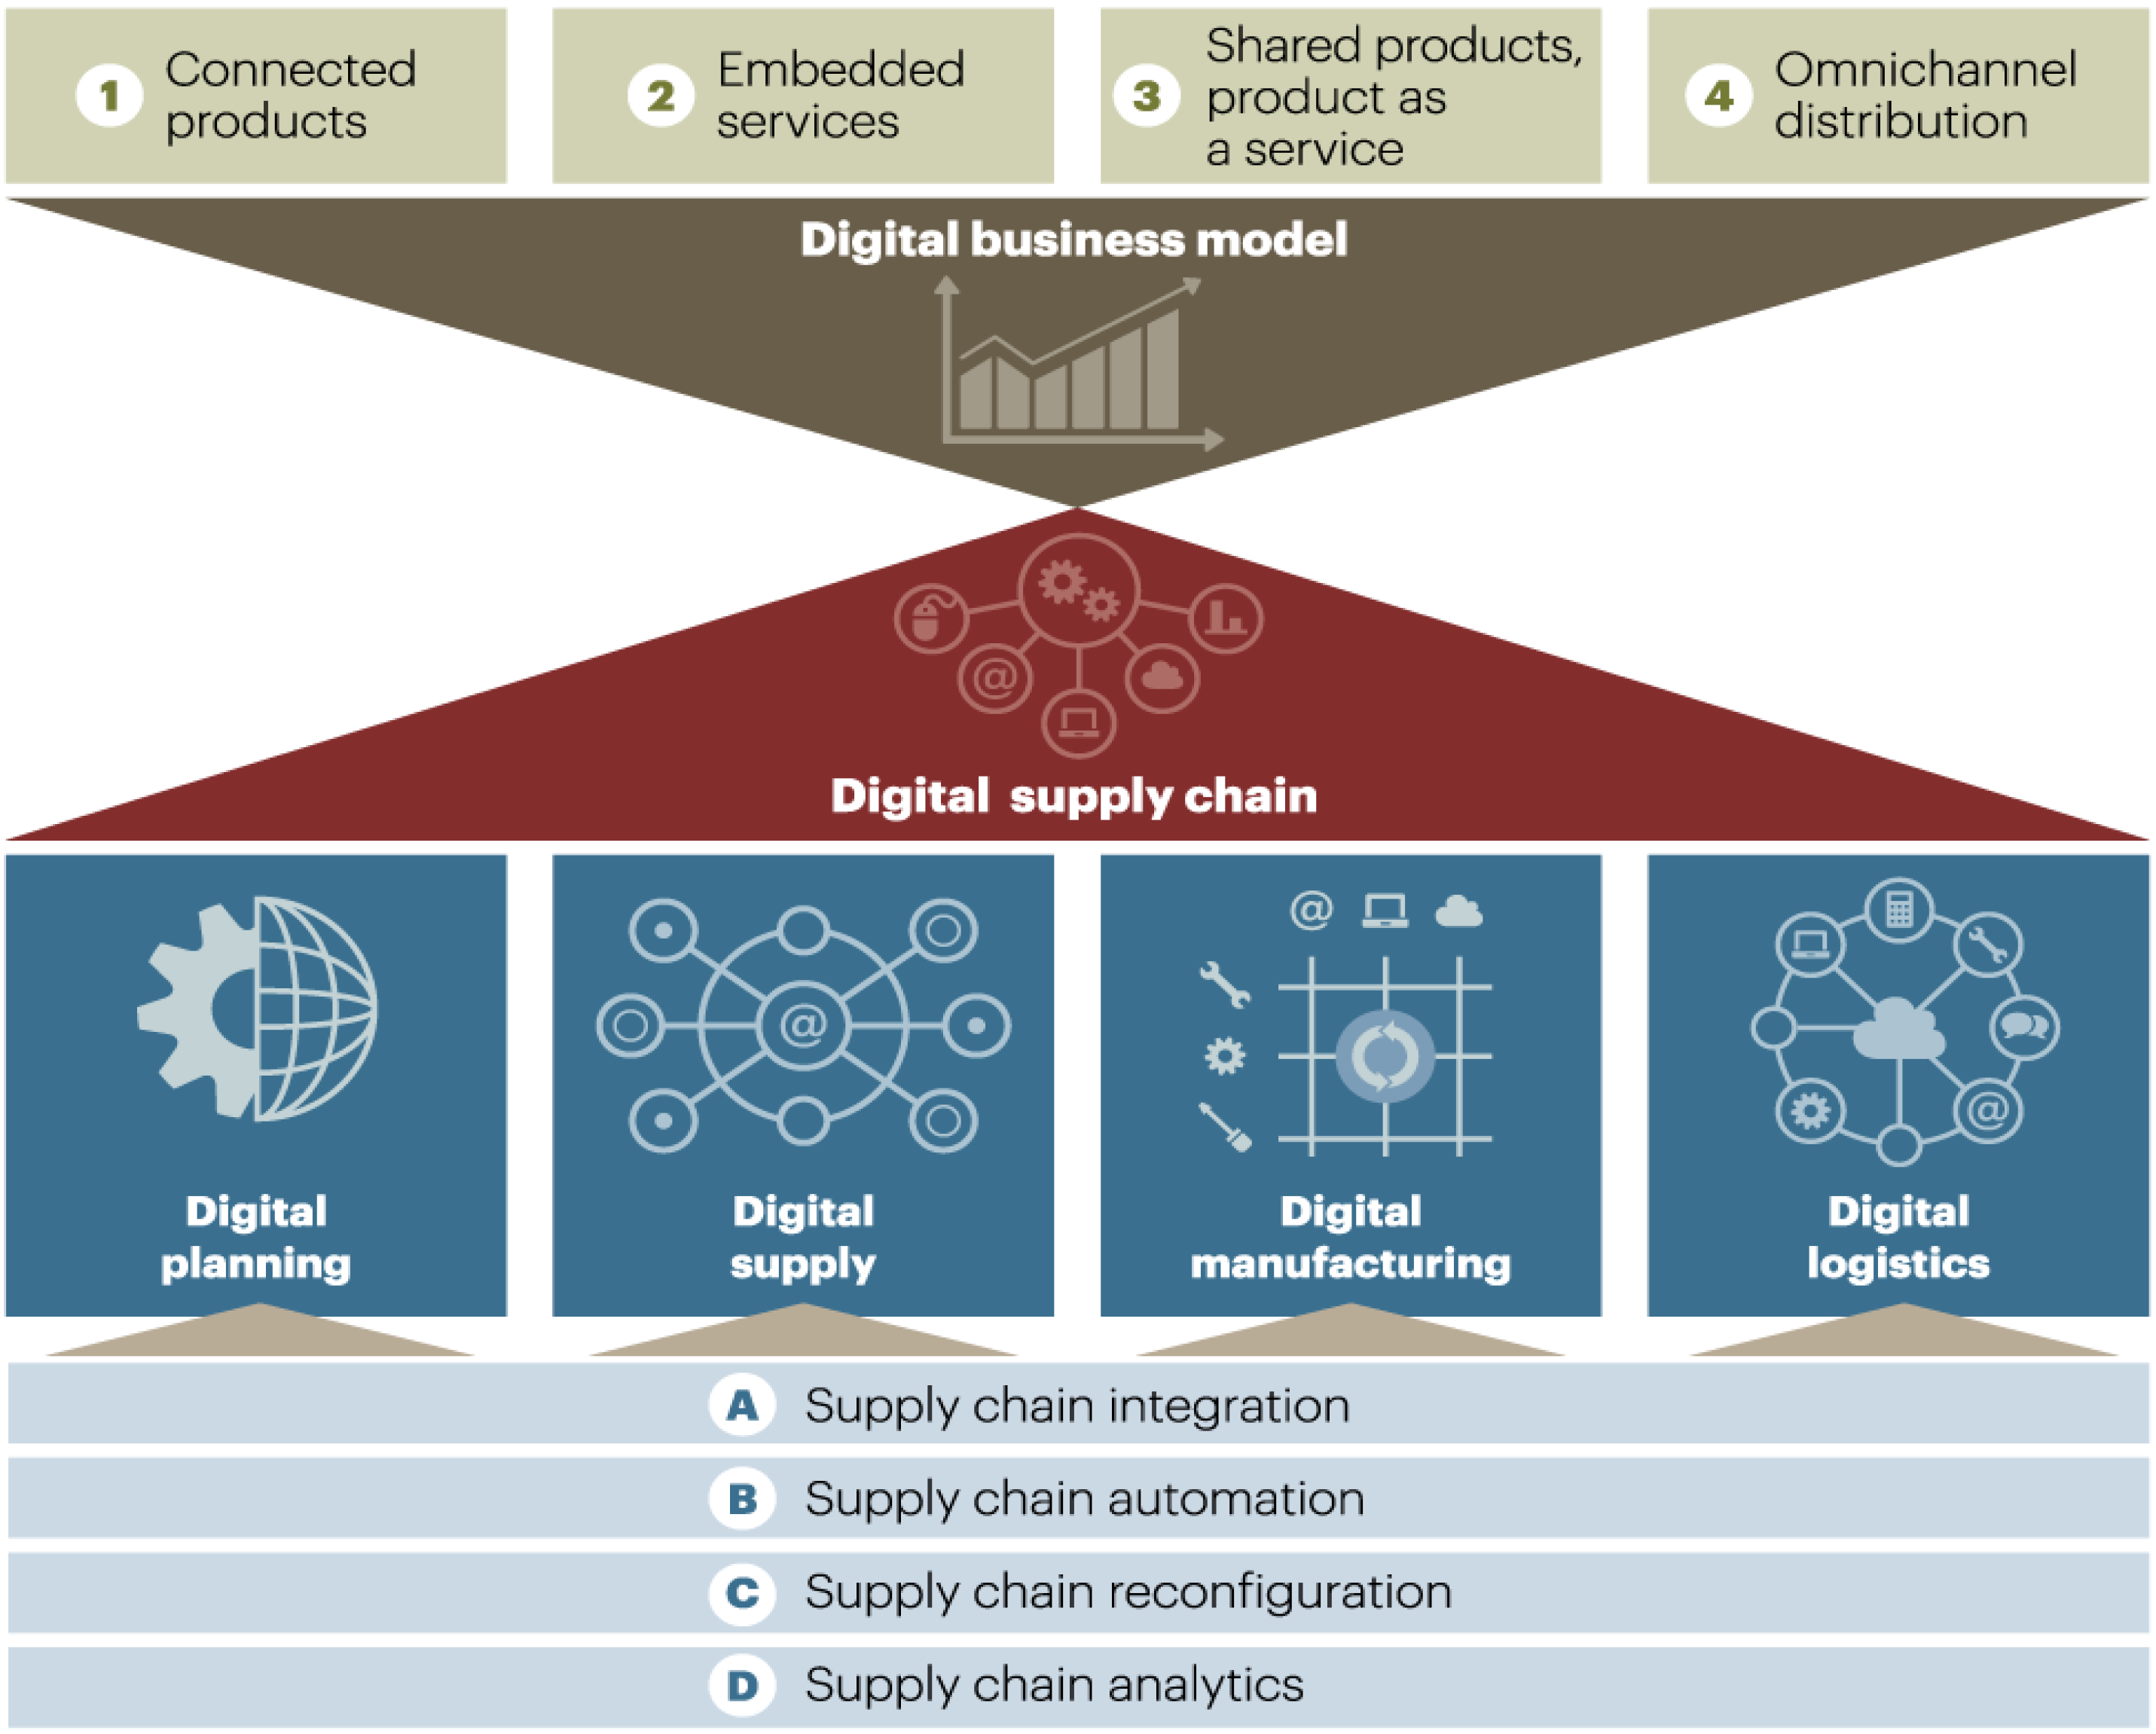
2.1. Strategic Importance of Information Technologies in Supply Chains

IT, expressed using various terms such as information systems, information communication technologies, and information and communication technologies, has led remarkable changes all over the world [17,18]. Transitioning from an industrial society to an information one enables us to access and share information anywhere and at any time [19]. Thanks to the developments in IT, information has become as important as the goods or services produced by companies [20]. Managing information flow is the prominent factor for success [1], and IT provides a useful tool to achieve this.
In a globalized and digitalized world trade, companies compete at SCs. To ensure successful SC management, it is essential to create a continual virtual link between companies and IT [1]. In the presence of intense competition, there must be a complete, timely, and uninterrupted flow of information among SC members [21]. The enhanced complexity of the SC activities has increased the need for IT and has made it paramount [2]. To this end, the information obtained in all national and international activities should be stored and analyzed and shared among the members instantly via IT [21].
Since the success of the SC is based on speed and communication [22], IT can be utilized in the decision-making and management stages in the SC. Managers in the SC need various information to forecast customer needs, stock levels, and inventory transactions [23]. IT has started to be used widely in performance measurement because of the increasing competition [24]. Moreover, the use of IT has become essential to ensure integration between chain members and business departments. As a result, companies invest substantially in IT, also known as the brain of SCs, for many processes such as collecting, analyzing, and distributing information [23].
The utilization of IT, also used by companies to prevent failures in SCs, especially in sectors where high competition exists, has a long history [25]. Recently, Industry 4.0 has started to be employed in various areas in the SC and has provided huge improvements [3]. It has accelerated the digitalization process, and these technological developments have started to be called a “digital supply chain” in the SC [4]. Queiroz et al. [26] define digital SC management as “an intelligent best-fit technological system that is based on the capability of massive data disposal and excellent cooperation and communication for digital hardware, software, and networks to support and synchronize interaction between organizations by making services more valuable, accessible and affordable with consistent, agile and effective outcomes”. Not only factories but also the structure of the SC become smarter by means of the digital transformation provided by Industry 4.0. Hence, the importance and use of IT is expected to increase exponentially [27].
The digital transformation enables the realization of SCs and logistics activities tailored to customers [28], and is shown in Figure 1. In the digital SC, planning, procurement, production, and logistics activities should be digitalized using IT. In addition, it has become a necessity to integrate, automate, restructure, and analyze the SC at these stages. It is important to ensure the integration of resources, production, and delivery processes in the digital SC. To do so, efforts should be spent on the use of IT in companies. Thanks to the use of IT, a digital SC is created and savings surge in terms of time, money, and resources. It is high likely for annual productivity to increase by 4.1% and for income to increase by 2.9% [29]. Therefore, companies in different sectors such as DHL, Turkish Airlines, Amazon, Alibaba, and DB Schenker are increasing their investments day by day to create a digital SC by using IT [30]. Companies can identify opportunities and threats more easily by means of digitalization in the SC.
Furthermore, the digital transformation of products and services may open a door to interaction with customers, suppliers, and other channel members. As a result of digitalization in planning, procurement, production, and logistics, the structure of the SC can be reorganized; it can be integrated and analyzed. In this framework, companies can obtain a competitive advantage in the digital SC by using the latest technologies such as electronic data interchange (EDI), internet, enterprise resource planning (ERP), radio frequency identification (RFID), big data, smart factories, artificial intelligence, smart logistics, unmanned aerial vehicle, cloud-based systems, robotics, augmented reality, simulations, 3D printers, digital twins, Internet of Things, augmented reality, and blockchain [19,31,32,33]. Evidently, the use of IT may differ among companies as well as the countries (Organization for Economic Co-Operation and Development [34]). Therefore, companies that follow these technologies closely can integrate the IT solutions into their systems and take advantage of significant opportunities in the sector compared to other companies.
Figure 1. Digital supply chain [35]. Copyright A.T. Kearney, 2015. All rights reserved. Reproduced with permission.
Sustainability 16 07667 g001
Information systems, which are groundbreaking in the context of Industry 4.0, connect companies to their suppliers and customers [19], enabling companies to gain benefits in various areas. Thanks to information systems, enterprises gain a sustainable and competitive advantage by providing infrastructure support to the value chain, reducing costs and gaining cost leadership [36]. Therefore, companies are investing in IT and using it to share information more easily and increase cooperation with customers and suppliers in the value chain [37]. Thus, the information required for issues such as customer demand, production capacity, product flow, etc. [38], can be shared more easily at a lower cost among the members of the SC, and business activities can be carried out more effectively [39]. IT contributes to the integration of the SC [40] and the reduction in the whiplash effect [41], and has great importance in the effective use of existing resources and the division of labor [42]. In addition, IT may be also utilized efficiently to increase productivity, develop new products, and enhance the quality of products and services [19]. Although IT helps companies make the right decisions and deal with uncertainties [38], many problems, such as the whiplash effect, increase in uncertainties and costs, decrease in quality, and customer dissatisfaction and irregularity in information flow can arise if it is utilized improperly [43]. Using only one or a few ITs in the SC may not provide required strategic benefits to the SC.

2.2. Supply Chain Performance

The concept of performance, which has French origin, is defined as “the degree of directing and fulfilling the processes related to the objectives and tasks of enterprises” [44]. Performance measurement is defined as “the ascertainment of the efficiency of the methods applied to achieve the objectives” [45]. Accordingly, strategic planning can be conducted, and the level of achievement of the targets can be determined [6]. Garvin stated in 1993 that “If you can’t measure, you can’t manage”, which emphasizes the importance of performance measurement even in an era when there was no intense competition [46]. Therefore, companies need to conduct regular performance measurement and analyze the results. By means of performance measurement, the enterprises can have the opportunity to compare themselves with the competitors and past periods. In addition, it has become crucial to measure performance with respect to increasing competition and a complex SC [47,48]. Thus, activities with low performance can be identified, and necessary improvements can be made to increase productivity and quality [49].
SC performance is “a measurement system used to determine the efficiency of the SC and compare it with other systems” [50]. Measurement of SC performance is vital in terms of determining the problems and accomplishment of companies, analyzing their processes, and determining whether or not customer demand is met and the degree of accomplishment of the targets [51]. To make improvements in the current activities in a company, first, the current situation should be analyzed with respect to performance measurement, and then the necessary actions should be taken to reach the targets. However, performance measurement may not always be perceived positively by some employees and managers. Managers avoid performance measurement because they think it means accountability. Likewise, employees do not prefer performance measurement because they know it adds extra responsibility [52,53]. However, performance measurement provides advantages to managers to make decisions [5]. In addition, the degree of performance of companies not only affects the managers and employees, but also lending institutions, including other members of the SC [54]. Therefore, all SC members can benefit from the measurement of the performance of the SC.
Numerous studies have been conducted in the literature on the measurement of SC performance, and many criteria have been used for the evaluation. However, there is still no consensus on these criteria to be used [41]. While financial criteria were focused on before the 1980s, new criteria were introduced and started to be used as a result of insufficient financial data in parallel with the changes in the world market after the 1980s [55]. Based on the literature, the researchers commonly use cost (resource), flexibility, customer satisfaction (output), and logistics performance as criteria in performance measurement, and these criteria were used in this research.

2.3. Environmental Uncertainty

The uncertainty is defined as “not knowing which outcome of an option with many outcomes will be realized” [56]. Environmental uncertainty is “changes in internal and external conditions that affect SC structure, performance, and strategy” [7]. In particular, developments in technology may cause an increase in environmental uncertainty for companies [8]. In the face of environmental uncertainty, companies find it difficult to predict short-term [9] technological changes, and competitors may introduce new products and services [57]. As uncertainty increases, decision making becomes more difficult, and confidence in the decisions is decreased. Making wrong decisions because of uncertainty can cause significant risks for the future of the companies [10].
If there is a low level of uncertainty in the environment in which companies are active, the demand can be estimated accurately and a company can make more realistic plans. Hence, the achievement level of goals can be high [58]. As environmental uncertainty increases, forecasting the demand can become more difficult as competition increases [59]. Nevertheless, companies have to monitor their activities in a constantly changing environment. Many decisions such as forecasting the demand, capacity plans, establishment location, and production plans have to be taken under the pressure of an uncertain environment that is constantly changing. Since companies do not isolate themselves from the environment, they strive to reduce this uncertainty and be successful by using SC strategies, SC integration, and IT to make the right decisions in an uncertain environment. Consequently, the companies that are open-minded, respond to changes instantly, act agile, and take risk, when necessary, can be successful [60].
Companies should not consider environmental uncertainty as a problem, but should consider it as an opportunity and turn threats into opportunities by developing suitable strategies [61]. In practice, companies may turn environmental uncertainty into an opportunity if they use agile, lean, and postponement SC strategies [62,63,64]. In addition to these SC strategies, having safety stocks and using different simulations are also important for companies [65]. In this context, by adapting the companies to the environment, it can be possible to find a way to minimize the effects of environmental uncertainty. For example, to cope with fluctuations in customer demand, companies can develop and use advanced forecasting techniques to minimize failures and better predict demand. Thus, the effect of demand uncertainty can be minimized [65].
Uncertainties in the SC may also cause problems that are hidden or not noticed by companies [66]. The best example of this is in the recent COVID-19 pandemic. The COVID-19 pandemic, which no one could predict, caused serious interruptions in the SC [67]. The chip crisis took place as a result of it. This demonstrates how environmental uncertainty can have negative effects on SC processes. Consequently, companies have started to focus more on the SC and are investing more in ITs and starting to use them widely [68].
Although environmental uncertainty can lead to crises for companies, sometimes it can lead to opportunities and innovative activities. Hence, it is necessary to analyze and interpret the environment accurately. While the companies that can act agile and respond quickly to opportunities and threats perform better, the performance of others might be inferior [11]. In the literature, environmental uncertainty, which may have a direct impact on the success of companies, is commonly analyzed in four dimensions: technology uncertainty, demand uncertainty, competition uncertainty, and supplier uncertainty.
Technological uncertainty takes place as a result of the technologies that are used in industries, and includes uncertainty about new technological features. The relationship between new technology and the current one may lead to uncertainty as well as the selection of alternative technologies [69]. Technological uncertainty can be decreased by the product lifecycle and time required to introduce new products to the relevant market [70]. In the era of constantly changing technology, enterprises should focus more on investment costs to have automation-based technologies, as they can design and launch a new product in a very short time [60].
If demand uncertainty, which is defined as “the unpredictability of interest and demand for the products offered for sale by the enterprise”, is high, customer orders may change very frequently and, thus, may harm production and planning [71]. Industry trends, conditions related to the distribution channel, size differences in the desired product design, and market segment can lead to the uncertainty in demand [72]. To reduce demand uncertainty, which has a great impact on the performance of the companies, it is necessary to share more information among SC members in a complete and timely manner and to ensure SC integration by using IT [73]. Competitive uncertainty, which is defined as “changes in the competitive environment and uncertainties in the attitudes and methods of competitors” [74], arises when companies have difficulties in predicting the actions of their competitors [75]. Companies may encounter competitive uncertainty because of the uncertainty about future competitors; even if it is predictable, it is not possible to expect what kind of moves those competitors will make [76].
Supplier uncertainty is “the unpredictability of the quality and delivery of the product from the supplier” [73]. The degree of supplier uncertainty [72] arises depending on other active companies in the sector, and increases as the dependence on the supplier increases [69]. Supplier uncertainty, which includes uncertainties such as the cost of the supplied product and product quality, is a significant risk that can cause delays or even halt production, posing a substantial threat to the company [73]. Regarding this uncertainty, companies can take actions against it by establishing long-term trust-based relationships with more suppliers.

3. Aim and Importance of the Study

As the competition among companies is starting to be experienced among SCs, the SC has become more important. Companies that are successful in SC management gain a competitive advantage and can become successful, while companies that fail in this regard may have to withdraw from the market. One of the most important keys to success in the SC is information flow. Uninterrupted, complete, and timely information flow ensures that SC management is effective. Therefore, companies are spending effort to provide the uninterrupted flow of information among chain members by using many various ITs, especially with the help of the increasing digitalization of Industry 4.0. In addition, it is essential for companies to measure SC performance at certain intervals to reveal the results of the strategies used in SC management and the realization of the decisions that are taken. To be better and make the right decisions, the current situation of the business can be determined and necessary improvements can be made by measuring performance.
However, environmental uncertainty may affect the decisions of the enterprise and the performance of the SC. As environmental uncertainty increases, making decisions may become more difficult, and confidence in those decisions may decrease. Since erroneous decisions might also affect the sustainability of the business, necessary steps should be taken to combat uncertainties. In this context, the purpose of this study is to determine the relationship between IT and SC performance and whether environmental uncertainty has a mediating role in this relationship. To best to our knowledge, there is no study in the literature that examines the relationships among the variables and subdimensions of them in the mediator variable dimension. Therefore, this study can contribute to this topic in the literature and provide a new model to the literature by developing a unique model that can be used in future academic studies. In addition, by selecting the top 500 companies determined by the ICI as the research population, we also aim to contribute to these companies, which are prominent in the Turkish economy, with the results of the research. Therefore, the results of this study are important for both the research population and the Turkish economy.

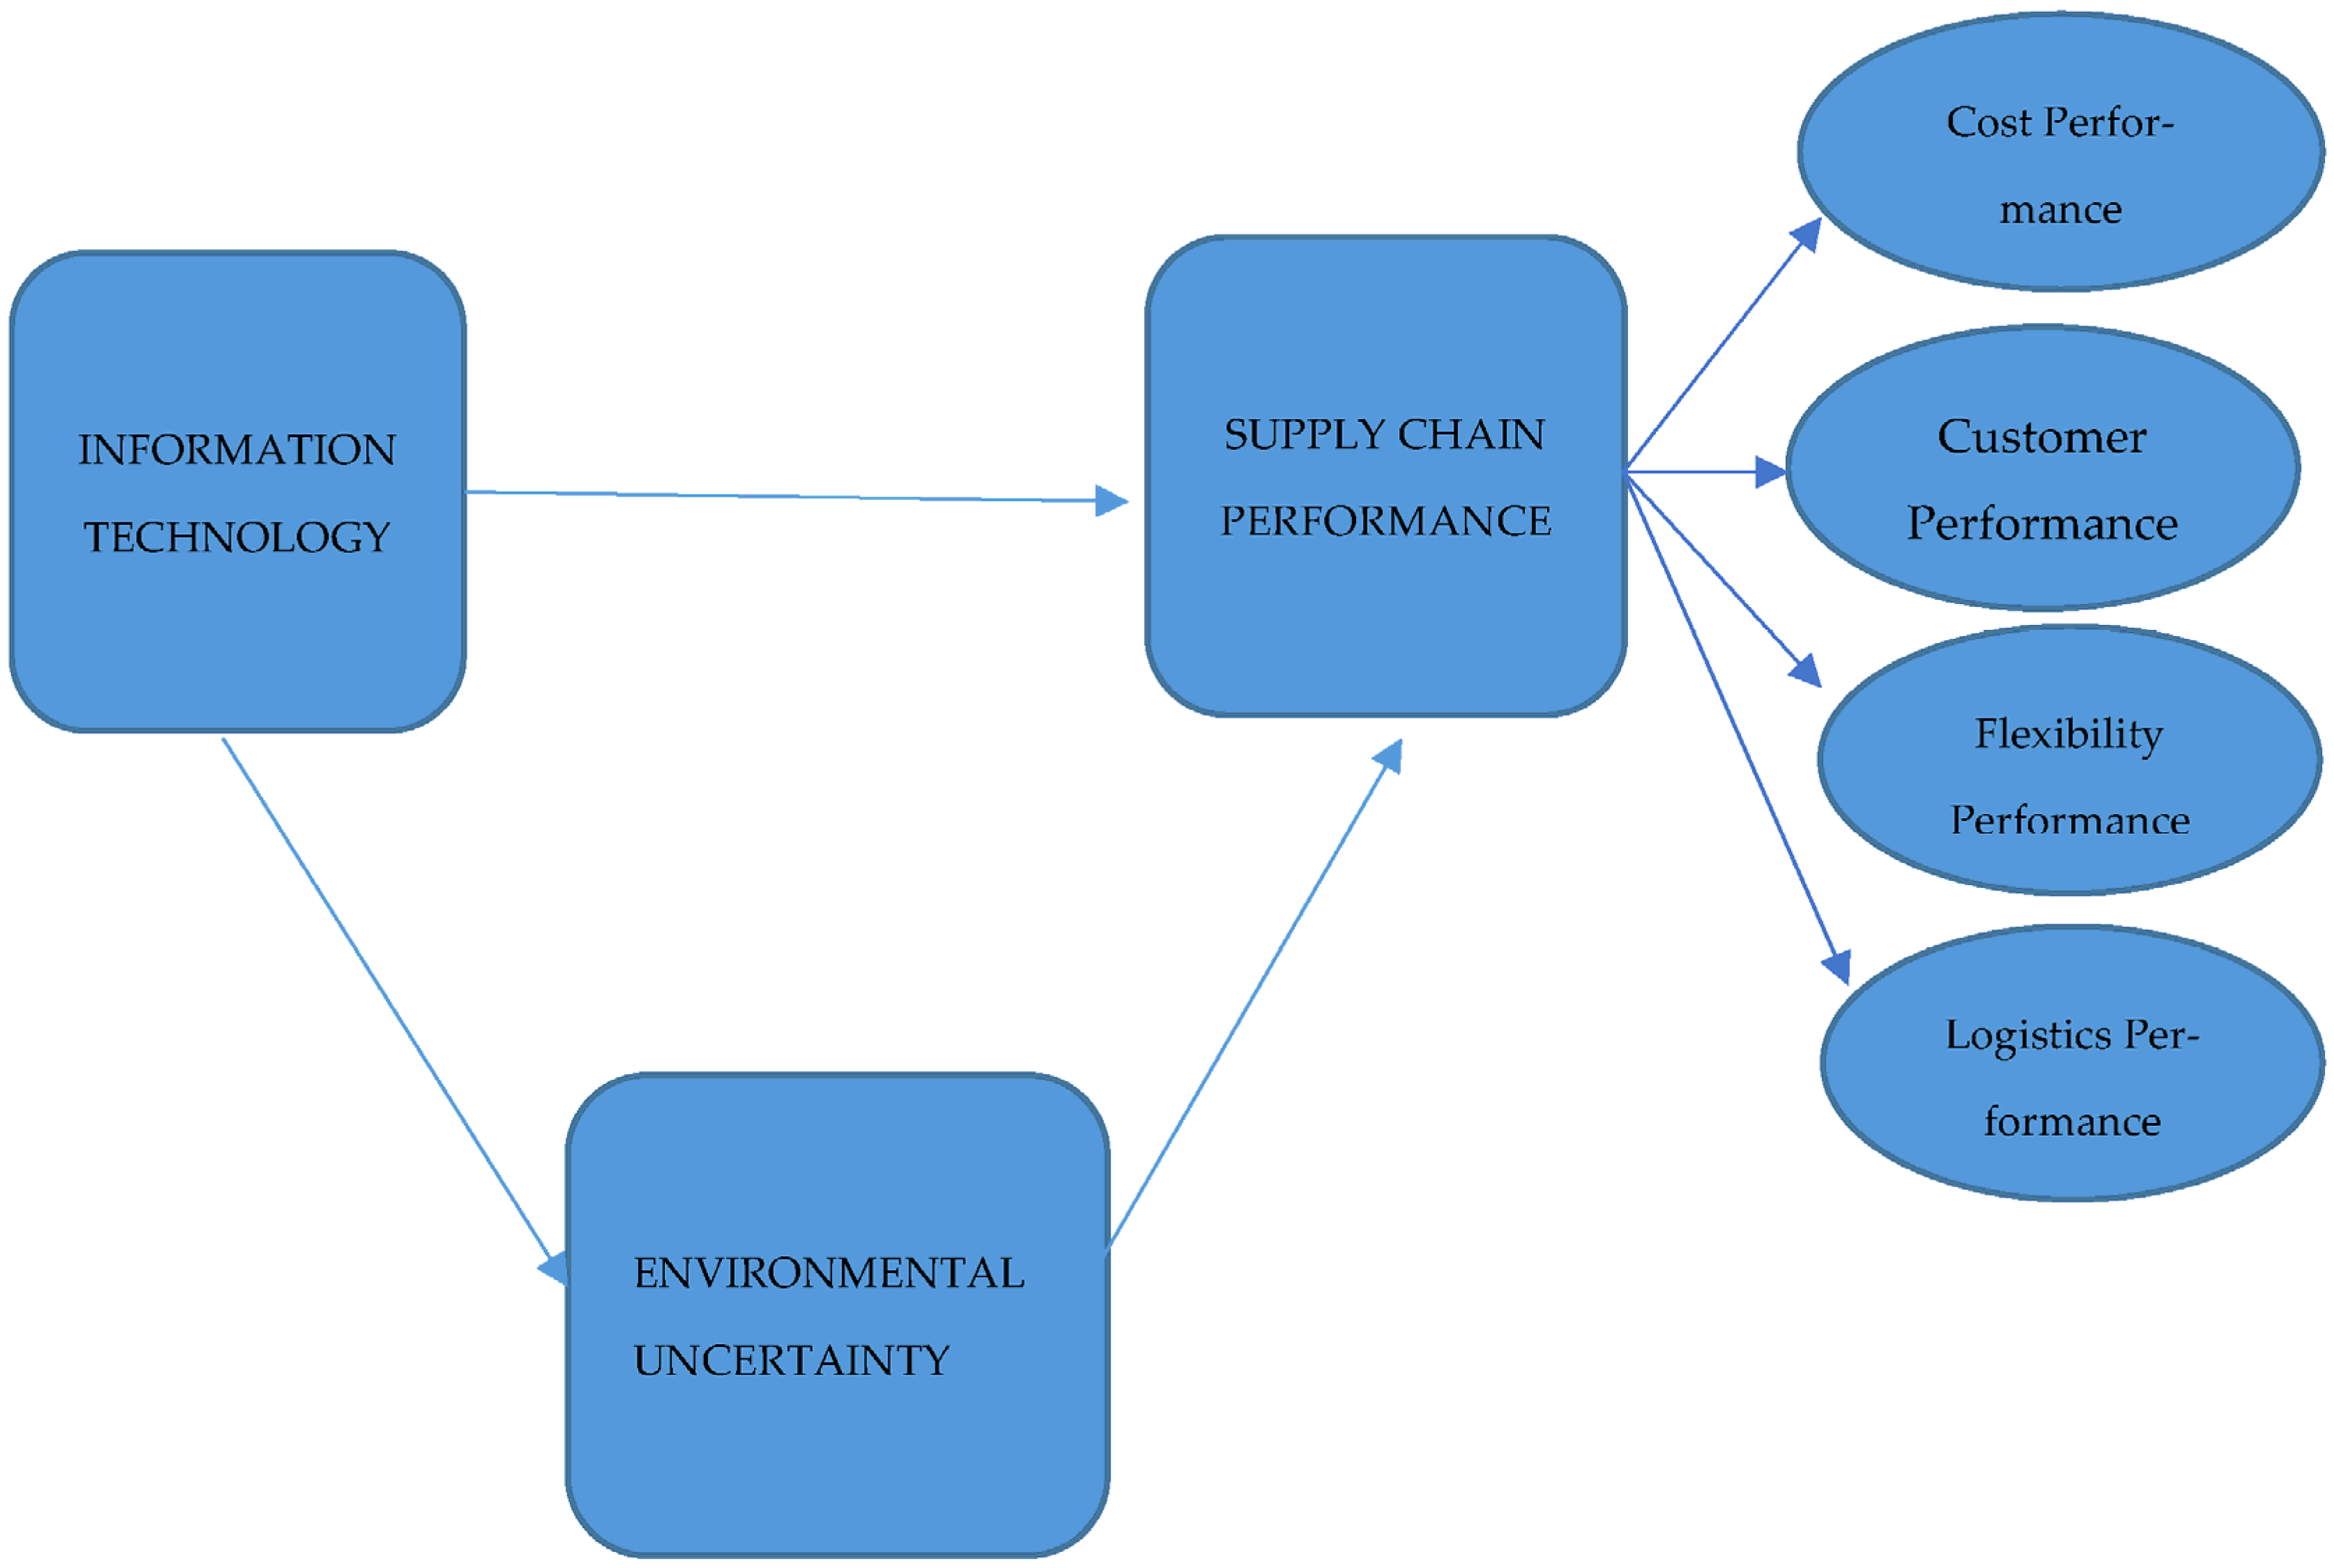
4. Research Model and Hypotheses

Based on the domestic and foreign literature review, the research model was created, as shown in Figure 2. In this study, the relationship among the dependent and independent variables and the mediating role of environmental uncertainty are investigated. The SC has become strategically important for companies as the competition among companies has started to occur through SCs. For the success and effective management of the SC, information flow must be uninterrupted and timely. In this context, companies are taking advantage of intense use of IT to establish a virtual link among SC members and company departments. By planning, executing, and controlling SC activities with IT, they can increase both profitability and customer satisfaction. IT is among the indispensable elements for companies, as those that adapt to digital transformation can ensure the continuity of the company by gaining a competitive advantage today, as in the past. In addition to IT, periodic measurements of the results of the activities in the SC is critical for companies to realize their weaknesses and make comparisons. Although companies use IT and measure their SC performance because they operate in an uncertain environment, it is difficult for them to maintain their competitive advantage. However, doing so is essential for their success and customer satisfaction. Although environmental uncertainty can threaten companies, it can also provide opportunities, leading to the emergence of innovative activities. In this framework, IT, SC performance, and environmental uncertainty variables, which are vital for the continuity of companies, are included in the research model. While IT and environmental uncertainty are commonly analyzed as a single dimension in the literature, it has been determined that SC performance is evaluated within the framework of subdimensions, including cost performance, customer performance, flexibility performance, and logistics performance. A model has been created based on these variables and subdimensions. However, there is currently no study in the literature that examines the relationship among these variables and the role of the mediating variable in this relationship. Therefore, this study is anticipated to contribute to the literature and the researchers who intend to study this subject.
Regarding the literature review, as we mentioned before, the four main hypotheses were constituted and examined with respect to the developed model. In the literature, the relationship between IT and SC performance is widely based on the resource-based approach [77,78,79,80,81]. The resource-based approach is a theory that emphasizes that a sustainable competitive advantage can be achieved via the resources and capabilities of companies [78,82,83]. IT can be also utilized as a tool that increases performance by improving the capabilities of enterprises [78,80]. As IT facilitates the flow of information in the SC, companies can also provide better performance and competitive advantage by obtaining time and cost advantages [78,84,85,86,87,88]. Therefore, companies recognize IT as a part of SC management and invest more in IT [37]. However, some studies in the literature show that ITs do not affect SC performance [86,89]. Hence, it is thought that it is crucial for companies to determine the effect of ITs, which require high costs occasionally, on SC performance; thereby, Hypothesis 1 was established.
H1. 
Information technologies positively and significantly affect supply chain performance.
Given the difficulty for companies to maintain their competitive advantage in an uncertain environment, combating uncertainty is essential for success, sustainability, competitiveness, and customer satisfaction. For this reason, companies benefit from IT to reduce the impact of environmental uncertainty by circumventing the uncertainty or turning it into an opportunity by predicting it. The use of IT aims to minimize the uncertainties that may occur in the SC [90]. According to Lee [91], companies that can carefully follow the developments in IT and integrate them into their system are able to eliminate technological uncertainties as well as eliminate other uncertainties. Although companies implement various strategies to address environmental uncertainty, they may still encounter its negative effects. Therefore, Hypothesis 2 was established to determine the effect of IT, which might be used as a toll to turn the threats created by environmental uncertainty into opportunities.
H2. 
Information technologies positively and significantly affect environmental uncertainty.
In the face of environmental uncertainty, companies determine and implement new methods and practices to adapt to their surroundings and turn threats into opportunities. Thus, an enterprise operating in a highly uncertain environment can recognize various opportunities as well as threats [92]. These environmental uncertainties of companies can create positive or negative effects on their SC performances [65,93]. Ahammad et al. [11] reported that in a condition with high environmental uncertainty, if companies can react to opportunities and threats on time and quickly, SC performance can increase, otherwise performance can decrease. In the literature, it has been indicated that variables increase SC performance in conditions with high uncertainty. In this study, to determine the effect of environmental uncertainty on SC performance, Hypothesis 3 was established.
H3. 
Environmental uncertainty has a positive and significant effect on supply chain performance.
High SC performance is a foremost component of achieving sustainable competitive advantage by increasing market share and profitability. The methods for increasing SC performance are frequently investigated by industry professionals and academics. In some studies, it is reported that by integrating advanced IT into the SC of companies, a successful information flow can be ensured and SC performance can increase. With this idea, companies are investing in IT more and more. However, some studies conclude that IT does not contribute to the increase in SC performance. In addition, it is suggested that environmental uncertainty, which is not known when it occurs, should be taken into consideration by companies because the emergence of unexpected uncertainties may lead to unresolvable results in the SCs of companies. However, companies acting in an environment with high environmental uncertainty may obtain opportunities as well as threats [92]. In the literature, studies focusing on the moderating role of environmental uncertainty in the relationship among various variables are quite widespread [9,94,95,96]. However, there is no study that investigates the mediating role of environmental uncertainty in the effect of information technologies on SC performance. Therefore, Hypothesis 4 was established in this study.
H4. 
There is a mediating role of environmental uncertainty in the effect of information technologies on supply chain performance.

5. Research Population, Sample, and Data Collection Method

The research population consists of Turkey’s top 500 industrial companies in 2022 as determined by the Istanbul Chamber of Industry (ICI) [97]. Among the top 500 companies, 16 of them did not disclose their names and the survey was sent online to the remaining 484 companies. Since the evaluation was made based on the companies, a total of 192 data points were received by collecting one piece of data from each company.
The survey method was used as a data collection method and the scale was created according to the 5-point Likert type. The questionnaire form used in the research consists of four sections. In the first section, there are statements for determining the demographic characteristics of the participants. In the second section, there are statements regarding the IT scale. In the third part, there are statements regarding the SC performance scale. Lastly, in the fourth section, there are statements regarding environmental uncertainty.
The “Information Technology Scale” used in this study is the scale developed by Desarbo et al. [98] and translated to Turkish by Karagöz [99], and validity and reliability analyses were performed. The customer service and cost performance scale used in the SC performance scale is the scale developed by Piprani et al. [100], and the flexibility performance is the scale developed by Huo et al. [101]. The scale translated to Turkish by Gülaslan [78], with its validity and reliability analyzed by her, was used. The logistics performance scale was developed by Tao [102] and translated to Turkish by Yazgan [23], and its validity and reliability analyses were conducted by him. The environmental uncertainty scale was used by Wong vd. [96] and translated to Turkish by Çankaya [103], and its validity and reliability were analyzed by Çankaya.

6. Analysis and Findings of Research Data

In this study, structural equation modeling (SEM) was used to determine whether or not the environmental uncertainty has a mediating role in the relationship between the independent variable IT and the dependent variable SC performance. To this end, the SAS statistical software package (Version 9.4) was used for data analysis.

6.1. Demographic Findings

Table 1 shows the distribution of participants in the survey according to their demographic characteristics. The participants consist of 46.4% female and 53.6% male. The majority of them (53.1%) are undergraduate graduates. According to the participants with SC position, 41.1% are manufacturers, 22.9% are logistics service providers, 11.5% are dealers/retailers, 10.9% are distributors/wholesalers, 9.4% are primary suppliers, and 4.2% are secondary suppliers. According to the number of employees, 34.4% of the participants are companies with more than 501 employees, 31.3% are companies with 250–500 employees, 18.2% are companies with 50–249 employees, and 16.1% are companies with fewer than 50 employees. In terms of sector, the top five sectors are food (27.1%), transport and storage (10.4%), automotive (8.9%), textile (8.9%), plastics/packaging (6.3%), and agricultural products (6.3%). When their positions in the enterprise are analyzed, it is indicated that 23.4% of them are SC/logistics responsible.

6.2. Reliability, Validity Analysis, and Normality Test

Skew values were calculated to determine whether the data obtained from the research were suitable for normal distribution. For the data to be considered suitable for normal distribution, skewness values should fall within the range of +2 to −2. When Table 2 is examined, it is observed that the skewness values are within the range of +2 to −2 and are close to zero. Therefore, it is concluded that all of the scales and subdimensions are suitable for normal distribution, allowing for the application of parametric statistical analysis methods
Cronbach’s alpha reliability coefficients were calculated to test the internal consistency reliability of information technologies, environmental uncertainty, SC performance factors, cost performance, customer performance, flexibility performance, and logistics performance subdimensions used in the research. The results obtained are presented in Table 3 and it is indicated that the internal consistency coefficients vary between the lowest of 0.836233 and the highest of 0.967616. Cronbach’s alpha is required to be at least 0.7 [104]. Therefore, the scales used in this study are highly reliable scales.

6.3. Results of the Relationship between Scales

Correlation analysis was performed to reveal the relationship among IT, environmental uncertainty, and SC performance factors used in this study. The cost performance, customer performance, flexibility performance, and logistics performance subdimension scores were analyzed. The obtained results are presented in Table 4. According to the relationship among SC performance and its subdimensions (cost performance, customer performance, flexibility performance, and logistics performance), there are positive, high, and statistically significant relationships (r = 0.78957, p = 0.0001; r = 0.80538, p = 0.0001; r = 0.83525, p = 0.0001; r = 0.80813, p = 0.0001, respectively). Cost performance, customer performance, flexibility performance, and logistics performance subdimensions were found to have positive, moderate, and statistically significant relationships with each other. There were positive, moderate, and statistically significant relationships among SC performance, IT, and environmental uncertainty (r = 0.61690, p = 0.0001; r = 0.44904, p = 0.0001, respectively). There was a positive, moderate, and statistically significant relationship between environmental uncertainty and IT (r = 0.32525, p = 0.0001).

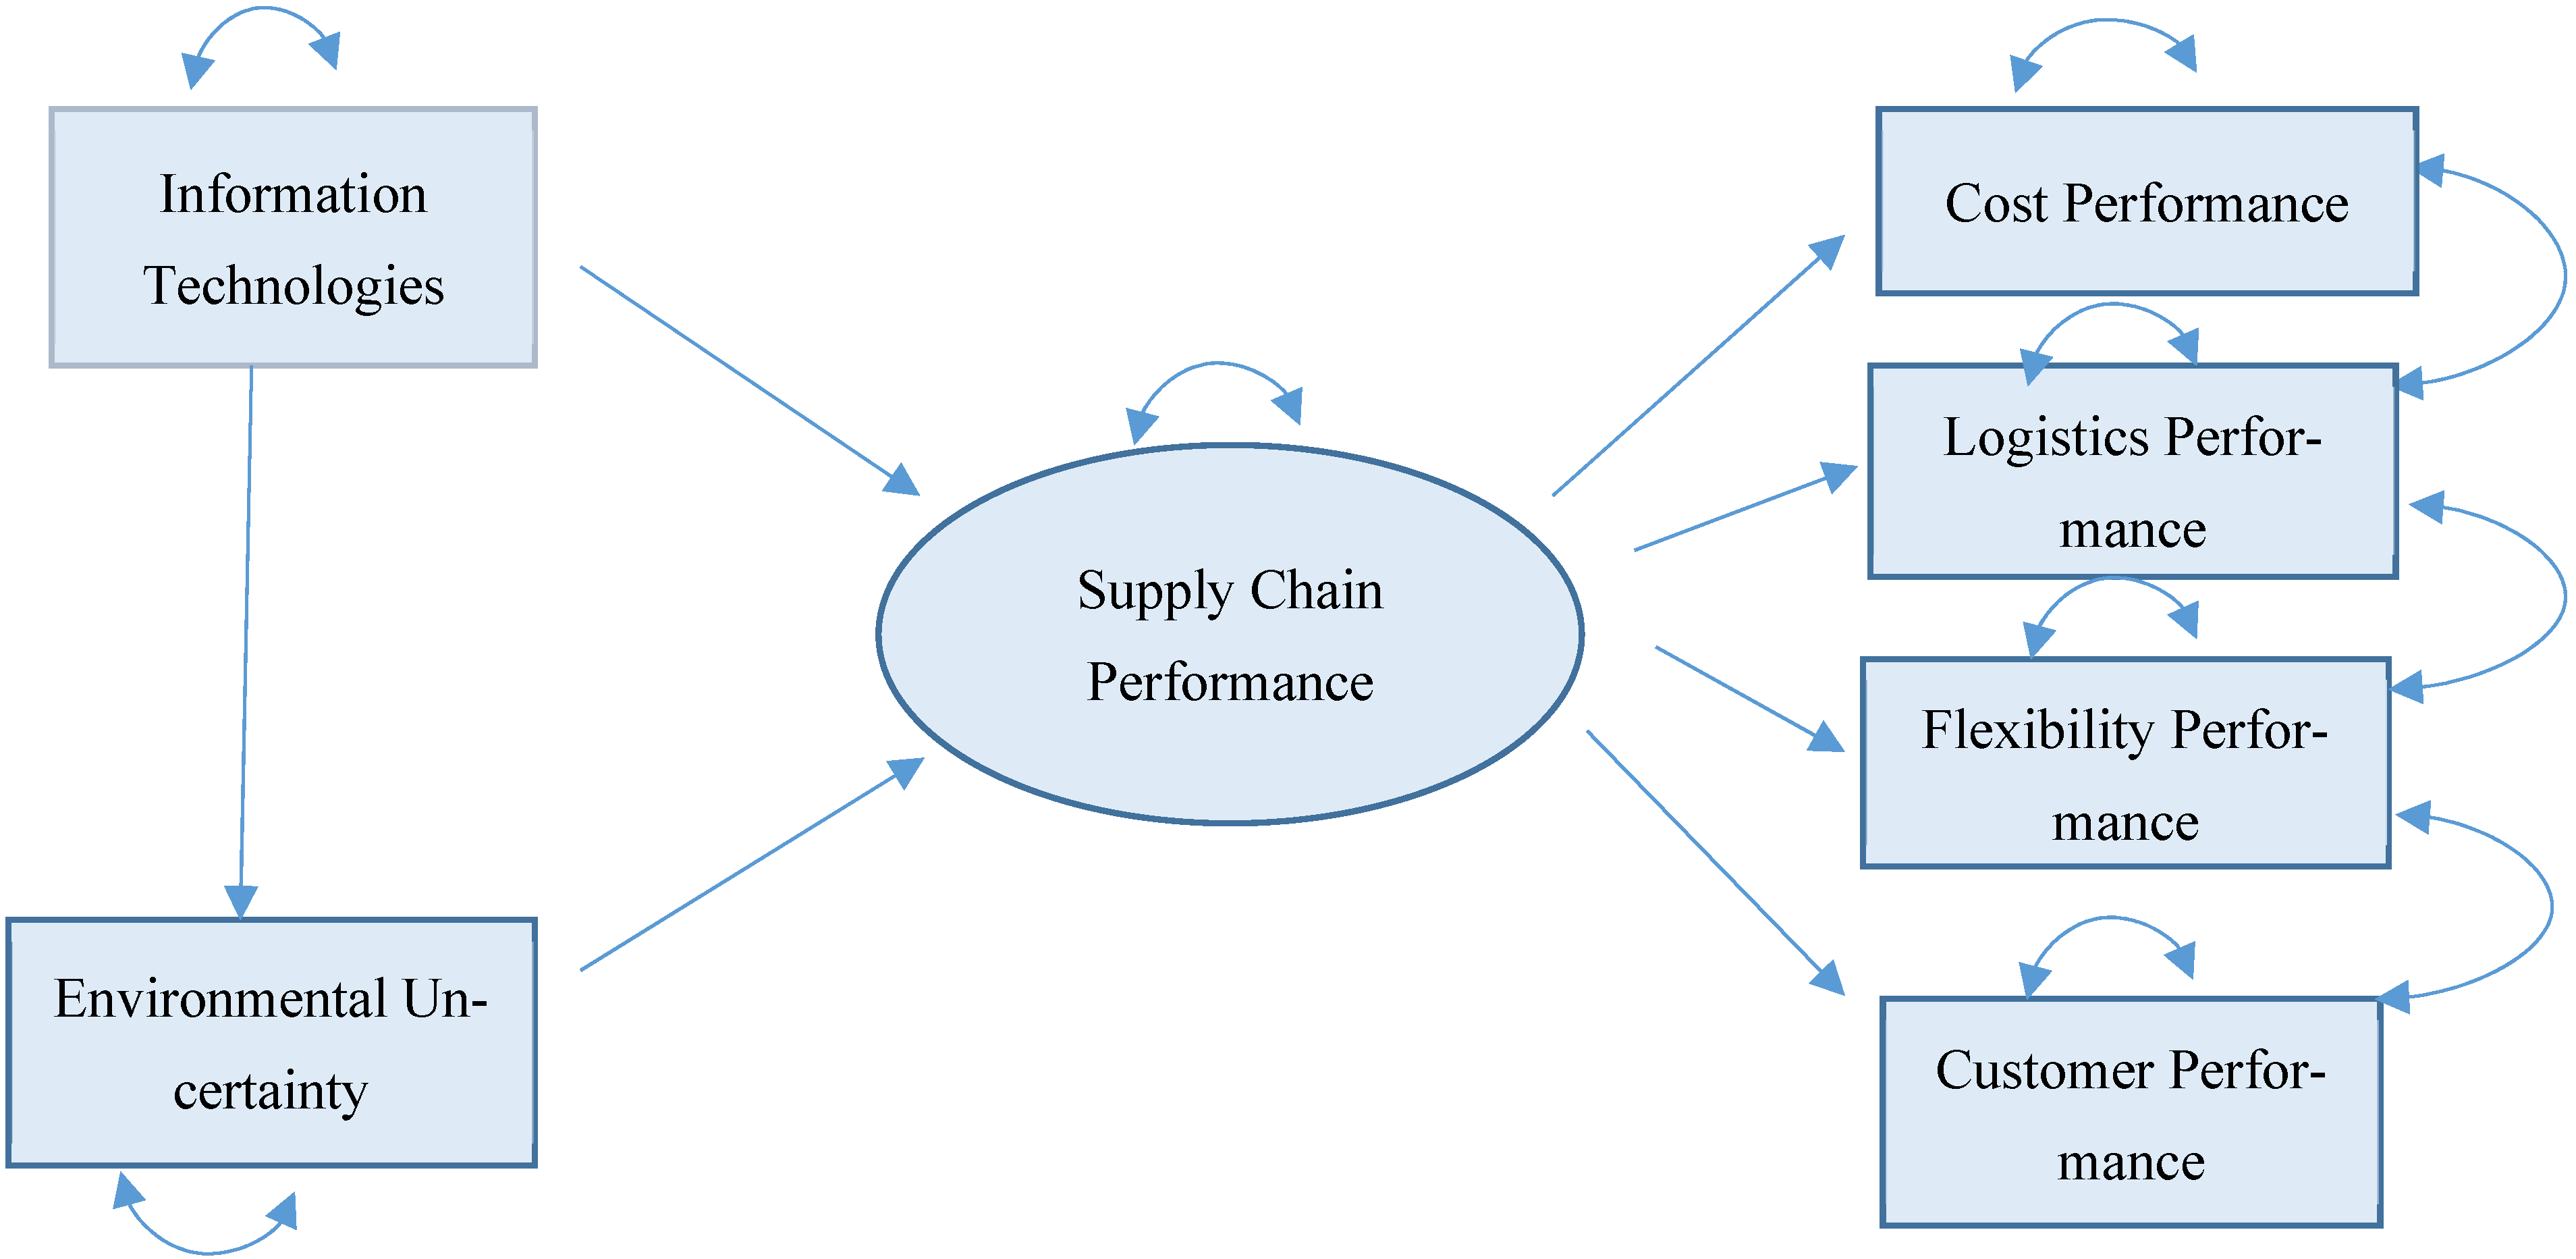
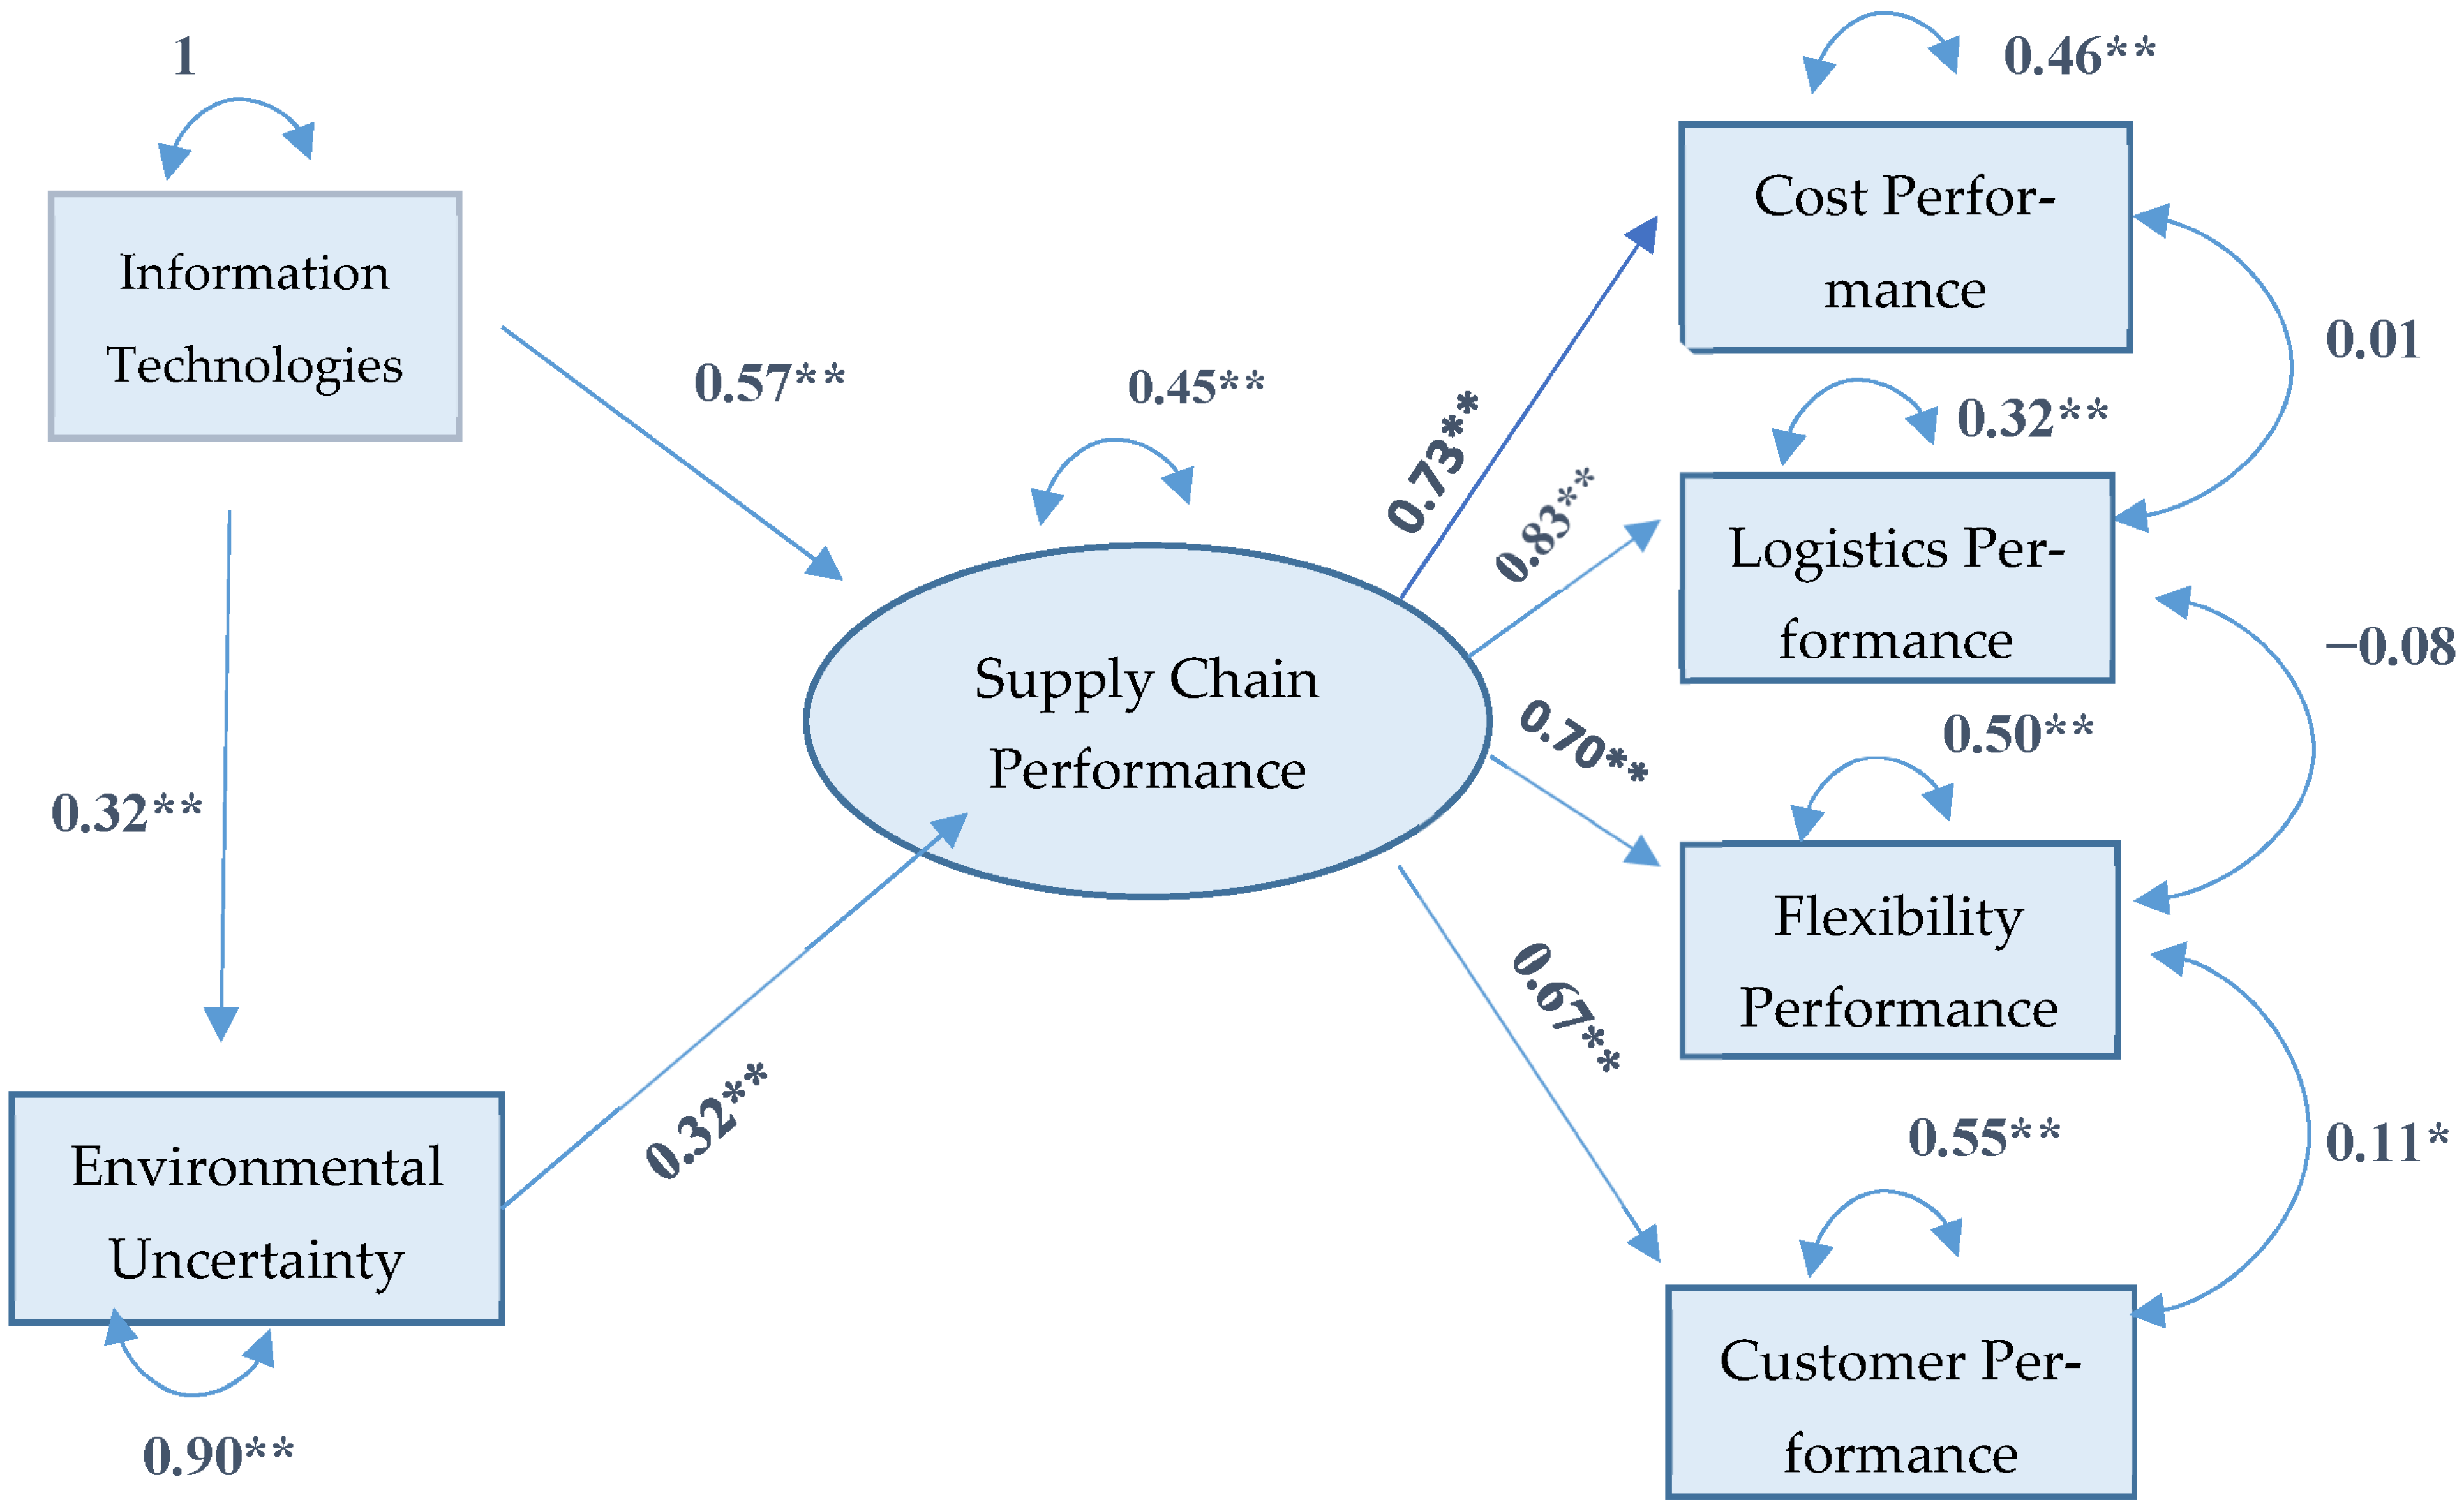
6.4. Testing the Theoretical Structural Model with Path Analysis

The main focus of this research is to reveal whether the SC performance scale, IT scale, and environmental uncertainty scales, which have direct, indirect, and mediating relationships with each other, can be explained by a theoretical structural equation model. The theoretical model tested in this study is presented in Figure 3. The PROC CALIS procedure of SAS 9.4 package program was used to test this theoretical model structure. In this model, it is indicated that information technology and environmental uncertainty scale have a direct effect on SC performance and an indirect effect through IT and environmental uncertainty scale.
In this study, a two-step approach was applied in modeling and analyzing the structural model; one of them is confirmatory factor analysis and the other one is structural equation modeling. Therefore, before constructing the structural model and applying the structural equation modeling, it was necessary to validate all measurement models of latent constructs to verify the measurement models in terms of unidimensionality, validity, and reliability. First, confirmatory factor analysis (CFA) was conducted based on 192 samples to verify the reliability and validity of the proposed theoretical model in Figure 3. Furthermore, the structural equation modeling (SEM) method was applied to test the proposed model.
To determine whether the tested theoretical model was supported by the data of the study, it was necessary to examine the goodness of fit indices values obtained as a result of structural equation analysis. Although a large number of fit index values are used in many studies in many fields, the most commonly used ones are included in this study. One of them is the chi-square (χ2) value, which tests whether the data obtained from our sample are compatible with the model proposed theoretically by the researcher. A nonsignificant chi-square value indicates a good fit. The value obtained by dividing the chi-square value by the degrees of freedom (df) (χ2/df) is equal to or less than two, which indicates that the model is perfectly compatible, and the value between two and five or less than five indicates that the model is acceptable. The other frequently used fit indices are GFI (goodness of fit index), AGFI (adjusted goodness of fit index), RMSEA (root mean square error approximation), CFI (comparative fit index), and NFI (normed fit index). Table 5 shows the robustness of fit indices and good fit value ranges.

6.5. Confirmatory Factor Analysis Results

Confirmatory factor analysis (CFA) was conducted in this study, and the standardized factor loadings, t-test results, and their significance obtained for each item are presented in Table 6. According to the table, it is indicated that all of the standardized factor loadings of the items are above 0.40 and the correlation relations among the variables are significant.
The robustness of fit indices of the confirmatory factor analysis are presented in Table 7. According to the table, it is indicated that RMSEA, SRMR, GFI, AGFI, and NFI have acceptable fit values and CFI and χ2/df have excellent fit values. Therefore, confirmatory factor analysis results show that the overall fit of the measurement model is statistically quite adequate.

6.6. Convergent and Divergent Validity

For the robustness of fit index values, average explained variance (AVE) and compo-site reliability (CR) values were analyzed for convergent validity. Maximum squared shared variance (MSV) and average squared shared variance (ASV) values were analyzed for divergent validity. The necessary conditions for convergent and divergent validity are also presented in Table 8.
AVE, CR, MSV, and ASV values were obtained via convergent and divergent validity, and are presented in Table 9. When the convergent validity results of the scales are analyzed from this table, it is indicated that the average explained variance (AVE) values of all scales are greater than 0.5 and the composite reliability values (CR) of all scales are greater than the average explained variance (AVE) values of the scales. This is an indication of a high degree of convergent validity [108]. The fact that all of the composite reliability values calculated for the three scales used in this study are above 0.7 indicates a satisfactory level in terms of internal consistency [109]. In the literature, it is also possible to find opinions that AVE values up to 0.40 can be accepted [109]. In addition, according to [109], if CR values are appropriate, low AVE values in that subdimension can be acceptable.
Finally, to test the divergent validity, which is used to determine that the scales used in this study are related to each other but have different structures from each other, as stated in Table 8, in addition to the MSV < AVE condition, the square root value of the AVE of the subdimensions is expected to be greater than both 0.50 and the correlation values calculated using the other factors of the scale [108,110,111]. According to the divergent validity values given in Table 9, it is indicated that the maximum shared variance squared (MSV) values of all three factors are smaller than the average variance explained (AVE) values, and the average shared variance squared (ASV) values of all three factors are smaller than the maximum shared variance squared (MSV) values. In addition, the square root of the AVE values of each scale is expected to be greater than the correlation of any two scales. In Table 9, the values written in bold font on the diagonal are √AVE values and, as a result of comparing each of them with the correlation values in the column and row in which they are located, it is determined that all three of the three correlation coefficients are smaller than the √AVE value they are compared with. This indicates that the scales fulfil all the relevant criteria and have an acceptable level in terms of divergence validity [112].
These results reveal that the model has a sufficient level of convergent (CR > 0.70; AVE > 0.50; CR > AVE) and divergent validity (MSV < AVE; ASV < AVE; correlation between factors < √AVE). According to the tests performed, it is evaluated that the scales used in this study are reliable and valid at acceptable levels, and, at the same time, they are compatible with the predicted theoretical structure (one-factor model).
Below the diagonal are correlations, above the diagonal are squared correlations, and above the diagonal are √AVE. AVE: average explained variance; CR: composite reliability; MSV: maximum shared variance squared; ASV: mean square of shared variance

6.7. Structural Equation Modeling Results

The fit index values obtained by testing the structural model proposed in Figure 3 with path analysis are given in Table 10. In this table, it is seen that RMSEA has an acceptable fit and the remaining AGFI and χ2/df, SRMR, GFI, NFI, and CFI have excellent fit values. Therefore, it is determined that the proposed theoretical model is valid and reliable.
The fit of the initially proposed structural model (Figure 3) can also be determined by examining the estimates and the significance tests of the errors. The unstandardized path coefficient estimates from the path analysis are presented in Table 11. Figure 4 shows the standardized coefficient estimates of the relationships together with their significance. In the factor analysis literature, these path coefficients are also referred to as factor loads. The statistical significance of the t-values should be examined to reveal the relationship among the observed variables (subdimensions) and factors. In a typical factor analysis study, almost all of these t-values are required to be significant to claim that factor-variable relationships are different from zero. If most of the t-values of the path coefficients are not significant, the validity of our factor model is questioned.
From Table 11, it is indicated that the IT and environmental uncertainty scales have statistically highly significant effects on SC performance and the IT, and the environmental uncertainty scale (p < 0.0001). This means that all factor-variable relationships are supported. When the estimation coefficients of these interactions are analyzed, it is indicated that all of them are positive. Therefore, the hypotheses H1, H2, and H3 determined in this study are acceptable.
Squared multiple correlations (R2, squared multiple correlations, coefficient of determination) give an idea about the robustness of the models used in this study because these values are interpreted as the percentage of variation in the dependent variables (endogenous variables) explained by the independent variables (exogenous variables). Squared multiple correlations obtained from this study are given in the last column of Table 11. As shown in this table, the R2 values range from 0.104 to 0.683 and are at medium and high levels. This means that the model is predicted well by the independent variables.
The path diagram obtained as a result of the path analysis with the standardized coefficients and their statistical significance (with asterisks) is shown in Figure 4. In this graph, the double-headed arrows pointing to two variables express the covariance between these two variables. Single-headed arrows indicate the functional relationship between the two variables. From the coefficients on the one-way arrows indicating the functional relationship among the variables, it is indicated that all of the binary relationships (IT scale and environmental uncertainty scales on SC performance) are statistically significant.
Table 12 shows the standardized direct, indirect, and total impacts. In this table, total effects are the sum of direct and indirect effects. These results explain in detail that the structural equation model (SEM) effect analysis shows some discrepancies that cannot be analyzed accurately by the linear regression analysis method. Therefore, this table provides more detailed results of SEM effect analysis and more refined results in terms of the overall theory. When Table 12 is examined in detail, the statistical significance values for direct effects are the same as the standardized values in Table 11. When the direct, indirect, and total effects are analyzed, all of the effects are statistically significant (p < 0.001).
One of the aims of this study is to investigate whether or not there is a mediating role of environmental uncertainty in the relationship between IT and SC performance. Before analyzing the mediating role of environmental uncertainty in the effect of IT on SC performance, the effect of the independent variable on the dependent variable was analyzed. To mention the mediating role, the effect of the independent variable on the dependent variable must be significant. As a result, it can be concluded that ITs have a statistically significant and positive effect on SC performance (p < 0.001). When the analysis results in Table 12 are analyzed, it is indicated that the degree of indirect effect of the IT variable on SC performance decreases compared to the direct effect. When the change in the direct effect of IT on SC performance was 0.57, the change in the indirect effect of IT on SC performance decreased to 0.10. According to these results, it can be said that environmental uncertainty has a partial mediating role in the effect of IT on SC performance. Therefore, the hypothesis H4 determined in this study is acceptable.

7. Discussion and Conclusions

Consequently, 192 data were collected and analyzed via the questionnaire method from the top international 500 companies in Turkey determined by the ICI. It is concluded that there is a significant and positive relationship between IT and SC performance, and hypothesis H1 was confirmed. Therefore, companies that intend to increase their SC performance should benefit effectively from IT. In the age of digital transformation, companies can strategically use the SC, which is the key to competition, by utilizing IT. The sector-leading companies have achieved significant success, largely due to their effective use of IT, which plays a crucial role in their information flow. Therefore, the results obtained from the research reveal that companies need IT to achieve successful SC performances. In addition, our results are consistent with the literature. Researchers such as Salleh vd. [113], Gülaslan [78], Yang ve Su [114], Zhao et al. [24], Liu vd. [58], Yarar [43], Collins vd. [115], McFarland [116], Zheng vd. [117], Çemberci vd. [118], and Fawcett vd. [119] have also found a significant relationship between IT and SC performances in their studies. By managing the processes effectively, SC performance can increase, leading to improvements in customer satisfaction, profitability, and market share. By integrating advanced IT into the SC, many advantages can be obtained by achieving success in information flow. Therefore, integrating IT into all processes of the SC implies that improvements can be achieved in the processes in the SC.
As a result of the analysis performed to test hypothesis H2, it was determined that IT has a significant effect on environmental uncertainty, and the hypothesis was confirmed. Environmental uncertainty may pose great risks to companies’ decisions and may cause wrong decisions and even lead to bankruptcy. The obtained result reveals that IT must be utilized to cope with these uncertainties and turn them into opportunities by acting swiftly. This is consistent with the results of Sevinç [120] and Bülbül et al. [121], which are among the few studies in the literature. Therefore, it is beneficial for companies to turn environmental uncertainty into an opportunity by making more use of IT to cope with environmental uncertainty.
This study shows that the analysis of results shows a significant effect of environmental uncertainty on SC performance. Based on this, the H3 hypothesis was decided to be correct. To increase SC performance, environmental uncertainty should also be taken into consideration. Also, Sun et al. [122] demonstrated that environmental uncertainty has a significant effect on SC performance.
Another aim of this study was to determine whether environmental uncertainty plays a mediating role in the effect of IT on SC performance. To this end, hypothesis H4 was examined, and it was concluded that environmental uncertainty plays a mediating role in the relationship between IT and SC performance. As for the type of mediation, it was determined that environmental uncertainty has a partial mediating role. Therefore, while IT has a significant effect on SC performance, this effect can be decreased when environmental uncertainty is involved. In this case, companies should benefit from IT effectively more to increase their SC performance.
In the literature, there is no study investigating the mediating role of environmental uncertainty in the relationship between IT and SC performance. Therefore, this study focused on a subject that has not been empirically studied before, aiming to contribute to the literature. Therefore, it is also expected to be a source for researchers in future studies. In addition, by developing an original and new model, a valid and reliable model can be added to the literature. At the same time, the success of the companies that make up the research target population is of strategic importance for Turkey, one of the 20 largest economies in the world, to achieve its economic goals. In developing economies such as Turkey, where small- and medium-sized enterprises are predominant, these companies act as locomotives in ensuring sustainable growth. The results of this study are critical for these companies or other companies aiming to be successful in SC management.
As a result of digital transformation, companies may struggle to use scarce resources efficiently if they do not make adequate use of IT. Companies that can use IT effectively may be advantageous compared to their competitors in predicting the risks and dangers they may encounter in an intense competitive environment. According to the findings, it is recommended that companies increase their level of IT usage. In this framework, it is beneficial that the plans and strategies related to IT should be in line with the plans and strategies of the enterprise. In addition, in a period when the importance of information is increasing day by day, enterprises should closely follow the developments in IT carefully. It is believed that enterprises investing in these technologies should act consciously and invest in ITs that meet their needs regarding benefits and costs. For this reason, managers and employees have great responsibilities in making a sensitive planning process before investing. Since existing ITs may lose their validity with the rapid changes in technology, it might be advantageous for managers to follow new technologies and integrate the right technologies into their companies. It is predicted that it may be more beneficial to integrate these technologies into all departments of the enterprise and SC members. Having a qualified labor force in the use of these integrated technologies is also critical in terms of obtaining the expected benefit. In addition to in-service training, providing and increasing university-industry cooperation can provide great convenience in the training of qualified personnel.
The findings suggest that SC managers should also consider environmental uncertainty for companies to utilize their SCs as a competitive advantage and to sustain that advantage. Because it is of strategic importance for the continuity of the companies, company managers should understand that environmental uncertainty may cause critical decision misjudgments in the companies. According to results, enterprises can use IT effectively to cope with unexpected events in an environment with uncertainty. Since the perspectives of enterprises on environmental uncertainty are important, it is recommended that sector actors should implement practices that can turn environmental uncertainty into an opportunity instead of perceiving it as a threat and avoiding it. It is thought that it would be appropriate for business managers to use IT and adopt appropriate strategies to manage environmental uncertainty in the face of changes by constantly analyzing the environment. Thus, an increase in the SC performance of enterprises can be achieved. The findings emphasize the need for IT to achieve a sustainable performance. It is also recommended that appropriate criteria should be selected for the performance measurement; it should be measured at certain intervals and necessary arrangements should be made. In all these stages, both the support and control mechanism of the top management are important. Therefore, as a result, it is recommended to business managers to increase SC performance by utilizing IT, to take environmental uncertainty into account and turn it into an opportunity and to provide sustainable competitive advantage.
There are some limitations in this study. Since IT and environmental uncertainty variables are not commonly discussed with subdimensions in the literature, they are absent in this study. However, some studies categorize both variables into subdimensions. In future studies, the addition of subdimensions to the model may enhance the literature. On the other hand, this study is limited to the companies determined by the ICI. Investigating other companies may lead to different results. These companies, which constitute the research population, operate in different sectors. By investigating companies that are active in only one sector, the results can be compared, and, at the same time, the relationships related to demographic variables can be analyzed. In addition, it is expected that studies investigating which ITs reduce environmental uncertainty and increase SC performance will be beneficial for companies.

Author Contributions

Conceptualization, I.E.D.; methodology, I.E.D. and S.M.; software, S.M.; validation, I.E.D. and S.M.; formal analysis, S.M.; investigation, I.E.D.; resources, I.E.D. and S.M.; data curation, S.M.; writing—original draft preparation, I.E.D. and S.M.; writing—review and editing, I.E.D. and S.M.; visualization, I.E.D.; supervision, I.E.D. and S.M.; project administration, I.E.D. and S.M.; funding acquisition, I.E.D. and S.M. All authors have read and agreed to the published version of the manuscript.

Funding

This research received no external funding.

Institutional Review Board Statement

This study was conducted in accordance with the Declaration of Helsinki, and was approved by the Social and Human Sciences Scientific Research and Publication Ethics Committee of Usak University (numbered 2023-242 and dated 13 December 2023).

Informed Consent Statement

Informed consent was obtained from all subjects involved in the study.

Data Availability Statement

Data are contained within the article.

Conflicts of Interest

The authors declare no conflicts of interest.

References

  1. Özçifçi, V. Tedarik Zinciri Yönetiminde Bilişim Teknolojileri Kullanımı ve Performans Ilişkisinin Incelenmesi. Doctoral Dissertation, University of Nigde, Nigde, Turkey, 2009. [Google Scholar]
  2. Bahar, S.; Özdağoğlu, A. Tedarik zinciri performansında bilgi teknolojileri faktörlerinin analiz edilmesinin önemi: AHS uygulaması. Turkuaz Uluslararası Sosyo-Ekon. Strat. Araştırmalar Derg. 2022, 4, 39–65. [Google Scholar]
  3. Schwab, K. The Fourth Industrial Revolution; World Economic Forum: Geneva, Switzerland, 2016. [Google Scholar]
  4. Tekin, M.; Öztürk, D.; Bahar, İ. Akıllı lojistik faaliyetlerinde blokzincir teknolojisi. Kent Akad. 2020, 13, 570–583. [Google Scholar] [CrossRef]
  5. Chan, T.; Qi, J.; Chan, H.; Lau, C.; Ip, W. A conceptual model of performance measurement for supply chains. Manag. Decis. 2003, 41, 635–642. [Google Scholar] [CrossRef]
  6. Sosa, L.; Alcaraz, J.L.; Macías, A.A. Evaluation of supply chain performance. In Management and Industrial Engineering; Springer International Publishing: Cham, Switzerland, 2019. [Google Scholar]
  7. Liao, Y. Supply Chain Flexibility: The Antecedents, Driving Forces and Impacts on Performance. Doctoral Dissertation, University of Toledo, Toledo, OH, USA, 2006. [Google Scholar]
  8. Bozalan, M.; Turan, İ. Bireysel yenilikçiliğin rekabetçi tutuma etkisinde çevresel belirsizliğin düzenleyici rolü. Süleyman Demirel Üniversitesi Vizyoner Derg. 2022, 13, 222–235. [Google Scholar] [CrossRef]
  9. Fynes, B.; Buirca, S.; Marshall, D. Environmental uncertainty, supply chain relationship quality and performance. J. Purch. Supply Manag. 2004, 10, 179–190. [Google Scholar] [CrossRef]
  10. Chejarla, K.C.; Vaidya, O.S.; Kumar, S. MCDM applications in logistics performance evaluation: A literature review. J. Multi-Criteria Decis. Anal. 2021, 29, 274–297. [Google Scholar] [CrossRef]
  11. Ahammad, M.F.; Basu, S.; Munjal, S.; Clegg, J.; Shoham, O. Strategic agility, environmental uncertainties and international performance: The perspective of Indian firms. J. World Bus. 2021, 56, 101218. [Google Scholar] [CrossRef]
  12. Grewal, R.; Tansuhaj, P. Building organizational capabilities for managing economic crisis: The role of market orientation and strategic flexibility. J. Mark. 2001, 65, 67–80. [Google Scholar] [CrossRef]
  13. Güler, Ü.; Sönmez, R. Dijitalleşmenin çevresel belirsizlik ortamında çevikliğe etkisi. J. Life Econ. 2023, 10, 233–245. [Google Scholar] [CrossRef]
  14. Miceli, A.; Hagen, B.; Riccardi, M.P.; Sotti, F.; Settembre-Blundo, D. Thriving, not just surviving in changing times: How sustainability, agility and digitalization intertwine with organizational resilience. Sustainability 2021, 13, 2052. [Google Scholar] [CrossRef]
  15. Zahra, S.A.; Covin, J.G. Contextual influences on the corporate entrepreneurship-performance relationship: A longitudinal analysis. J. Bus. Ventur. 1995, 10, 43–58. [Google Scholar] [CrossRef]
  16. Zahra, S.A.; Garvis, D.M. International corporate entrepreneurship and firm performance: The moderating effect of international environmental hostility. J. Bus. Ventur. 2000, 15, 469–492. [Google Scholar] [CrossRef]
  17. Aerts, A.; Goossenaerts, J.; Hammer, D.; Wortmann, J. Architectures in context: On the evolution of business, application software, and ict platform architectures. Inf. Manag. 2004, 41, 781–794. [Google Scholar] [CrossRef]
  18. Haddadzadehhendou, F. Bilişim ve Iletişim Teknolojileri Kullaniminin Işletmelerin Tedarikçileri Ile Olan Ilişkileri ve Işletme Performansi Üzerindeki Etkilerinin Belirlenmesi. Doctoral Dissertation, University of Atatürk, Erzurum, Turkey, 2020. [Google Scholar]
  19. Sağbaş, M. Tedarik Zinciri Yönetiminde Bilgi Teknolojileri, Çeviklik ve Entegrasyonun Operasyonel ve Finansal Performansa Etkisi. Doctoral Dissertation, University of Beykent, Istanbul, Turkey, 2015. [Google Scholar]
  20. Yüksel, H. Tedarik zinciri yönetiminde bilgi sistemlerinin önemi. Dokuz Eylül Üniversitesi Sos. Bilim. Enstitüsü Derg. 2002, 4, 261–279. [Google Scholar]
  21. Aydın, A.; Sarman, S. A management information system: Integrating GIS, GPS and ERP. In Proceedings of the 4th International Logistics and Supply Chain Management Congress, Izmir, Turkey, 29 November–1 December 2006. [Google Scholar]
  22. Gunasekaran, A.; Ngai, E.W. Information systems in supply chain integration and management. Eur. J. Oper. Res. 2004, 159, 269–295. [Google Scholar] [CrossRef]
  23. Yazgan, H. Tedarik Zinciri ve Bilgi Sistemleri Stratejilerinin Tedarik Zinciri Performansına Etkisi: Ihracat Yapan Işletmeler Üzerine Bir Araştırma. Doctoral Dissertation, University of Düzce, Düzce, Turkey, 2017. [Google Scholar]
  24. Zhao, M.; Dröge, C.; Stank, T.P. The effects of logistics capabilities on firm performance: Customer-focused versus information-focused capabilities. J. Bus. Logist. 2001, 22, 91–107. [Google Scholar] [CrossRef]
  25. Sauvage, T. The relationship between technology and logistics third-party providers. Int. J. Phys. Distrib. Logist. Manag. 2003, 33, 236–253. [Google Scholar] [CrossRef]
  26. Queiroz, M.M.; Pereira, S.C.F.; Telles, R.; Machado, M.C. Industry 4.0 and digital supply chain capabilities: A framework for understanding digitalisation challenges and opportunities. Benchmarking Int. J. 2021, 28, 1761–1782. [Google Scholar] [CrossRef]
  27. Müller, J.M.; Voigt, K.I. The impact of industry 4.0 on supply chains in engineer-to-order industries—An exploratory case study. IFAC-Pap. 2018, 51, 122–127. [Google Scholar] [CrossRef]
  28. Holmström, J.; Partanen, J. Digital manufacturing-driven transformations of service supply chains for complex products. Supply Chain. Manag. Int. J. 2014, 19, 421–430. [Google Scholar] [CrossRef]
  29. Büyüközkan, G.; Göçer, F. Digital Supply Chain: Literature review and a proposed framework for future research. Comput. Ind. 2018, 97, 157–177. [Google Scholar] [CrossRef]
  30. Büyüközkan, G.; Göçer, F. An extension of ARAS methodology under interval valued intuitionistic fuzzy environment for digital supply chain. Appl. Soft Comput. 2018, 69, 634–654. [Google Scholar] [CrossRef]
  31. Fatorachian, H.; Kazemi, H. Impact of Industry 4.0 on supply chain performance. Prod. Plan. Control 2021, 32, 63–81. [Google Scholar] [CrossRef]
  32. MacCarthy, B.L.; Ivanov, D. The Digital Supply Chain—Emergence, concepts, definitions, and technologies. In The Digital Supply Chain; Elsevier: Amsterdam, The Netherlands, 2022; pp. 3–24. [Google Scholar]
  33. Zekhnini, K.; Cherrafi, A.; Bouhaddou, I.; Benghabrit, Y.; Garza-Reyes, J.A. Supply chain management 4.0: A literature review and research framework. Benchmarking Int. J. 2021, 28, 465–501. [Google Scholar] [CrossRef]
  34. Organisation for Economic Co-Operation and Development (OECD). OECD Dijital Economy Outlook 2017. 2017. Available online: https://www.oecd-ilibrary.org/sites/9789264276284-en/index.html?itemId=/content/publication/9789264276284-en (accessed on 12 March 2024).
  35. Otto Beisheim School of Managemet (WHU) Logistics Study 2015. Digital Supply Chains: Increasingly Critical for Competitive Edge. 2015. Available online: https://www.kearney.com/service/operations-performance/article/-/insights/digital-supply-chains-increasingly-critical-for-competitive-edge (accessed on 22 April 2024).
  36. Narasimhan, R.; Kim, S.W. Information system utilization strategy for supply chain integration. J. Bus. Logist. 2001, 22, 51–75. [Google Scholar] [CrossRef]
  37. Devaraj, S.; Krajewski, L.; Wei, J.C. Impact Of E-Business Technologies On Operational Performance: The Role Of Production İnformation İn The Supply Chain. J. Oper. Manag. 2007, 25, 1199–1216. [Google Scholar] [CrossRef]
  38. Thun, J.H. Angles of integration: An empirical analysis of the alignment of internet-based information technology and global supply chain integration. J. Supply Chain Manag. 2010, 46, 30–44. [Google Scholar] [CrossRef]
  39. Christopher, M. Logistics and Supply Chain Management, 4th ed.; Pearson: Harlow, UK, 2011. [Google Scholar]
  40. Nebol, E.; Uslu, T.; Uzel, E. Tedarik Zinciri ve Lojistik Yönetimi; Beta Yayıncılık: İstanbul, Turkey, 2014. [Google Scholar]
  41. Childs, T.C. The Effects of Intraorganizational Resources and Dimensions of Supply Chain Integration on Firm Performance. Doctoral Dissertation, University of Capella, Minneapolis, MN, USA, 2016. [Google Scholar]
  42. Terjesen, S.; Patel, P.C.; Sanders, N.R. Managing differentiation-integration duality in supply chain integration. Decis. Sci. 2012, 43, 303–339. [Google Scholar] [CrossRef]
  43. Yarar, C. Tedarik Zinciri Yönetiminde Bilgi Teknolojileri Kullanımının Zincir Performansına Etkisi. Doctoral Dissertation, University of Başkent, Ankara, Turkey, 2022. [Google Scholar]
  44. Eriş, E. Lojistik Sektöründe Pazar Yönlü—Öğrenme Yönlü Olma ve Yenilikçiliğin Işletme Performansina Etkisi. Doctoral Dissertation, University of Dokuz Eylül, İzmir, Turkey, 2008. [Google Scholar]
  45. Baki, B.; Şimşek, B. Lojistik faaliyetlere göre performans ölçütlerinin belirlenmesi. In Proceedings of the 24. Yöneylem Araştırması/Endüstri Mühendisliği Kongresi, Adana, Turkey, 15–18 June 2004. [Google Scholar]
  46. Schmıtz, J.; Platts, K.W. Supplier logistics performance measurement: Indications from a study in the automotive industry. Int. J. Prod. Econ. 2004, 89, 231–243. [Google Scholar] [CrossRef]
  47. Chow, G.; Heaver, T.D.; Henriksson, L.E. Logistics performance: Definition and measurement. Int. J. Phys. Distrib. Logist. Manag. 1994, 24, 17–28. [Google Scholar] [CrossRef]
  48. Senir, G. Ihracatçi Firmalar Açisindan Lojistik Hizmet Sağlayicilarin Performansinin Değerlendirilmesi. Doctoral Dissertation, University of Nigde Omer Halisdemir, Niğde, Turkey, 2021. [Google Scholar]
  49. Chan, F.T. performance measurement in a supply chain. Int. J. Adv. Manuf. Technol. 2003, 21, 534–548. [Google Scholar] [CrossRef]
  50. Beamon, B.M. Supply chain design and analysis: Models and methods. Int. J. Prod. Econ. 1998, 55, 281–294. [Google Scholar] [CrossRef]
  51. Parker, C. Performance measurement. Work Study 2000, 49, 63–66. [Google Scholar] [CrossRef]
  52. Niven, P.R. Balanced Scorecard Step-by-Step: Maximizing Performance and Maintaining Results; John Wiley and Sons: New York, NY, USA, 2006. [Google Scholar]
  53. Polat, İ. Tedarik Zinciri Entegrasyonunun Tedarik Zinciri Performansi Üzerindeki Etkisi. Master’s Dissertation, University of Bandırma Onyedi Eylül, Bandirma, Turkey, 2021. [Google Scholar]
  54. Poluha, G.R. The quintessence of supply chain management what you really need to know to manage your processes in procurement, manufacturing. In Warehousing And Logistics; Springer: Paris, France, 2016. [Google Scholar]
  55. Ghalayini, A.M.; Noble, J.S. The changing basis of performance measurement. Int. J. Oper. Prod. Manag. 1996, 16, 63–80. [Google Scholar] [CrossRef]
  56. Arıöz, Ö.; Yıldırım, K. Turkey’de çimento sektöründeki belirsizlikler ve Türk çimento sektörünün SWOT analizi. Dumlupınar Üniversitesi Sos. Bilim. Derg. 2012, 32, 173–190. [Google Scholar]
  57. Jaworski, B.J.; Kohli, A.K. Market orientation: Antecedents and consequences. J. Mark. 1993, 57, 53–70. [Google Scholar] [CrossRef]
  58. Lin, Z. Environmental determination or organizational design: An exploration of organizational decision making under environmental uncertainty. Simul. Model. Pract. Theory 2006, 14, 438–453. [Google Scholar] [CrossRef]
  59. Daft, R.L.; Murphy, J.; Willmott, H. Organization Theory and Design; South-Wester: Singapore, 2010. [Google Scholar]
  60. Vatansever, K. Tedarik Zinciri Esnekliğinin Firma Performansı Üzerindeki Etkileri ve Tekstil Sektöründe Bir Araştırma. Doctoral Dissertation, University of Dumlupınar, Kütahya, Turkey, 2010. [Google Scholar]
  61. Yang, B.; Burns, N.D.; Backhouse, C.J. Management of uncertainty through postponement. Int. J. Prod. Res. 2004, 42, 1049–1064. [Google Scholar] [CrossRef]
  62. Agarwal, A.; Shankar, R.; Tiwari, M.K. Modeling the metrics of lean, agile and leagile supply chain: An ANP-based approach. Eur. J. Oper. Res. 2006, 173, 211–225. [Google Scholar] [CrossRef]
  63. Gosling, J.; Purvis, L.; Naim, M.M. Supply chain flexibility as a determinant of supplier selection. Int. J. Prod. Econ. 2010, 128, 11–21. [Google Scholar] [CrossRef]
  64. Hult, G.T.M.; Craighead, C.W.; Ketchen, D.J., Jr. Risk uncertainty and supply chain decisions: A real options perspective. Decis. Sci. 2010, 41, 435–458. [Google Scholar] [CrossRef]
  65. Simangunsong, E.; Hendry, L.C.; Stevenson, M. Supply-chain uncertainty: A review and theoretical foundation for future research. Int. J. Prod. Res. 2012, 50, 4493–4523. [Google Scholar] [CrossRef]
  66. Ambulkar, S.; Blackhurst, J.; Grawe, S. Firm’s resilience to supply chain disruptions: Scale development and empirical examination. J. Oper. Manag. 2015, 33, 111–122. [Google Scholar] [CrossRef]
  67. Salam, M.A.; Bajaba, S. The role of supply chain resilience and absorptive capacity in the relationship between marketing–supply chain management alignment and firm performance: A moderated-mediation analysis. J. Bus. Ind. Mark. 2023, 38, 1545–1561. [Google Scholar] [CrossRef]
  68. Zhou, J.; Hu, L.; Yu, Y.; Zhang, J.Z.; Zheng, L.J. Impacts of IT capability and supply chain collaboration on supply chain resilience: Empirical evidence from China in COVID-19 pandemic. J. Enterp. Inf. Manag. 2024, 37, 777–803. [Google Scholar] [CrossRef]
  69. Meijer, I.S.; Hekkert, M.P.; Koppenjan, J.F. How perceived uncertainties influence transitions; the case of micro-CHP in the Netherlands. Technol. Forecast. Soc. Change 2007, 74, 519–537. [Google Scholar] [CrossRef]
  70. Çetindaş, A. İmalat İşletmelerinde Tedarik Zinciri Entegrasyonunun Lojistik Performansı Üzerindeki Etkisinde Çevresel Belirsizliğin Düzenleyici Rolü. Doctoral Dissertation, University of Hasan Kalyoncu, Gaziantep, Turkey, 2018. [Google Scholar]
  71. Lee, P.K.C.; Yeung, A.C.L.; Cheng, T.C.E. Supplier alliances and envioronmental uncertainty: An emprical study. Prod. Econ. 2009, 120, 190–204. [Google Scholar] [CrossRef]
  72. Wernerfelt, B.; Karnani, A. Competitive strategy under uncertainty. Strateg. Manag. J. 1987, 8, 187–194. [Google Scholar] [CrossRef]
  73. Li, S.; Lin, B. Accessing information sharing and information quality in supply chain management. Decis. Support Syst. 2006, 42, 1641–1656. [Google Scholar] [CrossRef]
  74. Mohr, J. The marketing of high-technology products and services: Implications for curriculum conten and design. J. Mark. Educ. 2000, 22, 246–259. [Google Scholar] [CrossRef]
  75. Eckbo, B. Mergers and the value of antitrust deterrence. J. Financ. 1992, 47, 1005–1028. [Google Scholar] [CrossRef]
  76. Chandy, R.K.; Tellis, G.J. The incumbent’s curse? Incumbency, size, and radical product innovation. J. Mark. 2000, 64, 1–17. [Google Scholar] [CrossRef]
  77. Asamoah, D.; Agyei-Owusu, B.; Andoh-Baidoo, F.K.; Ayaburi, E. Inter-organizational systems use and supply chain performance: Mediating role of supply chain management capabilities. Int. J. Inf. Manag. 2021, 58, 102195. [Google Scholar] [CrossRef]
  78. Gülaslan, M. Tedarik Zinciri Yönetiminde Bilgi Iletişim Teknolojileri Kullaniminin Tedarik Zinciri Entegrasyonuna ve Performansina Etkisi: Imalat Sanayiinde Bir Araştirma. Doctoral Dissertation, University of Marmara, Istanbul, Turkey, 2022. [Google Scholar]
  79. Kim, H.J. Information technology and firm performance: The role of supply chain integration. Oper. Manag. Res. 2017, 10, 1–9. [Google Scholar] [CrossRef]
  80. Liang, T.P.; You, J.J.; Liu, C.C. A resource-based perspective on information technology and firm performance: A meta analysis. Ind. Manag. Data Syst. 2010, 110, 1138–1158. [Google Scholar] [CrossRef]
  81. Zhang, X.; Van Donk, D.P.; van der Vaart, T. The different impact of inter-organizational and intra-organizational ICT on supply chain performance. Int. J. Oper. Prod. Manag. 2016, 36, 803–824. [Google Scholar] [CrossRef]
  82. Hou, C.K. The effects of IT infrastructure integration and flexibility on supply chain capabilities and organizational performance: An empirical study of the electronics industry in Taiwan. Inf. Dev. 2020, 36, 576–602. [Google Scholar] [CrossRef]
  83. Nandi, M.L.; Nandi, S.; Moya, H.; Kaynak, H. Blockchain technology-enabled supply chain systems and supply chain performance: A resource-based view. Supply Chain Manag. Int. J. 2020, 25, 841–862. [Google Scholar] [CrossRef]
  84. Baki, R. The Impact ofinformation technologies andtop management support on supply chain performance: An empirical approach for Turkey. Avrupa Bilim Teknol. Derg. 2019, 17, 916–926. [Google Scholar]
  85. Jin, B. Performance implications of information technology implementation in an apparel supply chain. Supply Chain Manag. Int. J. 2006, 11, 309–316. [Google Scholar] [CrossRef]
  86. Li, G.; Yang, H.; Sun, L.; Sohal, A.S. The impact of IT implementation on supply chain integration and performance. Int. J. Prod. Econ. 2009, 120, 125–138. [Google Scholar] [CrossRef]
  87. Öztemiz, H. Dijital tedarik zinciri yönetimi ve tedarik zincirinde dijital uygulamalar konusundaki yayınların bibliyometrik analizi (1995–2023) ve gelecek araştırmalar için fırsatlar. J. Res. Bus. 2023, 8, 377–410. [Google Scholar] [CrossRef]
  88. Srivastava, A.K. Modeling strategic performance factors for effective strategy execution. Int. J. Product. Perform. Manag. 2013, 62, 554–582. [Google Scholar] [CrossRef]
  89. Bülbül, H.; Özçifçi, V.; Özoğlu, B. Tedarik zinciri ve işletme performansına bilişim teknolojilerinin etkisi. Niğde Üniversitesi İktisadi Ve İdari Bilim. Fakültesi Derg. 2014, 7, 95. [Google Scholar]
  90. Vinogradova, M.; Rogulin, R.; Ermakova, M.; Okhrimenko, I. Assessing the sources of uncertainty in supply chain management. Strateg. Change 2021, 30, 453–460. [Google Scholar] [CrossRef]
  91. Lee, H.L. Aligning supply chain strategies with product uncertainties. Calif. Manag. Rev. 2002, 44, 105–119. [Google Scholar] [CrossRef]
  92. Gubbi, S.R.; Aulakh, P.S.; Ray, S.; Sarkar, M.B.; Chittoor, R. Do international acquisitions by emerging-economy firms create shareholder value? The case of Indian firms. J. Int. Bus. Stud. 2010, 41, 397–418. [Google Scholar] [CrossRef]
  93. Samsami, F.; Hosseini, S.H.K.; Kordnaeij, A.; Azar, A. Managing environmental uncertainty: From conceptual review to strategic management point of view. Int. J. Bus. Manag. 2015, 10, 215. [Google Scholar] [CrossRef]
  94. Dess, G.G.; Lumpkin, G.T.; Covin, J.G. Entrepreneurial strategy making and firm performance: Tests of contingency and configurational models. Strateg. Manag. J. 1997, 18, 677–695. [Google Scholar] [CrossRef]
  95. Srinivasan, M.; Mukherjee, D.; Gaur, A.S. Buyer–supplier partnership quality and supply chain performance: Moderating role of risks, and environmental uncertainty. Eur. Manag. J. 2011, 29, 260–271. [Google Scholar] [CrossRef]
  96. Wong, C.Y.; Boon-Itt, S.; Wong, C.W. The contingency effects of environmental uncertainty on the relationship between supply chain integration and operational performance. J. Oper. Manag. 2011, 29, 604–615. [Google Scholar] [CrossRef]
  97. Istanbul Chamber of Industry (ICI). Turkey’s Top 500 Industrial Enterprises. Available online: https://www.iso500.org.tr/500-big-industrial-institutions-of-turkey (accessed on 3 May 2024).
  98. Desarbo, W.S.; Benedetto, C.A.D.; Song, M.; Sinha, I. Revisiting the miles and snow strategic framework: Uncovering interrelationships between strategictypes, capabilities, environmental uncertainty and firm performance. Strateg. Manag. J. 2005, 26, 47–74. [Google Scholar] [CrossRef]
  99. Karagöz, I. Bilgi Teknolojisi Yeteneğinin Lojistik Yeteneğe ve Işletme Performansina Etkileri. Doctoral Dissertation, University of Gebze Teknik, Gebze, Turkey, 2016. [Google Scholar]
  100. Piprani, A.Z.; Mohezar, S.; Jaafar, N.I. Supply chain integration and supply chain performance: The mediating role of supply chain resilience. Int. J. Supply Chain Manag. 2020, 9, 58–73. [Google Scholar]
  101. Huo, B.; Haq, M.Z.U.; Gu, M. The impact of it application on supply chain learning and service performance. Ind. Manag. Data Syst. 2020, 120, 1–20. [Google Scholar] [CrossRef]
  102. Tao, X. Performance evaluation of supply chain based on fuzzy matter element theory. In Proceedings of the International Conference on Information Management, Innovation Management and Industrial Engineering, Xi’an, China, 26–27 December 2009. [Google Scholar]
  103. Çankaya, S. Tedarik Zinciri Yönetimine Sürdürülebilirlik Perspektifinden Bakiş ve Yeşil Uygulamalar. Doctoral Dissertation, University of Gebze Teknik, Darica, Turkey, 2015. [Google Scholar]
  104. Altunışık, R.; Coşkun, R.; Bayraktaroğlu, S.; Yıldırım, E. Sosyal Bilimlerde Araştırma Yöntemleri, 6th ed.; Sakarya Publishing House: Sakarya, Turkey, 2010. [Google Scholar]
  105. Hair, J.F.; Anderson, R.E.; Tatham, R.L.; Black, W.C. Multivariate Data Analysis; Macmiilan Publishing Company: New York, NY, USA, 1998. [Google Scholar]
  106. Brown, T.A. Confirmatory Factor Analysis for Applied Research. In Methodology in the Social Sciences; Guilford Press: New York, NY, USA, 2006. [Google Scholar]
  107. Tabachnick, B.G.; Fidell, L.S. Using Multivariate Statistics, 5th ed.; Pearson Allyn and Bacon: Boston, MA, USA, 2007. [Google Scholar]
  108. Fornell, C.; Larcker, D.F. Structural equation models with unobservable variables and measurement error: Algebra and statistics. J. Mark. Res. 1981, 18, 382–388. [Google Scholar] [CrossRef]
  109. Hair, J.F.; Black, W.C.; Babin, B.J.; Anderson, R.E.; Tatham, R. Multivariate Data Analysis, 6th ed.; Prentice Hall: Uppersaddle River, NJ, USA, 2006. [Google Scholar]
  110. Hair, J.F.; Black, W.C.; Babin, B.J.; Anderson, R.E. Multivariate Data Analysis: A Global Perspective, 7th ed.; Pearson Education: Uppersaddle River, NJ, USA, 2010. [Google Scholar]
  111. Tugtekin, U.; Barut Tugtekin, E.; Kurt, A.A.; Demir, K. Associations between fear of missing out, problematic smartphone use, and social networking services fatigue among young adults. Soc. Media Soc. 2020, 6, 1–17. [Google Scholar] [CrossRef]
  112. Bagozzi, R.P.; Yi, Y. On the evaluation of structural equation models. J. Acad. Mark. Sci. 1988, 16, 74–94. [Google Scholar] [CrossRef]
  113. Salleh, N.A.M.; Jusoh, R.; Isa, C.R. Relationship between information systems sophistication and performance measurement. Ind. Manag. Data Syst. 2010, 110, 993–1017. [Google Scholar] [CrossRef]
  114. Yang, C.; Su, Y. The relationship between benefits of ERP systems implementation and its impacts on firm performance of SCM. J. Enterp. Inf. Manag. 2009, 22, 722–752. [Google Scholar] [CrossRef]
  115. Collins, J.D.; Worthington, W.J.; Reyes, P.M.; Romero, M. Knowledge management, supply chain technologies and firm performance. Manag. Res. Rev. 2010, 33, 947–960. [Google Scholar] [CrossRef]
  116. McFarland, F.W. Information technology changes the way you compete. Harv. Bus. Rev. 1984, 62, 98–103. [Google Scholar]
  117. Zheng, Z.; Xie, S.; Dai, H.; Chen, X.; Wang, H. An overview of blockchain technology: Architecture, consensus, and future trends. In Proceedings of the 2017 IEEE International Congress on Big Data, Boston, MA, USA, 11–14 June 2017. [Google Scholar]
  118. Çemberci, M.; Sözer, E.G.; Civelek, M.E. Firmalar arası bilgi paylaşımı ile tedarik zinciri yönetimi performansı ilişkisinde bilgi kalitesinin moderatör etkisi. Yönetim Bilim. Derg. 2015, 13, 141–159. [Google Scholar]
  119. Fawcett, S.E.; Osterhaus, P.; Magnan, G.M.; Brau, J.C.; McCarter, M.W. Information sharing and supply chain performance: The role of connectivity and willingness. Supply Chain Manag. Int. J. 2007, 12, 358–368. [Google Scholar] [CrossRef]
  120. Sevinç, D. Kamu kurumlarında bilgi teknolojileri kullanımı ve bunların çalışanların fiziksel ve psikolojik durumlarına etkileri. Bilgi Ekon. Yönetimi Derg. 2007, 2, 21–31. [Google Scholar]
  121. Bülbül, H.; Durna, U.; Yılmaz, N. Yenilikçiliği Geliştirmede Bilgi ve Bilgi Teknolojilerinin Önemi. In Proceedings of the Kırgızistan-Turkey Manas Üniversitesi İktisadi ve İdari Birimler Fakültesi Uluslararası Girişimcilik Kongresi, Bişkek, Kyrgyzstan, 25–27 May 2006. [Google Scholar]
  122. Sun, S.Y.; Hsu, M.H.; Hwang, W.J. The impact of alignment between supply chain strategy and environmental uncertainty on SCM performance. Supply Chain Manag. Int. J. 2009, 14, 201–212. [Google Scholar] [CrossRef]
Figure 2. Research model.
Sustainability 16 07667 g002
Figure 3. Initially proposed theoretical model.
Sustainability 16 07667 g003
Figure 4. Trace graph obtained as a result of path analysis. * p < significant at 0.05 level; ** p < significant at 0.01 level.
Sustainability 16 07667 g004
Table 1. Distribution of participants according to sociodemographic characteristics.
Variablesn%
GenderFemale8946.4
Male10353.6
Educational statusHigh school and below157.8
Associate degree3618.8
License10253.1
Postgraduate (Master’s/Ph.D.)3920.3
Dealer/Retailer2211.5
Distributor/Wholesaler2110.9
Logistics Service Provider4422.9
Producer7941.1
Primary Supplier189.4
Secondary Supplier84.2
Sector in which the business operatesFood5227.1
Metal/Steel105.2
Energy84.2
Transportation and Storage2010.4
Textile178.9
Heating Cooling63.1
Machinery/Industry73.6
Furniture/Wood Works52.6
Plastic packaging126.3
Logistics52.6
Electrical/Electronics52.6
Agricultural Products126.3
Defense Industry and Aviation31.6
Mining52.6
Automotive178.9
Chemistry/Medicine84.2
Number of employees in the enterpriseFewer than 503116.1
50–2493518.2
250–5006031.3
More than 5016634.4
Status in the enterpriseManager/General Manager147.3
Assistant director136.8
Purchasing manager94.7
Production manager84.2
Supply Chain/Logistics Manager4523.4
Planning Specialist105.2
Warehouse Problem2211.5
Operations manager147.3
Entrepreneur199.9
Finance Manager115.7
Marketing Manager73.6
Human resources manager115.7
Others94.7
Total192100.0
Table 2. Mean, standard deviation, and skewness values of the scale and subdimensions.
MeanStd. Dev.MinimumMaximumSkewness
Cost Performance3.42571.10451.00005.0000−0.6299
Customer Performance3.96520.84001.00005.0000−1.3955
Flexibility Performance3.57291.15431.00005.0000−0.9523
Logistics Performance3.72500.91691.00005.0000−1.1671
Supply Chain Performance3.69920.80361.00005.0000−1.0288
Information Technologies3.78471.08051.00005.0000−1.0550
Environmental Uncertainty3.23950.97501.00005.0000−0.1593
Table 3. Cronbach’s alpha coefficients of factors and subdimensions.
ScalesCronbach’s Alpha
Cost Performance0.937559
Customer Performance0.881852
Flexibility Performance0.964207
Logistics Performance0.867136
Supply Chain Performance0.943012
Information Technologies0.967616
Environmental Uncertainty0.836233
Table 4. Findings on the relationship between factors and subdimensions.
Cost PerformanceCustomer PerformanceFlexibility PerformanceLogistics PerformanceSupply Chain PerformanceInformation TechnologiesEnvironmental Uncertainty
Cost Performance1.00000
Customer Performance0.456661.00000
<0.0001
Flexibility Performance0.546840.581101.00000
<0.0001<0.0001
Logistics Performance0.614030.552620.503591.00000
<0.0001<0.0001<0.0001
Supply Chain Performance0.789570.805380.835250.808131.00000
<0.0001<0.0001<0.0001<0.0001
Information Technologies0.531630.482840.457190.544100.616901.00000
<0.0001<0.0001<0.0001<0.0001<0.0001
Environmental Uncertainty0.310710.366300.326520.461120.449040.322521.00000
<0.0001<0.0001<0.0001<0.0001<0.0001<0.0001
Table 5. Goodness of fit index acceptance criteria.
Compatibility IndexAcceptance CriteriaReference
χ2/sd≤3 = perfect fit
≤5 = acceptable fit
[105]
RMSEA/SRMR≤0.05 = perfect fit
≤0.10 = acceptable fit
[106]
GFI/AGFI≥0.90 = perfect fit
≥0.85 = acceptable fit
[107]
CFI≥0.90 = perfect fit
≥0.85 = acceptable fit
[107]
NFI≥0.90 = perfect fit
≥0.85 = acceptable fit
[107]
Table 6. Confirmatory factor analysis: Items, standardized loadings, and significance.
Scales and ItemsAverageStd. DeviationStandardized LoadsStd. Errortp
Cost PerformanceSCPCP13.38541.16100.87670.020343.046<0.0001
SCPCP23.47911.19310.84740.024934.023<0.0001
SCPCP33.43751.23060.90480.018149.996<0.0001
SCPCP43.40101.22820.90070.017950.269<0.0001
Customer PerformanceSCPCP14.03121.01760.89790.019645.622<0.0001
SCPCP24.08850.99600.89770.019845.326<0.0001
SCPCP34.01561.04590.80440.029327.382<0.0001
SCPCP44.01041.06820.74460.045814.047<0.0001
SCPCP53.93750.99540.71760.047912.888<0.0001
SCPCP63.70831.26090.78530.05668.5762<0.0001
Flexibility PerformanceSCPFP13.47911.22350.84810.021140.117<0.0001
SCPFP23.51041.22360.87830.017450.252<0.0001
SCPFP33.63021.25480.92940.011183.539<0.0001
SCPFP43.63541.22040.96650.0072133.400<0.0001
SCPFP53.60931.24840.90800.014064.504<0.0001
Logistics PerformanceSCPLP13.54681.13850.82000.031925.690<0.0001
SCPLP23.61971.21340.68150.042516.031<0.0001
SCPLP33.80201.06460.74830.035121.293<0.0001
SCPLP43.86451.09850.75760.036220.909<0.0001
SCPLP53.79161.16590.80420.033623.923<0.0001
Information TechnologiesIT13.71871.19950.88780.016453.827<0.0001
IT23.80721.15280.89970.014960.072<0.0001
IT33.80721.15740.95610.0078121.400<0.0001
IT43.78641.18500.95960.0074128.500<0.0001
IT53.77601.16530.85700.020441.987<0.0001
IT63.81251.12850.89100.016155.256<0.0001
Environmental UncertaintyEU13.21351.18060.67600.049313.702<0.0001
EU23.16141.16670.83120.035623.290<0.0001
EU33.17701.19330.88810.032727.133<0.0001
EU43.40621.22860.79150.050411.736<0.0001
Table 7. Robustness of fit indices of confirmatory factor analysis.
Compliance MeasuresPerfect FitAcceptable FitResults of the ModelCompatibility
RMSEA0 ≤ RMSEA ≤ 0.050.05 ≤ RMSEA ≤ 0.100.0853Acceptable Fit
SRMR0 ≤ SRMR ≤ 0.050.05 ≤ SRMR ≤ 0.100.0991Acceptable Fit
GFI0.90 ≤ GFI ≤ 1.000.85 ≤ GFI ≤ 0.900.8640Acceptable Fit
AGFI0.90 ≤ AGFI ≤ 1.000.85 ≤ AGFI ≤ 0.900.8510Acceptable Fit
NFI0.90 ≤ NFI ≤ 1.000.85 ≤ NFI ≤ 0.900.8582Acceptable Fit
CFI0.90 ≤ CFI ≤ 1.000.85 ≤ CFI ≤ 0.900.9112Perfect Fit
χ2/df0 ≤ χ2/df ≤ 33 ≤ χ2/df ≤ 52.389Perfect Fit
Table 8. Necessary conditions for convergent and divergent validity.
Convergent ValidityDivergent Validity
Standardized factor loadings > 0.7AVE > MSV
AVE > 0.5AVE > ASV
CR > 0.7 A V E > interfactor correlation
CR > AVEMSV > ASV
A V E > 0.5
Table 9. AVE, CR, MSV, and ASV values regarding the convergent and divergent validity and reliability of the scales.
CRAVEMSVASVSupply Chain PerformanceInformation TechnologiesEnvironmental Uncertainty
Supply Chain Performance0.9760.6720.3810.2920.8200.3810.202
Information Technologies0.9660.8270.3810.2430.6170.9090.104
Environmental Uncertainty0.8390.5720.2020.1530.4490.3230.765
Table 10. Robustness of fit indices obtained from structural equation model analysis.
Compliance MeasuresPerfect FitAcceptable FitResults of the ModelCompatibility
RMSEA0 ≤ RMSEA ≤ 0.050.05 ≤ RMSEA ≤ 0.100.0795Acceptable Fit
SRMR0 ≤ SRMR ≤ 0.050.05 ≤ SRMR ≤ 0.100.0240Perfect Fit
GFI0.90 ≤ GFI ≤ 1.000.85 ≤ GFI ≤ 0.900.9849Perfect Fit
AGFI0.90 ≤ AGFI ≤ 1.000.85 ≤ AGFI ≤ 0.900.9206Perfect Fit
NFI0.90 ≤ NFI ≤ 1.000.85 ≤ NFI ≤ 0.900.9793Perfect Fit
CFI0.90 ≤ CFI ≤ 1.000.85 ≤ CFI ≤ 0.900.9882Perfect Fit
χ2/df0 ≤ χ2/df ≤ 33 ≤ χ2/df ≤ 52.2063Perfect Fit
Table 11. Path analysis standardized results.
Path GuessStandard ErrortpR2
Cost PerformanceSupply Chain Performance0.73440.048815.023<0.00010.539
Customer PerformanceSupply Chain Performance0.66960.050113.362<0.00010.448
Flexibility PerformanceSupply Chain Performance0.70430.052313.465<0.00010.496
Logistics PerformanceSupply Chain Performance0.82680.045418.205<0.00010.683
Information TechnologiesSupply Chain Performance0.57240.054810.445<0.00010.551
Environmental UncertaintySupply Chain Performance0.32300.05995.385<0.0001
Information TechnologiesEnvironmental Uncertainty0.32250.06484.974<0.00010.104
Table 12. Standardized direct, indirect, and total effects (effect/std. error/t-value/p-value).
Direct ImpactsIndirect ImpactsTotal Impacts
Environmental UncertaintySupply Chain PerformanceInformation TechnologiesEnvironmental UncertaintySupply Chain PerformanceInformation TechnologiesEnvironmental UncertaintySupply Chain PerformanceInformation Technologies
Environmental Uncertainty000.3225000000.3225
0.06480.0648
4.97484.9748
<0.0001<0.0001
Flexibility Performance00.704300.227500.47660.22750.70430.4766
0.0523 0.0452 0.05060.04520.05230.0506
13.4659 5.0286 9.41775.028613.46599.4177
<0.0001 <0.0001 <0.0001<0.0001<0.0001<0.0001
Logistics Performance00.826900.267100.55950.26710.82690.5595
0.0454 0.0504 0.04690.05040.04540.0469
18.2057 5.2951 11.94115.295118.205711.9411
<0.0001 <0.0001 <0.0001<0.0001<0.0001<0.0001
Cost Performance00.734500.237300.49700.23730.73450.4970
0.0489 0.0463 0.04900.04630.04890.0490
15.0237 5.1233 10.13405.123315.023710.1340
<0.0001 <0.0001 <0.0001<0.0001<0.0001<0.0001
Customer Performance00.669700.216300.45310.21630.66970.4531
0.0501 0.0438 0.05130.04380.05010.0513
13.3620 4.9380 8.82694.938013.36208.8269
<0.0001 <0.0001 <0.0001<0.0001<0.0001<0.0001
Supply Chain Performance0.323000.5725000.10420.323000.6766
0.0600 0.0548 0.02800.0600 0.0487
5.3852 10.4456 3.72235.3852 13.8822
<0.0001 <0.0001 0.000197<0.0001 <0.0001
Disclaimer/Publisher’s Note: The statements, opinions and data contained in all publications are solely those of the individual author(s) and contributor(s) and not of MDPI and/or the editor(s). MDPI and/or the editor(s) disclaim responsibility for any injury to people or property resulting from any ideas, methods, instructions or products referred to in the content.

