Abstract
This study sought to ascertain the existence of convergence in environmental taxation among EU countries. By employing the sequential panel selection method and the panel KSS unit root test, it is demonstrated that the environmental taxation sequences in Luxembourg, Germany, Spain, France, and Cyprus diverge, while those of the remaining 22 countries converge. Similarly, the energy tax sequences of Croatia, Spain, Germany, and France are unstable, indicating divergence, while the remaining 23 countries exhibit significant convergence. Finally, transport taxes show a convergent trend across all EU countries. The convergence of environmental taxation can be explained by the catch-up and spatial spillover effects, and the non-convergence of a few EU countries is attributed to their minimal implementation of environmental goals. This study provides recommendations for improving environmental policies.
Keywords:
convergence; environmental taxation; panel unit root test; sequential panel selection method JEL Classification:
E62; P43; Q56
1. Introduction
This study assessed the convergence of environmental taxation in European Union (EU) member countries. In recent years, the escalating concern surrounding climate change has propelled the shift toward climate neutrality and sustainable development to the forefront of global discussions [1]. Many climate policy instruments have been proposed to mitigate climate change, especially carbon emissions, such as environmental taxation, carbon pricing, and green credit policies [2]. Environmental taxation can be utilised as a fiscal policy tool, impacting resource and energy consumption and carbon emissions by elevating the prices of environmentally detrimental products [3]; imposing environmental taxation can make polluters pay for the ecological harm they cause through market mechanisms, thus attaining both environmental and economic goals [4]. On the one hand, environmental taxation can play a functional role by increasing the prices of polluted goods and services, encouraging the purchase and consumption of cleaner and more sustainable products and energy, thus changing consumption and investment behaviour [5,6]. On the other hand, by leveraging the revenue effect of environmental taxation, the government can collect funds to tackle environmental issues and incentivise taxpayers to improve their production efficiency in order to benefit society or the economy [7]. The adoption of environmental taxation has been proven to promote technological advancement and the utilisation of energy from renewable sources, as well as economic welfare [8,9]. The holistic impact of environmental taxation yields dual dividends: economic growth and diminished environmental impact, and a transformation of tax structures from labour and income taxation to environment- and resource-centric structures [10,11]. Therefore, exploring whether environmental taxes among a set of countries converge along a similar trajectory or diverge with distinct paths has significant implications for sustainable development.
Environmental taxes can be used to mitigate adverse environmental effects and combat climate change [12]. They can be divided into four categories: resource taxes, pollution taxes, energy taxes, and transport taxes. According to the latest data from Eurostat, as of 2021, in the 27 EU countries, energy taxes comprised more than three-quarters (78.4%) of environmental tax revenues due to their predominant application in energy-related sectors. This share is significantly higher than the portions attributed to transport taxes (18.1%) and taxes on pollution and resources (3.5%). Transportation taxes cover a variety of items, such as the purchase or sale of motor vehicles, their registration or use, usage of the roads, congestion fees, city tolls, and other transportation-related expenses like ships, aeroplanes, trains, flights, airline tickets, and auto insurance [13]. In addition, the broad coverage of environmental taxes across various industries and implementation of policy objectives within these industries, such as the transportation, manufacturing, industrial, and residential sectors, necessitate the evaluation and enhancement of environmental taxation performance [14]. Consequently, the prominence of these tax categories has captured our attention and interest, prompting the exploration of their trends and variations. In the current global economic environment, the increasing interconnectedness of financial markets has introduced challenges that significantly impact the formulation and implementation of environmental tax policies within EU member states [15]. As technological progress and globalisation advance, international market interdependence escalates systemic risks and vulnerabilities and complicates policy enforcement [16]. These challenges underscore the importance of more stringent policy coordination among EU countries to ensure that environmental tax policies are effectively harmonised and resilient to cross-border impacts, which is crucial for achieving the convergence observed in this study.
Our focus is directed toward EU countries, primarily due to the significant commitment of most member states to attain net-zero greenhouse gas emissions by 2050. This commitment is designed to move the global trajectory in a positive, climate-resilient direction. The carbon emissions of the EU countries steadily decreased from 2006 to 2014, but this trend reversed and slightly increased after 2014. The ratification of the 2015 Paris Agreement effectively curbed the momentum of carbon growth [17]. The total carbon emitted by the EU countries in 2020 was 2.551 billion tons, a reduction of 32.05% compared to the levels in 1990. This reduction was achieved due to the active and effective tools adopted by EU countries to combat greenhouse gas emissions, such as carbon-pricing policies, carbon emission trading systems (ETSs), and environmental taxation [13]. The combined environmental tax receipts of the EU-27 states in 2020 amounted to EUR 299.9 billion. This amount represents 2.2% of the GDP of the European Union and 5.4% of all government revenue collected from taxation and social contributions inside the EU. Nevertheless, substantial variations in environmental taxation exist among EU countries, underscoring the diverse attitudes toward climate change mitigation across the member states. The highest shares are reported in Slovenia (12.3%), Latvia (10.1%), and Bulgaria (9.9%), whereas the lowest percentages are observed in Germany (4.1%), Slovakia (4.0%), and Luxembourg (3.5%). Hence, it is imperative to tailor economic policy recommendations that address environmental concerns to stimulate growth in EU countries.
This study provides several incremental contributions to the existing literature. The primary focus is on the convergence of environmental taxation through an integrated framework for EU countries, which has not been extensively investigated in previous studies. Given that the EU is the most active international organisation in terms of carbon emission reduction, the environment-related policies of its member countries are worth exploring. In addition to the EU’s ETS markets, implementing efficient and reasonable environmental taxation can relieve greenhouse gas emissions and assist in a move towards carbon neutrality [18]. Furthermore, this study divides environmental taxation into the sub-categories of energy and transport taxes, which account for 90% of total environmental taxes. The design of this study is conducive to clarifying the change trends in various tax categories, thus facilitating the development of specific and targeted tax entries. Therefore, this study examines the convergence of environmental taxation in EU member states by using the sequential panel selection method (SPSM) and the panel KSS unit root test with a Fourier function. Our results offer crucial insights for determining the optimal environmental tax scheme relative to EU countries and other organisations under the Paris Agreements and Sustainable Development Goals. Additionally, this study considers potential non-linearities and structural shifts in each SPSM trial, which are resolved using the ESTAR technique and Fourier function [19]. Furthermore, assuming independence is often deemed unrealistic, given that environmental taxation in various EU countries may exhibit contemporaneous correlation. To address this issue of cross-section dependence, this study adopts the bootstrap distribution approximation, a method deemed superior to prior studies that assume cross-sectional independence [20]. Finally, the empirical results evidence a high degree of convergence in environmental taxation among EU countries, which supports the presence of a highly consistent environmental institutional framework within the EU. Simultaneously, the reasons for the non-convergence of some countries’ environmental tax systems are analysed, and recommendations are subsequently offered to help formulate and implement future environmental policies within these nations.
The rest of this study is structured as follows: the literature review is covered in Section 2, the theory and hypothesis are covered in Section 3, the method is explained in Section 4, the data are introduced in Section 5, the empirical results are discussed in Section 6, and this study is concluded in Section 7.
2. Literature Review
Examining stochastic convergence has become a prevalent method for assessing the transitory nature of shocks to a variable of interest. Numerous studies have investigated the convergence of economic variables, such as GDP [21], income [22] and expenditure [23]. Considering the increasing prominence of environmental and climate change issues, an array of studies focus on the environmental variables convergence, such as carbon emission [24,25], energy consumption [26,27], ecological footprint [28,29] and ETS markets [30,31].
According to the existing literature, a discernible trend towards convergence is noted in the realm of environmental taxation among EU countries. Delgado et al. [32] initially probed the convergence of environmental taxation in EU countries between 1995 and 2016 and demonstrated the existence of three groups for overall environmental taxation and two groups for energy and transport taxes. Regarding overall environmental taxation, the research shows two different groups of countries from the standpoint of taxing structure: three groups for the energy tax and just one for the transport tax. The paper goes on to say that there is clear evidence of significant convergence in environmental taxation. According to Famulska et al. [33], there has been a slight decrease in the share of environmental tax revenues in total tax revenues and the proportion of environmental tax revenues relative to GDP. Simultaneously, there is a noticeable increase trend in the percentage of energy tax revenues relative to total environmental tax receipts.
Examining the effects of environmental taxation is a crucial step toward establishing a comprehensive benchmark for evaluating their impact on both environmental and economic benefits. As Dogan et al. [13] verified, environmental taxation has effectively reduced emissions for the G7 countries. In addition, the analysis confirms that the crucial effects of environmental taxation on the use of conventional energy, the rent from natural resources, and the use of renewable energy increase in direct proportion to the taxation amount. Furthermore, Depren et al. [34] reveal the heterogeneous impact of environmental taxation on environmental quality. The overall effect of the environmental tax is shown in the building effect in Finland, Iceland, and Sweden, and there is a decreasing tendency in some quantiles in Denmark and Norway. The environmental tax on energy is determined to have a compound negative impact on Denmark, Finland, Norway, and Sweden, as well as a negative impact on Iceland. In Denmark, Finland, and Iceland, the environmental tax on transportation has the opposite effect from what it shows in Norway and Sweden. Environmental taxation can elevate environmental quality by preventing harmful environmental practices and incentivising the adoption of efficient technologies or producing eco-friendly products, thereby achieving sustainable economic development [6,35].
Several studies discuss the reasons that contribute to the convergence phenomenon. For instance, Brock and Taylor [36] explain that real income per capita influences the direction and convergence based on the environmental Kuznets curve. Peng et al. [37] prove that foreign direct investment is the reason for the convergence of energy efficiency in developing nations. Ali et al. [38] point out that economic complexity leads to carbon emissions converging to their steady states. Instead, other scholars assess this topic as concerned with political components rather than economic fundamentals. Yilanci et al. [29] and Delgado et al. [32] believe that the adoption of a common environment policy is a factor that may lead to convergence among countries.
Different econometric techniques are applied to examine the convergence of variables, such as unit root tests and cointegration tests [39]. Unit root, stationarity, and cointegration tests are commonly applied to analyse the behaviour of variables. The null hypothesis, according to which a variable in a particular nation deviates from the average of all countries, can be tested using these techniques. The unit root null hypothesis offers evidence against convergence if it is not rejected. Divergence indicates that a variable does not tend to return to the average following a shock [23]. However, given that numerous economic series incorporate structural breaks, these tests may fail to detect these breaks, potentially diminishing the precision of the results. For example, traditional unit root testing may falsely suggest that nonlinearity is permanent [28]. Furthermore, little research has been carried out on the convergence of environmental taxation. Only two related studies concern the trend of environmental taxation in the EU [32,33], illustrating the statistical performance of the variables without explaining the reasons for the convergence.
3. Theory and Hypothesis
Generally, countries with less well-developed environmental tax systems tend to adopt more standardised environmental taxation to narrow the gap with countries that possess well-developed environmental tax systems, which is known as the catch-up effect. The EU adopts a fundamental principle and a flexible planning approach under its environmental tax regulation system, which thoroughly considers differences among member states and balances environmental protection and economic development [40]. This is in line with the principle of common yet differentiated responsibilities in the Paris Agreement, which allows EU countries with different levels of economic development to formulate specific environmental tax systems that suit their development [41,42]. Although all EU countries are part of the same environmental tax system framework, there are environmental taxation differences between countries due to their varying levels of economic development [4,43]. As the integration of EU countries deepens, the catch-up effect of economic development becomes more evident. This trend reflects the rapid narrowing of the economic gap between relatively underdeveloped countries and the other countries in the EU, resulting in the increasing applicability of environmental policies across different countries. Underdeveloped countries bear more responsibility for achieving the overall environmental goals of the EU, and their environmental tax systems naturally show higher convergence [44]. This perspective is akin to a peer effect, reflecting the EU’s status as a highly convergent political alliance. Within this framework, the actions, preferences, or decisions of individual member states are influenced by those of other member states [45]. For instance, a country might observe and emulate the successful tax strategies of a neighbouring country, or coordinate policy within the regional economic organisation, leading to a convergence of tax policies [46].
Furthermore, since the countries in the EU are geographically adjacent, the influence of neighbouring countries’ environmental tax policies on a country’s policy choices may lead to policy harmonisation or competition, which can be attributed to the spatial spillover effect [47]. Specifically, when one country adopts a strict environmental tax system, it imposes a higher tax burden on local businesses, which may lead to some highly polluting enterprises relocating to neighbouring countries to avoid taxation [48]. This results in more highly polluting enterprises being accepted by countries with lax environmental tax systems, causing significant negative externality to occur in the local ecological environment and gradually forcing these countries to adopt stricter and more standardised environmental tax systems [49]. Another challenge in designing environmental tax policies is the high cost of information due to asymmetry [50]. Therefore, EU countries use their consistent environmental policy frameworks to reference and learn from each other’s environmental tax systems and to improve and supplement their own types of taxes and scope of collection [51]. We therefore propose the following null hypothesis:
The sequences of environmental taxation, including energy and transport taxes, exhibit a convergent trend.
4. Sequential Panel Selection Method
Owing to the nonlinearities included in time series data about finance and macroeconomics, traditional unit root tests frequently demonstrate limited capacity to identify the direction in which the series is mean-reverting [52,53]. Environmental taxation has been proven to possess nonlinear attributes in previous research [32,33]. Ucar and Omay [54] address this issue by demonstrating the mean-reverting tendency by connecting the nonlinear framework of Kapetanios et al. [55] (KSS) with the panel unit root testing technique of Im et al. [56]. Furthermore, the ability to reject a unit root will be diminished if the series exhibits structural alterations [57]. When gathering data, structural alterations are frequently disregarded, which results in the adoption of the unit root null hypothesis. In this case, the Fourier-function-based SPSM can successfully handle this problem [53]. Therefore, using the SPSM with the Fourier function and the KSS panel unit root test would be reasonable for testing the stationarity of environmental levies in EU member states.
The KSS unit root test can identify the non-stationarity of a nonlinear ESTAR process that is globally stationary. The following formula represents the function:
where represents the environmental taxation and is subject to a standard normal distribution with a zero mean and constant variance. has a linear unit root if the null hypothesis is true; on the other hand, a nonlinear stationary ESTAR process exists. The transition speed of the ESTAR process is determined by the parameter , where . Kapetanios et al. [55] employ a first-order Taylor function approximation for under the null hypothesis , as shown by the following function:
The non-linear ESTAR stationarity alternative hypothesis is , and the non-stationarity null hypothesis is for this function. Next, Ucar and Omay [54] construct a nonlinear panel unit root test using the structure provided by Equation (1):
Similarly, we study the ESTAR model’s first-order Taylor series expansion around for all i in Equation (3):
where and we can formulate the hypotheses as follows:
, for all i, (linear non-stationarity);
, for some i, (nonlinear stationarity).
We next combine the Fourier function with Equation (4) as follows:
where t = 1, 2, …, T, k denotes the frequency to be approximated, quantifies the frequency’s amplitude and displacement, and is selected because integrable functions can be precisely approximated using a Fourier expression to any desired degree of precision. There is only one frequency component involved in a structural break. The claims made by Gallant [58], Becker et al. [59], and Pascalau [60] that an unknown aperiodic function can be captured in detail by a Fourier approximation corroborate this claim. Furthermore, the grid-search mechanics are utilised to determine the ideal frequency. According to Ucar and Omay [54], datasets with fewer than N observations are particularly well-suited for the statistic, particularly the OU statistic.
The entire empirical process was implemented using Matlab. The specific methodology is outlined as follows: the SPSM categorises panel members into stationary and nonstationary groups. The SPSM comprises three steps. First, the panel KSS test is applied to all series within the panel. If the null hypothesis of a panel unit root is accepted, the procedure stops, and all series in the panel are assumed to be nonstationary. However, if the null hypothesis of a unit root is rejected, the process proceeds to the second step. In this second step, the series with the minimum KSS statistic is removed from the panel, as it has been identified as a stationary process. Finally, the process either returns to step one for the remaining series in the panel or terminates the test if all series have been removed. The ultimate outcome of the SPSM is the partitioning of the entire panel into sets of stationary and nonstationary series.
5. Data
In the following analysis, we use data from the Eurostat dataset to use environmental taxation as a percentage of GDP for the 27 EU member states. Furthermore, in order to reflect the distinct converging tendencies of the energy and transport tax subcategories, we distinguish between them. In particular, energy taxes (which also include fuel taxes) cover taxes on stationary energy products, transport energy products, and greenhouse gas emissions. Other means of transportation (ships, aeroplanes, trains), flights and ticketing, car insurance, and taxes linked to the import or sale of motor vehicles, their registration or use, road usage, congestion charges, and city tolls are all included in transport taxes (which do not include fuel for transportation). The sample period spans from 1995 to 2020, and the selection of the period is based on two key reasons. First, during this time, public awareness of environmental issues increased significantly, profoundly influencing the formulation and implementation of environmental tax policies. From the Kyoto Protocol to the Paris Agreement, the international community’s heightened focus on climate change and environmental protection spurred continuous improvements in environmental policies. Key milestones include the adoption of the Fifth Environmental Action Programme and the European Environment Act in 1995, and later, the introduction of the European Green Deal, the Circular Economy Action Plan, and the Climate Law in 2020, which addressed climate change, biodiversity protection, circular economy promotion, and resource efficiency enhancement. The second reason is that post-2020, the emergence of the pandemic and escalating geopolitical tensions introduced uncontrollable and unpredictable social factors that impacted the trajectory of environmental taxes. This period is notable for the consistent introduction of environmental policies and the significant increase in public awareness in EU countries, making it especially representative. The Amsterdam Treaty, signed by the EU member countries in 1997, made sustainable development a fundamental goal. The European Parliament approved the Paris Agreement by the EU in 2016 to control the upward trend in the global average temperature within two degrees compared to the preindustrial period, against the backdrop of the UN’s Sustainable Development Goals (SDGs) in 2015. The European Green Deal Plan was introduced by the European Commission in 2019 as a broad strategy to combat climate change and promote sustainable development [61]. The principal aim of this endeavour is to achieve carbon neutrality throughout the European Union by 2050.
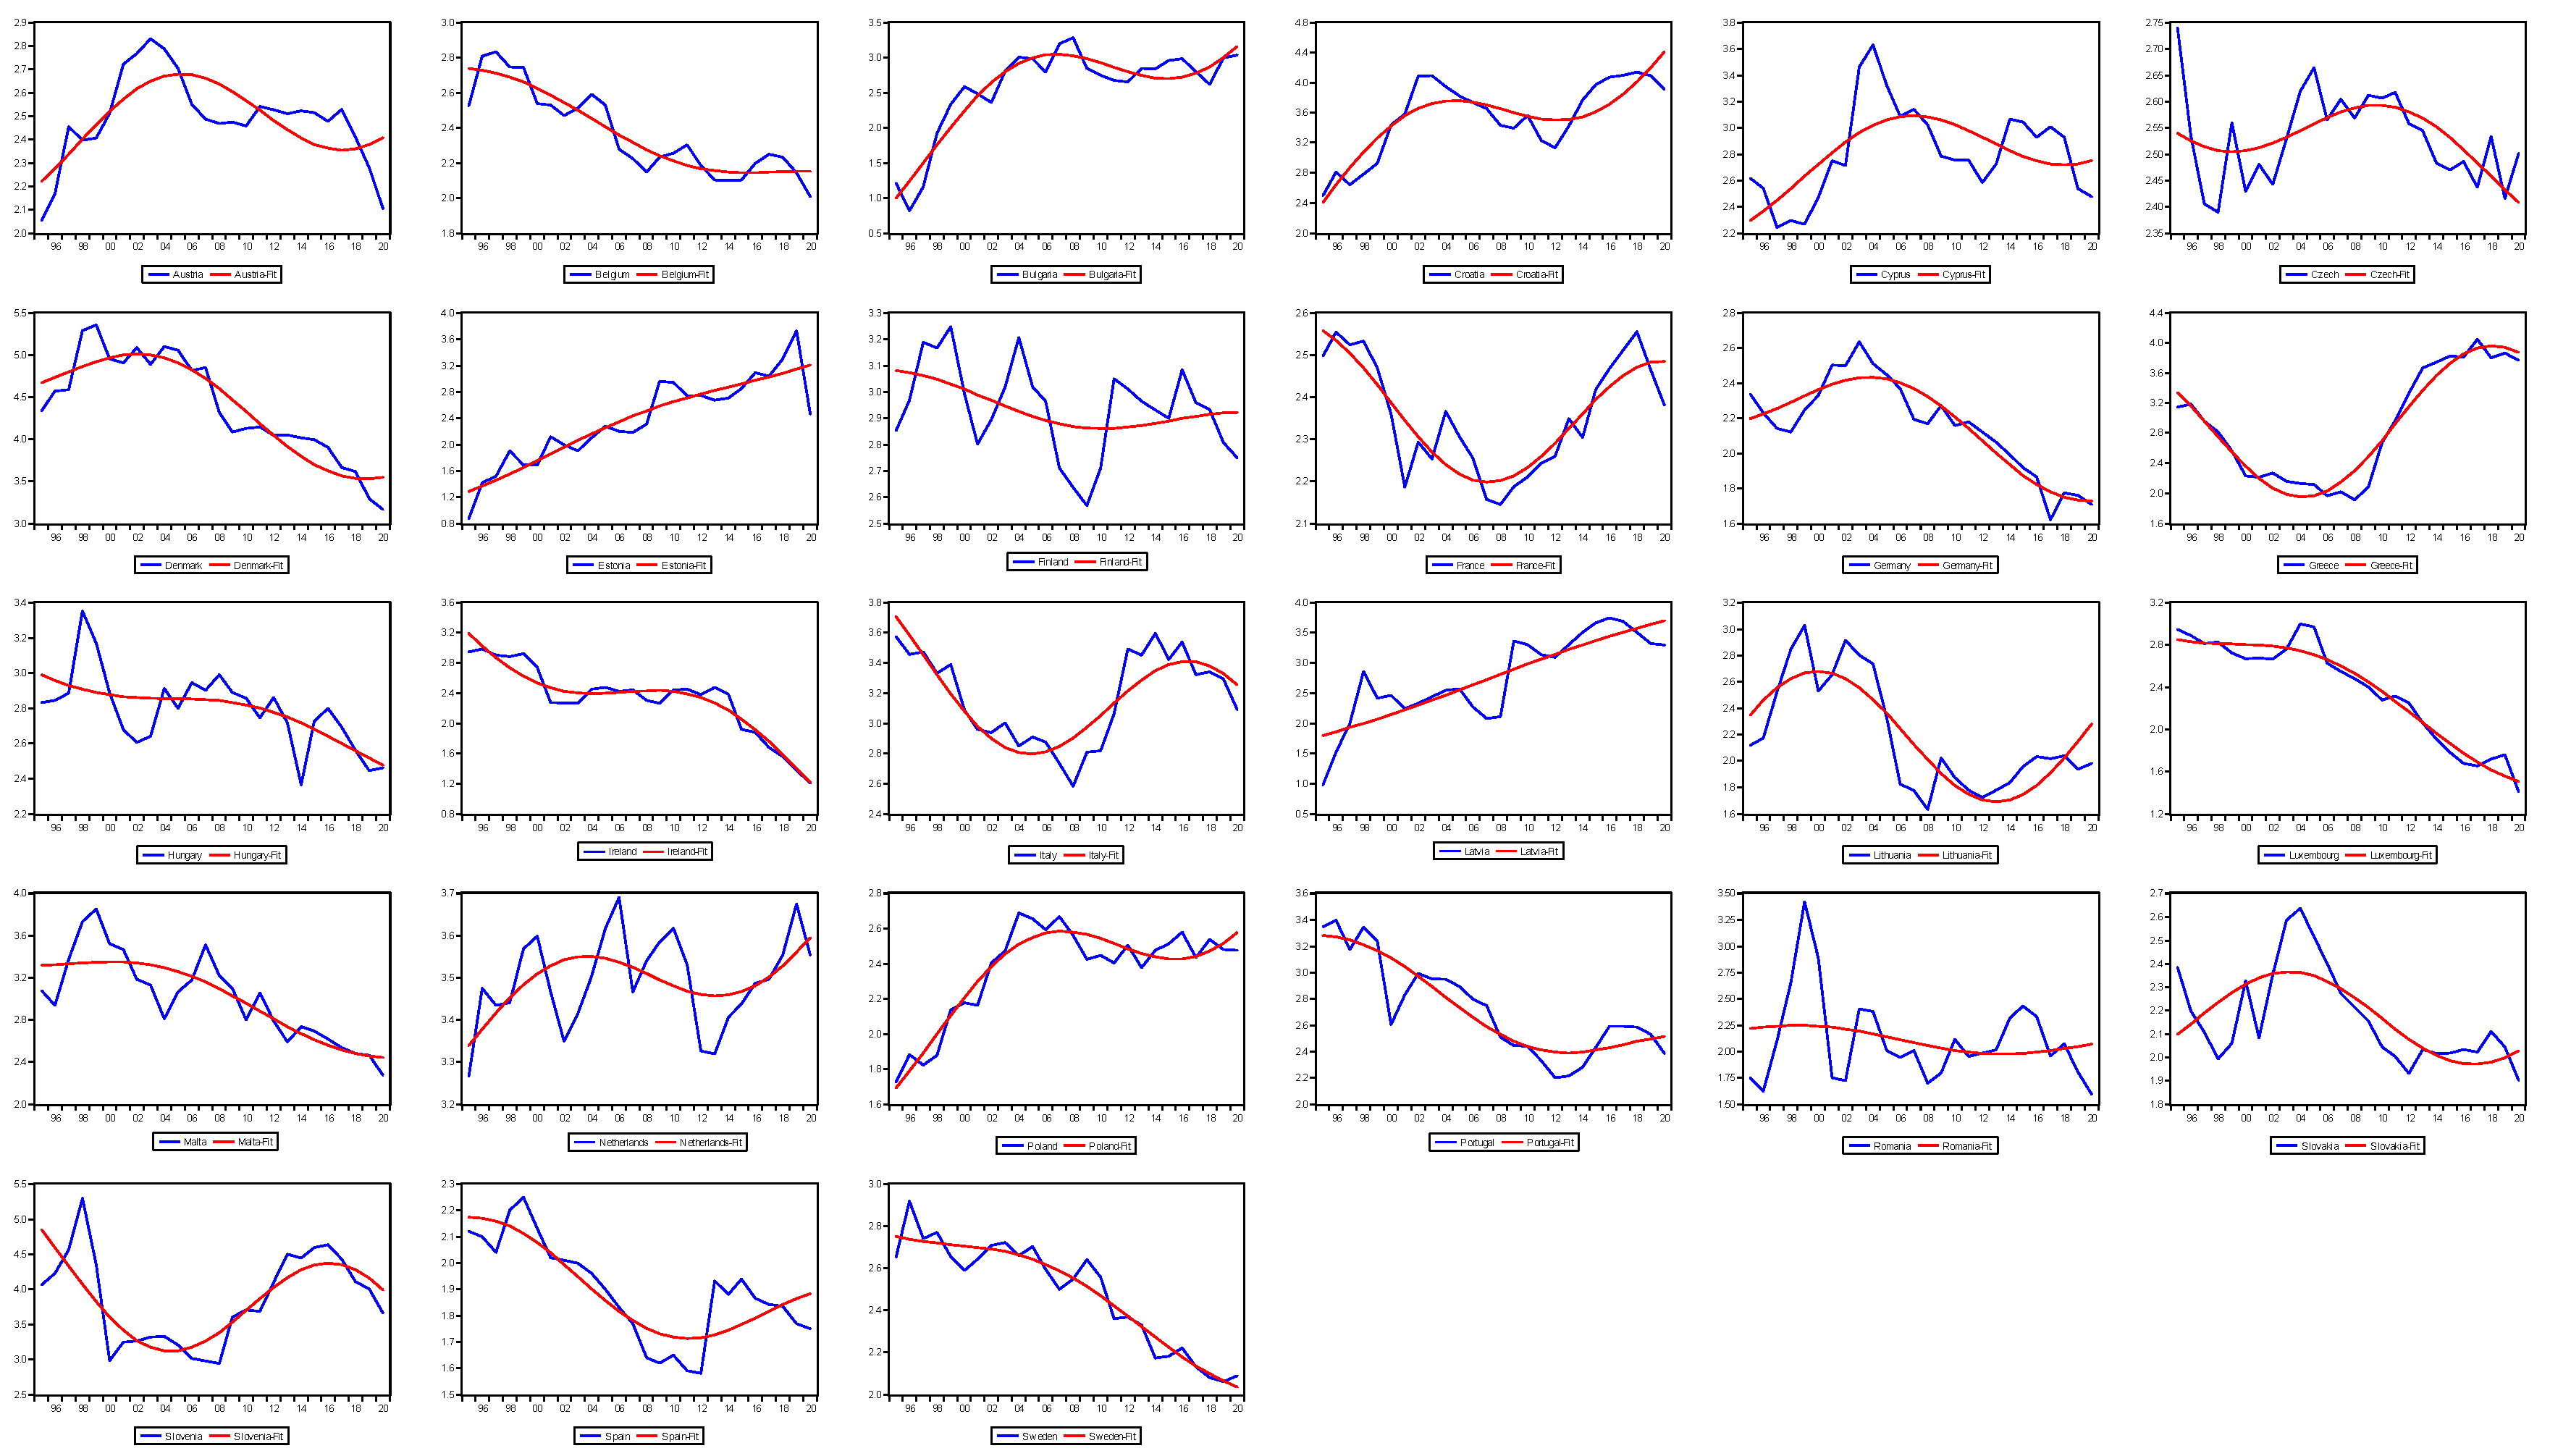
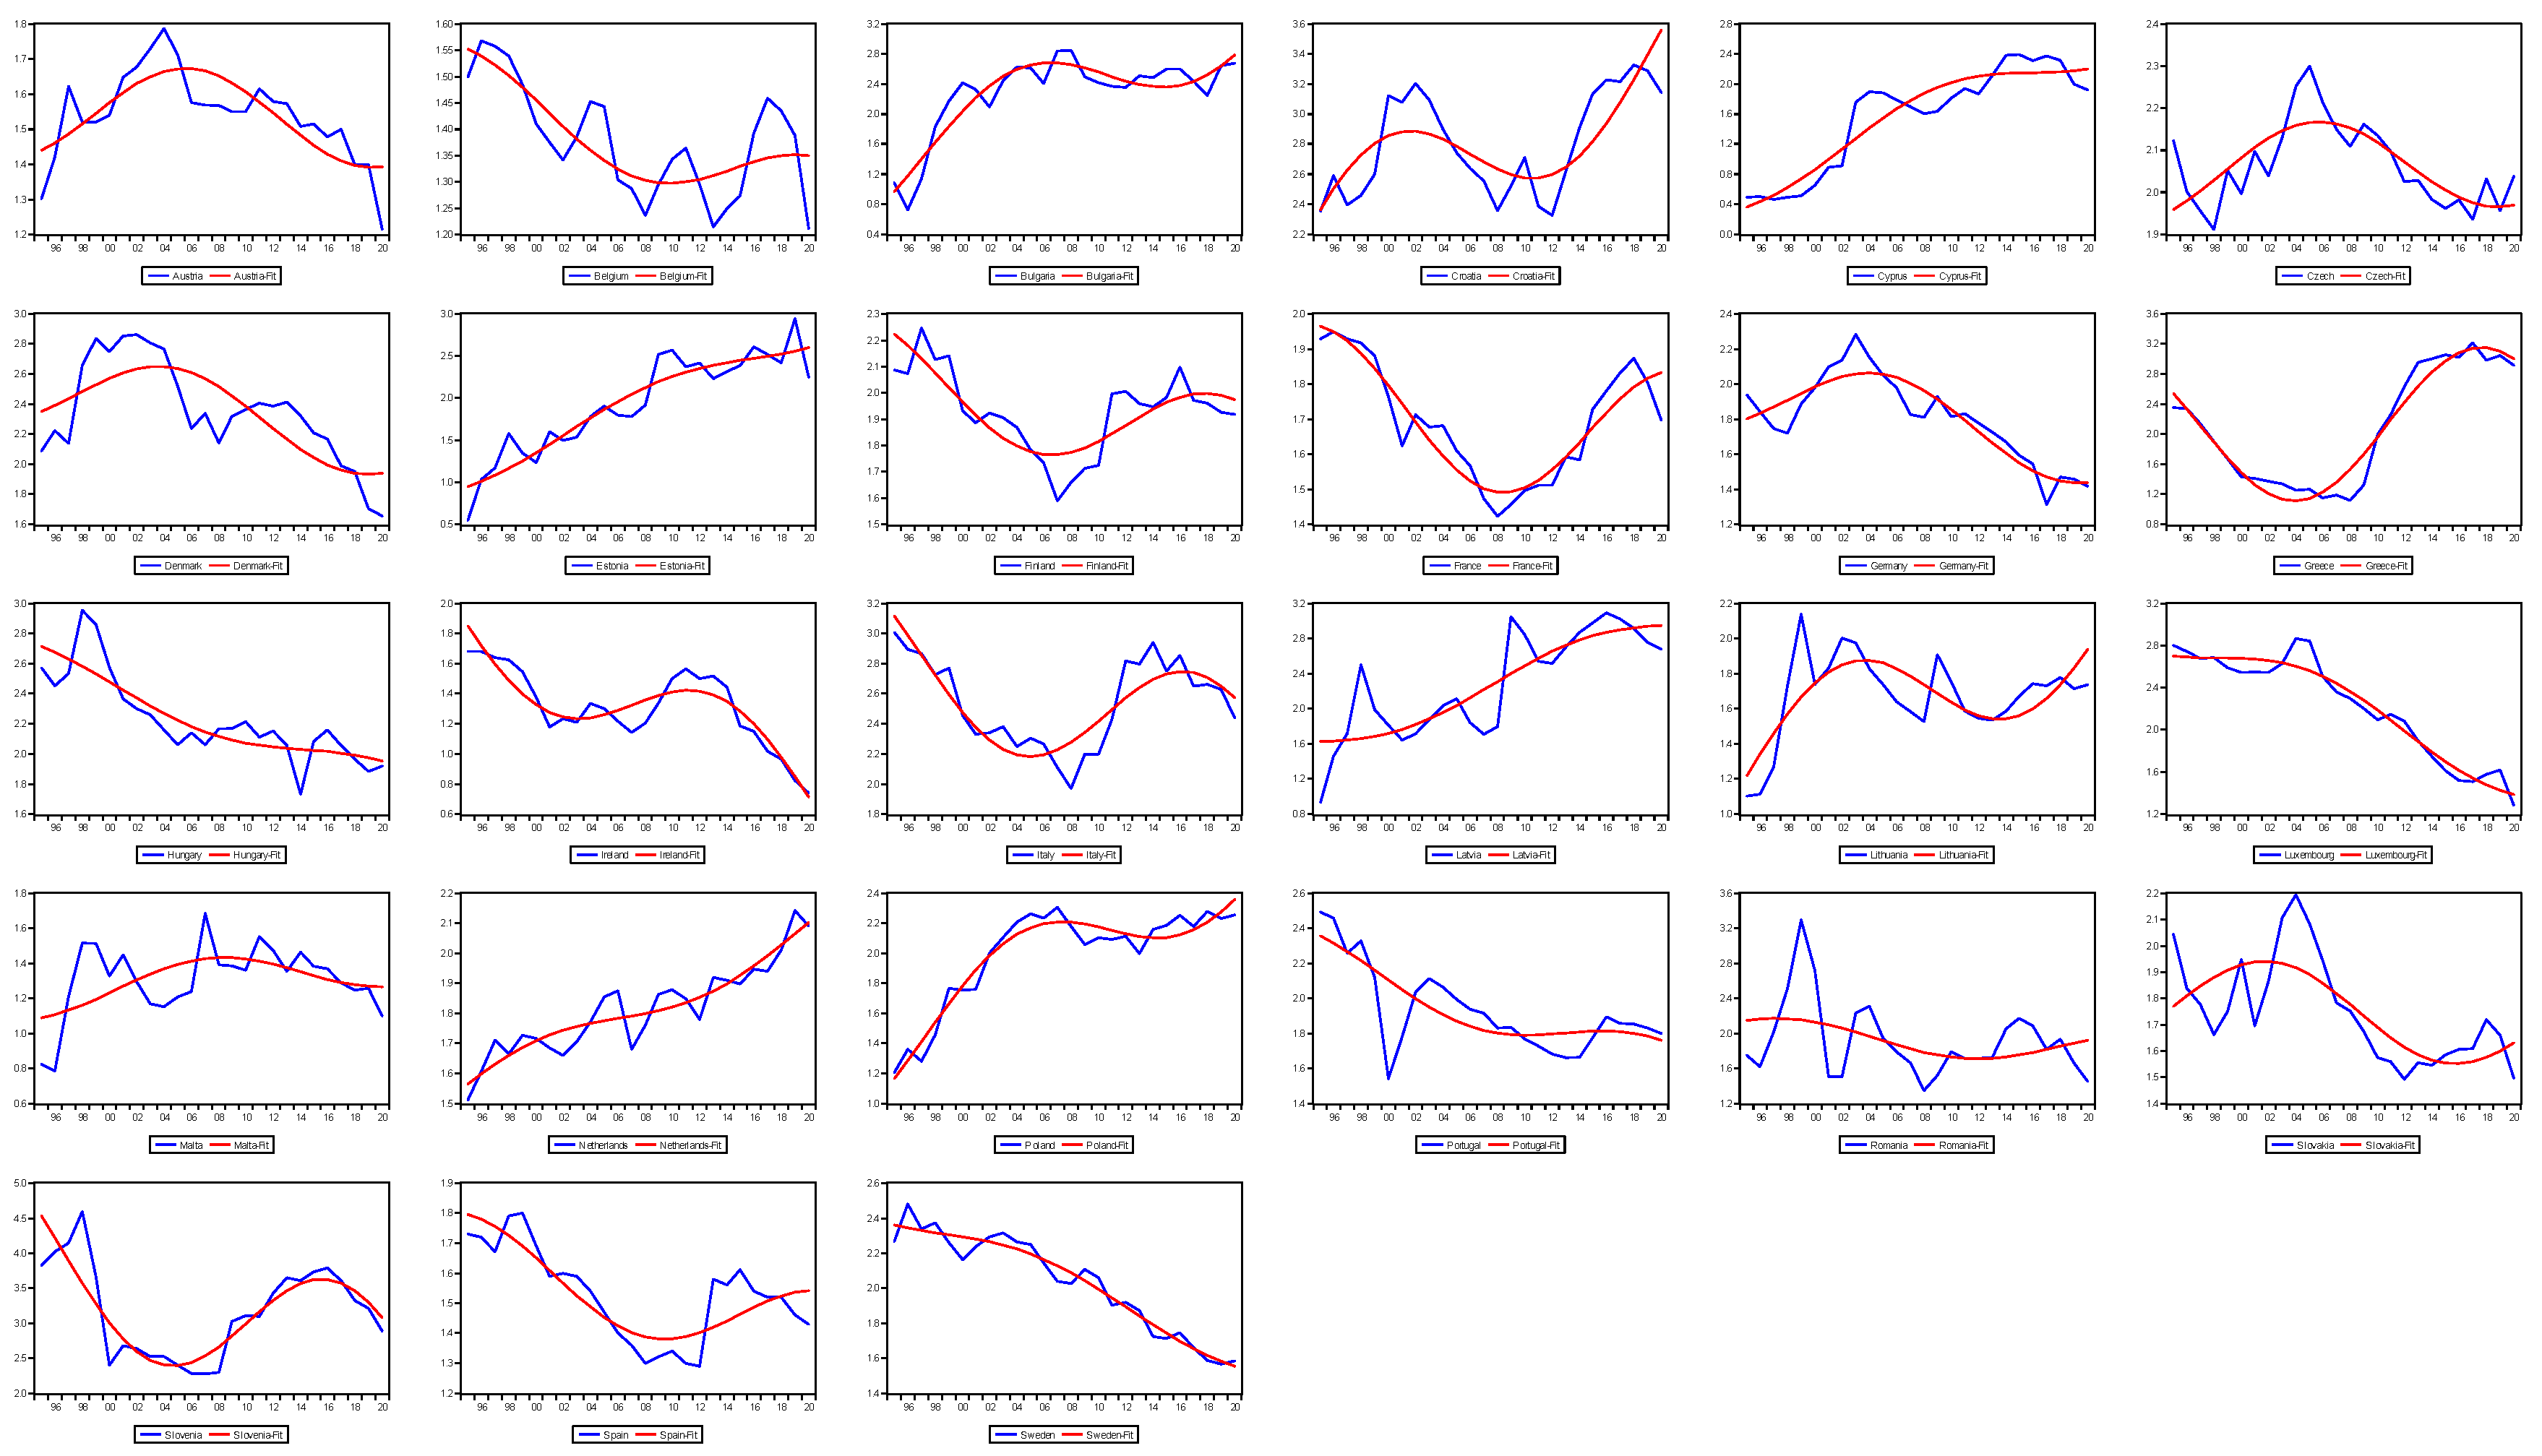
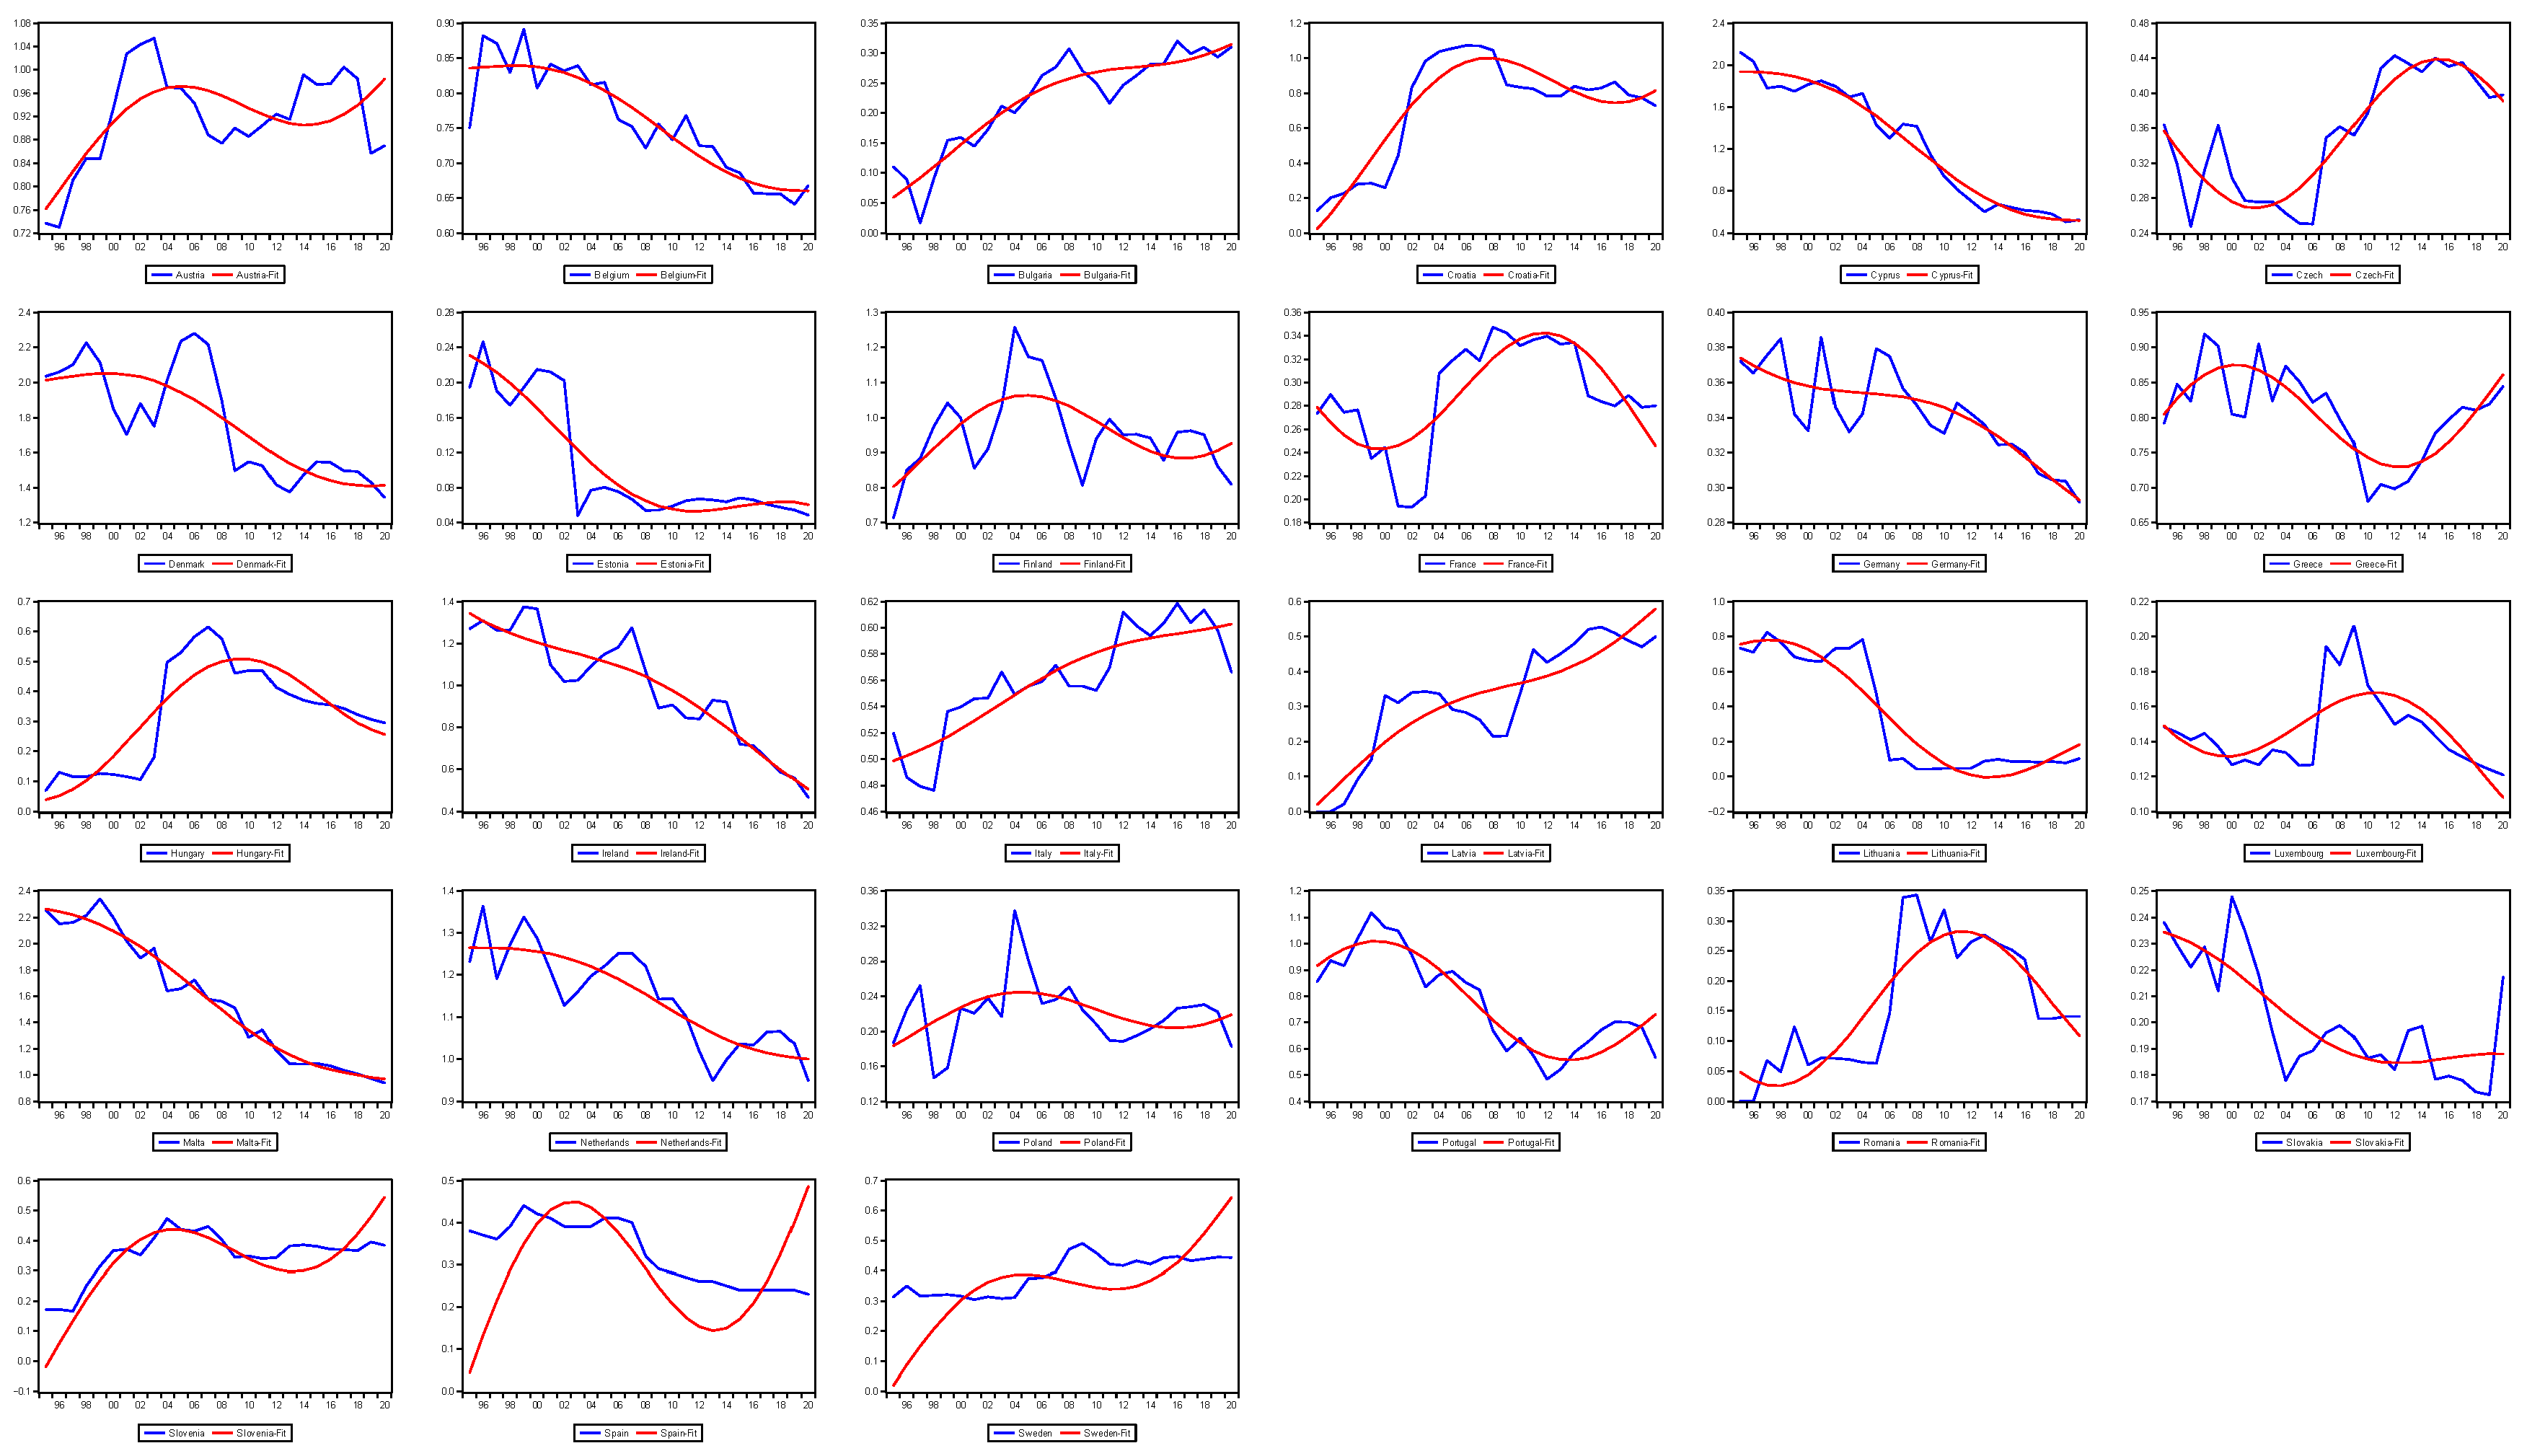
Figure 1, Figure 2 and Figure 3 depict the original series of environmental tax, energy tax and transport tax (coloured in blue), respectively, and their deterministic trends (coloured in red) to observe the nonlinearities. Intuitively, most of the time, series do not exhibit a single upward or downward trend but rather have significant structural changes. Consequently, it is prudent to incorporate the potential for structural changes when assessing unit root null hypotheses. Given the potential presence of structural breaks in our dataset, a nonlinear approach is warranted for subsequent trend analysis.
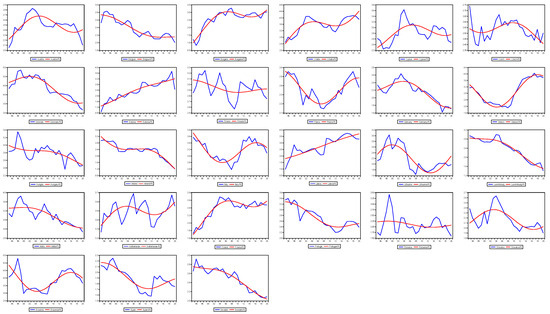
Figure 1.
The trends of the environmental tax and fitted nonlinearities.
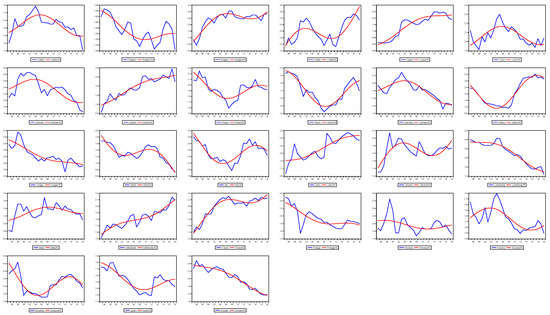
Figure 2.
The trends of the energy tax and fitted nonlinearities.
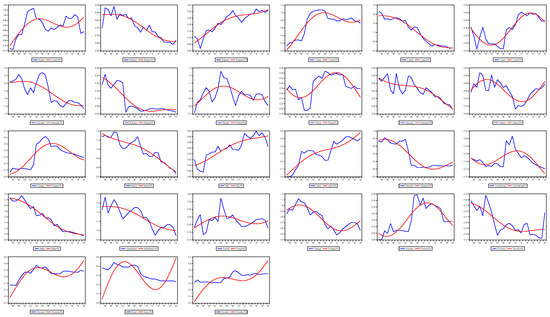
Figure 3.
The trends of the transport tax and fitted nonlinearities.
Table 1a–c presents the descriptive environmental, energy, and transport tax statistics in EU-27 countries. Table 1a shows that the mean values of environmental taxes are mostly between 2% and 3% in these countries, with Denmark, Slovenia and Croatia having the highest mean values (more than 3.5%). Specifically, Denmark has the highest environmental tax (5.359%), and Bulgaria has the lowest one (0.814%). The standard deviation value of environmental taxation in Greece is the largest, denoting it is more volatile than that of other countries. According to the kurtosis, Hungary and Romania follow leptokurtic distributions since the kurtoses are more significant than 3. In Poland and Romania, it is possible to reject the null hypothesis of normal distribution, as demonstrated by the Jarque–Bera statistics. Similarly, it can be seen in Table 1b that the mean values of energy taxes are mostly between 1% and 2%, where Slovenia has the highest mean value (more than 3%) and the highest environmental tax (4.593%). The lowest environmental tax occurs in Cyprus (0.461%). Furthermore, the null hypothesis of the normal distribution can be rejected in Bulgaria, Poland and Romania. According to Table 1c, the mean values of transport taxes in most EU countries are no higher than 1%, except Cyprus, Denmark, Malta and the Netherlands. For Slovenia, Poland, and Luxembourg, the null hypothesis of a normal distribution is rejected, according to the Jarque–Bera statistics.

Table 1.
(a) Descriptive statistics of environmental tax in EU-27 countries. (b) Descriptive statistics of energy tax in EU-27 countries. (c) Descriptive statistics of transport tax in EU-27 countries.
6. Empirical Results
We employ the panel unit root tests, which allow for the combination of the cross-sectional and time dimensions. The Im–Pesaran–Shin (IPS) [56], Levin–Lin–Chu (LLC) [62], Fisher–ADF [63], and Fisher–PP [64] tests are listed in Table 2. As indicated by the first two columns, the null hypothesis cannot be rejected by these four tests even under the 10% significance level, suggesting that all the sequences of environmental tax have a unit root. However, mixed conclusions can be found in the energy and transport tax sequences. The Fisher–PP implies the null hypothesis can be rejected under the 10% significance level, suggesting that the energy tax sequence is stable, whilst the other three test techniques cannot reject the null. Similarly, the series of transport taxes can be concluded to be stable by the LLC test, while it is unstable according to other methods. However, the panel-based unit root test methods still have their drawbacks as they do not consider the presence of structural breaks, which may lead us to conclude that the sequence is unstable. Most importantly, these methods cannot provide specific characteristics for individual countries.
Table 2.
Panel unit root tests.
To address this problem, we use the SPSM technique within a non-linear framework employing the Fourier function and a panel KSS unit root test. With this method, structural fractures of an unknown form can be silently captured [19]. One can also use this test to address the cross-section dependence issue. Table 3 presents the findings.
Table 3.
(a) Results of panel KSS with Fourier test on environmental tax. (b) Results of panel KSS with Fourier test on energy tax. (c) Results of panel KSS with Fourier test on transport tax.
6.1. Environmental Tax
Data about environmental tax are shown in Table 3a. After carrying out the panel KSS test, we use a statistic of −3.475 to reject the null hypothesis at the 1% significance level. After that, we carry out the SPSM procedure to determine Romania’s minimal KSS value, which shows that the country’s environmental tax is stationary. After that, we eliminate the entire sequence from the panel and do the same for the other sequences. At a 1% significance level, the data with a value of −2.882 can be disregarded, and in the related series, Estonia—which, according to SPSM, has the lowest KSS value—is eliminated from the panel. We go through this process again until the null hypothesis can no longer be rejected at the 10% significance level. Ultimately, 22 sequences are chosen, which show that these series are stationary: Romania, Estonia, Bulgaria, Sweden, Malta, Czech Republic, Finland, Netherlands, Denmark, Hungary, Belgium, Greece, Portugal, Lithuania, Latvia, Poland, Austria, Slovenia, Italy, Croatia, Slovakia, and Ireland. Thus, the remaining five series are diverging, which are Luxembourg, Germany, Spain, France, and Cyprus. Therefore, the environmental taxes in EU countries exhibit non-convergence, which indicates a deviation from theoretical hypothesis. We then summarise the reasons for the lack of convergence among these countries.
Luxembourg experiences a rapidly expanding economy concurrent with a growing population and exhibits discrepancies in energy policy and environmental tax systems compared to other EU countries [65]. Luxembourg implements a relatively loose environmental tax policy for individuals and households, making tax evasion a straightforward endeavour, consequently undermining the effectiveness of environmental taxation. Specifically, the residential building sector in Luxembourg serves as a significant energy consumer and contributor to greenhouse gas emissions, making it a pivotal element in the nation’s efforts to attain environmental objectives. Regrettably, the residential building sector is unlikely to achieve the national energy and climate objectives by the deadline, according to all projections [66]. The observed result is linked to Luxembourg’s relatively lower environmental tax threshold compared to other EU countries, especially the taxation of fossil fuels [67]. Moreover, Luxembourg’s environmental tax system may give rise to an ecological deficit problem. This is attributed to the ecological demand exceeding ecological supply, which may potentially result in environmental issues and ecosystem collapse [68].
Solving the domestic environmental protection problem in Germany is challenging. From one perspective, Germany boasts a developed manufacturing sector and heavy industry, annually exporting a substantial quantity of industrially manufactured goods abroad. This practice brings economic benefits to Germany yet simultaneously poses a significant challenge to the country’s environmental policy [69]. From another perspective, Germany exhibits an exceptionally high per capita car ownership rate in comparison to other EU countries, with 583 cars per 1000 people in 2022. Germany continues to grapple with a substantial dependence on traditional energy sources given that new energy vehicles have not yet become widespread [70]. Consequently, addressing the fuel consumption associated with the transportation sector is a pivotal focus for environmental tax reform in the country. In Germany, power generators use a significant amount of coal, and the carbon tax equivalent from the EUETS (European Union Emissions Trading System) is not enough to cover the cost of carbon damages, let alone the more significant costs associated with local pollution damages.
In Spain, the implementation of environmental taxation has been belated and not uniform across the entire nation. The establishment of environmental taxation has progressed unevenly, with the formulation of environmental tax mainly concentrated in a few regions [71]. In addition, the Spanish government have implemented a defensive strategy, leveraging the unanimity requirements within the EU regarding fiscal harmonisation [72]. Such conduct unquestionably reflects the conviction that environmental taxation could hamper economic growth in Spain [73]. The central government controls the most potent environmental taxation, while sub-central governments carry out the most specific measures. That makes local governments unable to implement standard environmental tax policies, while the central government not only refrained from introducing environmental taxation and implementing a Green Tax Reform (GTR) but has gone as far as thwarting the efforts of the European Commission (EC) to act along these lines [74]. Overall, Spanish regions have insufficient financial resources to cover the expenses associated with tertiary environmental treatments, and the policy objective of the environmental tax cannot be achieved because it does not fulfil the principle of economic–financial balance.
Among the EU member countries, France has established its environmental tax at a relatively low level. The French tax system, which employs tax revenues for environmental investments through administrative procedures, also presents certain shortcomings [75]. For example, environmental taxation in France has a regressive effect on income distribution. It benefits the rich and burdens the poor because the poor spend a larger share of their income on energy products such as fuel and gas. These products are taxed to fund renewable energy and climate change mitigation projects, meaning people experiencing poverty are subsidising the nation’s energy transition. This practice exacerbates the income inequality gap between the affluent and the less well-off [76]. In 2010, France considered implementing a carbon tax project, following other EU member countries. However, this environmental tax reform was not comprehensible and acceptable to taxpayers, leading the government to postpone the project until a European policy could be implemented [77].
In the case of Cyprus, there is no established resource tax system in place [78]. Environmental taxation in Cyprus accounts for 2.9% of the national GDP, slightly higher than the EU average of 2.4%, and represents 8.8% of total tax revenues. However, the presence of environmentally harmful subsidies indirectly reduces this proportion. These subsidies include an annual loss of EUR 15 million due to the exemption of taxes on liquid fuels, as well as the over-exploitation of valuable water resources. This situation is particularly concerning as Cyprus faces higher water stress than any other EU country [79]. This indicates that Cyprus confronts significant energy and environmental challenges, especially considering its lower energy productivity compared to other EU countries.
The convergence of environmental taxes in EU member states, excluding Luxembourg, Germany, Spain, France, and Cyprus, can be attributed to several factors within the unified policy framework of the EU. These include the pressure of international environmental commitments, the transformation of economic structures, the adoption of technological and policy innovations, and fiscal and economic incentives [80]. These factors collectively contribute to a similar trend in environmental tax policies across most EU nations. Although there may be variations in the specific implementation by individual countries, overall policy convergence has been achieved [81]. Based on the catch-up effect, EU countries not only pioneer governance goals in environmental management but also actively employ mechanisms like environmental taxes to promote sustainable development in increasingly interconnected global environment. Despite the varying economic foundations across EU nations, the unified EU environmental policy framework facilitates the gradual refinement and spread of environmental taxes from a few leading countries to others. This progression aims to achieve unified environmental objectives and enhance market competitiveness, as observed in the convergence among the 22 countries studied.
6.2. Energy Tax
Similarly, the results presented in Table 3b demonstrate that the panel KSS unit root test is capable of rejecting 23 energy tax series, meaning that energy taxation is stable in those countries (Austria, Hungary, Ireland, Italy, Czech Republic, Slovenia, Finland, Cyprus, and Croatia) and that such series are susceptible to rejection. The remaining four sequences, which at the 10% significance level were unable to reject the null hypothesis, show that energy taxes in these nations—Croatia, Spain, Germany, and France—are diverging. Energy tax in EU countries also show instances of non-convergence, failing to fully align with theoretical hypothesis. And we systematically analyse the reasons for the non-convergence of energy taxes in these countries.
Croatia, despite being an EU member state, has a distinct institutional background compared to other EU countries. Not only did Croatia join the EU later, but due to its unique political background and public perceptions, the institutions and ideologies of the EU were initially not well received or adopted by Croatia. For instance, Croatia enacted the Excise Tax Act in 2009, aligning its excise tax system with that of the EU and subsequently began taxing energy products used for fuel or heating, as well as electricity, following EU directives on energy product taxation [81]. However, due to variations in its own energy efficiency and the level of energy marketisation, substantial disparities persist in numerous aspects. The energy tax rates remained notably below the EU-27 average by 2022, underscoring a persistent disparity. In 2018, the portion of revenues from energy taxes in Croatia’s GDP amounted to a mere 2.35%. These data significantly deviate from the figures observed in other developed EU countries. This disparity can be attributed to variations in the excise tax framework between less-developed EU nations and their more advanced counterparts. Generally, less-developed countries exhibit a more substantial reliance on non-renewable resources when compared to developed countries [81].
Spain’s energy taxation system possesses unique characteristics. On the one hand, the country heavily relies on conventional energy sources. In specific, the proportion of gasoline expenditure to income is highest for high-income groups, which means that this part of the population, with the most capital to drive energy transition, has a very high dependence on traditional energy sources, hindering the development of new energy technologies in Spain [82]. On the other hand, the significant disparity in energy taxation between Spain and developed EU countries, such as Germany, France, and Italy, can be attributed to the fact that Spain maintains notably lower energy tax rates [83]. Energy taxes are typically integrated into the tax system in a limited or indirect manner, which can incentivise negative environmental behaviour and contribute to the regressive nature of environmental taxation.
Germany exhibits higher energy intensities than the other EU countries, with an exceptionally high energy intensity across all fuel components, including electricity, gas, oil and coal. The high energy use intensity undoubtedly places higher demands on Germany’s energy tax policy [84]. Due to industrial giants’ limited ownership of renewable energy production facilities, they exert strong lobbying efforts in support of fossil fuels and nuclear power, hindering the progress of Germany’s energy tax promotion. Furthermore, public opinion on environmental tax reform frequently exhibits ambiguity and contradictions. The prevailing consensus suggests that elevated energy taxes play a role in incentivising energy-saving behaviours and promoting environmental protection. However, a minority posits a different perspective, contending that the German Environmental Tax Reform (ETR) lacks perceived environmental effectiveness due to the revenue generated not being earmarked for ecological purposes [85].
The implementation of the energy tax system in France began relatively late. This delay can be attributed to decision-makers’ limited comprehension of business and public viewpoints, making it challenging to find a harmonious equilibrium between social acceptability and political feasibility. Conflicts among governments have also resulted in such a technocratic energy tax system [86]. The energy tax in France exhibits a higher regressive nature than other EU countries, placing higher financial burdens on low-income households. Specifically, the energy tax system gives rise to significant horizontal distributive consequences, which are comparatively more intricate to rectify than vertical distributive effects. This results in greater financial losses for low-income households than their wealthier counterparts [87].
Ultimately, we discovered that the countries where the energy tax does not converge are very similar to those where environmental taxes do not converge. Except for Croatia, all other countries are also non-convergent regarding environmental taxes. The unique national circumstances of Croatia, differing from most EU countries, have already been separately explained earlier in this text. Considering the convergence trend in energy taxes among EU countries, it is indeed inevitable for EU member states to adopt measures that enhance their competitive advantage in a globalised perspective to meet the demands of a low-carbon economy and to drive the transition to a green economy. Consequently, most countries have a more resounding consensus on implementing energy taxes [88]. Coupled with the rapid development of new energy sources today, adopting energy taxes to stimulate the transition to new energy sources is also necessary to facilitate the rapid adoption of new energies within their territories.
6.3. Transport Tax
The results presented in Table 3c demonstrate that the panel KSS unit root test rejects the null hypothesis for all the transport tax series, indicating stability in the transport tax among EU member countries. Transport taxes in EU countries exhibit a convergence trend, aligning with theoretical hypothesis. This manifests a convergence in transport taxes among the EU-27 countries, alighting with Delgado [32]. The intriguing phenomenon has captured our attention and prompted contemplation.
To mitigate external costs associated with using road vehicles and foster sustainable economic growth, implementing transportation taxes is deemed essential [89,90]. This is particularly so in the context of EU member states committed to creating a single market, seeking to lower barriers on the domestic market, fostering the free flow of people, products, and services, and implementing environmentally friendly transportation practices to lessen negative environmental effects [91]. Consequently, the member countries have a relatively uniform and developed transportation tax system [92]. In addition, unlike the other environmental tax we mentioned above, the economic development disparities are less pronounced in the context of transportation taxes [93]. In fact, nations share similar challenges in their transportation sectors, such as traffic congestion [92,94]. For EU countries, it is reasonable to exhibit higher convergence in their transportation tax systems in line with the green conventions aimed at pollution reduction.
6.4. Robustness Test
To further assess the robustness of our empirical results, we employed the Zivot–Andrews (ZA) test. The ZA test is a statistical method designed to detect structural breaks in time series data. The alternative hypothesis of the ZA method posits that the series is trend-stationary, with a one-time break occurring at an unknown point in the trend variable, while simultaneously testing for a unit root [95]. Unlike traditional unit root tests, such as the ADF test, the ZA test allows for an unknown structural break in the data, enabling a more accurate determination of whether a unit root exists near the break point, thus preventing potential misjudgments caused by overlooking structural breaks [96]. The results of the ZA test are presented in Table 4. We obtained results highly consistent with those from the SPSM method, further ensuring the accuracy and reliability of our empirical process.
Table 4.
Results of Zivot–Andrews test.
6.5. Discussion
Reflecting upon our empirical results, it is evident that non-converging countries in environment-related taxation are typically developed economies. These nations possess relatively sophisticated domestic environmental tax systems already in place. Above all, adding environmental levies to energy production and consumption means additional expenses for businesses and people in these nations, who are already burdened with high tax rates [97]. Energy taxes directly impact the industrial sector’s and the economy’s overall competitiveness [98]. Countries with high levels of economic development and broad overseas markets may hesitate to implement environmental taxation that could impede their economic development and foreign trade [99]. Moreover, given the variation in environmental tax policies across countries, an excessively stringent environmental tax could put domestic businesses at a disadvantage in global market competition [100]. Second, in order to support the environmental objectives they hope to accomplish, many affluent nations have not put in place matching environmental tax policies. Some countries have not taken concrete actions to fulfil their commitments to various international environmental conventions [101]. For example, the Paris Agreement commits the G7 economies to limiting global warming to less than 2 °C above pre-industrial levels and aiming for a 1.5 °C increase in temperature. The United Nations Environment Programme’s (UNEP) Emissions Gap Report 2020 shows that these goals are not being met. The report’s evaluation of the G7 countries’ present nationally defined contributions predicts that temperatures will rise by 2.6 °C over the next century, exceeding the target outlined in the Paris Agreement. The research also highlights the fact that none of the G7 nations have goals that align with the 1.5 °C limit [102].
7. Conclusions
This study investigates the convergence of environmental taxation among EU countries using the KSS panel unit root test and the SPSM with a Fourier function, which considers potential structural shifts and cross-section dependence issues in the time series. The empirical findings also show that, except in Luxembourg, Germany, Spain, France, and Cyprus, the environmental tax sequences of most EU member states show a convergence trend, which can be regarded as the symphonic character. We further categorise environmental taxes into energy and transportation taxes to capture their specific trends. Regarding energy taxes, it is noteworthy that Croatia, Spain, Germany, and France exhibit divergent solo trends and the remaining 23 countries present convergence in their energy tax sequences. The sequences for transport tax in all EU member countries exhibit stability, indicating that transport tax policies are symphonically convergent across all EU member countries. This trend of convergence in environmental taxation can be explained by the catch-up and peer effects, indicating that countries with less well-developed environmental tax systems will catch up with countries that are more developed in this regard. Furthermore, the spatial spillover effect exacerbates this convergence among EU countries. However, a minority of advanced economies have not converged because of their low implementation of environmental goals due to economic development and market competition.
Our findings allow for the proposal of the following recommendations. Firstly, although some developed EU countries have achieved economic progress, they should strengthen their environmental goals to align with the SDGs. Specifically, for the sake of the convergence process promotion, innovative forms of taxation should be exploited to mitigate negative externalities on income inequality and market operations. Simultaneously, cross-country policy coordination also should be highlighted in order to achieve unified environmental objectives. Moreover, the countries with lower development can establish more specific environmental tax policies that fit their national conditions under the unified environmental system framework of the EU as their economies grow. Ultimately, achieving the double dividend effect of environmental taxation hinges on the collaborative implementation of diverse environmental taxation rather than relying solely on a singular form of environmental tax. Countries must meticulously coordinate their application of subdivided environmental taxation to achieve better environmental effects.
The limitations of this study primarily stem from the restricted selection of national samples and variations in policy implementation, which may limit the results’ applicability to other regions or economies. To address these limitations, future research could explore a broader range of environmental policy variables, such as carbon-pricing and subsidy policies, and consider the influence of non-economic factors on the variables.
Author Contributions
Conceptualization, Z.L. and Z.S.; methodology, Z.L. and K.W.; software, K.W.; validation, Z.L., O.-R.L. and Z.S.; formal analysis, K.W. and Z.S.; investigation, Z.L.; resources, Z.L.; data curation, Z.S.; writing—original draft preparation, Z.L. and Z.S.; writing—review and editing, Z.S., K.W. and O.-R.L.; visualization, Z.L.; supervision, Z.L. and O.-R.L.; project administration, Z.L.; funding acquisition, Z.L. All authors have read and agreed to the published version of the manuscript.
Funding
This research was funded by Shandong Provincial Natural Science Foundation Youth Project, grant number [ZR2023QG001].
Data Availability Statement
The data is linked from https://ec.europa.eu/eurostat/data/database (accessed on 30 August 2024).
Conflicts of Interest
The authors declare no conflict of interest.
References
- Filipović, S.; Lior, N.; Radovanović, M. The green deal–just transition and sustainable development goals Nexus. Renew. Sustain. Energy Rev. 2022, 168, 112759. [Google Scholar] [CrossRef]
- Khan, J.; Johansson, B. Adoption, implementation and design of carbon pricing policy instruments. Energy Strategy Rev. 2022, 40, 100801. [Google Scholar] [CrossRef]
- Wolde-Rufael, Y.; Mulat-Weldemeskel, E. Effectiveness of environmental taxes and environmental stringent policies on CO2 emissions: The European experience. Environ. Dev. Sustain. 2023, 25, 5211–5239. [Google Scholar] [CrossRef]
- Tan, Z.; Wu, Y.; Gu, Y.; Liu, T.; Wang, W.; Liu, X. An overview on implementation of environmental tax and related economic instruments in typical countries. J. Clean. Prod. 2022, 330, 129688. [Google Scholar] [CrossRef]
- Norouzi, N.; Fani, M.; Talebi, S. Green tax as a path to greener economy: A game theory approach on energy and final goods in Iran. Renew. Sustain. Energy Rev. 2022, 156, 111968. [Google Scholar] [CrossRef]
- Rafique, M.Z.; Fareed, Z.; Ferraz, D.; Ikram, M.; Huang, S. Exploring the heterogenous impacts of environmental taxes on environmental footprints: An empirical assessment from developed economies. Energy 2022, 238, 121753. [Google Scholar] [CrossRef]
- Abbas, J.; Wang, L.; Belgacem, S.B.; Pawar, P.S.; Najam, H.; Abbas, J. Investment in renewable energy and electricity output: Role of green finance, environmental tax, and geopolitical risk: Empirical evidence from China. Energy 2023, 269, 126683. [Google Scholar] [CrossRef]
- Dogan, E.; Hodžić, S.; Šikić, T.F. Do energy and environmental taxes stimulate or inhibit renewable energy deployment in the European Union? Renew. Energy 2023, 202, 1138–1145. [Google Scholar] [CrossRef]
- Mahmood, N.; Zhao, Y.; Lou, Q.; Geng, J. Role of environmental regulations and eco-innovation in energy structure transition for green growth: Evidence from OECD. Technol. Forecast. Soc. Change 2022, 183, 121890. [Google Scholar] [CrossRef]
- Bor, Y.J.; Huang, Y. Energy taxation and the double dividend effect in Taiwan’s energy conservation policy—An empirical study using a computable general equilibrium model. Energy Policy 2010, 38, 2086–2100. [Google Scholar] [CrossRef]
- Degirmenci, T.; Aydin, M. The effects of environmental taxes on environmental pollution and unemployment: A panel co-integration analysis on the validity of double dividend hypothesis for selected African countries. Int. J. Financ. Econ. 2023, 28, 2231–2238. [Google Scholar] [CrossRef]
- Neves, S.A.; Marques, A.C.; Patrício, M. Determinants of CO2 emissions in European Union countries: Does environmental regulation reduce environmental pollution? Econ. Anal. Policy 2020, 68, 114–125. [Google Scholar] [CrossRef]
- Dogan, B.; Chu, L.K.; Ghosh, S.; Truong, H.H.D.; Balsalobre-Lorente, D. How environmental taxes and carbon emissions are related in the G7 economies? Renew. Energy 2022, 187, 645–656. [Google Scholar] [CrossRef]
- Alola, A.A.; Nwulu, N. Do energy-pollution-resource-transport taxes yield double dividend for Nordic economies? Energy 2022, 254, 124275. [Google Scholar] [CrossRef]
- Yfanti, S.; Karanasos, M.; Zopounidis, C.; Christopoulos, A. Corporate credit risk counter-cyclical interdependence: A systematic analysis of cross-border and cross-sector correlation dynamics. Eur. J. Oper. Res. 2023, 304, 813–831. [Google Scholar] [CrossRef]
- Bouzzine, Y.D.; Lueg, R. The contagion effect of environmental violations: The case of Dieselgate in Germany. Bus. Strategy Environ. 2020, 29, 3187–3202. [Google Scholar] [CrossRef]
- Su, C.W.; Liu, F.; Stefea, P.; Umar, M. Does technology innovation help to achieve carbon neutrality? Econ. Anal. Policy 2023, 78, 1–14. [Google Scholar] [CrossRef]
- Abate, A.G.; Riccardi, R.; Ruiz, C. Contracts in electricity markets under EU ETS: A stochastic programming approach. Energy Econ. 2021, 99, 105309. [Google Scholar] [CrossRef]
- Enders, W.; Lee, J. A unit root test using a Fourier series to approximate smooth breaks. Oxf. Bull. Econ. Stat. 2012, 74, 574–599. [Google Scholar] [CrossRef]
- Wang, X.Q.; Su, C.W.; Lobonţ, O.R.; Li, H.; Nicoleta-Claudia, M. Is China’s carbon trading market efficient? Evidence from emissions trading scheme pilots. Energy 2022, 245, 123240. [Google Scholar] [CrossRef]
- Barro, R.J.; Sala-i-Martin, X. Convergence. J. Political Econ. 1992, 100, 223–251. [Google Scholar] [CrossRef]
- Borsi, M.T.; Metiu, N. The evolution of economic convergence in the European Union. Empir. Econ. 2015, 48, 657–681. [Google Scholar] [CrossRef]
- Li, Z.Z.; Liu, G.; Tao, R.; Lobont, O.R. Do Health Expenditures Converge Among ASEAN Countries? Front. Public Health 2021, 9, 699821. [Google Scholar] [CrossRef]
- Herrerias, M.J. CO2 weighted convergence across the EU-25 countries (1920–2007). Appl. Energy 2012, 92, 9–16. [Google Scholar] [CrossRef]
- Marrero, Á.S.; Marrero, G.A.; González, R.M.; Rodríguez-López, J. Convergence in road transport CO2 emissions in Europe. Energy Econ. 2021, 99, 105322. [Google Scholar] [CrossRef]
- Liu, T.Y.; Lee, C.C. Convergence of the world’s energy use. Resour. Energy Econ. 2020, 62, 101199. [Google Scholar] [CrossRef]
- Romero-Ávila, D.; Omay, T. Convergence of per capita energy consumption around the world: New evidence from nonlinear panel unit root tests. Energy Econ. 2022, 111, 106062. [Google Scholar] [CrossRef]
- Bayraktar, Y.; Koc, K.; Toprak, M.; Ozyılmaz, A.; Olgun, M.F.; Balsalobre-Lorente, D.; Soylu, O.B. Convergence of per capita ecological footprint among BRICS-T countries: Evidence from Fourier unit root test. Environ. Sci. Pollut. Res. 2023, 30, 63022–63035. [Google Scholar] [CrossRef]
- Yilanci, V.; Gorus, M.S.; Solarin, S.A. Convergence in per capita carbon footprint and ecological footprint for G7 countries: Evidence from panel Fourier threshold unit root test. Energy Environ. 2022, 33, 527–545. [Google Scholar] [CrossRef]
- Zhao, X.G.; Wu, L.; Li, A. Research on the efficiency of carbon trading market in China. Renew. Sustain. Energy Rev. 2017, 79, 1–8. [Google Scholar] [CrossRef]
- Lee, Y.L.; Zhang, Z.; Li, X.; Chang, T. Does the carbon price in Chinese seven carbon markets converge or not? —Based on the Fourier quantile unit root test. Energy Rep. 2019, 5, 1638–1644. [Google Scholar] [CrossRef]
- Delgado, F.J.; Freire-González, J.; Presno, M.J. Environmental taxation in the European Union: Are there common trends? Econ. Anal. Policy 2002, 73, 670–682. [Google Scholar] [CrossRef]
- Famulska, T.; Kaczmarzyk, J.; Grzaba-Włoszek, M. Environmental Taxes in the Member States of the European Union—Trends in Energy Taxes. Energies 2022, 15, 8718. [Google Scholar] [CrossRef]
- Depren, Ö.; Kartal, M.T.; Ayhan, F.; Depren, S.K. Heterogeneous impact of environmental taxes on environmental quality: Tax domain based evidence from the nordic countries by nonparametric quantile approaches. J. Environ. Manag. 2023, 329, 117031. [Google Scholar] [CrossRef] [PubMed]
- Afshan, S.; Yaqoob, T. Unravelling the efficacy of green innovation and taxation in promoting environmental quality: A dual-model assessment of testing the LCC theory in emerging economies. J. Clean. Prod. 2023, 416, 137850. [Google Scholar] [CrossRef]
- Brock, W.A.; Taylor, M.S. The green Solow model. J. Econ. Growth 2010, 15, 127–153. [Google Scholar] [CrossRef]
- Peng, H.R.; Tan, X.; Managi, S.; Taghizadeh-Hesary, F. Club convergence in energy efficiency of Belt and Road Initiative countries: The role of China’s outward foreign direct investment. Energy Policy 2022, 168, 113139. [Google Scholar] [CrossRef]
- Ali, J.; Akram, V.; Burhan, M. Does economic complexity lead to global carbon emissions convergence? Environ. Sci. Pollut. Res. 2022, 29, 45646–45655. [Google Scholar] [CrossRef]
- Cai, Y.; Menegaki, A.N. Convergence of clean energy consumption—Panel unit root test with sharp and smooth breaks. Environ. Sci. Pollut. Res. 2019, 26, 18790–18803. [Google Scholar] [CrossRef]
- Radulescu, M.; Sinisi, C.I.; Popescu, C.; Iacob, S.E.; Popescu, L. Environmental tax policy in Romania in the context of the EU: Double Dividend Theory. Sustainability 2017, 9, 1986. [Google Scholar] [CrossRef]
- Filipiak, B.Z.; Wyszkowska, D. Determinants of Reducing Greenhouse Gas Emissions in European Union Countries. Energies 2022, 15, 9561. [Google Scholar] [CrossRef]
- Falkner, R. The Paris Agreement and the new logic of international climate politics. Int. Aff. 2016, 92, 1107–1125. [Google Scholar] [CrossRef]
- Esen, Ö.; Yıldırım, D.Ç.; Yıldırım, S. Pollute less or tax more? Asymmetries in the EU environmental taxes–Ecological balance nexus. Environ. Impact Assess. Rev. 2021, 91, 106662. [Google Scholar] [CrossRef]
- Cojocaru, T.M.; Ionescu, G.H.; Firoiu, D.; Cismaș, L.M.; Oțil, M.D.; Toma, O. Reducing inequalities within and among EU Countries—Assessing the achievement of the 2030 agenda for sustainable development targets (SDG 10). Sustainability 2002, 14, 7706. [Google Scholar] [CrossRef]
- Mugerman, Y.; Sade, O.; Shayo, M. Long term savings decisions: Financial reform, peer effects, and ethnicity. J. Econ. Behav. Organ. 2014, 106, 106–332. [Google Scholar] [CrossRef]
- Székely, I.P.; Kuenzel, R. Convergence of the EU Member States in Central-Eastern and South Eastern Europe (EU11): A Framework for Convergence Inside a Close Regional Cooperation. In Does EU Membership Facilitate Convergence? The Experience of the EU’s Eastern Enlargement-Volume I: Overall Trends and Country Experiences; Palgrave Macmillan: Cham, Switzerland, 2021; pp. 27–90. [Google Scholar]
- Raghoo, P.; Shah, K.U. A global empirical analysis on the diffusion innovation of carbon pricing policies. J. Clean. Prod. 2022, 362, 132329. [Google Scholar] [CrossRef]
- Lin, Y.; Yin, Q.; Yuan, B.; Dong, Z.; Wei, W. Does the environmental tax influence the siting of foreign-invested manufacturing enterprises? Evidence from China. J. Environ. Plan. Manag. 2023, 67, 2837–2862. [Google Scholar] [CrossRef]
- Jiang, L.; Wang, Y.; Zhang, J. Local-neighborhood effects of environmental regulations on green technology innovation in manufacturing: Green credit-based regulation. Front. Environ. Sci. 2022, 10, 1072180. [Google Scholar] [CrossRef]
- Annicchiarico, B.; Carattini, S.; Fischer, C.; Heutel, G. Business Cycles and Environmental Policy: Literature Review and Policy Implications; National Bureau of Economic Research, Inc.: Cambridge, MA, USA, 2021. [Google Scholar]
- Domenech, T.; Bahn-Walkowiak, B. Transition towards a resource efficient circular economy in Europe: Policy lessons from the EU and the member states. Ecol. Econ. 2019, 155, 7–19. [Google Scholar] [CrossRef]
- Chortareas, G.E.; Kapetanios, G.; Shin, Y. Nonlinear mean reversion in real exchange rates. Econ. Lett. 2002, 77, 411–417. [Google Scholar] [CrossRef]
- Chortareas, G.; Kapetanios, G. Getting PPP right: Identifying mean-reverting real exchange rates in panels. J. Bank. Financ. 2009, 33, 390–404. [Google Scholar] [CrossRef]
- Ucar, N.; Omay, T. Testing for unit root in nonlinear heterogeneous panels. Econ. Lett. 2009, 104, 5–8. [Google Scholar] [CrossRef]
- Kapetanios, G.; Shin, Y.; Snell, A. Testing for a unit root in the nonlinear STAR framework. J. Econom. 2003, 112, 359–379. [Google Scholar] [CrossRef]
- Im, K.S.; Pesaran, M.H.; Shin, Y. Testing for unit roots in heterogeneous panels. J. Econom. 2003, 115, 53–74. [Google Scholar] [CrossRef]
- Perron, P. The great crash, the oil price shock, and the unit root hypothesis. Econom. J. Econom. Soc. 1989, 57, 1361–1401. [Google Scholar] [CrossRef]
- Gallant, A.R. On the bias in flexible functional forms and an essentially unbiased form: The Fourier flexible form. J. Econom. 1981, 15, 211–245. [Google Scholar] [CrossRef]
- Becker, R.; Enders, W.; Hurn, S. A general test for time dependence in parameters. J. Appl. Econom. 2004, 19, 899–906. [Google Scholar] [CrossRef]
- Pascalau, R. Unit root tests with smooth breaks: An application to the Nelson–Plosser data set. Appl. Econ. Lett. 2010, 17, 565–570. [Google Scholar] [CrossRef]
- Li, Z.Z.; Su, C.W.; Moldovan, N.C.; Umar, M. Energy consumption within policy uncertainty: Considering the climate and economic factors. Renew. Energy 2023, 208, 567–576. [Google Scholar] [CrossRef]
- Levin, A.; Lin, C.F.; Chu, C.S.J. Unit root tests in panel data: Asymptotic and finite-sample properties. J. Econom. 2002, 108, 1–24. [Google Scholar] [CrossRef]
- Maddala, G.S.; Wu, S. A comparative study of unit root tests with panel data and a new simple test. Oxf. Bull. Econ. Stat. 1999, 61, 631–652. [Google Scholar] [CrossRef]
- Choi, I. Unit root tests for panel data. J. Int. Money Financ. 2001, 20, 249–272. [Google Scholar] [CrossRef]
- Mayne, Q.; Katsanidou, A. Subnational economic conditions and the changing geography of mass Euroscepticism: A longitudinal analysis. Eur. J. Political Res. 2023, 62, 742–760. [Google Scholar] [CrossRef]
- Poncin, S. Energy Policies for Eco-Friendly Households in Luxembourg: A Study Based on the LuxHEI Model. Env. Model Assess 2021, 26, 37–61. [Google Scholar] [CrossRef]
- Kranzl, L.; Brakhage, A.; Gürtler, P.; Pett, J.; Ragwitz, M.; Stadler, M. Integrating Policies for Renewables and Energy Efficiency: Comparing Results from Germany, Luxembourg and Northern Ireland. Na 2007. Available online: https://publica.fraunhofer.de/handle/publica/354754 (accessed on 3 June 2024).
- Miceikiene, A.; Čiulevičienė, V.; Rauluskeviciene, J.; Štreimikienė, D. Assessment of the effect of environmental taxes on environmental protection. Ekon. Časopis 2018, 66, 286–308. [Google Scholar]
- Herrigel, G. Globalization and the German industrial production model. J. Labour Mark. Res. 2015, 48, 133–149. [Google Scholar] [CrossRef]
- Ekins, P.; Speck, S. (Eds.) Environmental tax reform (ETR): A Policy for Green Growth; Oxford University Press: Oxford, UK, 2011. [Google Scholar]
- Andretta, A.; D’Addato, F.; Serrano-Bernardo, F.; Zamorano, M.; Bonoli, A. Environmental taxes to promote the eu circular economy’s strategy: Spain vs. Italy. Environ. Eng. Manag. J. 2018, 17, 2307–2311. [Google Scholar]
- Vampa, D. COVID-19 and territorial policy dynamics in Western Europe: Comparing France, Spain, Italy, Germany, and the United Kingdom. Publius J. Fed. 2021, 51, 601–626. [Google Scholar] [CrossRef]
- Hassan, M.; Oueslati, W.; Rousselière, D. Environmental taxes, reforms and economic growth: An empirical analysis of panel data. Econ. Syst. 2020, 44, 100806. [Google Scholar] [CrossRef]
- Gago, A.; Labandeira, X.; Picos, F.; Rodríguez, M. Specific and general taxation of tourism activities. Evidence from Spain. Tour. Manag. 2009, 30, 381–392. [Google Scholar] [CrossRef]
- Millock, K.; Nauges, C.; Sterner, T. Environmental taxes: A comparison of French and Swedish experience from taxes on industrial air pollution. CESifo DICE Rep. 2004, 2, 30–34. [Google Scholar]
- Cremer, H.; Gahvari, F.; Ladoux, N. Environmental taxes with heterogeneous consumers: An application to energy consumption in France. J. Public Econ. 2003, 87, 2791–2815. [Google Scholar] [CrossRef]
- Chiroleu-Assouline, M.; Fodha, M. From regressive pollution taxes to progressive environmental tax reforms. Eur. Econ. Rev. 2014, 69, 126–142. [Google Scholar] [CrossRef]
- Rosenstock, M. Environmental Taxation within the European Union. Cyprus Econ. Policy Rev. 2014, 8, 113–123. [Google Scholar]
- Zachariadis, T. A proposed green tax reform for Cyprus and its co-benefits for urban sustainability. Environ. Fisc. Chall. Cities Transp. 2019, 21, 91. [Google Scholar]
- Ma, B.; Sharif, A.; Bashir, M.; Bashir, M.F. The dynamic influence of energy consumption, fiscal policy and green innovation on environmental degradation in BRICST economies. Energy Policy 2023, 183, 113823. [Google Scholar] [CrossRef]
- Zhelyazkova, A.; Thomann, E.; Ruffing, E.; Princen, S. Differentiated policy implementation in the European Union. West Eur. Politics 2024, 47, 439–465. [Google Scholar] [CrossRef]
- Hearn, A.X.; Castaño-Rosa, R. Towards a just energy transition, barriers and opportunities for positive energy district creation in Spain. Sustainability 2021, 13, 8698. [Google Scholar] [CrossRef]
- Amores, A.F.; Basso, H.S.; Bischl, J.S.; De Agostini, P.; Poli, S.D.; Dicarlo, E.; Flevotomou, M.; Freier, M.; Maier, S.; García-Miralles, E.; et al. Inflation, Fiscal Policy and Inequality. ECB Occasional Paper No. 2023/330. 2023. Available online: https://ssrn.com/abstract=4604418 (accessed on 25 March 2024).
- Symons, E.J.; Speck, S.; Proops, J.L.R. The distributional effects of carbon and energy taxes: The cases of France, Spain, Italy, Germany and UK. Eur. Environ. 2002, 12, 203–212. [Google Scholar] [CrossRef]
- Beuermann, C.; Santarius, T. Ecological tax reform in Germany: Handling two hot potatoes at the same time. Energy Policy 2006, 34, 917–929. [Google Scholar] [CrossRef]
- Deroubaix, J.F.; Lévèque, F. The rise and fall of French Ecological Tax Reform: Social acceptability versus political feasibility in the energy tax implementation process. Energy Policy 2006, 34, 940–949. [Google Scholar] [CrossRef]
- Bureau, B. Distributional effects of a carbon tax on car fuels in France. Energy Econ. 2011, 33, 121–130. [Google Scholar] [CrossRef]
- Mohammadi, N.; Mostofi, H.; Dienel, H.L. Policy Chain of Energy Transition from Economic and Innovative Perspectives: Conceptual Framework and Consistency Analysis. Sustainability 2023, 15, 12693. [Google Scholar] [CrossRef]
- Ahmad, M.; Satrovic, E. How do transportation-based environmental taxation and globalization contribute to ecological sustainability? Ecol. Inform. 2023, 74, 102009. [Google Scholar] [CrossRef]
- Santos, G.; Behrendt, H.; Maconi, L.; Shirvani, T.; Teytelboym, A. Part I: Externalities and economic policies in road transport. Res. Transp. Econ. 2010, 28, 2–45. [Google Scholar] [CrossRef]
- Monti, M. A new strategy for the single market. Report to the President of the European Commission José Manuel Barroso. 10 May 2010. [Google Scholar]
- Van Dender, K. Taxing Vehicles, Fuels, and Road Use: Opportunities for Improving Transport Tax Practice 2019. Available online: https://www.sipotra.it/wp-content/uploads/2019/06/Taxing-vehicles-fuels-and-road-use-Opportunities-for-improving-transport-tax-practice.pdf (accessed on 25 March 2024).
- Hussain, Z.; Khan, M.K.; Shaheen, W.A. Effect of economic development, income inequality, transportation, and environmental expenditures on transport emissions: Evidence from OECD countries. Environ. Sci. Pollut. Res. 2022, 29, 56642–56657. [Google Scholar] [CrossRef]
- Umar, M.; Ji, X.; Kirikkaleli, D.; Alola, A.A. The imperativeness of environmental quality in the United States transportation sector amidst biomass-fossil energy consumption and growth. J. Clean. Prod. 2021, 285, 124863. [Google Scholar] [CrossRef]
- Narayan, P.K.; Popp, S. A new unit root test with two structural breaks in level and slope at unknown time. J. Appl. Stat. 2010, 37, 1425–1438. [Google Scholar] [CrossRef]
- Harvie, C.; Pahlavani, M.; Saleh, A.S. Identifying structural breaks in the Lebanese economy 1970-2003: An application of the Zivot and Andrews test. Middle East Bus. Econ. Rev. 2006, 18, 18–33. [Google Scholar]
- Andrei, J.; Mieila, M.; Popescu, G.H.; Nica, E.; Cristina, M. The impact and determinants of environmental taxation on economic growth communities in Romania. Energies 2016, 9, 902. [Google Scholar] [CrossRef]
- Dorsey-Palmateer, R.; Niu, B. The effect of carbon taxation on cross-border competition and energy efficiency investments. Energy Econ. 2020, 85, 104602. [Google Scholar] [CrossRef]
- Karmaker, S.C.; Hosan, S.; Chapman, A.J.; Saha, B.B. The role of environmental taxes on technological innovation. Energy 2021, 232, 121052. [Google Scholar] [CrossRef]
- Nippa, M.; Patnaik, S.; Taussig, M. MNE responses to carbon pricing regulations: Theory and evidence. J. Int. Bus. Stud. 2021, 52, 904–929. [Google Scholar] [CrossRef]
- Voigt, C. How a ‘Global Pact for the Environment’could add value to international environmental law. Rev. Eur. Comp. Int. Environ. Law 2019, 28, 13–24. [Google Scholar] [CrossRef]
- Khaddage-Soboh, N.; Safi, A.; Rasheed, M.F.; Hasnaoui, A. Examining the role of natural resource rent, environmental regulations, and environmental taxes in sustainable development: Evidence from G-7 economies. Resour. Policy 2023, 86, 104071. [Google Scholar] [CrossRef]
Disclaimer/Publisher’s Note: The statements, opinions and data contained in all publications are solely those of the individual author(s) and contributor(s) and not of MDPI and/or the editor(s). MDPI and/or the editor(s) disclaim responsibility for any injury to people or property resulting from any ideas, methods, instructions or products referred to in the content. |
© 2024 by the authors. Licensee MDPI, Basel, Switzerland. This article is an open access article distributed under the terms and conditions of the Creative Commons Attribution (CC BY) license (https://creativecommons.org/licenses/by/4.0/).