Article

Study on Summer Microclimate Analysis and Optimization Strategies for Urban Parks in Xinjiang—A Case Study of Mingzhu Park

1
College of Water & Architectural Engineering, Shihezi University, Shihezi 832003, China
2
Agricultural College, Shihezi University, Shihezi 832003, China
*
Author to whom correspondence should be addressed.
Sustainability 2024, 16(17), 7687; https://doi.org/10.3390/su16177687
Submission received: 12 August 2024 / Revised: 30 August 2024 / Accepted: 3 September 2024 / Published: 4 September 2024

Abstract

:
To investigate the impact of landscape characteristics on microclimate and thermal comfort in summer urban parks in Xinjiang, we focused on Mingzhu Park in Shihezi City. We collected microclimatic data through field measurements and analyzed the correlations among these factors, the physiological equivalent temperature (PET), and the landscape features. ENVI-met was utilized for microclimate simulations to assess the optimization effects. The results revealed that different landscape features significantly influenced the microclimate and thermal comfort. Trees and grass effectively lowered the temperature, increased humidity, reduced wind speeds, blocked solar radiation, and decreased the PET. Water bodies exposed to sunlight and without shade have a low reflectivity, leading to significant temperature increases. While evaporation can lower the surrounding temperatures, the water surface temperature remains higher than in shaded areas, raising temperatures there. The temperature, humidity, wind speed, and mean radiant temperature show significant correlations. The correlation ranking is as follows: mean radiant temperature (Tmrt) > air temperature (Ta) > relative humidity (RH) > wind speed (Va). After increasing the tree cover and designing dispersed water bodies, the average PET decreased by up to 0.67 °C, with the park experiencing the largest reduction of 1.86 °C. The PET in the eastern built-up area was reduced by 0.35 °C, and in the western built-up area, by only 0.13 °C.

1. Introduction

With the continuous development of the social economy, global warming has become a significant challenge for humanity, particularly since the 21st century, when the global warming trend intensified [1]. Against the backdrop of global climate warming, rapid urban expansion and population growth have accelerated the urban heat island (UHI) phenomenon [2], leading to increasingly severe heat conditions in some cities [3,4], accelerating urban energy consumption, reducing thermal comfort, and significantly increasing risks to human health [5,6,7]. In summer, in particular, cities often experience higher temperatures than their surrounding environments [8], and these factors severely impact urban livability.
Urban open spaces, as essential components of cities, have a significant impact on human thermal perception and health [9]. To improve the urban thermal environment, enhance livability, and achieve sustainable development, many researchers have proposed appropriate strategies to mitigate unfavorable urban microclimates. Microclimatic parameters such as air temperature, relative humidity, wind speed, and solar radiation significantly affect human thermal comfort [10]. By adjusting these microclimatic factors, it is possible to improve human thermal comfort.
In recent years, urban green spaces (UGS) have become a focal point in urban ecological research due to their microclimatic effects, which can improve the thermal environment of urban open spaces, attracting widespread attention from scholars. As an important component of urban green spaces, city parks can alleviate the urban heat island effect and regulate microclimates through shading and evapotranspiration [11], providing residents with comfortable outdoor activity spaces. The microclimate within parks is typically influenced by various factors, including vegetation, water bodies, topography, and paving materials. In terms of vegetation, Luo et al. [12] studied the impact of tree species and planting methods on campsite comfort in hot and humid areas during summer, finding that tree canopy size is most effective in enhancing thermal comfort, with patch planting providing the highest level of comfort. Liu et al. [13] investigated a significant reduction in the physiological equivalent temperature (PET) due to specific tree shapes and planting densities in Singaporean residential areas, discovering that umbrella-shaped trees are the most effective in improving comfort. Keikhosravi et al. [14] categorized vegetation into trees, grasses, and shrubs, finding that the number of covers had a more significant cooling effect on the surrounding environment. Regarding water bodies, Xu et al. [15] quantified the scale, shape, and dispersion of water bodies, revealing significant impacts on temperature and humidity, with scale having the greatest regulating capacity and shape having the largest influence range. Cureau et al. [16] assessed the impact of urban water bodies on ultra-local climate conditions in coastal areas, finding a noticeable cooling effect in summer. In terms of topography, Yang et al. [17] explored the influence of microclimate environments on the use of outdoor spaces such as parks, discovering that the camelback terrain design in Sweden aligns with local preferences for reduced wind speed and strong sunlight. Wu et al. [18] analyzed the effects of microtopography changes on the local thermal environment, finding that alterations in microtopography provide better cooling effects for green spaces and adjacent open areas compared to flat terrain. Regarding paving materials, Yang et al. [19] studied the impact of pavement materials, greening, and water bodies on the urban microclimate and thermal comfort in high-rise residential areas, finding that high-albedo pavement materials and water bodies were ineffective for reducing heat stress under hot and humid conditions. Haeri et al. [20] conducted a microclimate study of commercial streets in Kuala Lumpur, Malaysia, exploring a combination of high-albedo facades, high-reflective surfaces, permeable pavements, and increased tree cover. Their findings showed that the application of permeable pavements and increased trees significantly improved the PET.
In summary, previous research has primarily focused on individual landscape elements such as vegetation, water bodies, topography, and paving materials, or on a limited combination of these factors, leading to an incomplete understanding of the influencing factors and their interrelationships regarding microclimate effects. Additionally, there is limited research on microtopography within parks, with most studies concentrating on microclimate changes in flat terrains, which presents certain limitations. Furthermore, existing studies have largely focused on hot and humid summer regions, with less attention given to other climatic conditions, which are also significant in terms of outdoor thermal environments.
The Xinjiang region experiences long, cold winters and harsh outdoor conditions, with short spring and autumn seasons, making summer the primary season for residents to engage in outdoor activities. However, the arid and hot climate makes it more difficult for residents to achieve thermal comfort [21,22], significantly reducing thermal comfort during outdoor activities. In this study, the main task was to better understand outdoor thermal comfort in this region and to optimize the outdoor thermal environment.
Therefore, this study focuses on Mingzhu Park in Shihezi City, analyzing the impact of different landscape elements on the microclimate and exploring the interactions between microclimatic factors and their comprehensive effects on spatial thermal comfort. By clarifying the regulatory mechanisms, we propose optimization strategies to improve the thermal environment and climate comfort of outdoor activity spaces, reducing the discomfort and harm caused by extreme heat conditions in summer. This research provides a reference for improving the microclimate of park environments in arid regions of Xinjiang. Additionally, it offers important insights for enhancing urban thermal environments, increasing urban livability, and achieving sustainable development.

2. Materials and Methods
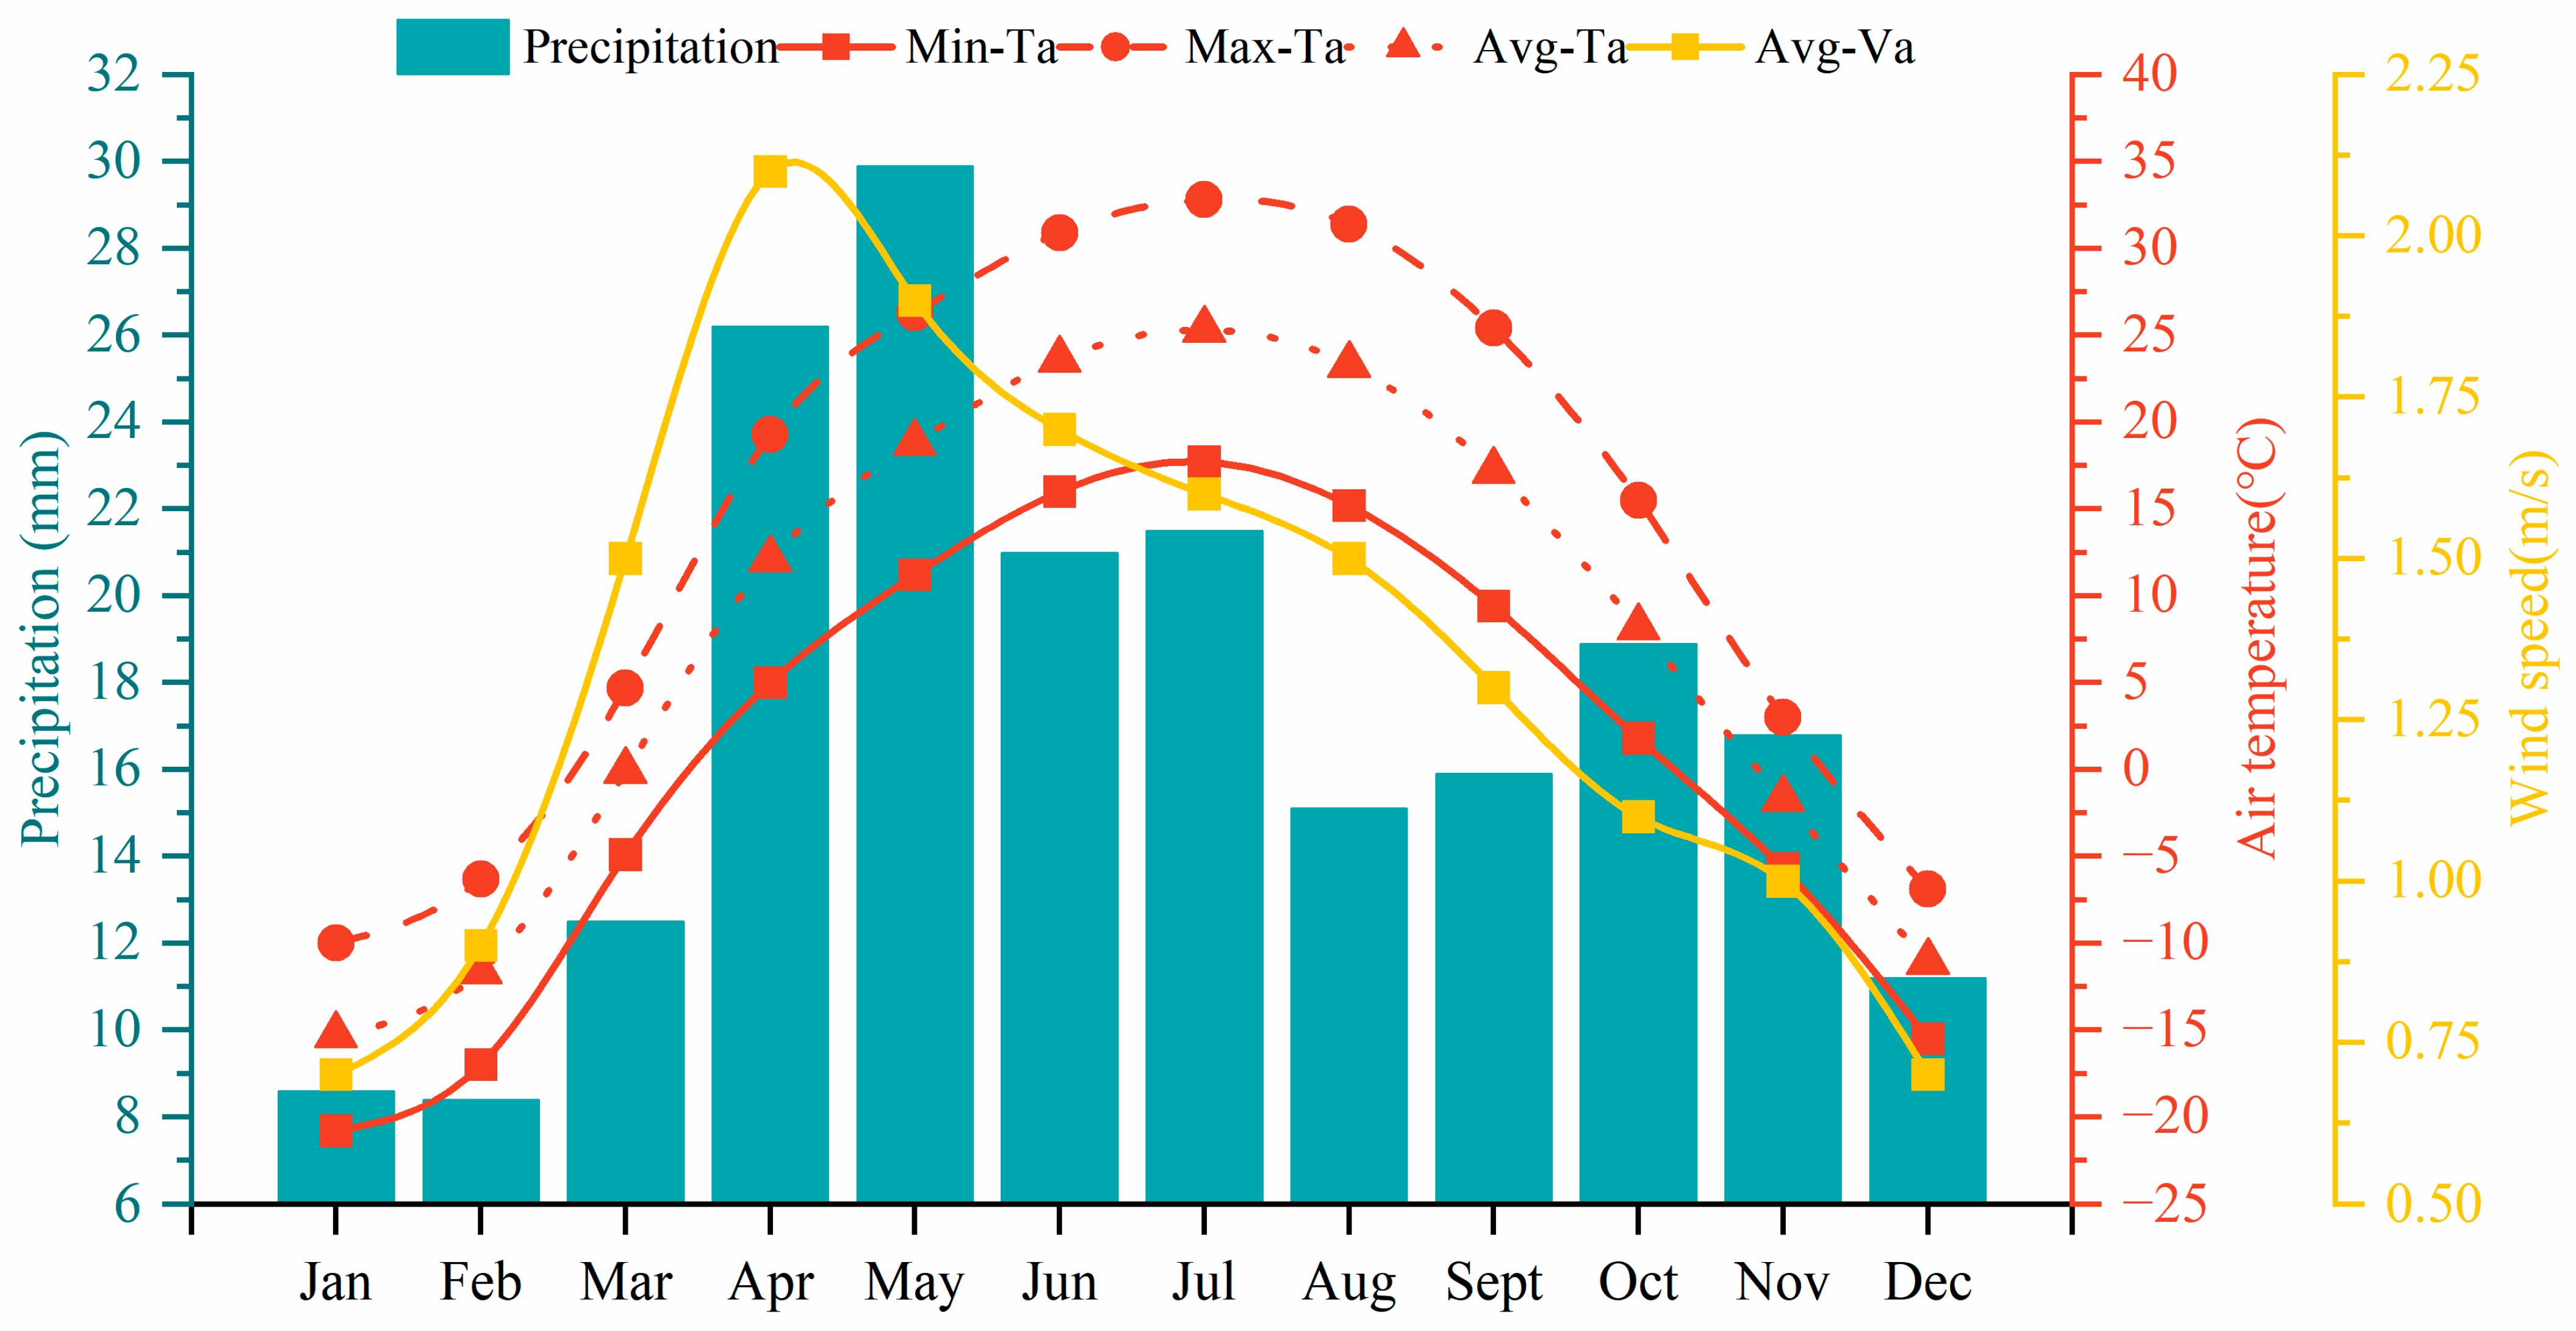
2.1. Study Area

Shihezi City (86°2′ E, 44°18′ N) is located in northern Xinjiang and falls within the temperate continental arid climate zone. The climate features include year-round dryness and low rainfall, with cold winters and hot summers. The annual average temperature is between 7 and 8 °C, with lower temperatures in the northern regions and higher temperatures in the south. The city receives 2300–2700 h of sunshine annually, with rainfall ranging from 180 to 270 mm and evaporation amounting to 1000–1500 mm. The highest temperatures occur in July, averaging 25–26 °C, while the lowest temperatures are recorded in January, averaging around −15 °C. More meteorological data for the region are shown in Figure 1 (https://www.weather.com.cn/cityintro/101130301.shtml, accessed on 8 July 2023).
Mingzhu Park in Shihezi (Figure 2) was established in 2003 and covers an area of 23 hectares. It is a landscape park designed using traditional Chinese landscaping techniques combined with modern gardening technology. Mingzhu Lake features a natural-style lake surface, with rockeries distributed along its two sides, constructed from earth excavated from the lake. The entire rockery is densely planted with trees. This park is an eco-friendly, modern facility that integrates culture, leisure, and entertainment.

2.2. Research Methods

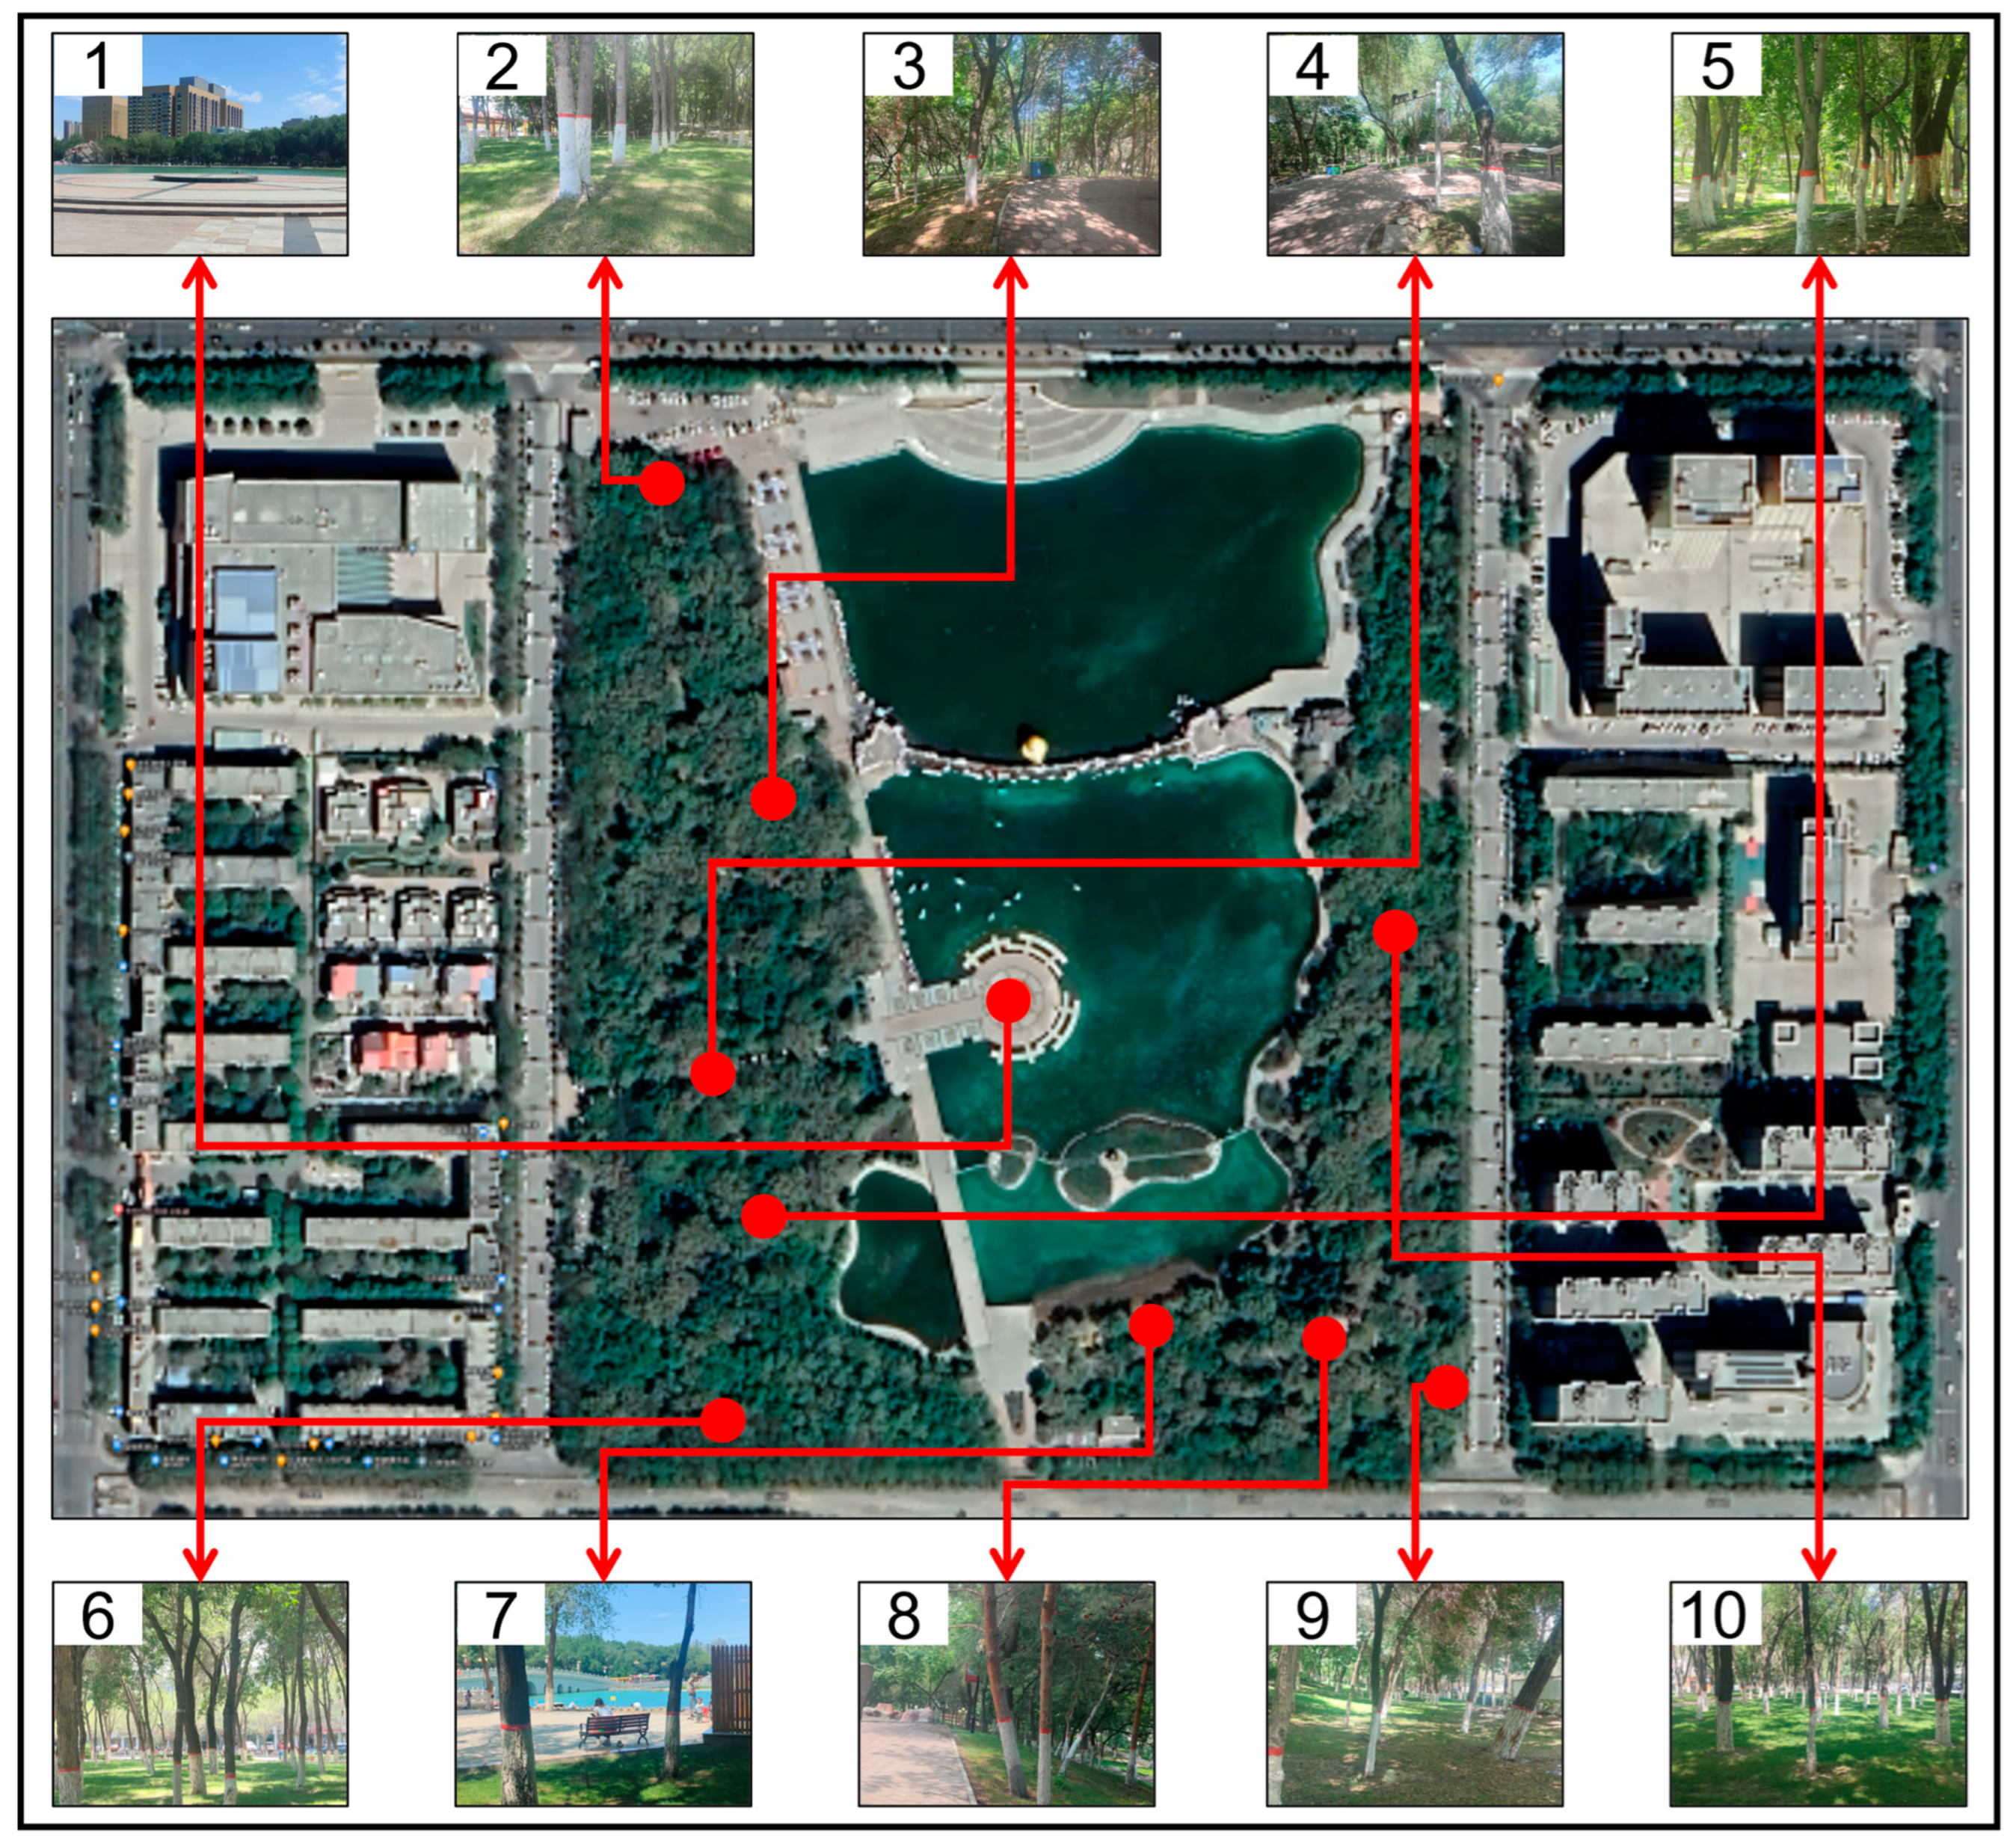
2.2.1. Points Selection and Field Measurements

Based on the different spatial environmental characteristics formed by the park’s sloping terrain, vegetation, water features, and paving layout, ten measurement points were established within the park. The locations of these measurement points are detailed in Figure 2. Except for Measurement Point 1, which is open and unobstructed, all other points are situated under tree shade. The landscape characteristics of each measurement point are summarized in Table 1. The gradient is classified based on the prevailing wind direction on the measurement day. The altitude of P1 (Measurement Point 1) was set to 0 m, which was used as a reference for the altitudes of the other measurement points. This study focused on assessing how landscape elements, such as topography, vegetation, water features, and paving, affect the outdoor spatial comfort in the park under various layout combinations.
The hottest month in Shihezi is July. To avoid the impact of cloud cover on measurements, a clear, cloudless day was selected for data collection, specifically 12 July 2023. The highest temperature of the day was 30.5 °C, and the lowest temperature was 18.8 °C, with the prevailing wind direction being northwest (http://www.nmc.cn/publish/forecast/AXJ/shihezi.html, accessed on 12 July 2023). Considering residents’ activity times, the measurement period was set from 10:00 a.m. to 24:00 p.m. The meteorological parameters were measured and recorded at a consistent height of 1.5 m above ground level. Due to the limitations of the testing equipment and personnel, the approach combined stationary and mobile measurements. The specific information and parameters of the measuring instruments are listed in Table 2, with the measurement height set at 1.5 m. The air temperature (Ta) and relative humidity (RH) were measured at stationary points, with data recorded at 5 min intervals. The wind speed (Va) and black globe temperature (Tg) were measured using a mobile method, with recordings taken every hour after staying at each measurement point for 15 min to allow the results to stabilize.

2.2.2. ENVI-Met Simulation

This study utilized ENVI-met Headquarters version 5.6.1 for microclimate and thermal comfort simulations. ENVI-met is one of the most widely used tools for dynamic microclimate simulation [23,24]. The software includes a tool called “Biomet”, which performs mathematical calculations for various thermal comfort indices.
Based on outdoor surveys and Google Maps, a model of the study area was developed in ENVI-met, as shown in Table 3. The horizontal modeling grid units were 5 m × 5 m, with a height of 2 m. A simulation model was created with 160 × 100 horizontal units and 50 vertical units. To avoid boundary effects, five layers of grids were set up on both sides of the simulation model. The materials for each element in the grid were selected based on their current state. The specific simulation parameters are listed in Table 3.

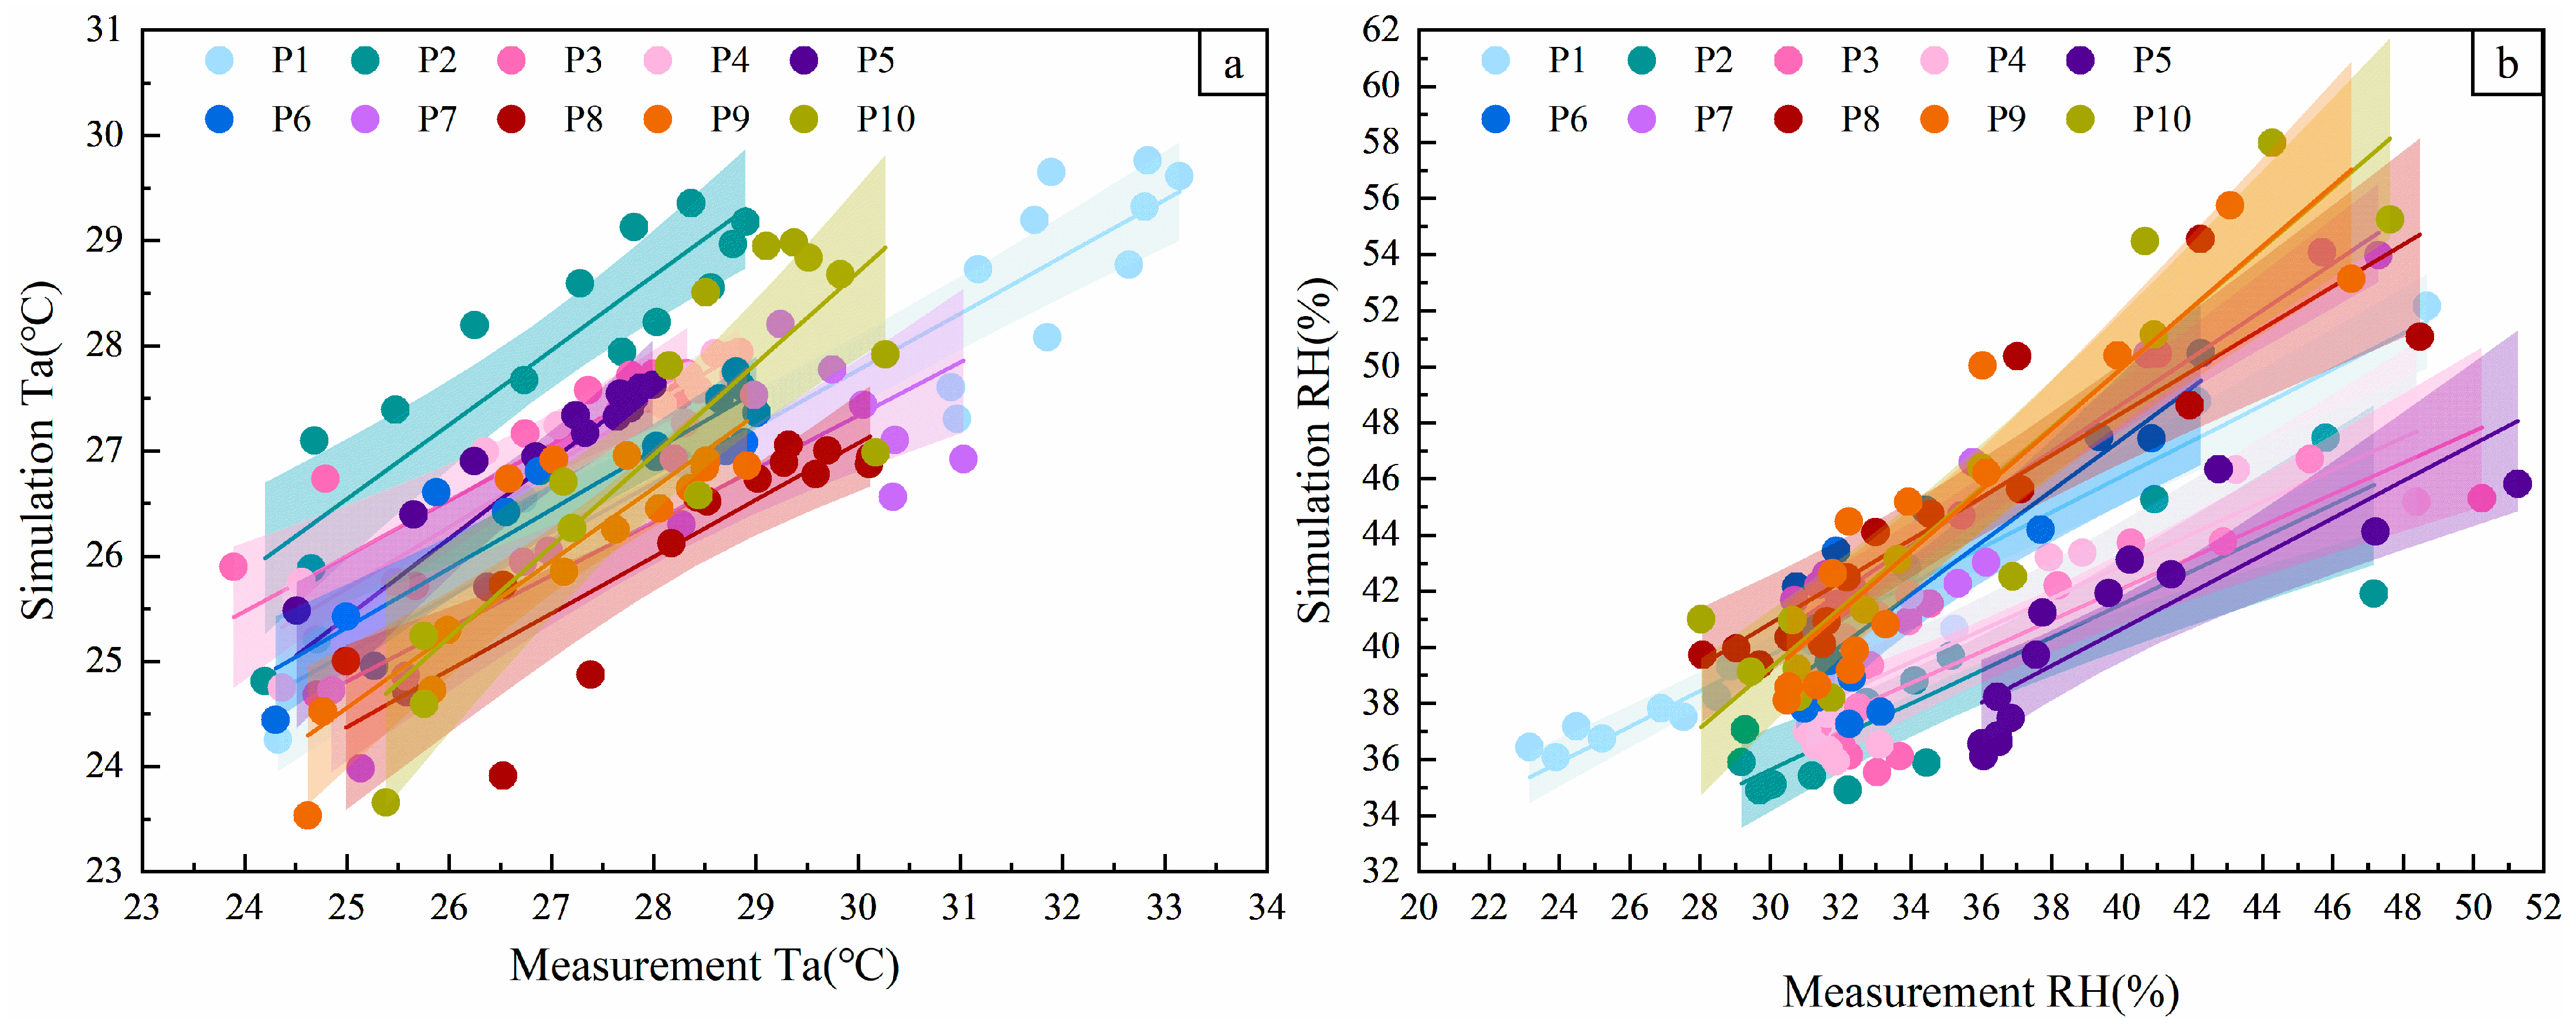
2.2.3. Validation of the Simulation

To verify the effectiveness of the ENVI-met model, linear regression was conducted between the air temperature and relative humidity measured at ten measurement points and the simulated data. Figure 3 shows that the trends of the measured data and simulated data are consistent. At a 95% confidence level, the simulated values fall within the confidence interval of the measured values, and the confidence interval is relatively narrow, indicating that the simulated values are quite accurate. The results of the linear regression between the measured data and simulated data are shown in Table 4, revealing a strong correlation between the two, with an R2 value greater than 0.7. The root mean square error (RMSE) is an indicator used to measure the difference between the model’s predicted values and the actual observed values. Generally, a lower RMSE is better than a higher one. S. Tsoka et al. [25] reviewed 189 papers on environmental simulation and concluded that acceptable RMSE standards for air temperature and relative humidity should be less than 4.30 °C and 10.2%, respectively. In this model, the maximum RMSE values for Ta and RH were 2.77 °C and 9.98%, respectively, indicating that the results meet the standards.

2.2.4. Thermal Comfort Assessment

Although thermal comfort is a subjective experience, related physiological parameters can serve as objective evaluation indicators for human thermal comfort [26]. Currently, commonly used evaluation indices include the standard effective temperature (SET) [27], the predicted mean vote (PMV) [28], the universal thermal climate index (UTCI) [29], and the physiological equivalent temperature (PET). The PET is derived from the Munich Energy Balance Model (ME-MI) [30] and comprehensively considers the relationship between the human heat balance and longwave radiation flux in outdoor spaces, making it one of the best indicators for assessing thermal comfort in outdoor environments. This evaluation index takes into account various influencing factors, including the geographical location of measurement points, microclimatic factors, measurement dates and times, human parameters, clothing levels, and activity levels. Supported by numerous studies in the domestic academic community, the PET is considered to provide a relatively accurate assessment of outdoor thermal comfort. The PET thermal sensation levels are shown in Table 5.
In this study, the measured data were used to calculate the PET index using Rayman Pro software, which is widely applied in outdoor thermal comfort research both in China and internationally [31,32]. Based on the climatic measurement results at each point, the thermal environment parameters (Ta, RH, Va, Tmrt) were input into RayMan to calculate the PET values. The other parameter settings in RayMan included the clothing index (clo) = 0.6, metabolic rate = 80 W, weight = 65 kg, height = 1.75 m, and gender = male. The thermal environment parameter Tmrt refers to the thermal stress on the human body caused by solar radiation and indirect radiation from surrounding objects, which can be calculated using Equation (1) [33]:
T m r t = [ ( T g + 273.15 ) 4 + 1.10 × 10 8 × V a 0.6 × T g T a ε D 0.4 ] 1 4 273.15
In the equation, Tmrt represents the average radiative temperature (°C), Tg represents the black globe temperature (°C), Ta represents the air temperature (°C), and Va represents the wind speed (m/s). The black globe reflectance is denoted by ε, which is assumed to be 0.95 in this study. D denotes the diameter of the black globe, which is 0.15 m.

3. Results and Discussion

3.1. Microclimate and Thermal Comfort Analysis

3.1.1. Analysis of Measured Results

We conducted an overall analysis of the temperature, humidity, wind environment, and PET in the park. Additionally, we compared the microclimatic environment of each measurement point in relation to the distribution of the measurement points and the characteristics of the landscape, providing a preliminary analysis of the underlying reasons.
As shown in Figure 4a, the air temperature at Measurement Point 1 during the day was significantly higher than at the other points located under trees, indicating that trees have a stronger cooling effect than water bodies. Measurement Points 4 and 7 generally exhibited higher temperatures, suggesting that granite significantly raises the air temperature. Measurement Point 3 was usually warmer than Measurement Point 5, indicating that grass’s transpiration can lower temperatures, and grass has a higher specific heat capacity than red bricks, making it less prone to heating. In the evening, as the solar radiation decreased, Measurement Point 1 cooled the fastest, demonstrating some insulation from the trees. The cooling rate was the highest at Measurement Point 6, followed by Points 4 and 5, indicating that higher elevations experienced slower temperature decreases. Measurement Point 7 cooled more than Point 10, suggesting that granite dissipates heat faster than grass. Both Points 3 and 5 showed a decrease in temperature, but Point 3 cooled more significantly, dropping below Point 5, indicating that red bricks cool faster than grass.
As shown in Figure 4b, the humidity at each measurement point initially decreased and then increased, opposite to the temperature trend. From 10:00 to 14:00, the humidity rapidly declined, with Points 1, 4, and 7 slowing their decrease by 13:00. From 14:00 to 19:00, the humidity changed little, but from 19:00 to 24:00, it increased, with Point 1 experiencing the largest increase due to its proximity to water and shading from the setting sun, causing rapid condensation.
Figure 4c illustrates the wind speed trends, which showed considerable variability but generally increased and then decreased. Measurement Point 1, being unobstructed, has consistently high wind speeds, with the prevailing northwest wind affecting Points 2, 3, 5, 7, 8, and 10, which were in windward positions but experienced lower speeds due to tree cover. Points 6 and 9 had the lowest wind speeds, located on the leeward side of the slope, which blocks the wind. Point 8 had a higher wind speed than Point 7, indicating that higher elevations experience greater wind speeds. The slope’s shielding effect on wind speed was more significant than the influence of tree and slope height.
The physiological equivalent temperature (PET) values for each measurement point are shown in Figure 4d. Point 1 exhibited the greatest PET variation during the day and night, as it received the most solar radiation without tree or slope cover, resulting in the maximum PET values and a hot sensation during the day. As the sun sets, the slope provides shade, and the granite cools rapidly, leading to a comfortable sensation. Other points, shielded by trees or slopes, felt more comfortable than Point 1, highlighting the significant impact of shading on the PET. Point 7 shows considerable PET variation, with higher air temperatures than the other points (except Point 1). During high wind speeds, the PET significantly decreased, especially between 17:00 and 20:00, when the air temperatures peaked but the wind speeds were high, leading to a lower PET compared to earlier times with lower temperatures and wind speeds. This phenomenon was also evident at Point 8. All points show noticeable PET changes when exposed to sunlight, with reduced variation after sunset, aligning with the air temperature changes. This indicates that solar radiation has a greater impact on the PET than the air temperature, while in the absence of solar radiation, temperature becomes the dominant factor affecting the PET.

3.1.2. Simulation Results and Analysis of Thermal Comfort Performance

The selected times for thermal comfort analysis were 10:00 a.m., 2:00 p.m., and 6:00 p.m., when the sun’s altitude angle varies significantly. The PET simulation maps are shown in Figure 5.
Overall, it can be observed that the PET in the park was lower than in the surrounding built-up areas, indicating that the park can reduce the PET and improve human thermal comfort. Areas with water bodies and vegetation in the park exhibited a lower PET, suggesting that both water bodies and vegetation can lower the PET; however, the PET in water areas was higher than in areas with vegetation, indicating that vegetation was more effective in enhancing human thermal comfort than water bodies.
In the park, areas without tree shade and with hard paving had higher PET and poorer thermal comfort. As the sun’s altitude angle changed, the PET first increased and then decreased, reaching its maximum value of 59.64 °C at 2:00 p.m. At 10:00 a.m., the hard-paved area on the northwest side of the park had poor thermal comfort, while at 2:00 p.m., the poor thermal comfort shifted to the hard-paved area on the north side. By 6:00 p.m., the areas with poor thermal comfort were on the north and northeast sides. Overall, the hard-paved area on the north side consistently showed poor comfort throughout the day.

3.2. Landscape Factors and Microclimate Correlation Analysis

SPSS Statistics 27 is one of the earliest statistical software programs to adopt a graphical, menu-driven interface. Its most prominent feature is its user-friendly operation interface and aesthetically pleasing output results. Due to its ease of use, convenient programming, powerful functionalities, data interface capabilities, and modular combinations, SPSS has been widely applied across various fields in the social sciences and natural sciences. Therefore, this study utilized this software for further analysis of the correlations between landscape characteristics and the microclimate, the correlations among the microclimate factors, and the correlation between the microclimate factors and thermal comfort. The landscape characteristics, air temperature, relative humidity, wind speed, mean radiant temperature, and PET values were input into the software for Pearson correlation analysis. When the correlation coefficient ranges from 0.00 to 1.00, it indicates a positive correlation between the two variables. Conversely, when the correlation coefficient is between −1.00 and 0.00, it signifies a negative correlation. A higher absolute value of the correlation coefficient indicates a stronger correlation and vice versa. Additionally, to determine whether the variables are significantly correlated, the p-value was calculated, which ranges from 0 to 1. A p-value of p ≤ 0.05 indicates a significant correlation between the two variables, while a p-value of p ≤ 0.01 indicates a highly significant correlation. The calculation results are shown in Figure 6.

3.2.1. Landscape Characterization and Microclimate Correlation

Based on the correlation analysis of air temperature, it was positively correlated with granite and slope orientation, while negatively correlated with red bricks, vegetation, distance from water bodies, and topography. The correlation ranking is as follows: vegetation > red bricks > distance from water bodies > granite > slope orientation > topography, with significant or highly significant correlations for granite (p < 0.05), red bricks (p < 0.05), vegetation (p < 0.01), and distance from water bodies (p < 0.05).
Regarding relative humidity, it was negatively correlated with granite, red bricks, and distance from water bodies, while positively correlated with vegetation and topography. The correlation ranking is as follows: vegetation > topography > granite > slope orientation > distance from water bodies > red bricks, with vegetation (p < 0.01) showing a significant correlation with relative humidity.
The wind speed was positively correlated with granite and slope orientation, while negatively correlated with red bricks, vegetation, distance from water bodies, and topography, indicating that grass and trees can reduce wind speed and improve wind conditions. The correlation ranking is as follows: vegetation > granite > distance from water bodies > red bricks > topography > slope orientation, with all related factors being significant (p < 0.01 or p < 0.05).
The mean radiant temperature was positively correlated with granite, red bricks, topography, and slope orientation, while negatively correlated with vegetation and distance from water bodies. The ranking is as follows: slope orientation > vegetation > granite > slope position > distance from water bodies > topography > red bricks, with granite, vegetation, distance from water bodies, and slope position all showing significant correlations (p < 0.01).
The PET was positively correlated with granite and slope orientation, while negatively correlated with red bricks, vegetation, distance from water bodies, and topography. The correlation ranking is as follows: vegetation > red bricks > granite > distance from water bodies > topography > slope orientation, with all showing significant correlations (p < 0.01).
Overall, vegetation had a significant impact on cooling, increasing the humidity, reducing the wind speed, blocking solar radiation, and lowering the PET. Water bodies, being fully exposed to sunlight without shade, have low reflectivity, leading to significantly higher temperatures. Although evaporation can lower surrounding temperatures, the water surface temperature remains higher than that in shaded areas, resulting in higher air temperatures in shaded spaces near water bodies. This indicates that different landscape features have varying effects on microclimatic factors, and these factors (air temperature, relative humidity, wind speed, and solar radiation) play different dominant roles in thermal comfort under different conditions. Therefore, optimizing the combination of landscape elements is the key to improving the microclimate and thermal comfort in parks.

3.2.2. Correlation Analysis among Microclimate Factors

The thermal sensation of the human body in outdoor spaces is influenced by multiple climatic factors, making it difficult to accurately analyze using a single factor. By conducting a correlation analysis among the air temperature, relative humidity, wind speed, and solar radiation, we can better understand the interactions and impacts of these microclimatic factors.
As shown in Figure 6, there were significant or highly significant correlations among the temperature, humidity, wind speed, and mean radiant temperature. The air temperature was negatively correlated with relative humidity and positively correlated with wind speed and mean radiant temperature. The humidity was negatively correlated with wind speed and mean radiant temperature, while the wind speed was positively correlated with mean radiant temperature. The strongest correlation was between the air temperature and relative humidity at −0.86, followed by a strong correlation of 0.64 between the air temperature and mean radiant temperature, indicating that solar radiation significantly affects the air temperature, leading to a decrease in relative humidity as the air temperature rises.
The correlation between the wind speed and air temperature was also strong at 0.59. In the park, the presence of trees and slopes resulted in lower temperatures compared to the surrounding areas. Wind carries warmer air from higher-temperature areas to cooler ones, raising the temperatures in shaded areas. Higher wind speeds bring in more warm air, increasing the surrounding temperatures. Although wind can accelerate evaporation and reduce heat, the heat from incoming warm air outweighs the cooling effect of evaporation, resulting in higher temperatures with increased wind speed.

3.2.3. Correlation Analysis between Microclimate Factors and Thermal Comfort

According to the correlation analysis results in Figure 6, there were significant or highly significant correlations between the microclimatic factors and PET. Air temperature, wind speed, and mean radiant temperature exhibit positive correlations with thermal comfort, while humidity shows a negative correlation. The correlation ranking is as follows: mean radiant temperature > air temperature > humidity > wind speed. This indicates that solar radiation has a substantial impact on the comfort levels in Xinjiang, and blocking solar radiation can improve thermal comfort.
At night, when there is no solar radiation, the air temperature becomes the primary factor affecting thermal comfort. The wind speed is positively correlated with thermal comfort because wind carries warmer air from above water bodies to cooler, shaded areas. The greater the wind speed, the more warm air is brought in, leading to increased temperatures and enhanced thermal comfort.
Overall, the analysis reveals that microclimatic parameters have varying degrees and types of influence on thermal comfort, and different landscape features affect these parameters differently. Therefore, it is crucial to determine how to adjust the combination of landscape elements in the park to improve the microclimate and thermal comfort.

3.3. Optimizing Design Strategies

3.3.1. Optimization Program

Based on the simulation and measured data, this study aims to enhance thermal comfort as the optimization goal for the research area. The correlation analysis indicates that the mean radiant temperature and air temperature have the greatest impact on thermal comfort; therefore, the focus is on improving comfort through shading and transpiration.
Given the numerous buildings and complex built environment surrounding Mingzhu Park, expanding the park’s area is not feasible for improving thermal comfort. Therefore, modifying the thermal environment within the limited park area is one of the optimal solutions, effectively enhancing thermal comfort without impacting the surrounding built environment. Considering the significant influence of vegetation and water bodies on the park’s thermal environment, optimization designs for greenery and water features are proposed (Figure 7).
  • Water Body Optimization Design
Previous studies have shown that larger water body areas provide better cooling effects on the surrounding environment [34,35]. However, due to the limited park area, it is not feasible to infinitely expand the water body size. Additionally, if the water body is too large, the lowest temperature will occur at the center, reducing its cooling efficiency. Research has also found that water bodies can have interconnected cooling effects [36]; therefore, appropriately separating them can help distribute the cooling effect more evenly, maximizing efficiency.
To effectively utilize the water bodies and enhance their impact on the surrounding thermal comfort while keeping the total water area unchanged, this study proposes dividing the water body into four sections. This design would allow for the two northern sections to extend moderately toward the hard-paved areas to the north. The main goal of this adjustment is to expand the water body’s influence on the surrounding thermal environment, leveraging its natural cooling effect to benefit more hard-paved areas.
2.
Greenery Optimization Design
Due to the strong solar radiation and long sunshine hours in Xinjiang, sunlight is the primary factor affecting thermal comfort. According to the “Park Design Specification” (GB 51192-2016), the area of various park green spaces should exceed 70% of the park’s total area, excluding water bodies, with pathways and paved areas occupying no less than 10%. To enhance thermal comfort while providing more activity space for residents, the land coverage of greenery in the park will be increased from the current 75% to 80%.
The main tree species selected for planting are the large-leaved ash and white elm, both deciduous trees. First, trees will be planted around the water bodies to maximize the combined cooling effect of water and trees. Second, additional greenery will be added at the northwest and northeast corners, as well as at the southern entrance, to improve the thermal comfort for residents entering the park. Finally, trees will be planted on small islands within the water bodies to further enhance thermal comfort.

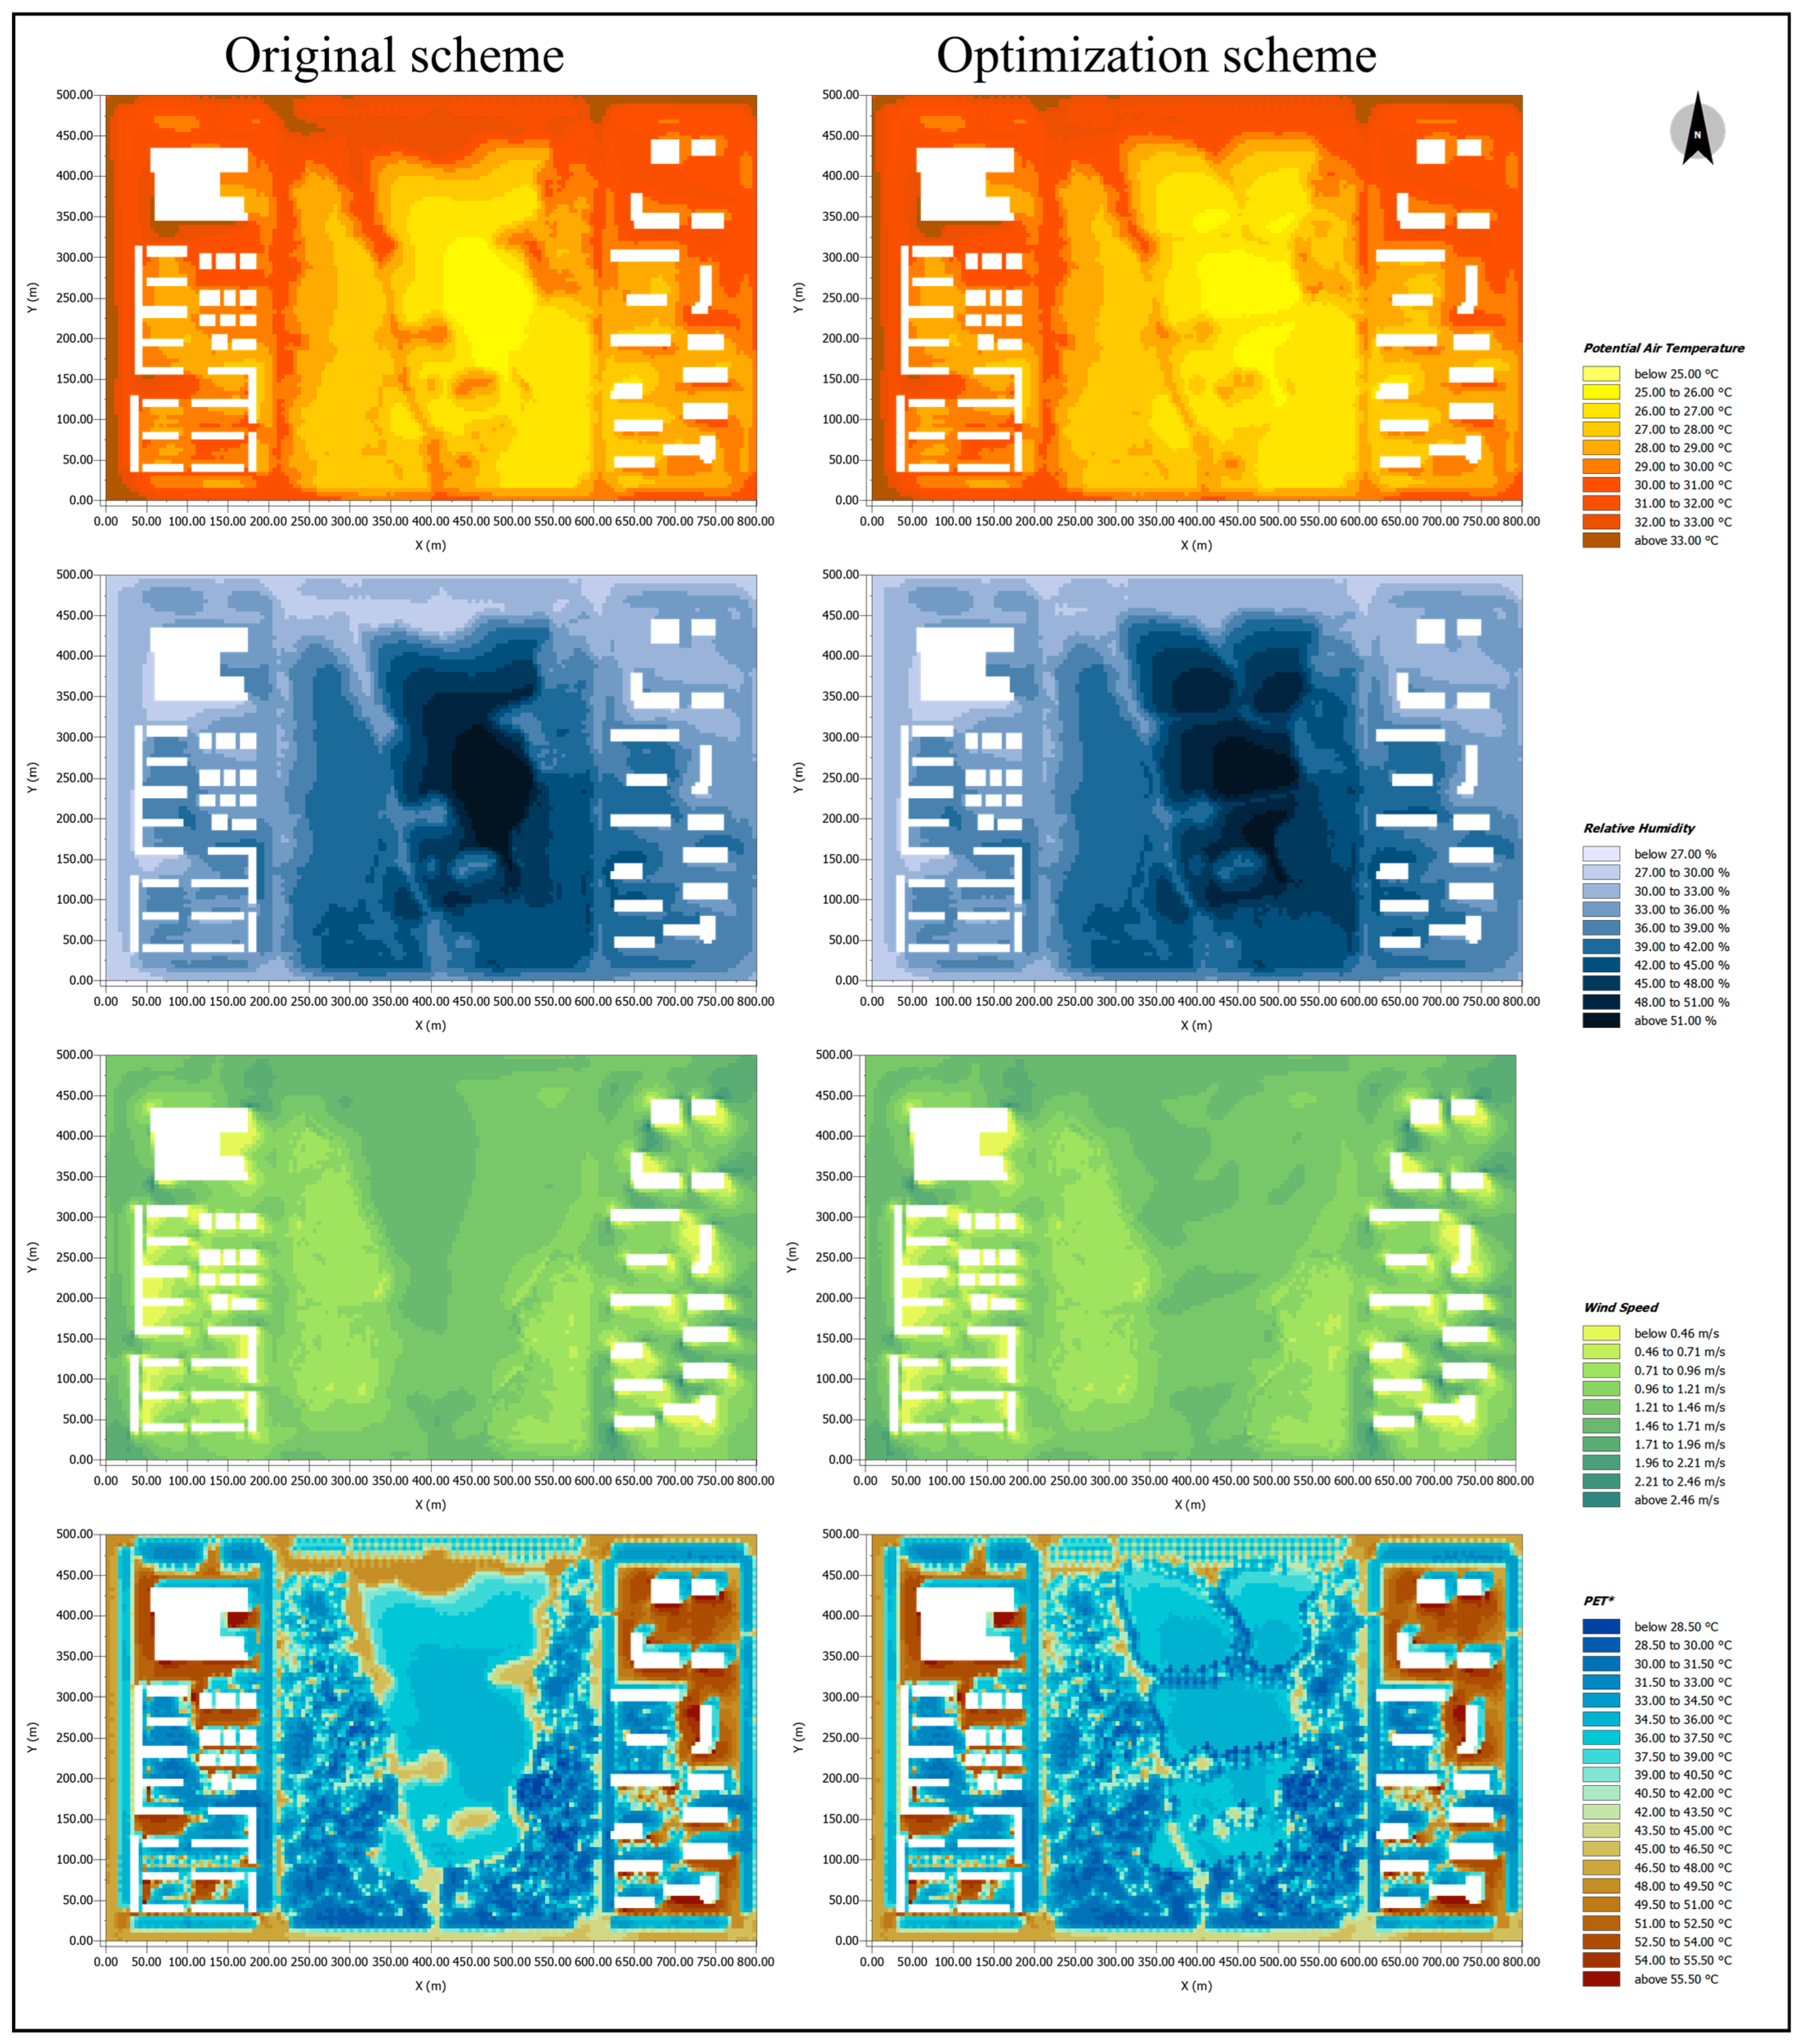
3.3.2. Optimized Design Verification

To compare the microclimate and thermal comfort of the park before and after optimization, simulations were conducted at 2:00 p.m., when the PET reaches its maximum value, as shown in Figure 8. The comparison of the air temperature simulations reveals a significant overall reduction in the park’s air temperature, particularly in the northwest and northeast corners, the southern entrance, and the northern area. The air temperature in the hard-paved areas and on small islands in the water also decreased due to the increase in trees, and the air temperature in the nearby built-up areas also showed a decline. The average air temperature in the park decreased from 28.49 °C to 28.14 °C, a reduction of 0.35 °C.
The comparison of the relative humidity simulations indicates a significant increase in the park’s relative humidity, especially in the northern and eastern sides, with the relative humidity in the eastern built-up area also rising. The average relative humidity in the park increased from 40.55% to 41.43%, an increase of 0.88%. The optimization had a minor impact on the wind speed; however, the increase in trees slightly reduced the wind speed within the park, with the average wind speed decreasing from 1.26 m/s to 1.24 m/s, a reduction of 0.02 m/s.
The PET simulation comparison shows a significant decrease in the PET within the park, enhancing human thermal comfort. Notably, the lighter brown areas (48–49.5 °C) in the northern part of the park were reduced to lighter blue and blue areas. Additionally, the previously concentrated lowest PET area at the center of the water body expanded after separation, improving the water body’s ability to enhance thermal comfort. The average PET in the park decreased from 37.17 °C to 35.82 °C, a reduction of 1.35 °C.
To further analyze the impact of park optimization on the park and surrounding built-up areas, the study area was divided into three parts: the western urban area, the park, and the eastern urban area (Figure 9). The PET for each region was statistically compared. The proportions of each PET level before and after optimization are shown in Figure 10a,b. Compared to the current scenario, the optimized park shows an increase in the proportion of PET levels between 23 and 29 °C at night, indicating a slight decrease in thermal comfort due to the added trees, which reduce the wind speed and enhance the park’s insulation at night.
During the day, the proportion of PET levels exceeding 41 °C in the park significantly decreased, especially from 17.23% to 7.61% at 11:00 a.m., a reduction of 9.62%. Additionally, the proportion of the blue area (23–29 °C) increased, indicating a notable improvement in daytime thermal comfort for park users. Figure 10c illustrates the trend of PET changes over time for the western built-up area, the park, the eastern built-up area, and the entire study area before and after optimization. The average PET in the park decreased by 1.86 °C, the western built-up area saw a maximum reduction of 0.13 °C, and the PET in the eastern built-up area decreased by 0.35 °C. Overall, the study area experienced a maximum reduction of 0.67 °C.
These results indicate that the optimized plan can lower the PET in the study area and enhance the thermal comfort, particularly improving the daytime comfort in the park while having a smaller effect on the built-up areas on the east and west sides.

3.4. Limitations and Future Works

The main drawback of this study is the incomplete collection of climate data within the research area and the lack of consideration for individual perceptions of the environment. Using fixed-point measurement methods in microclimate assessment presents several limitations. First, fixed-point measurements offer insufficient spatial coverage, restricting the monitoring range and data collection density, which can lead to incomplete or distorted data regarding certain areas’ microclimatic characteristics. Second, the collected data often focus on specific times and locations, lacking real-time responsiveness. Additionally, this method does not consider varying responses among different populations under similar environmental conditions, limiting detailed analysis of microclimate effects on human health. Furthermore, fixed-point measurements primarily provide environmental parameters and fail to capture direct physiological responses and behavioral interactions. Thus, understanding the influence of microclimate on human comfort and health necessitates more comprehensive data support. In the future, technologies like wearable electronic skin could address these limitations [37,38,39] and improve the accuracy and reliability of microclimate measurements. Wearable electronic skin can provide high spatial resolution and dynamic monitoring, allowing users to collect real-time data across various locations [40,41,42] and resulting in more representative microclimate data.

4. Conclusions

This study focused on Mingzhu Park in Shihezi City, a representative area, by analyzing microclimate measurements and thermal comfort at ten selected points during summer. The effects of water bodies, vegetation, topography, and hard surfaces on thermal comfort were explored, leading to the following conclusions:
(1)
Different landscape features significantly impact microclimatic factors and thermal comfort. Vegetation provides shading and transpiration, thereby cooling and humidifying the environment. During the day, water surface temperatures exceed those of shaded areas, while at night, water bodies enhance humidity. Slopes contribute to cooling and wind reduction. Granite and red bricks have low specific heat capacities, causing rapid temperature increases and subsequent cooling when not exposed to sunlight. Trees and slopes greatly improve thermal comfort (PET), with the primary influences being solar radiation during the day and temperature at night. Areas with trees and water in the park offer better thermal comfort.
(2)
The correlation between landscape features and microclimate shows that vegetation significantly affects cooling, increasing humidity, reducing wind speed, blocking solar radiation, and lowering the PET. When fully exposed to sunlight without shade, water bodies absorb significant solar radiation, leading to higher temperatures. Although evaporation can lower the surrounding temperatures, the air above the water remains warmer than in shaded areas, raising temperatures in those spaces.
(3)
There are significant correlations among air temperature, relative humidity, wind speed, and mean radiant temperature. Air temperature is negatively correlated with relative humidity and positively correlated with wind speed and mean radiant temperature. Relative humidity is negatively correlated with wind speed and mean radiant temperature, while wind speed is positively correlated with mean radiant temperature.
(4)
Microclimatic factors show significant correlations with the PET. Air temperature, wind speed, and mean radiant temperature are positively correlated with thermal comfort, while relative humidity is negatively correlated. The correlation ranking is as follows: mean radiant temperature > air temperature > humidity > wind speed, indicating that solar radiation greatly affects the comfort levels in Xinjiang.
(5)
After optimizing the park by increasing the number of trees and designing dispersed water bodies, the average air temperature at 2:00 p.m. decreased by 0.35 °C, the average relative humidity increased by 0.88%, and the average PET decreased by 1.35 °C. The proportion of PET > 41 °C decreased the most at 11:00 AM from 17.23% to 7.61%, a reduction of 9.62%. The park’s average PET decreased by 1.86 °C, the PET in the western built-up area by 0.13 °C, and the PET in the eastern built-up area by 0.35 °C, with an overall reduction of 0.67 °C in the study area. The park’s thermal comfort improved, while the enhancement in thermal comfort for the built-up areas on the east and west sides was minimal.

Author Contributions

Conceptualization, Z.Z.; methodology, Z.Z. and J.L.; software, Z.Z.; validation, Z.Z.; formal analysis, Z.Z.; investigation, Z.Z.; resources, Z.Z. and J.L.; data curation, Z.Z.; writing—original draft preparation, Z.Z.; writing—review and editing, Z.Z., J.L. and Z.F.; funding acquisition, Z.F. All authors have read and agreed to the published version of the manuscript.

Funding

This research was funded by the Xinjiang Construction Corps Science and Technology Program of China (grant number 2023CB008-24).

Institutional Review Board Statement

Not applicable.

Informed Consent Statement

Not applicable.

Data Availability Statement

The data presented in this study are available on request from the corresponding author.

Conflicts of Interest

The authors declare no conflicts of interest.

References

  1. Klein, T.; Anderegg, W.R.L. A Vast Increase in Heat Exposure in the 21st Century Is Driven by Global Warming and Urban Population Growth. Sustain. Cities Soc. 2021, 73, 103098. [Google Scholar] [CrossRef]
  2. Jumadi; Sari, D.N.; Fikriyah, V.N.; Pratama, B.A.; Wardah, H.; Madani, D.T.; Priyono, K.D.; Hadibasyir, H.Z.; Danardono; Saputra, A. Influence of Urban Growth on Urban Heat Island Phenomenon around Jakarta, Indonesia: Insight from Depok and South Tangerang City. IOP Conf. Ser. Earth Environ. Sci. 2024, 1291, 012001. [Google Scholar] [CrossRef]
  3. Du, H.; Zhan, W.; Voogt, J.; Bechtel, B.; Chakraborty, T.C.; Liu, Z.; Hu, L.; Wang, Z.; Li, J.; Fu, P.; et al. Contrasting Trends and Drivers of Global Surface and Canopy Urban Heat Islands. Geophys. Res. Lett. 2023, 50, e2023GL104661. [Google Scholar] [CrossRef]
  4. Zheng, S.; Chen, X.; Liu, Y. Impact of Urban Renewal on Urban Heat Island: Study of Renewal Processes and Thermal Effects. Sustain. Cities Soc. 2023, 99, 104995. [Google Scholar] [CrossRef]
  5. Yadav, N.; Rajendra, K.; Awasthi, A.; Singh, C.; Bhushan, B. Systematic Exploration of Heat Wave Impact on Mortality and Urban Heat Island: A Review from 2000 to 2022. Urban Clim. 2023, 51, 101622. [Google Scholar] [CrossRef]
  6. Yi, C.; Peng, C.; Robinson, D. Modelling Urban Dwellers’ Indoor Heat Stress to Enhance Heat-Health Warning and Planning. Build. Environ. 2023, 243, 110623. [Google Scholar] [CrossRef]
  7. Feng, F.; Ma, Y.; Li, H.; Zhang, Y.; Cheng, B.; Wang, H.; Shen, J. Effects of Temperature on Incidence of Bacillary Dysentery in a Temperate Continental Arid Climate City in Northwest China. Environ. Geochem. Health 2023, 45, 4043–4056. [Google Scholar] [CrossRef]
  8. Li, D.; Wang, L.; Liao, W.; Sun, T.; Katul, G.; Bou-Zeid, E.; Maronga, B. Persistent Urban Heat. Sci. Adv. 2024, 10, eadj7398. [Google Scholar] [CrossRef]
  9. Lasky, E.; Costello, S.; Ndovu, A.; Aguilera, R.; Weiser, S.D.; Benmarhnia, T. The Health Benefits of Reducing Micro-Heat Islands: A 22-Year Analysis of the Impact of Urban Temperature Reduction on Heat-Related Illnesses in California’s Major Cities. Sci. Total Environ. 2024, 949, 175284. [Google Scholar] [CrossRef]
  10. Kim, Y.; Shin, Y.; Cho, H. Influencing Factors on Thermal Comfort and Biosignals of Occupant—A Review. J. Mech. Sci. Technol. 2021, 35, 4201–4224. [Google Scholar] [CrossRef]
  11. Chan, S.Y.; Chau, C.K. On the Study of the Effects of Microclimate and Park and Surrounding Building Configuration on Thermal Comfort in Urban Parks. Sustain. Cities Soc. 2021, 64, 102512. [Google Scholar] [CrossRef]
  12. Luo, X.; Zhao, Y.; Li, Y.; Yang, J.; Guo, T. Effects of Tree Species and Planting Forms on the Thermal Comfort of Campsites in Hot and Humid Areas of China. Int. J. Biometeorol. 2024, 68, 1437–1449. [Google Scholar] [CrossRef]
  13. Liu, H.; Lim, J.Y.; Wint Hnin Thet, B.; Lai, P.-Y.; Koh, W.S. Evaluating the Impact of Tree Morphologies and Planting Densities on Outdoor Thermal Comfort in Tropical Residential Precincts in Singapore. Build. Environ. 2022, 221, 109268. [Google Scholar] [CrossRef]
  14. Keikhosravi, G.; Khalidi, S.; Shahmoradi, M. Effects of Climates and Physical Variables of Parks on the Radius and Intensity of Cooling of the Surrounding Settlements. Urban Clim. 2023, 51, 101601. [Google Scholar] [CrossRef]
  15. Xu, H.; Lin, X.; Lin, Y.; Zheng, G.; Dong, J.; Wang, M. Study on the Microclimate Effect of Water Body Layout Factors on Campus Squares. Int. J. Environ. Res. Public Health 2022, 19, 14846. [Google Scholar] [CrossRef] [PubMed]
  16. Cureau, R.J.; Pigliautile, I.; Pisello, A.L. Seasonal and Diurnal Variability of a Water Body’s Effects on the Urban Microclimate in a Coastal City in Italy. Urban Clim. 2023, 49, 101437. [Google Scholar] [CrossRef]
  17. Yang, B.; Olofsson, T.; Nair, G.; Kabanshi, A. Outdoor Thermal Comfort under Subarctic Climate of North Sweden—A Pilot Study in Umea. Sust. Cities Soc. 2017, 28, 387–397. [Google Scholar] [CrossRef]
  18. Wu, Z.; Man, W.; Ren, Y. Influence of Tree Coverage and Micro-Topography on the Thermal Environment within and beyond a Green Space. Agric. For. Meteorol. 2022, 316, 108846. [Google Scholar] [CrossRef]
  19. Yang, W.; Lin, Y.; Li, C.-Q. Effects of Landscape Design on Urban Microclimate and Thermal Comfort in Tropical Climate. Adv. Meteorol. 2018, 2018, 2809649. [Google Scholar] [CrossRef]
  20. Haeri, T.; Hassan, N.; Ghaffarianhoseini, A. Evaluation of Microclimate Mitigation Strategies in a Heterogenous Street Canyon in Kuala Lumpur from Outdoor Thermal Comfort Perspective Using Envi-Met. Urban Clim. 2023, 52, 101719. [Google Scholar] [CrossRef]
  21. Elnabawi, M.H.; Jamei, E. The Thermal Perception of Outdoor Urban Spaces in a Hot Arid Climate: A Structural Equation Modelling (SEM) Approach. Urban Clim. 2024, 55, 101969. [Google Scholar] [CrossRef]
  22. Nasrollahi, N.; Namazi, Y.; Taleghani, M. The Effect of Urban Shading and Canyon Geometry on Outdoor Thermal Comfort in Hot Climates: A Case Study of Ahvaz, Iran. Sustain. Cities Soc. 2021, 65, 102638. [Google Scholar] [CrossRef]
  23. Banerjee, S.; Pek, R.X.Y.; Yik, S.K.; Ching, G.N.; Ho, X.T.; Dzyuban, Y.; Crank, P.J.; Acero, J.A.; Chow, W.T.L. Assessing Impact of Urban Densification on Outdoor Microclimate and Thermal Comfort Using ENVI-Met Simulations for Combined Spatial-Climatic Design (CSCD) Approach. Sustain. Cities Soc. 2024, 105, 105302. [Google Scholar] [CrossRef]
  24. Feng, L.; Shuai, L.; Zhou, Y.; Zhang, X.; Sun, J. Improving the Green Space Arrangement in Residential Areas from the Perspective of Tree Leaf Temperature Utilizing Scenario Simulation in ENVI-Met. Sci. Total Environ. 2024, 918, 170650. [Google Scholar] [CrossRef]
  25. Tsoka, S.; Tsikaloudaki, A.; Theodosiou, T. Analyzing the ENVI-Met Microclimate Model’s Performance and Assessing Cool Materials and Urban Vegetation Applications—A Review. Sustain. Cities Soc. 2018, 43, 55–76. [Google Scholar] [CrossRef]
  26. Migliari, M.; Babut, R.; De Gaulmyn, C.; Chesne, L.; Baverel, O. The Metamatrix of Thermal Comfort: A Compendious Graphical Methodology for Appropriate Selection of Outdoor Thermal Comfort Indices and Thermo-Physiological Models for Human-Biometeorology Research and Urban Planning. Sustain. Cities Soc. 2022, 81, 103852. [Google Scholar] [CrossRef]
  27. Gagge, A.P.; Fobelets, A.P.; Berglund, L.G. A Standard Predictive Index of Human Response to the Thermal Environment. Ashrae Trans 1986, 92, 709–731. [Google Scholar]
  28. Fanger, P.O. Thermal Comfort: Analysis and Applications in Environmental Engineering; Danish Technical Press: København, Denmark, 1972. [Google Scholar]
  29. Jendritzky, G.; de Dear, R.; Havenith, G. UTCI-Why Another Thermal Index? Int. J. Biometeorol. J. Int. Soc. Biometeorol. 2012, 56, 421–428. [Google Scholar] [CrossRef]
  30. Höppe, P. The Physiological Equivalent Temperature—A Universal Index for the Biometeorological Assessment of the Thermal Environment. Int. J. Biometeorol. 1999, 43, 71–75. [Google Scholar] [CrossRef]
  31. Cui, P.; Jiang, J.; Zhang, J.; Wang, L. Effect of Street Design on UHI and Energy Consumption Based on Vegetation and Street Aspect Ratio: Taking Harbin as an Example. Sustain. Cities Soc. 2023, 92, 104484. [Google Scholar] [CrossRef]
  32. He, X.; Shao, L.; Tang, Y.; Wu, S. Improving Children’s Outdoor Thermal Comfort: A Field Study in China’s Severely Cold Regions. Urban Clim. 2023, 51, 101620. [Google Scholar] [CrossRef]
  33. ISO 7726:1998; Ergonomics of the Thermal Environment—Instruments for Measuring Physical Quantities. ISO: Geneva, Switzerland, 2001.
  34. Ampatzidis, P.; Kershaw, T. A Review of the Impact of Blue Space on the Urban Microclimate. Sci. Total Environ. 2020, 730, 139068. [Google Scholar] [CrossRef] [PubMed]
  35. Pan, Z.; Xie, Z.; Wu, L.; Pan, Y.; Ding, N.; Liang, Q.; Qin, F. Simulation of Cooling Island Effect in Blue-Green Space Based on Multi-Scale Coupling Model. Remote Sens. 2023, 15, 2093. [Google Scholar] [CrossRef]
  36. Cao, B.; Chen, Q.; Du, M.; Cheng, Q.; Li, Y.; Liu, R. Simulation Analysis of the Cooling Effect of Urban Water Bodies on the Local Thermal Environment. Water 2022, 14, 3091. [Google Scholar] [CrossRef]
  37. Miao, J.; Tian, M.; Qu, L.; Zhang, X. Flexible, Transparent and Conductive Wearable Electronic Skin Based on 2D Titanium Carbide (MXene) Ink. Carbon 2024, 222, 118950. [Google Scholar] [CrossRef]
  38. Hou, Z.; Liu, X.; Tian, M.; Zhang, X.; Qu, L.; Fan, T.; Miao, J. Smart Fibers and Textiles for Emerging Clothe-Based Wearable Electronics: Materials, Fabrications and Applications. J. Mater. Chem. A 2023, 11, 17336–17372. [Google Scholar] [CrossRef]
  39. Zuo, X.; Fan, T.; Qu, L.; Zhang, X.; Miao, J. Smart Multi-Responsive Aramid Aerogel Fiber Enabled Self-Powered Fabrics. Nano Energy 2022, 101, 107559. [Google Scholar] [CrossRef]
  40. Fan, Q.; Miao, J.; Liu, X.; Zuo, X.; Zhang, W.; Tian, M.; Zhu, S.; Qu, L.; Zhang, X. Biomimetic Hierarchically Silver Nanowire Interwoven MXene Mesh for Flexible Transparent Electrodes and Invisible Camouflage Electronics. Nano Lett. 2022, 22, 740–750. [Google Scholar] [CrossRef]
  41. Chen, X.; He, Y.; Tian, M.; Qu, L.; Fan, T.; Miao, J. Core–Sheath Heterogeneous Interlocked Conductive Fiber Enables Smart Textile for Personalized Healthcare and Thermal Management. Small 2024, 20, 2308404. [Google Scholar] [CrossRef] [PubMed]
  42. Zuo, X.; Zhang, X.; Qu, L.; Miao, J. Smart Fibers and Textiles for Personal Thermal Management in Emerging Wearable Applications. Adv. Mater. Technol. 2023, 8, 2201137. [Google Scholar] [CrossRef]
Figure 1. Monthly maximum/minimum/average air temperatures, average wind speed, and precipitation in Shihezi.
Sustainability 16 07687 g001
Figure 2. Study area and measurement points layout.
Sustainability 16 07687 g002
Figure 3. Comparison of measurement and simulation values: (a) air temperature; (b) relative humidity.
Sustainability 16 07687 g003
Figure 4. Calculated and measured results: (a) air temperature; (b) relative humidity; (c) wind speed; (d) PET.
Sustainability 16 07687 g004
Figure 5. 10:00, 14:00, and 18:00 PET simulated distribution maps.
Sustainability 16 07687 g005
Figure 6. Microclimate correlations across landscape features.
Sustainability 16 07687 g006
Figure 7. Optimization of park design program.
Sustainability 16 07687 g007
Figure 8. Distribution of microclimate and thermal comfort simulations before and after 14:00 optimization.
Sustainability 16 07687 g008
Figure 9. Division of the study area.
Sustainability 16 07687 g009
Figure 10. Distribution of PET before and after park optimization: (a) PET of the original park scenario; (b) PET of the optimized park scenario; (c) change in PET before and after optimization.
Sustainability 16 07687 g010
Table 1. Landscape characterization and information sheet for each measurement point.
Measurement
Point
Landscape FeaturesDistance to Water Body (m)Altitude (m)Gradient
P1The area provides spacious and clear views with a granite base and water on three sides.200Windward
Slope
P2Located under tree shade on grass, it is near granite flooring on the north, a red brick walkway to the west, and surrounded by trees and grass on the east and south sides.500Windward
Slope
P3Under trees with grass, it is next to a red brick path on the east and encircled by greenery to the west, north, and south.296Windward
Slope
P4Located under tree cover with green ground, it is next to granite on the north and a red brick path on the west, with dense vegetation surrounding the south and east sides.762Windward
Slope
P5Situated beneath a canopy of trees, with a verdant ground cover and encompassed by an expanse of trees and grassland.326Windward
Slope
P6Situated beneath a canopy of trees, with a verdant ground cover and encompassed by an expanse of trees and grassland.800Leeward
Slope
P7Located near water to the north, this spot features lush grass and is circled by granite paving, all under the shade of trees.200Windward
Slope
P8Located under tree cover with lush grass. The south side has red brick paving, while the north side blends forest and grassy areas.729Windward
Slope
P9The site is under tree cover with green ground and red brick pavement on the east, surrounded by dense vegetation and grass on the other three sides.1040Leeward
Slope
P10Located under tree cover with green ground, surrounded by a wide area of trees and grass.320Windward
Slope
Table 2. Performance parameters and photos of experimental apparatus.
Measuring InstrumentsMeasurement ParametersRange of MeasurementAccuracyInstrument Photo
SMART METER wireless data acquisition deviceTa (°C)−20~60 °C±0.3 °CSustainability 16 07687 i001
RH (%)0~95%±3%
Air Velocity Meter TM-403Va (m/s)0~25 m/s0.1 m/sSustainability 16 07687 i002
JTR04 black globe thermometerTg (°C)0~80 °C±1 °CSustainability 16 07687 i003
Table 3. ENVI-met modeling and parameter settings.
The ENVI-Met Model
Modelling establishedSustainability 16 07687 i004
Simulations inputShihezi
(86°2′ E, 44°18′ N)
Simulation date12 July 2023
Simulation time0:00 a.m.–24:00 p.m.
Wind speed at 10 m2.5 m/s
Wind direction315°
Roughness length0.1
Initial air temperature rangeData from the National Meteorological Center
Initial relative humidity rangeData from the National Meteorological Center
Table 4. Comparison of measurement and simulation data.
Meteorological ElementsNormsP1P2P3P4P5P6P7P8P9P10
Air temperaturePearson0.950.890.860.960.870.930.850.850.880.85
R20.900.790.730.910.750.860.720.720.780.73
RMSE/°C2.771.220.840.750.521.062.152.351.261.39
Relative humidityPearson0.980.880.880.850.850.860.960.900.910.93
R20.950.770.770.730.720.740.930.810.830.87
RMSE/%9.804.874.685.782.518.149.389.989.809.94
Table 5. PET thermal sensation levels.
Thermal PerceptionGrade of Physical StressPET/°C
Very coldExtreme cold stress<4
ColdStrong cold stress4–8
CoolModerate cold stress8–13
Slightly coldSlight cold stress13–18
ComfortableNeutral18–23
Slightly warmSlight heat stress23–29
WarmModerate heat stress29–35
HotStrong heat stress35–41
Very hotExtreme heat stress>41
Disclaimer/Publisher’s Note: The statements, opinions and data contained in all publications are solely those of the individual author(s) and contributor(s) and not of MDPI and/or the editor(s). MDPI and/or the editor(s) disclaim responsibility for any injury to people or property resulting from any ideas, methods, instructions or products referred to in the content.

