Abstract
Metropolitan areas are important regions with a high concentration of population and public service facilities. The coupling coordination between public service facilities and population plays an important role in the sustainable development of economy and society. However, previous studies have focused on a few core cities, effectively identifying areas with weak coordination of public services and currently lacking corresponding information support and paradigms at the regional scale. Taking the Wuhan Metropolitan Area as an example, this paper strengthens the concern about the spatiality and locality of public service facilities in the region;, applies the improved CRITIC method and coupling coordination model to study the spatiotemporal distribution characteristics of public service facilities at the county and grid levels by using multisource data, and evaluates the intercity differences and dynamic changes of coupling coordination relationships between public service facilities and population. The findings are as follows: (1) Wuhan was the core of public service facilities in the metropolitan area, and a continuous high-level coordinated distribution was gradually developed on the east-west axis from 2016 to 2022; (2) there were differences in the coupling coordination degree of different types of facilities, among which the imbalance between the supply and demand of elderly care facilities was obvious; and (3) the coupling coordination degree of facilities in the Wu-E-Huang-Huang core development area was relatively high. Finally, we summarize the development stages of the coupling coordination between the facilities and population in the Wuhan Metropolitan Area and obtain the typical development characteristics. The research results could provide scientific support for planning decisions.
1. Introduction
Metropolitan areas and urban agglomerations are important regional units supporting global cities. Cultivating modern metropolitan areas is inevitable and necessary for promoting public service sharing and the coordinated development of public resources [1,2]. Social equity and inclusiveness of public service facilities are important manifestations of sustainable development [3,4]. At the same time, the planning of public service facilities to support trends and changes in population growth in an economical and effective way is also the key to promote the sustainable development of cities and people’s quality of life. However, due to the uneven economic development and imperfect construction of metropolitan areas, there is long-term uneven distribution and resource mismatch of public services, which is not conducive to the sustainable development of metropolitan areas. Previous studies have shown that there are conflicts between efficiency and fairness in the layout of public service facilities in metropolitan areas, such as medical and health facilities not fully covering vulnerable populations [5] and educational facilities attracting high-income people to gather in a space [6]. In recent years, with the change in China’s planning mode from increment to stock and the change in the public service allocation mode from a market orientation to a “people-oriented” concept, issues such as improving regional public service quality and integrating urban public services have been widely discussed [7,8,9]. Accurately evaluating the allocation and differentiation of public service facilities and determining development laws are important issues in the evaluation of public service facilities in metropolitan areas.
Since Teitz first proposed the location theory of public service facilities in 1968 [10], research on urban public service facilities has attracted the interest of scholars. In terms of research, many studies have evaluated public services in metropolitan areas from the perspective of economics. For example, Cao analyzes the coupling between infrastructure construction and population accumulation in the Beijing–Tianjin–Hebei metropolitan area using push–pull theory [11]; Qi builds a comprehensive evaluation index system to evaluate the relationship between public service carrying capacity and economic development in metropolitan areas [12]; and Zhang uses the Gini coefficient to evaluate the equalization of public service facilities in metropolitan areas [13]. In these studies, the resource attributes of public services are emphasized, while their spatial attributes are ignored. There are also some studies from the perspective of geography. For example, some studies have analyzed the use of large-scale public facilities in metropolitan areas from the perspective of population concentration [14,15] and the distribution of large regional facilities [16], but there is still a lack of comprehensive and detailed research paradigms for spatial distribution and coordination evaluation based on spatial perspectives of regional public services.
In terms of research scale, although the layout of public service facilities in a single city or central city has been extensively studied, including accessibility [17,18,19], matching [20,21,22], and POI distribution [23,24], existing research has given little attention to regional coordination and intercity comparisons of public service facilities. Most existing studies on the integration of metropolitan areas are from the perspective of strategic planning, with administrative districts as the research unit and public services a subitem in the evaluation of integration. However, the establishment of administrative districts is influenced by many historical factors, which are not completely consistent with urban “functional areas” or actual construction needs [25]. With the development and construction of the concept of the “life circle” [26,27], the allocation scope of public service facilities has become increasingly accurate. Therefore, traditional evaluations based on administrative districts can no longer accurately reflect the allocation of public service facilities in metropolitan areas, and the evaluation scale and minimum units need to be improved.
In terms of research methods, existing research mostly adopts the “1000-person index” and “10,000-person index” for evaluation [28], which is carried out on the premise that public service is a resource attribute. However, the locality of public services in metropolitan areas and their accurate spatial correspondence with population are ignored. Under the planning concepts of “urban-rural integration” and “refined governance” in China [29,30,31], effectively identifying areas with weak coordination of public services in metropolitan areas currently lacks corresponding information support and paradigms at the regional scale. In addition, there are still some problems in the current research on public service facilities, such as unclear classification, inconsistent evaluation indices and systems, and weak time series analysis, which cannot effectively support research on public service allocation evaluation in metropolitan areas.
Accordingly, this paper intervenes from the perspective of “man–land coupling”. Compared with the emphasis on the resource attributes of public service facilities in previous studies, this paper strengthens the concern about the spatiality and locality of public service facilities in the region and proposes the concept of “precise coupling”. To improve the limitations of existing studies that use administrative districts as the research unit, this paper coordinates the regional scale and the life circle scale. We evaluate the distribution of public service facilities and the coupling coordination thereof with the population at the grid and county levels based on geographic information data, POI data, population grid data, and population aging data. We improve not only the coupling coordination model to solve the problem of differences in facility allocation indicators among cities but also the CRITIC method to objectively weight big data under the condition of adapting to grid analysis. Finally, this paper summarizes the three stages of the development of public service facilities in the Wuhan Metropolitan Area, identifies the problems existing in the coupling of public service facilities and population at this stage, and probes the reasons for intercity differences in coupling coordination relationships between facilities and population.
2. Materials and Methods
2.1. Research Area and Unit
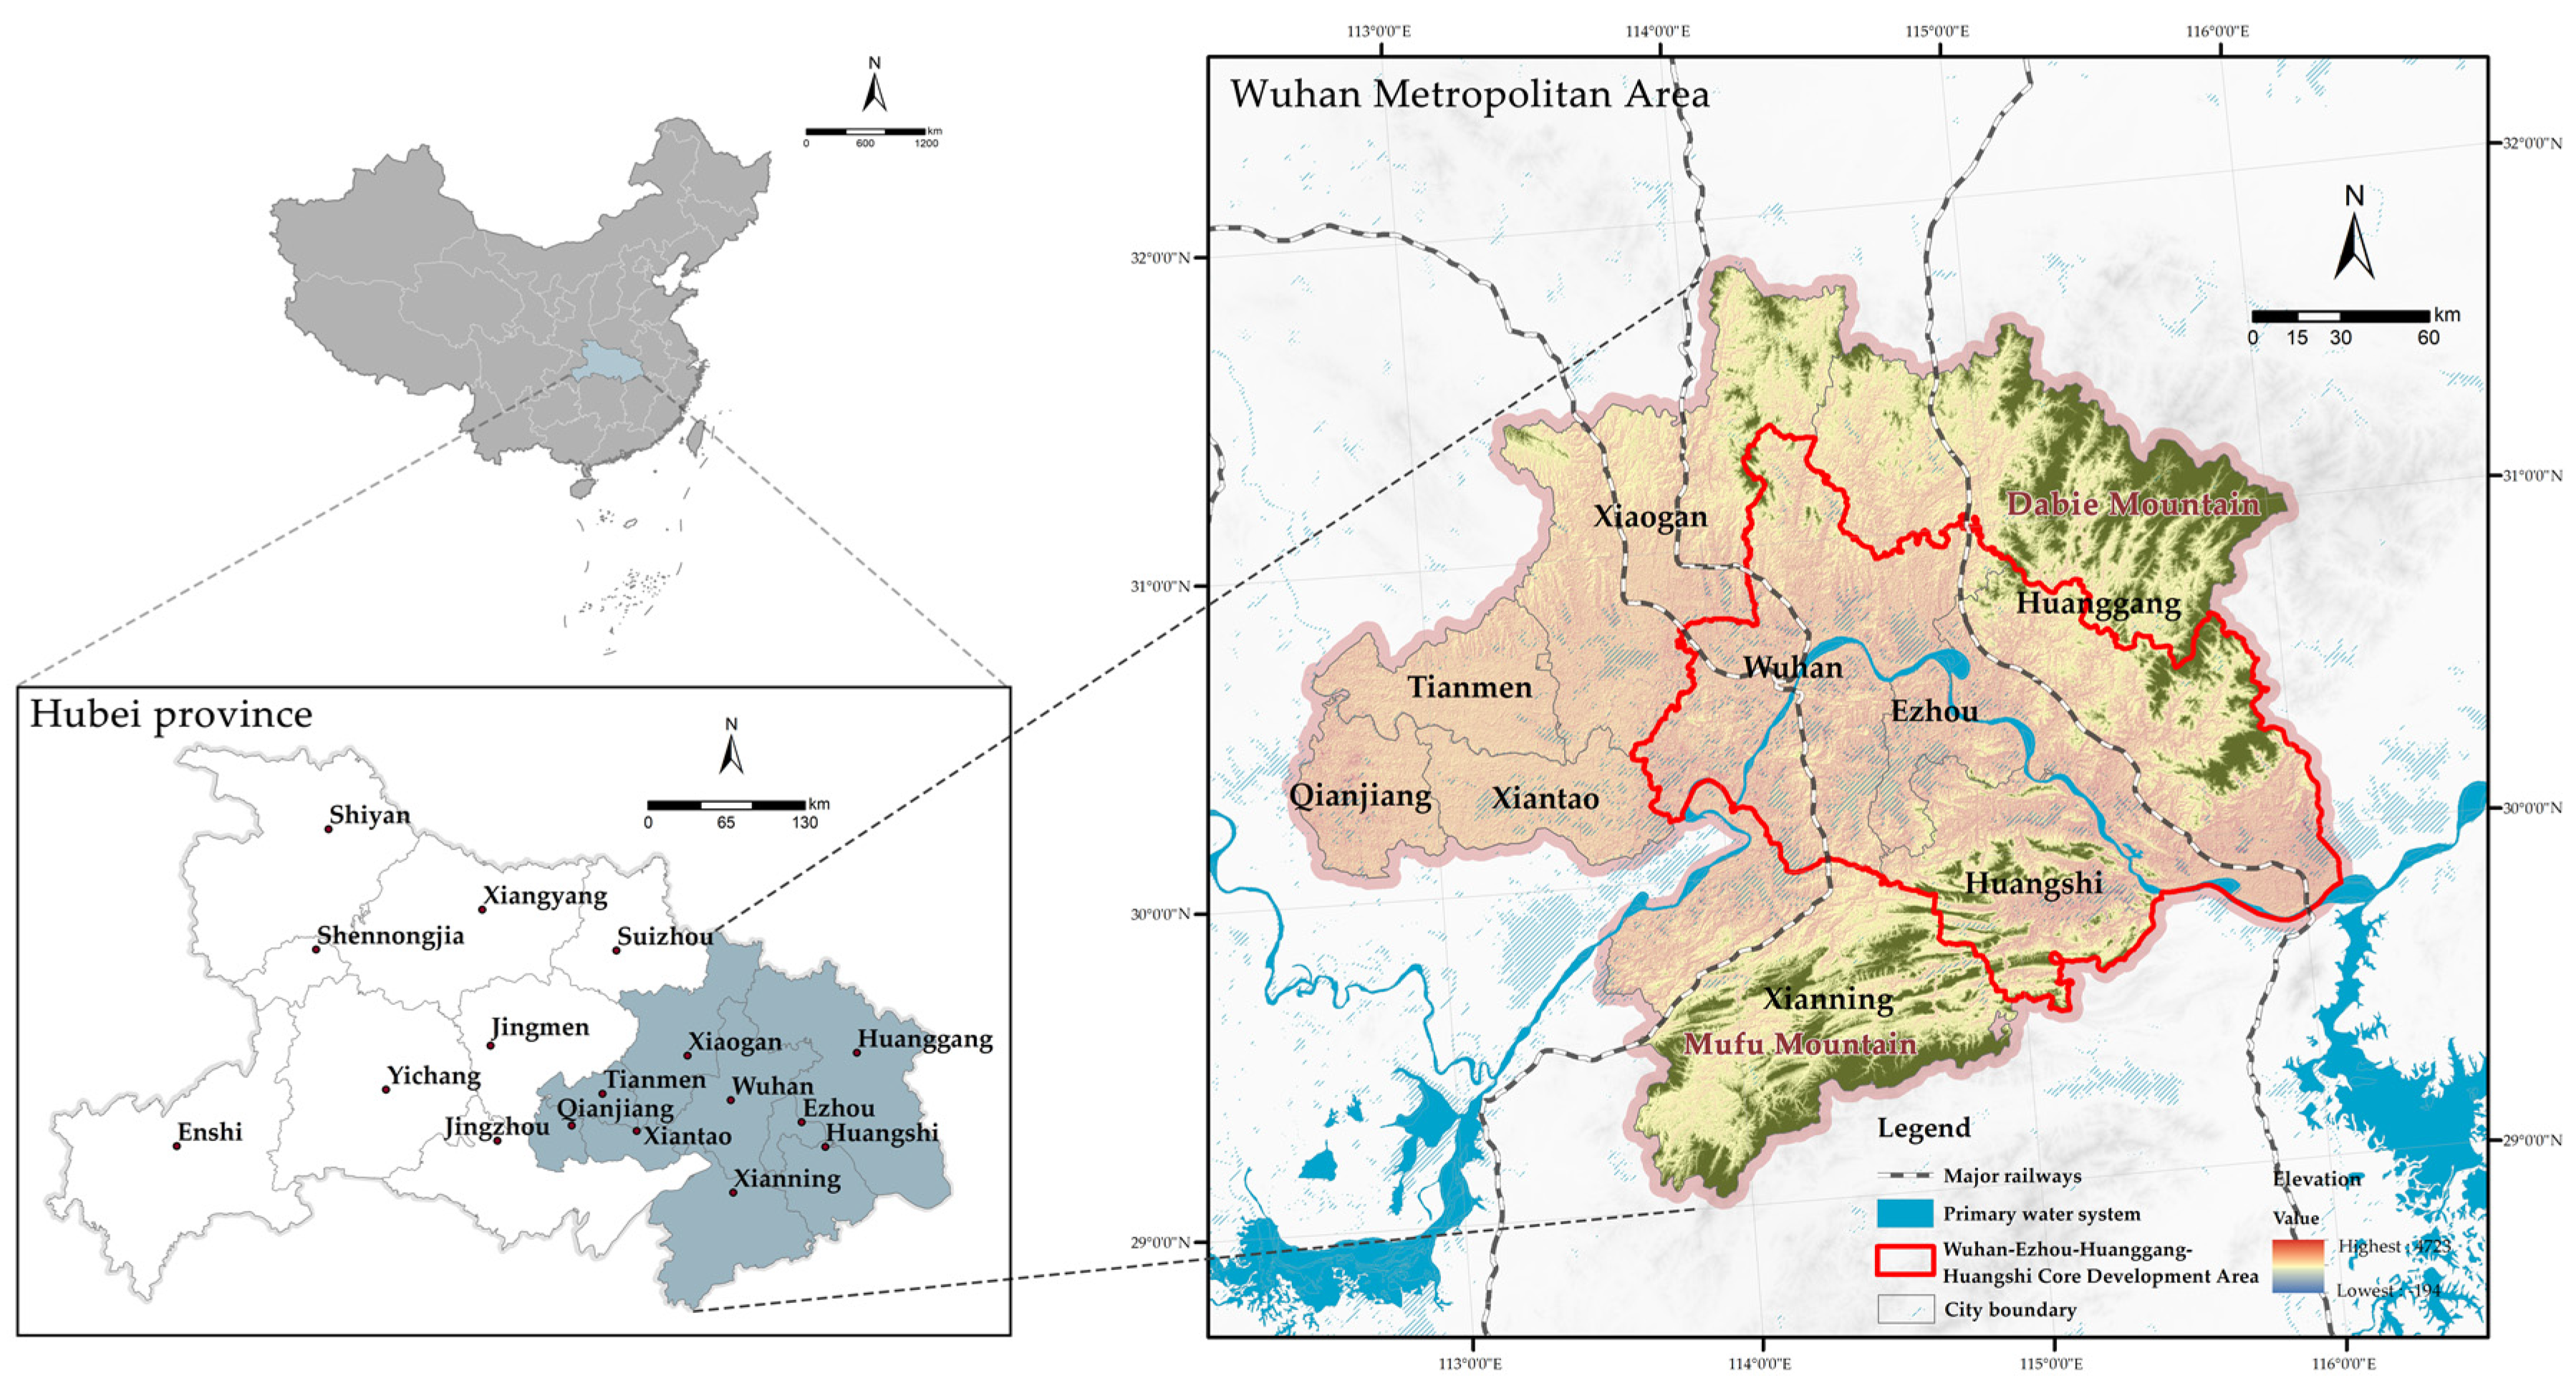
The Wuhan Metropolitan Area (WMA), also known as the “1 + 8” city circle, is a city complex centered in Wuhan, the largest city in central China (Figure 1). The WMA contains nine cities, specifically Wuhan, Huangshi, Ezhou, Xiaogan, Huanggang, Xianning, Xiantao, Tianmen, and Qianjiang. All the other cities are within a radius of approximately 100 km around Wuhan. The WMA is the most intensive and dynamic area in Hubei Province, accounting for one-third of the province’s land area and one-half of the population and creating two-thirds of the province’s regional GDP. It is an important area of the national Yangtze River Economic Belt and a strategy for promoting central China [32].
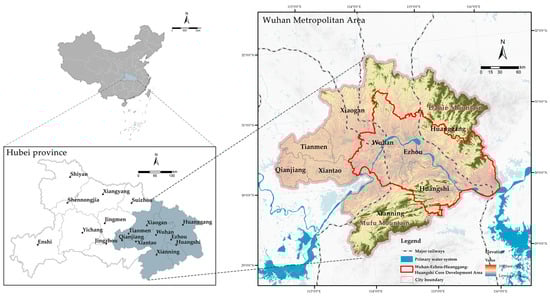
Figure 1.
Location of the Wuhan Metropolitan Area.
According to relevant documents of the Hubei Provincial Development and Reform Commission, the Wu-E-Huang-Huang core development area is the core area of the WMA and includes Wuhan, Ezhou, Huangshi, and parts of Huanggang [33]. In this paper, we consider this area an important unit in the analysis of public service facilities in the metropolitan area.
With the development and construction of the life circle concept in China, the allocation scope of public service facilities has become increasingly accurate, which also supports the research unit for the evaluation of public services [34]. The fifteen-minute life circle is the largest life circle with a radius of 1000 m, and can be used as the smallest research unit at the regional scale. The grid unit is flexible and operational, and can better capture the differences within and between cities. Moreover, the corresponding relationship between public service facilities and the population can be more accurate and specific. Using the fishing net tool of ArcGIS (V10.2), the WMA was divided into 1000 m × 1000 m spatial grids [35,36], which yielded 60,851 grids of the same size, and each grid was regarded as the smallest research unit for data processing. The coupling coordinated development index was calculated with SPSS software (V21.0) and the ArcGIS (V10.2) field calculator tool, and the data were visualized in ArcGIS (V10.2).
2.2. Data Sources
The data used in this study included administrative boundaries at all levels, water data, POI data, population grids, aging population data and other multisource data, and their sources and definitions are shown in Table 1. Both POI and population grid data have high accuracy, which is beneficial to accurately evaluate the coupling and coordination relationship between public service facilities and population. Because the original data of the population grid are a grid with a precision of 500 × 500 m, ArcGIS’s spatial connection tool is used to connect the grid to the population grid with a precision of 1000 × 1000 m to calculate the population in the unified research unit.

Table 1.
Types and sources of the data.
The period 2016–2022 was critical for China’s land finance transformation [37], and the allocation of public service facilities gradually shifted from a market model of real estate development to a “people-oriented” planning concept. Therefore, studying public service facilities during this period is very representative.
2.3. Research Methods
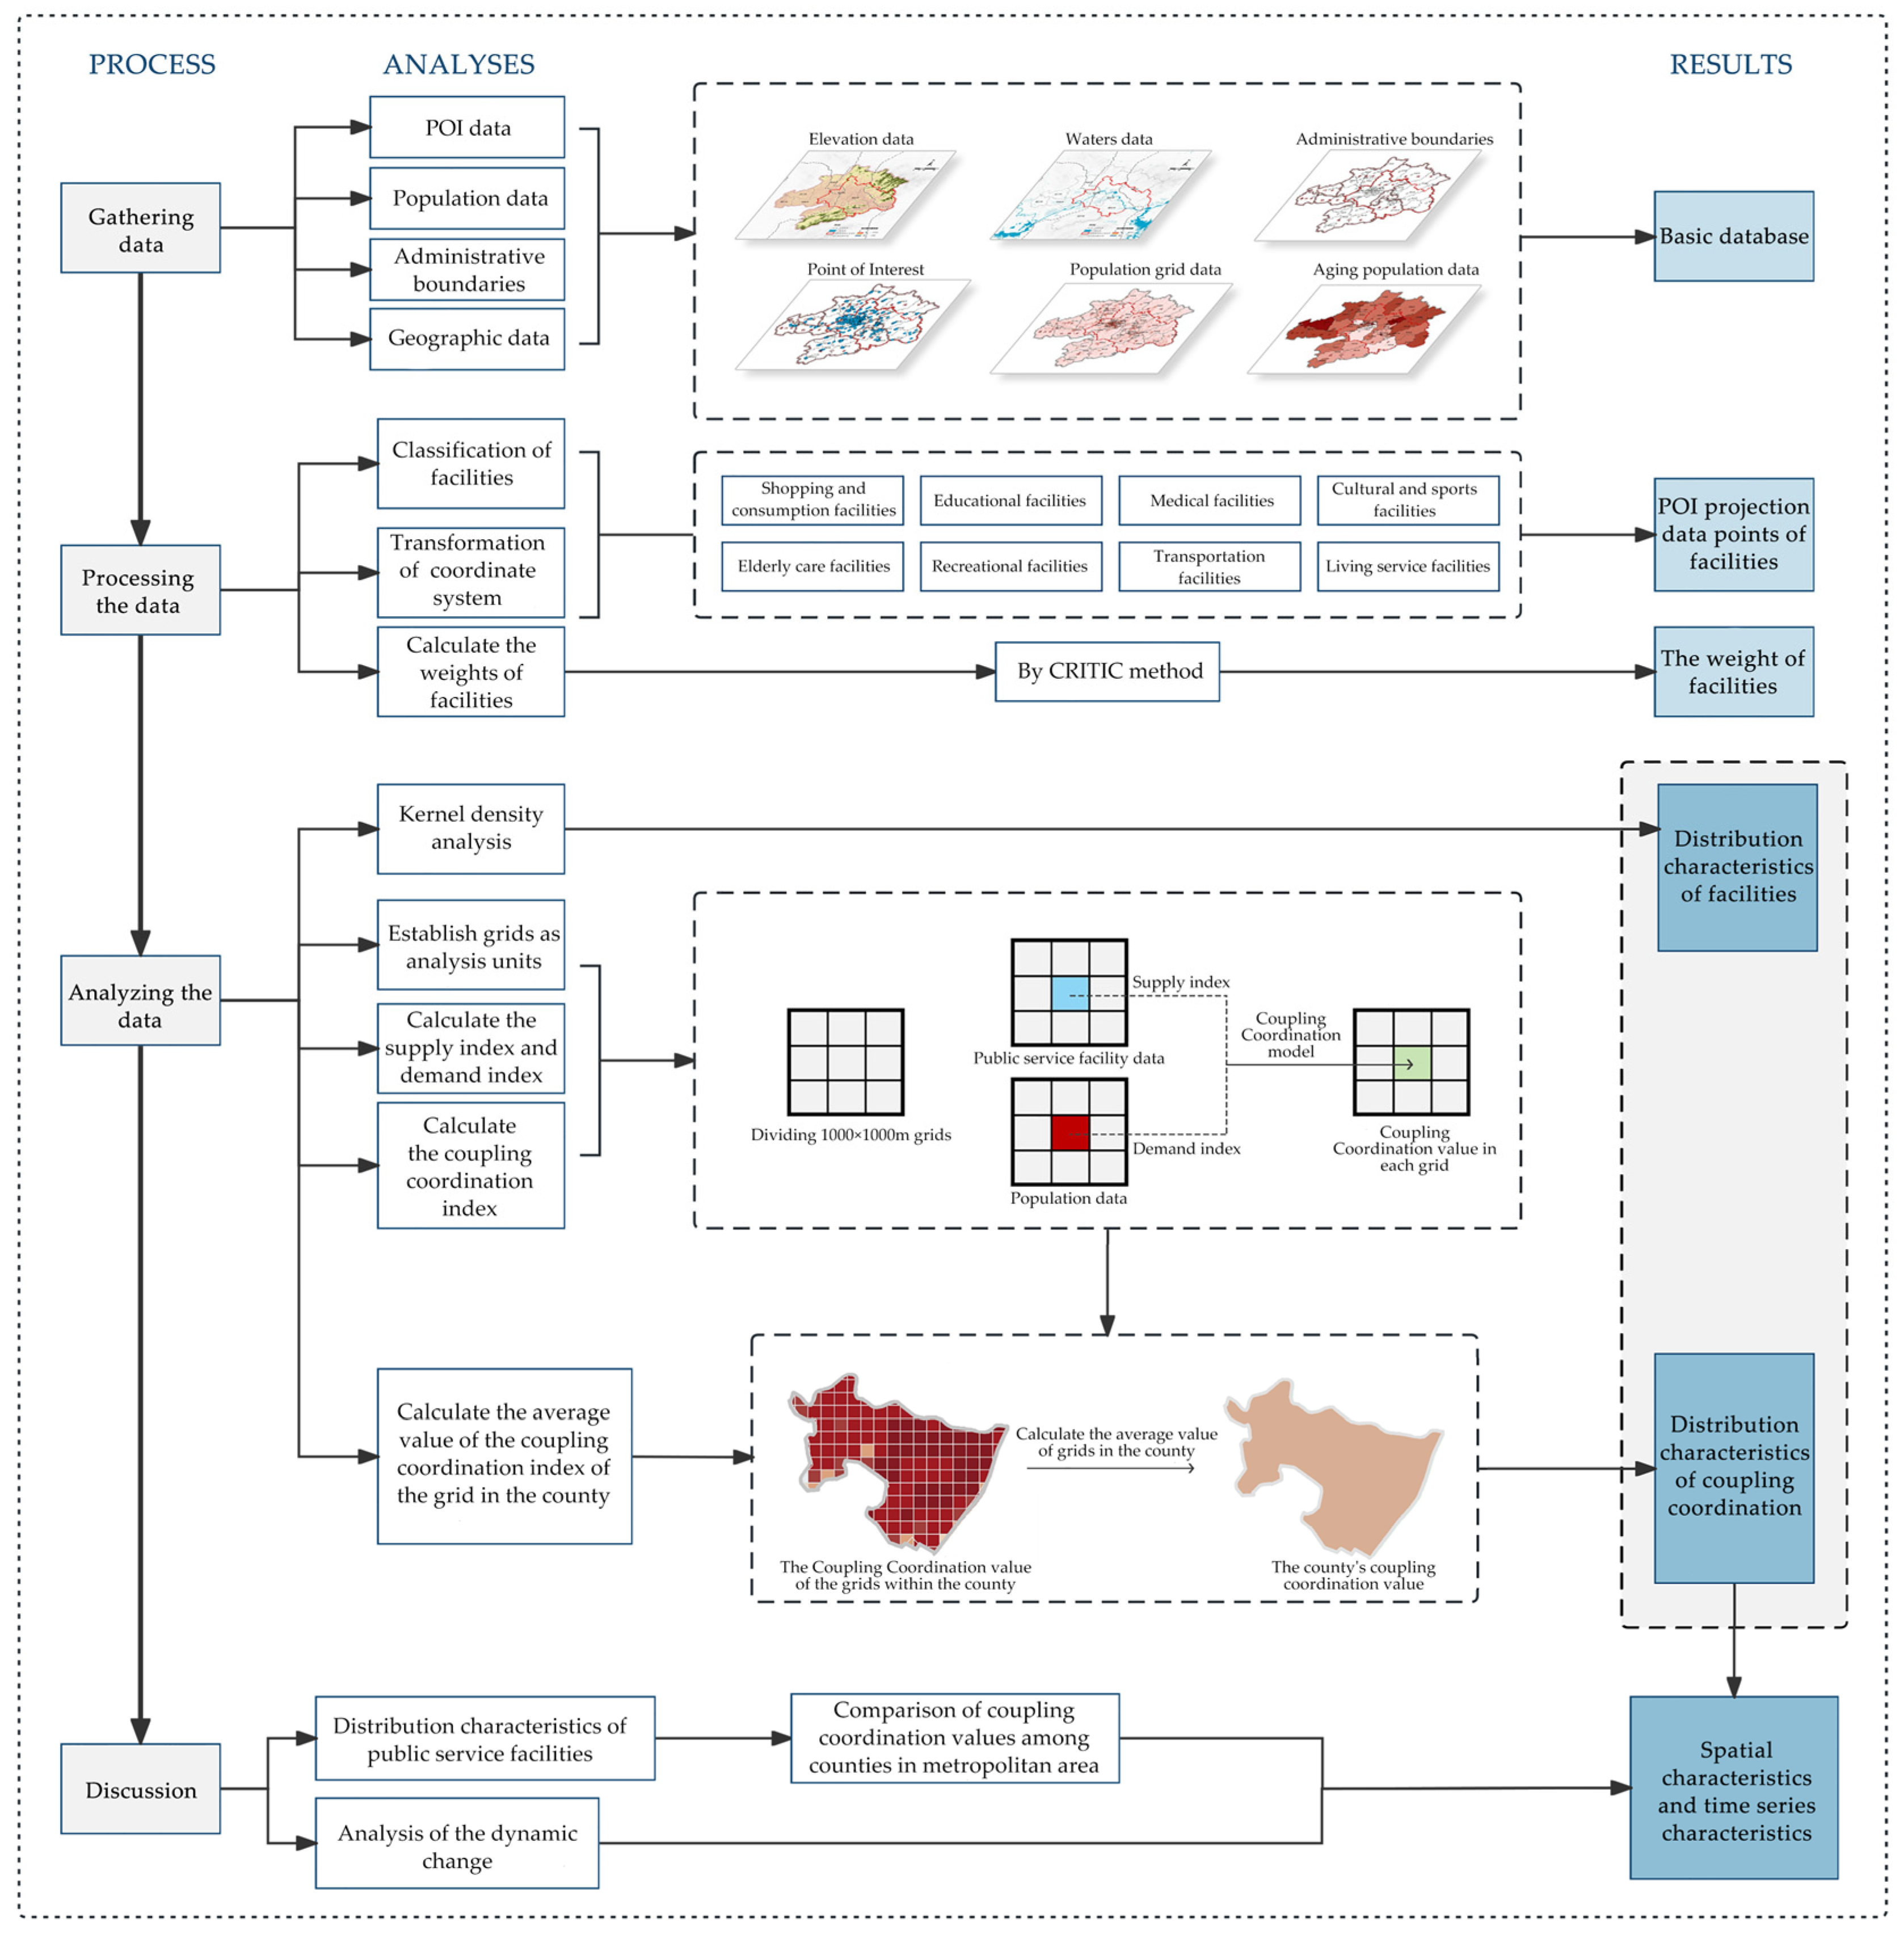
Previous research has shown that POI data and population grid data can be used to accurately analyze the distribution of public service facilities and their correspondence with the population [14,15,38]. Therefore, this study introduces the coupling coordination model to calculate the coupling coordination relationships between facilities and populations to evaluate the resource allocation of facilities in a metropolitan area. Based on multisource data, this paper evaluated the spatial configuration of public service facilities in the WMA (Figure 2). The spatial distribution characteristics of the facilities were obtained via kernel density analysis of the POI data in ArcGIS (V10.2). Based on the coupling coordination model, this study chose the supply index and the demand index to quantify the public service facilities and population [39,40,41]. These two indices include the weighted results of high-precision public service facilities POI and population grid data. Then, the coupling coordination value was calculated according to the model formula. The coupling coordination value was divided into 10 intervals, corresponding to different coupling coordination states. Therefore, the coupling coordination relationship between public service facilities and population can be characterized.
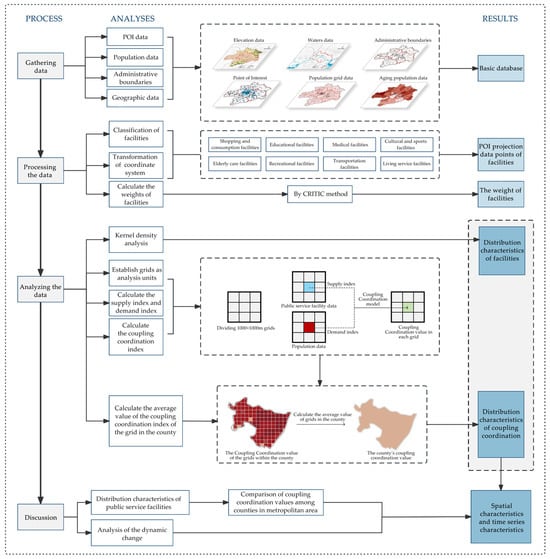
Figure 2.
Technical flowchart.
2.3.1. Kernel Density Analysis
Kernel density analysis is mainly used to calculate the density of elements in a surrounding neighborhood, and it can reflect spatial distribution characteristics well. In this paper, the kernel density analysis tool in ArcGIS’s spatial analysis was used to visualize the feature distribution of public service facilities, and the kernel density analysis values were divided into 10 categories by the geometric interval method to achieve the best visualization effect.
2.3.2. Objective Weighting Method
The CRITIC method was developed by Diakoulaki [42]. It is an objective weighting method that is based on the information contained in the data. Compared with other weighting methods, this method is more suitable for situations of multiple indicators and more overlapping information between them [43]. With the use of multisource big data in this paper, this method can empower all elements more objectively and pertinently. The core idea of the CRITIC method is to take contrast intensity and conflict as the quantitative standards of information. The greater the contrast intensity and conflict are, the greater the corresponding weight. According to related research [38,44,45], the contrast intensity is determined by the standard deviation, and the conflict index is determined by the linear correlation coefficient. In this study, eight types of public service facilities are divided into eight indicators, and the number of public service facilities in each research unit is calculated. The weight is calculated according to the following steps.
Step 1: Standardization:
In the formula, is the normalized value of the j-th facility in the i-th grid, and is the original value of the j-th facility in the i-th grid.
Step 2: Calculate the contrast strength:
where represents the standard deviation of the j-th index, represents the average value of the j-th index, and n represents the number of grids.
Step 3: Calculate the conflict. According to the relevant literature [46], the Pearson correlation coefficient should be used as the linear correlation coefficient in the conflict index:
where i represents a specific grid and p and q represent two types of the facilities. represents the covariance of the pixel values of the p layer and q layer. and are the pixel values of layers p and q, respectively, in the i-th grid. and are the average values of the pixels representing the p layer and q layer, respectively. is the correlation coefficient representing the p layer and the q layer. and are the standard deviations representing the p layer and the q layer, respectively, which can be calculated by Formula (2). indicates the conflict coefficient of the j-th indicator.
Step 4: Calculate the final weight:
where represents the weight of the j-th indicator index, which indicates the weight of different kinds of public service facilities.
By applying for the web service key of the Gaode open platform, POI data from the WMA in 2016–2018, 2018–2020, and 2020–2022 were obtained, and the geographic coordinate system used was GCS 1984.
The original POI data included information on catering services, road ancillary facilities, transportation facilities, scenic spots, municipal facilities, science, education and culture services, financial and insurance services, shopping services, life services, sports and leisure services, medical and health services, and other categories. Because the classification of the original data collected overlaps, to better meet the needs of this research, after referring to the content and classification of public service facilities in the relevant literature [17,47,48,49], this paper reclassifies the original data and obtains the classification indicators shown in Table 2.
Table 2.
Classification of public service facilities.
For elderly care facilities, we should match the supply and demand of the older population. Because it is difficult to obtain data on the elderly population under the accuracy of the grid, we collected data from the population census published by the National Bureau of Statistics of China [50] for the aging data of all districts and counties within the metropolitan area. The number of elderly individuals in the range of 1000 × 1000 m is simulated by the product of the aging rate and the population in the grid, and the specific calculation method is shown in Formula (7):
where p is the elderly population, P is the total population, and r is the aging rate, which is the ratio of the elderly population over 60 to the total population.
2.3.3. Supply Index and Demand Index
According to the literature on the coupling coordination model [39,40,41], the evaluation indices of the supply layer and demand layer are calculated to prepare for the next analysis of the coupling coordination relationships:
where is the evaluation index of the supply layer and is the evaluation index of the demand layer. and are the values after standardization of the public service facility density and population density, respectively. m and m′ are the index numbers of the supply layer and the demand layer, respectively. and are the weights of the supply layer and the demand layer, respectively. Because the demand layer in this paper is a single factor of population, it is taken that = 1.
2.3.4. Coupling Coordination Model
For the evaluation of the relationship between supply and demand, the traditional method usually uses the per capita public service facilities index, which is the number of facilities in the research unit divided by the population as the evaluation standard [28]. However, there are two disadvantages to this method. First, the per capita indices of different facilities vary from city to city, so it is difficult to evaluate them with a unified standard. At the same time, the evaluation results are often less comparable because of different indicators in various cities. Second, the formula is strongly influenced by the dataset itself. Too much data in either the numerator or denominator will lead to per capita index results that are too large or too small, which will affect the balance of the overall results, and there may be too many extreme scatter points in classification visualization. After searching the relevant literature on the relationship between supply and demand, we decided to introduce the coupling coordination theory to evaluate and analyze the matching relationship between supply and demand, which is the degree of synergy between the spatial distribution of public service facilities and the population. This method can solve the problem of differences in facility allocation indicators among cities, and the results are more comparable.
In the research unit, whether supply and demand are balanced can be judged by comparing the numerical values of the supply layer and demand layer; however, the specific degree of cooperation between supply and demand cannot be judged. However, the coupling coordination relationship model can reflect the coordination relationship between supply and demand. Referring to the related literature [39,40,41,51,52], in this study, the coupling and coordinated development index D is introduced to comprehensively evaluate the coupling and coordinated development of public service facilities. The relevant formulas are as follows:
where C is the coupling degree and T is the comprehensive coordination index. α and β are undetermined coefficients, and α + β = 1. This paper holds that supply and demand are equally important, so α = β = 0.5. D is the coupling and coordinated development index, which is the final evaluation standard of the matching relationship between public service facilities and the population.
2.3.5. Division of the Coupling Coordination Grade
Using SPSS tools, the shopping and consumption facilities, educational facilities, medical facilities, cultural and sports facilities, elderly care facilities, recreational facilities, transportation facilities, and living service facilities in each unit grid of the WMA are weighted, and the coupling coordinated development index D of each grid is calculated using the coupling coordination model. By referring to relevant research [8,20,53,54], we use the geometric margin method to demarcate the coupling coordination level of the standardized data and divide the results into 10 types of coupling coordination degrees (as shown in Table 3).
Table 3.
Coupling coordination grading standard.
3. Results
3.1. Distribution Characteristics of Public Facilities in the Wuhan Metropolitan Area
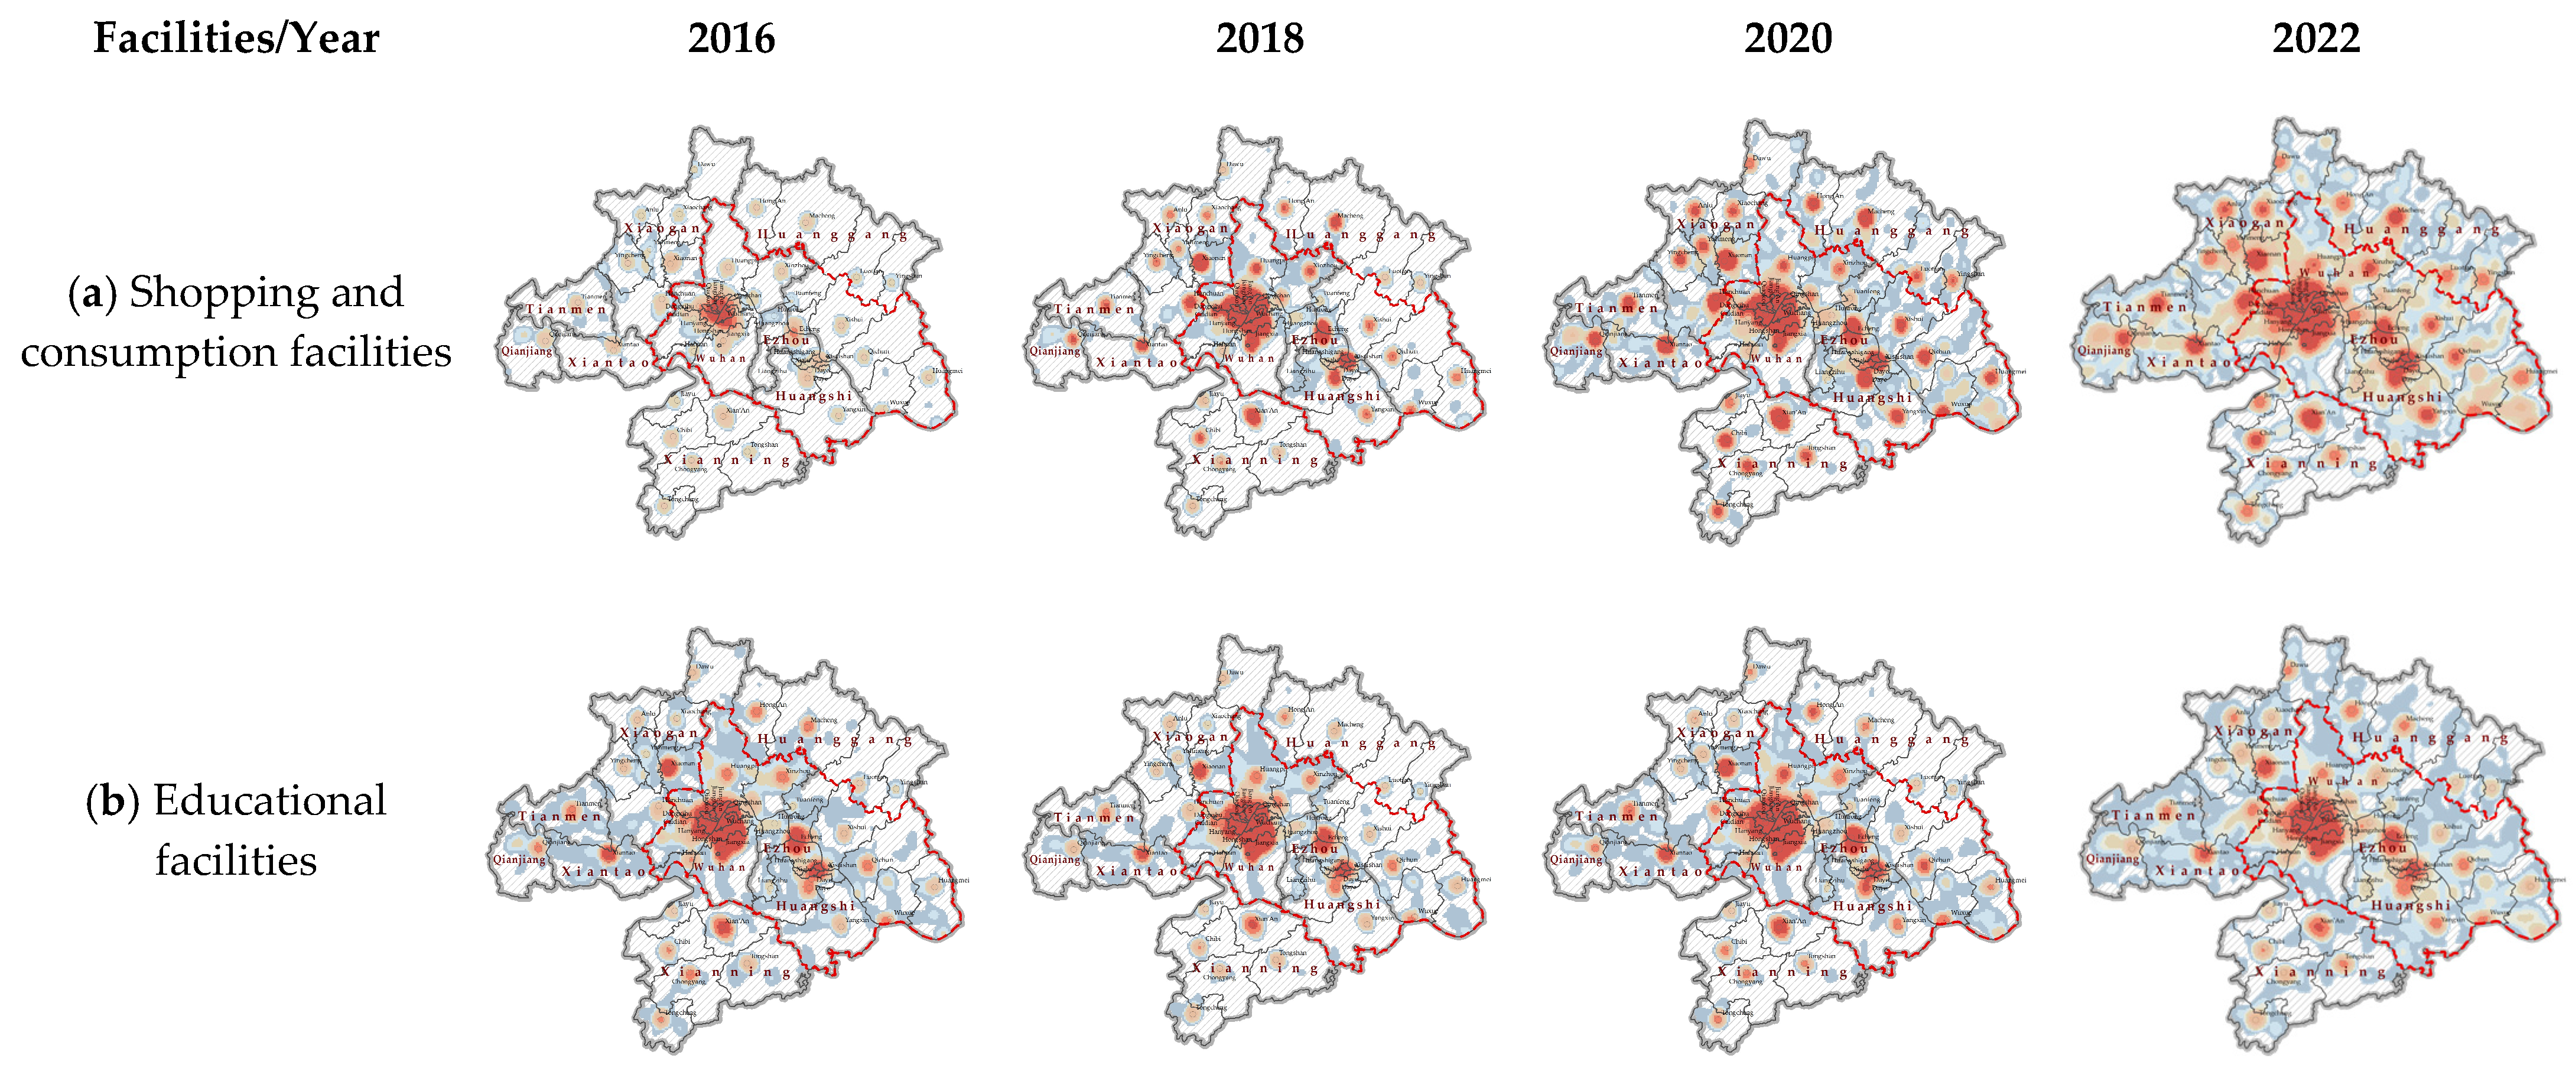
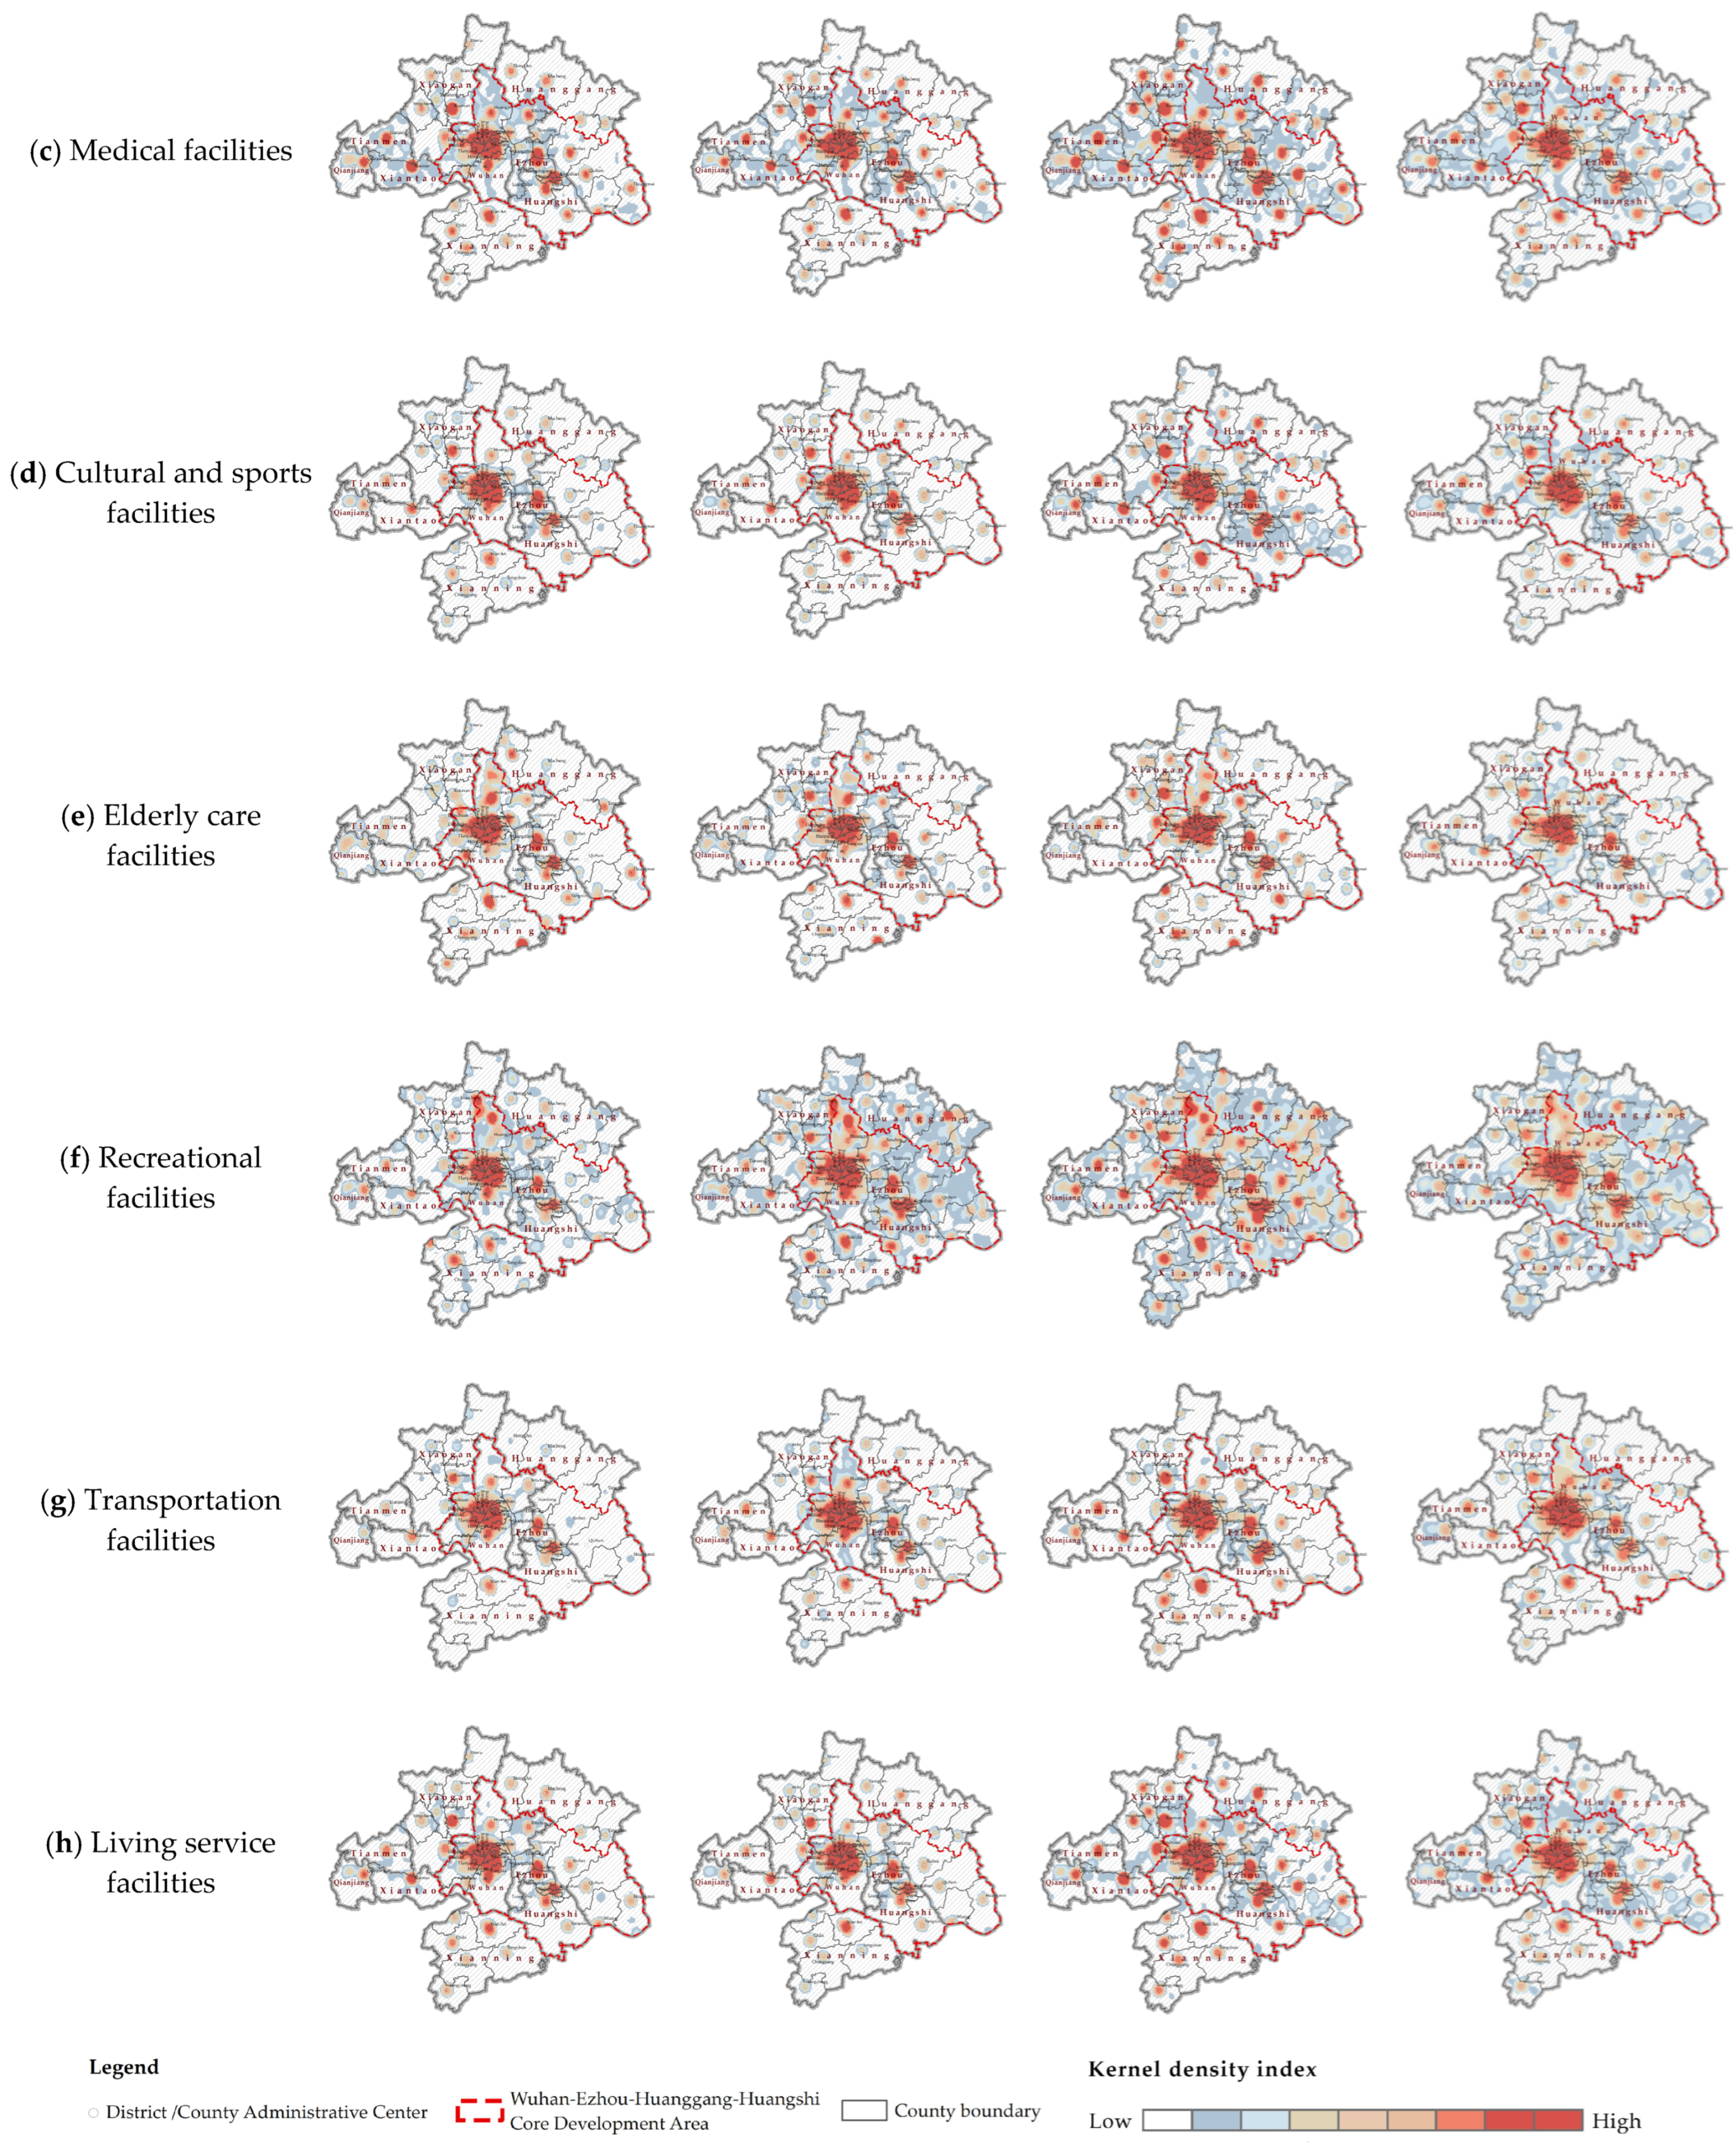
The kernel density of shopping and consumption facilities, educational facilities, medical facilities, cultural and sports facilities, elderly care facilities, recreational facilities, transportation facilities, and living service facilities in the WMA are analyzed, and the visual distribution characteristics of the POI facilities are obtained. Figure 3 illustrates a distinct clustering of public service facilities across all counties, predominantly grouped together. From the perspective of time series development, the distribution of shopping and consumption facilities and educational facilities is more uniform from 2016 to 2022.
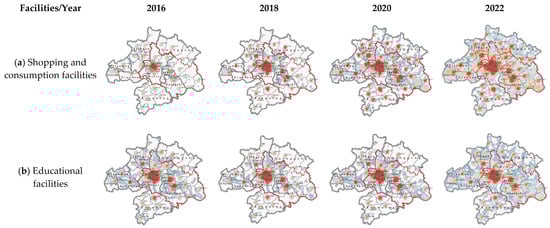
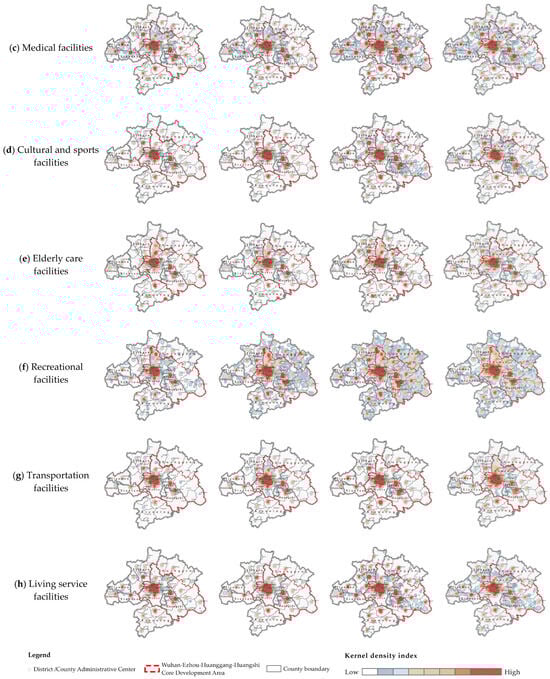
Figure 3.
Kernel density index of public service facilities in the Wuhan Metropolitan Area.
Within the metropolitan area in 2022, facilities for shopping, education, and recreation are distributed uniformly. In contrast, cultural, sports, elderly care, and transportation facilities exhibited more independent distributions, with elderly care facilities being particularly concentrated in Wuhan. The distribution of public service facilities in Xianning City is relatively independent, and there are few connections between them. Except for Xian’an District, the other counties have weak connections with other prefecture-level cities. In the Wu-E-Huang-Huang core development area, Wuhan’s public service facilities are closely connected to those of Ezhou and Huangshi, but weakly connected to those of Huanggang (Figure 3).
3.2. Analysis of the Coupling Coordination Relationships of Public Facilities in the Wuhan Metropolitan Area
3.2.1. Coupling Coordination Relationships at the County Level
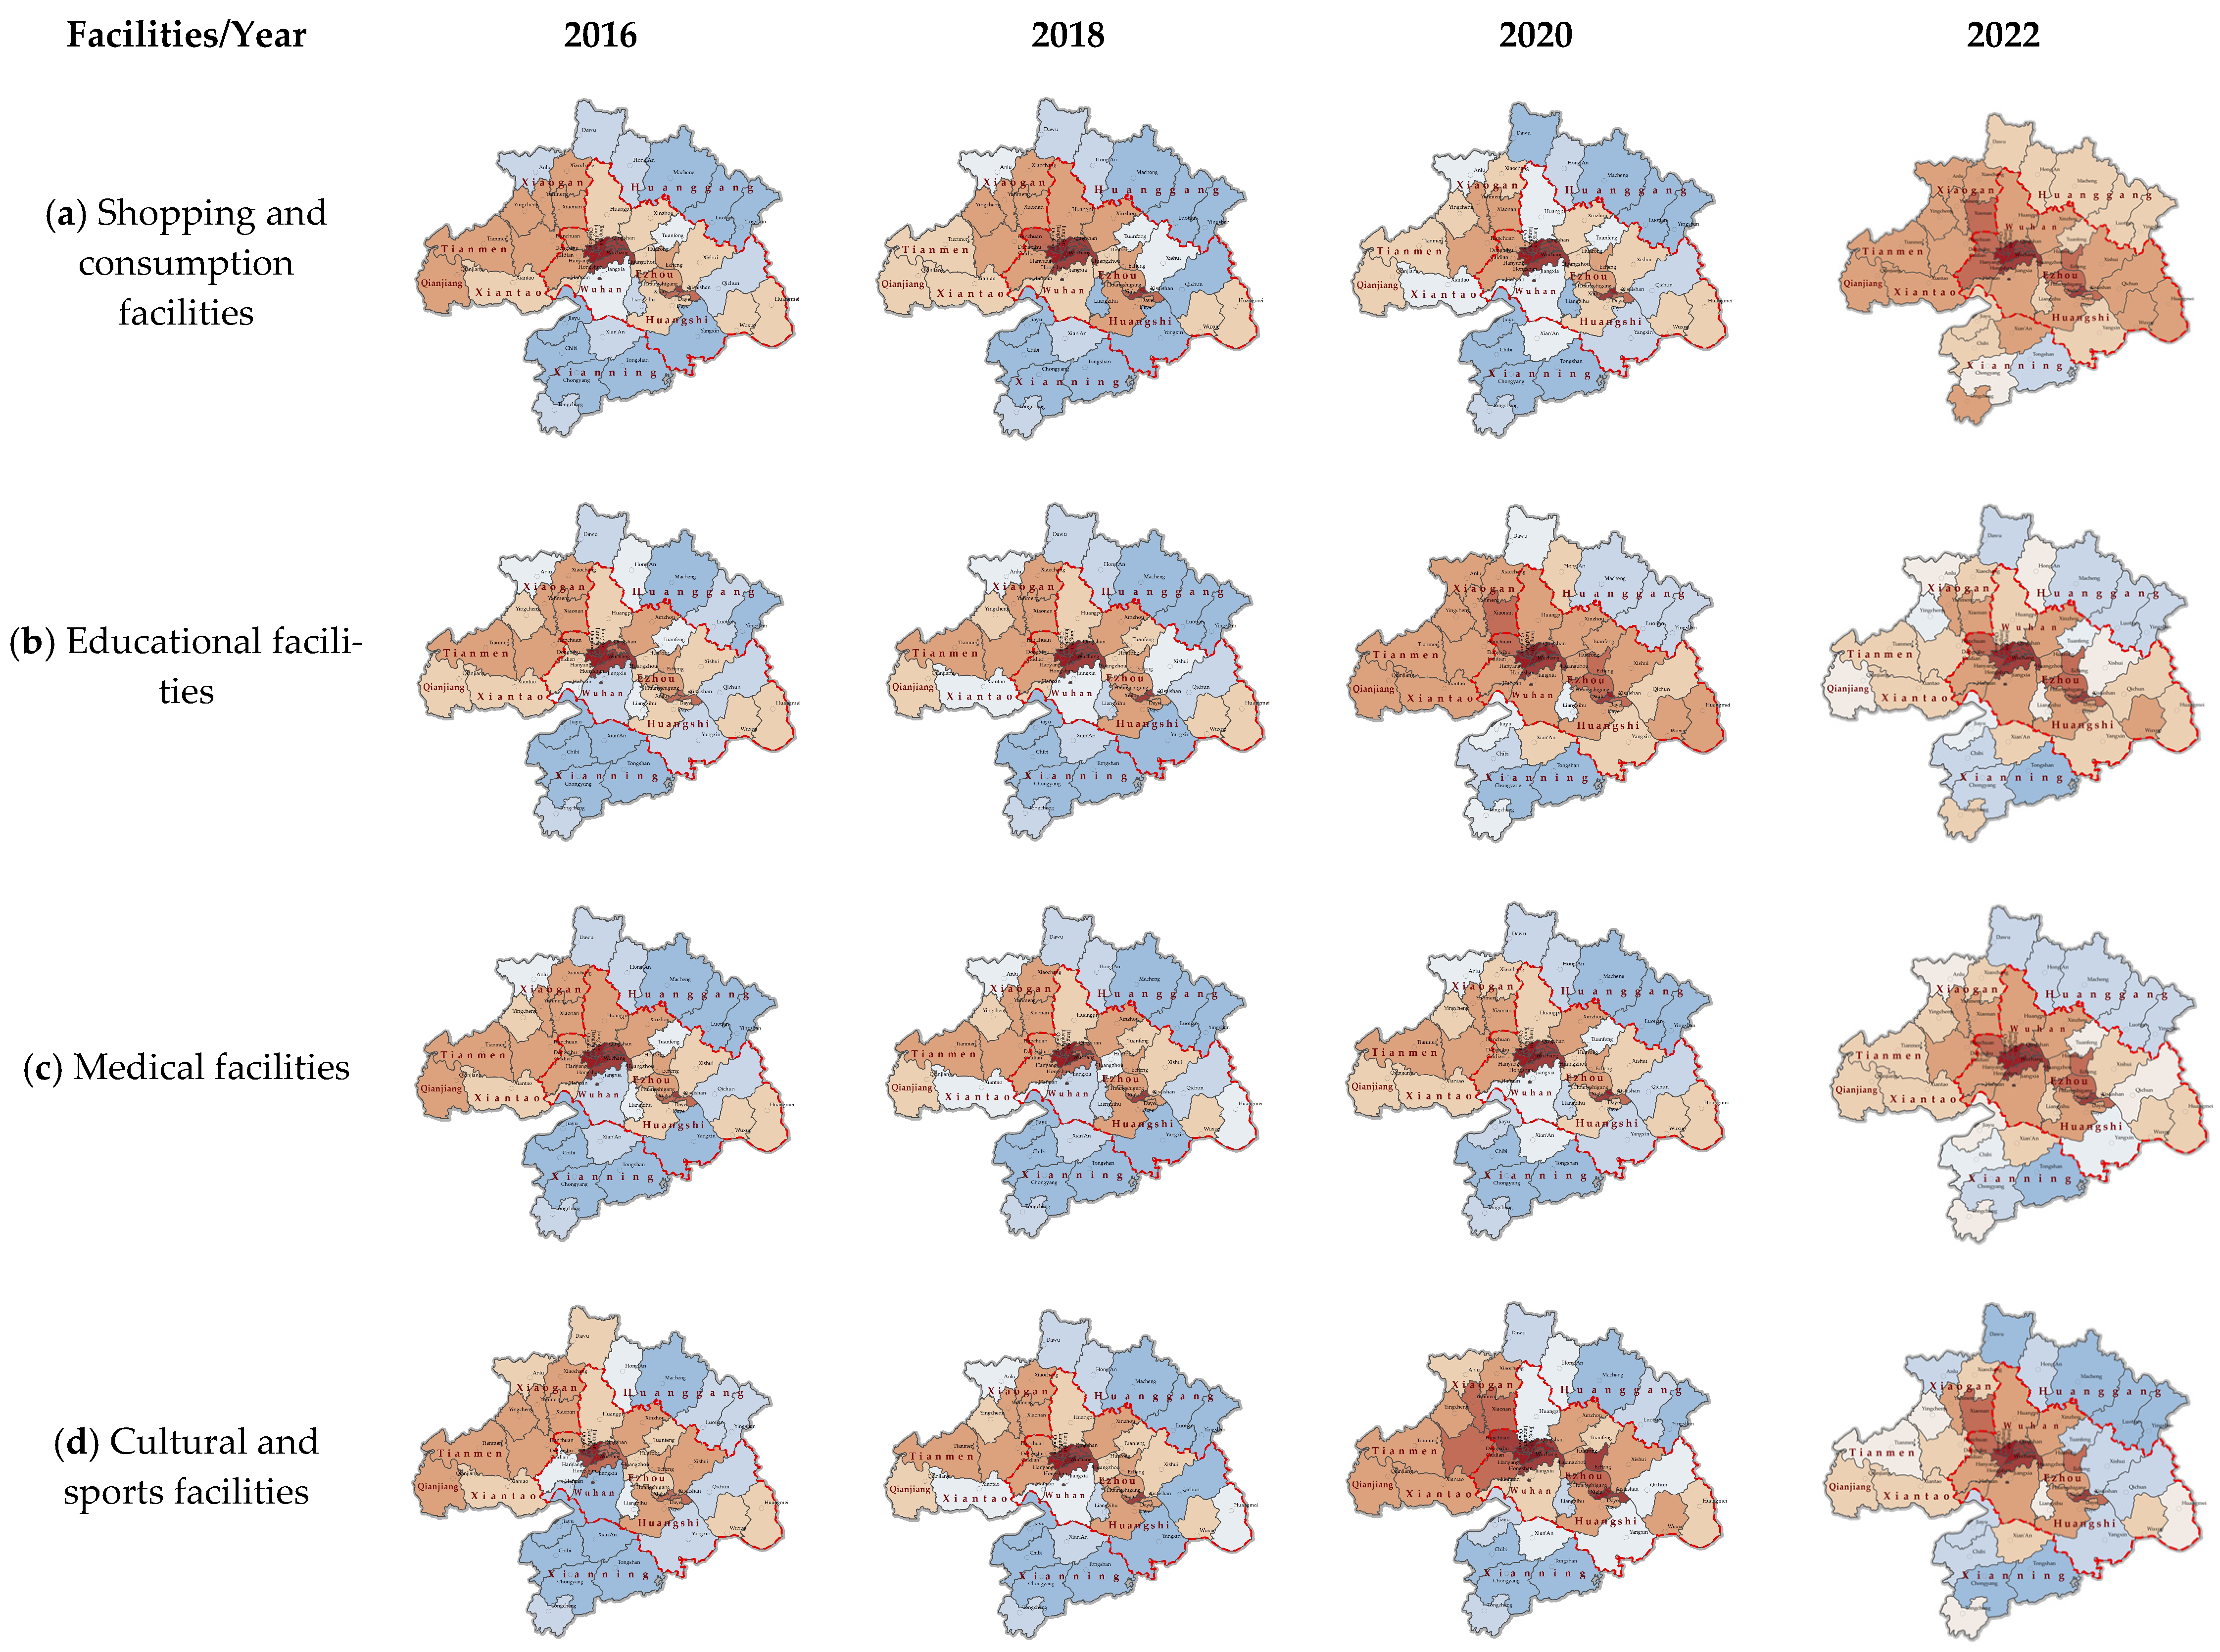
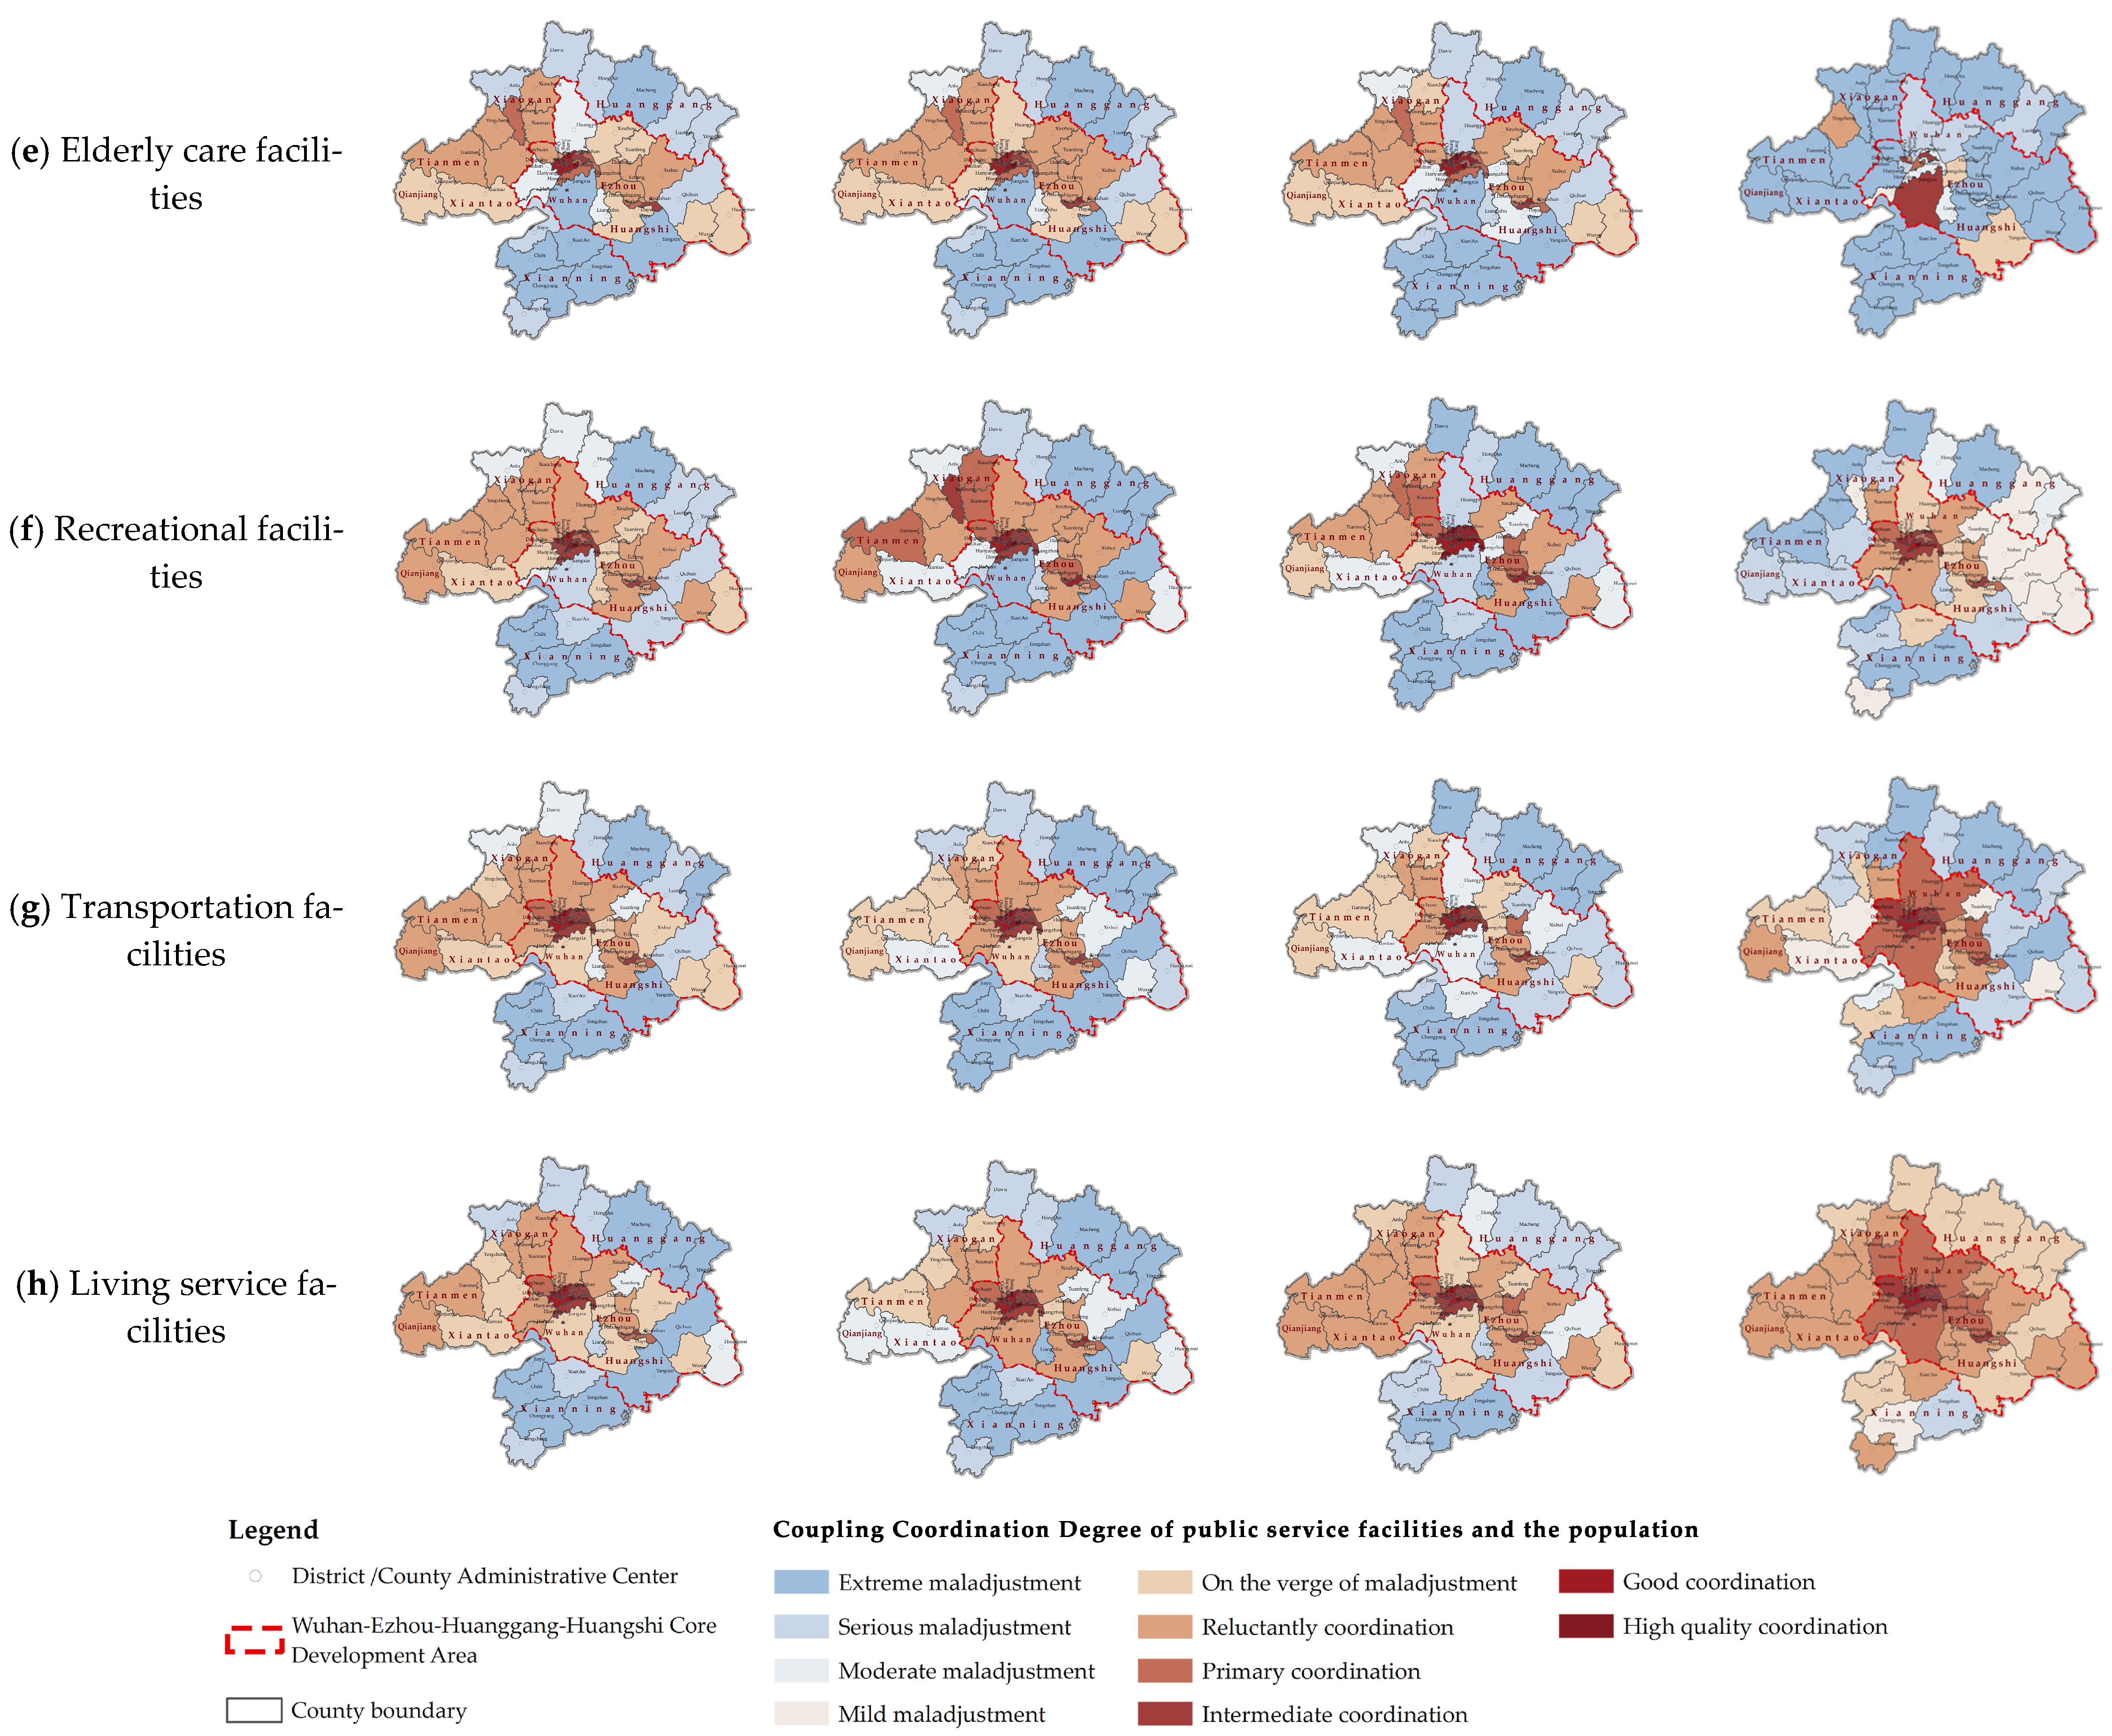
To study the coupling coordination relationships of facilities in different counties and cities in the metropolitan area and the differences in spatial allocation in counties, we calculate the coupling coordination indices of all the grids in the counties and cities and obtain the coupling coordination situations of the facilities in these counties. As shown in Figure 4, shopping consumption facilities and living service facilities are highly coordinated in most counties and cities by 2022. However, the coupling coordination degree of elderly care facilities is decreasing and is in a state of serious or extreme maladjustment by 2022, except for some counties and cities. Notably, although the distribution of educational facilities and recreational facilities is relatively uniform in terms of kernel density analysis, there is still an imbalance in terms of coupling coordination.
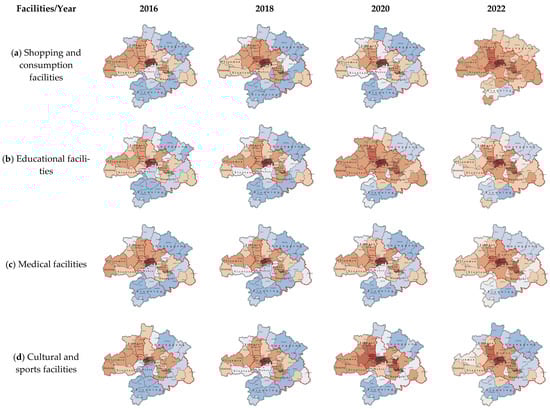

Figure 4.
Coupling coordination degree of various public service facilities in each county.
Regarding spatial differences, most public service facilities in the northern part of Huanggang City and the southern part of Xianning City exhibit reluctant coordination or less, where the mismatch of public service resources is obvious compared with that of other counties and cities in the metropolitan area. Notably, educational facilities and medical facilities are obviously distributed in a highly coordinated and continuous way on the east-west axis of the metropolitan area, with Wuhan as the central city. However, recreational facilities, transportation facilities, and cultural and sports facilities have not fully established such an east-west axis relationship.
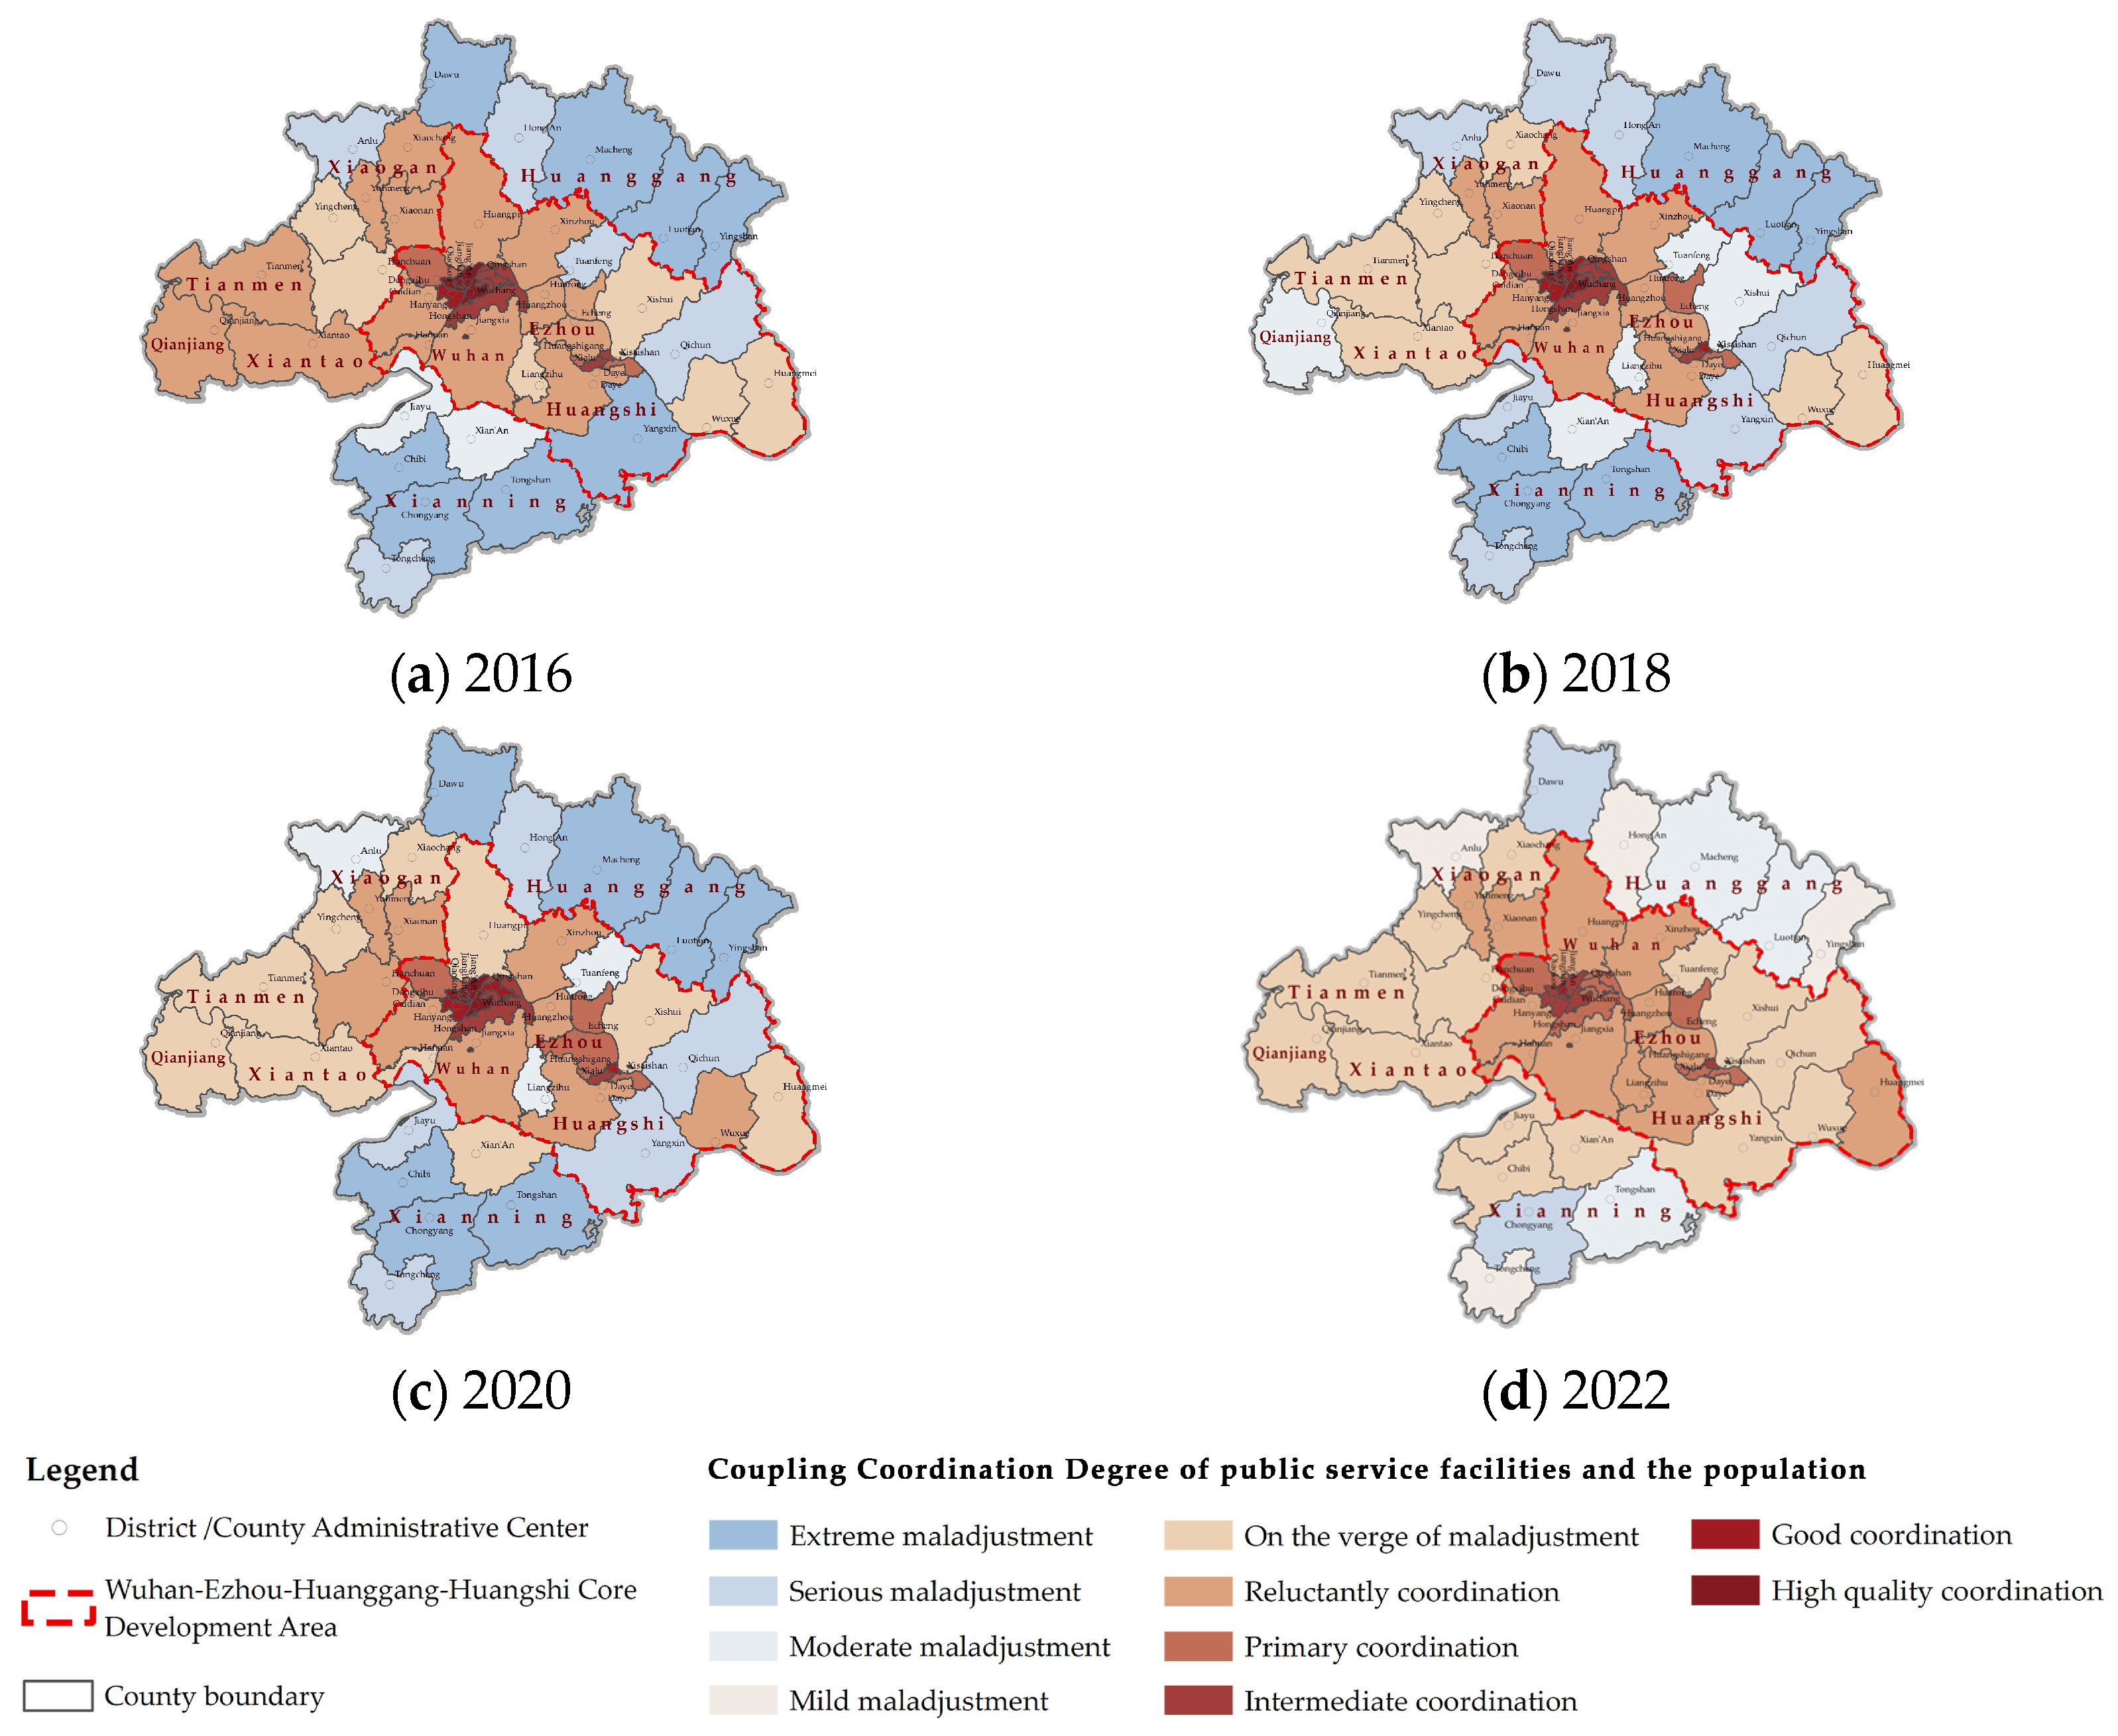
According to the distribution map of the comprehensive coupling coordination degree of public service facilities in various counties and cities (as shown in Figure 5), the distribution of public service resources in the WMA is generally centered on Wuhan, where there is an obvious radiation effect. A continuous high-level coordinated distribution gradually develops on the east-west axis. In addition, there are problems such as the weak coupling coordination of public service resources and a mismatch between supply and demand in the north and south.
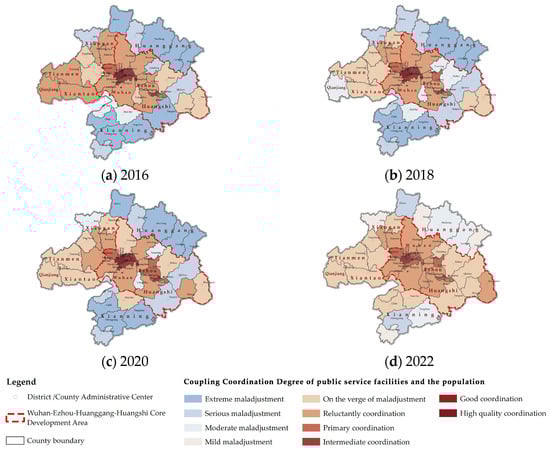
Figure 5.
Comprehensive coupling coordination degree of public service facilities in each county.
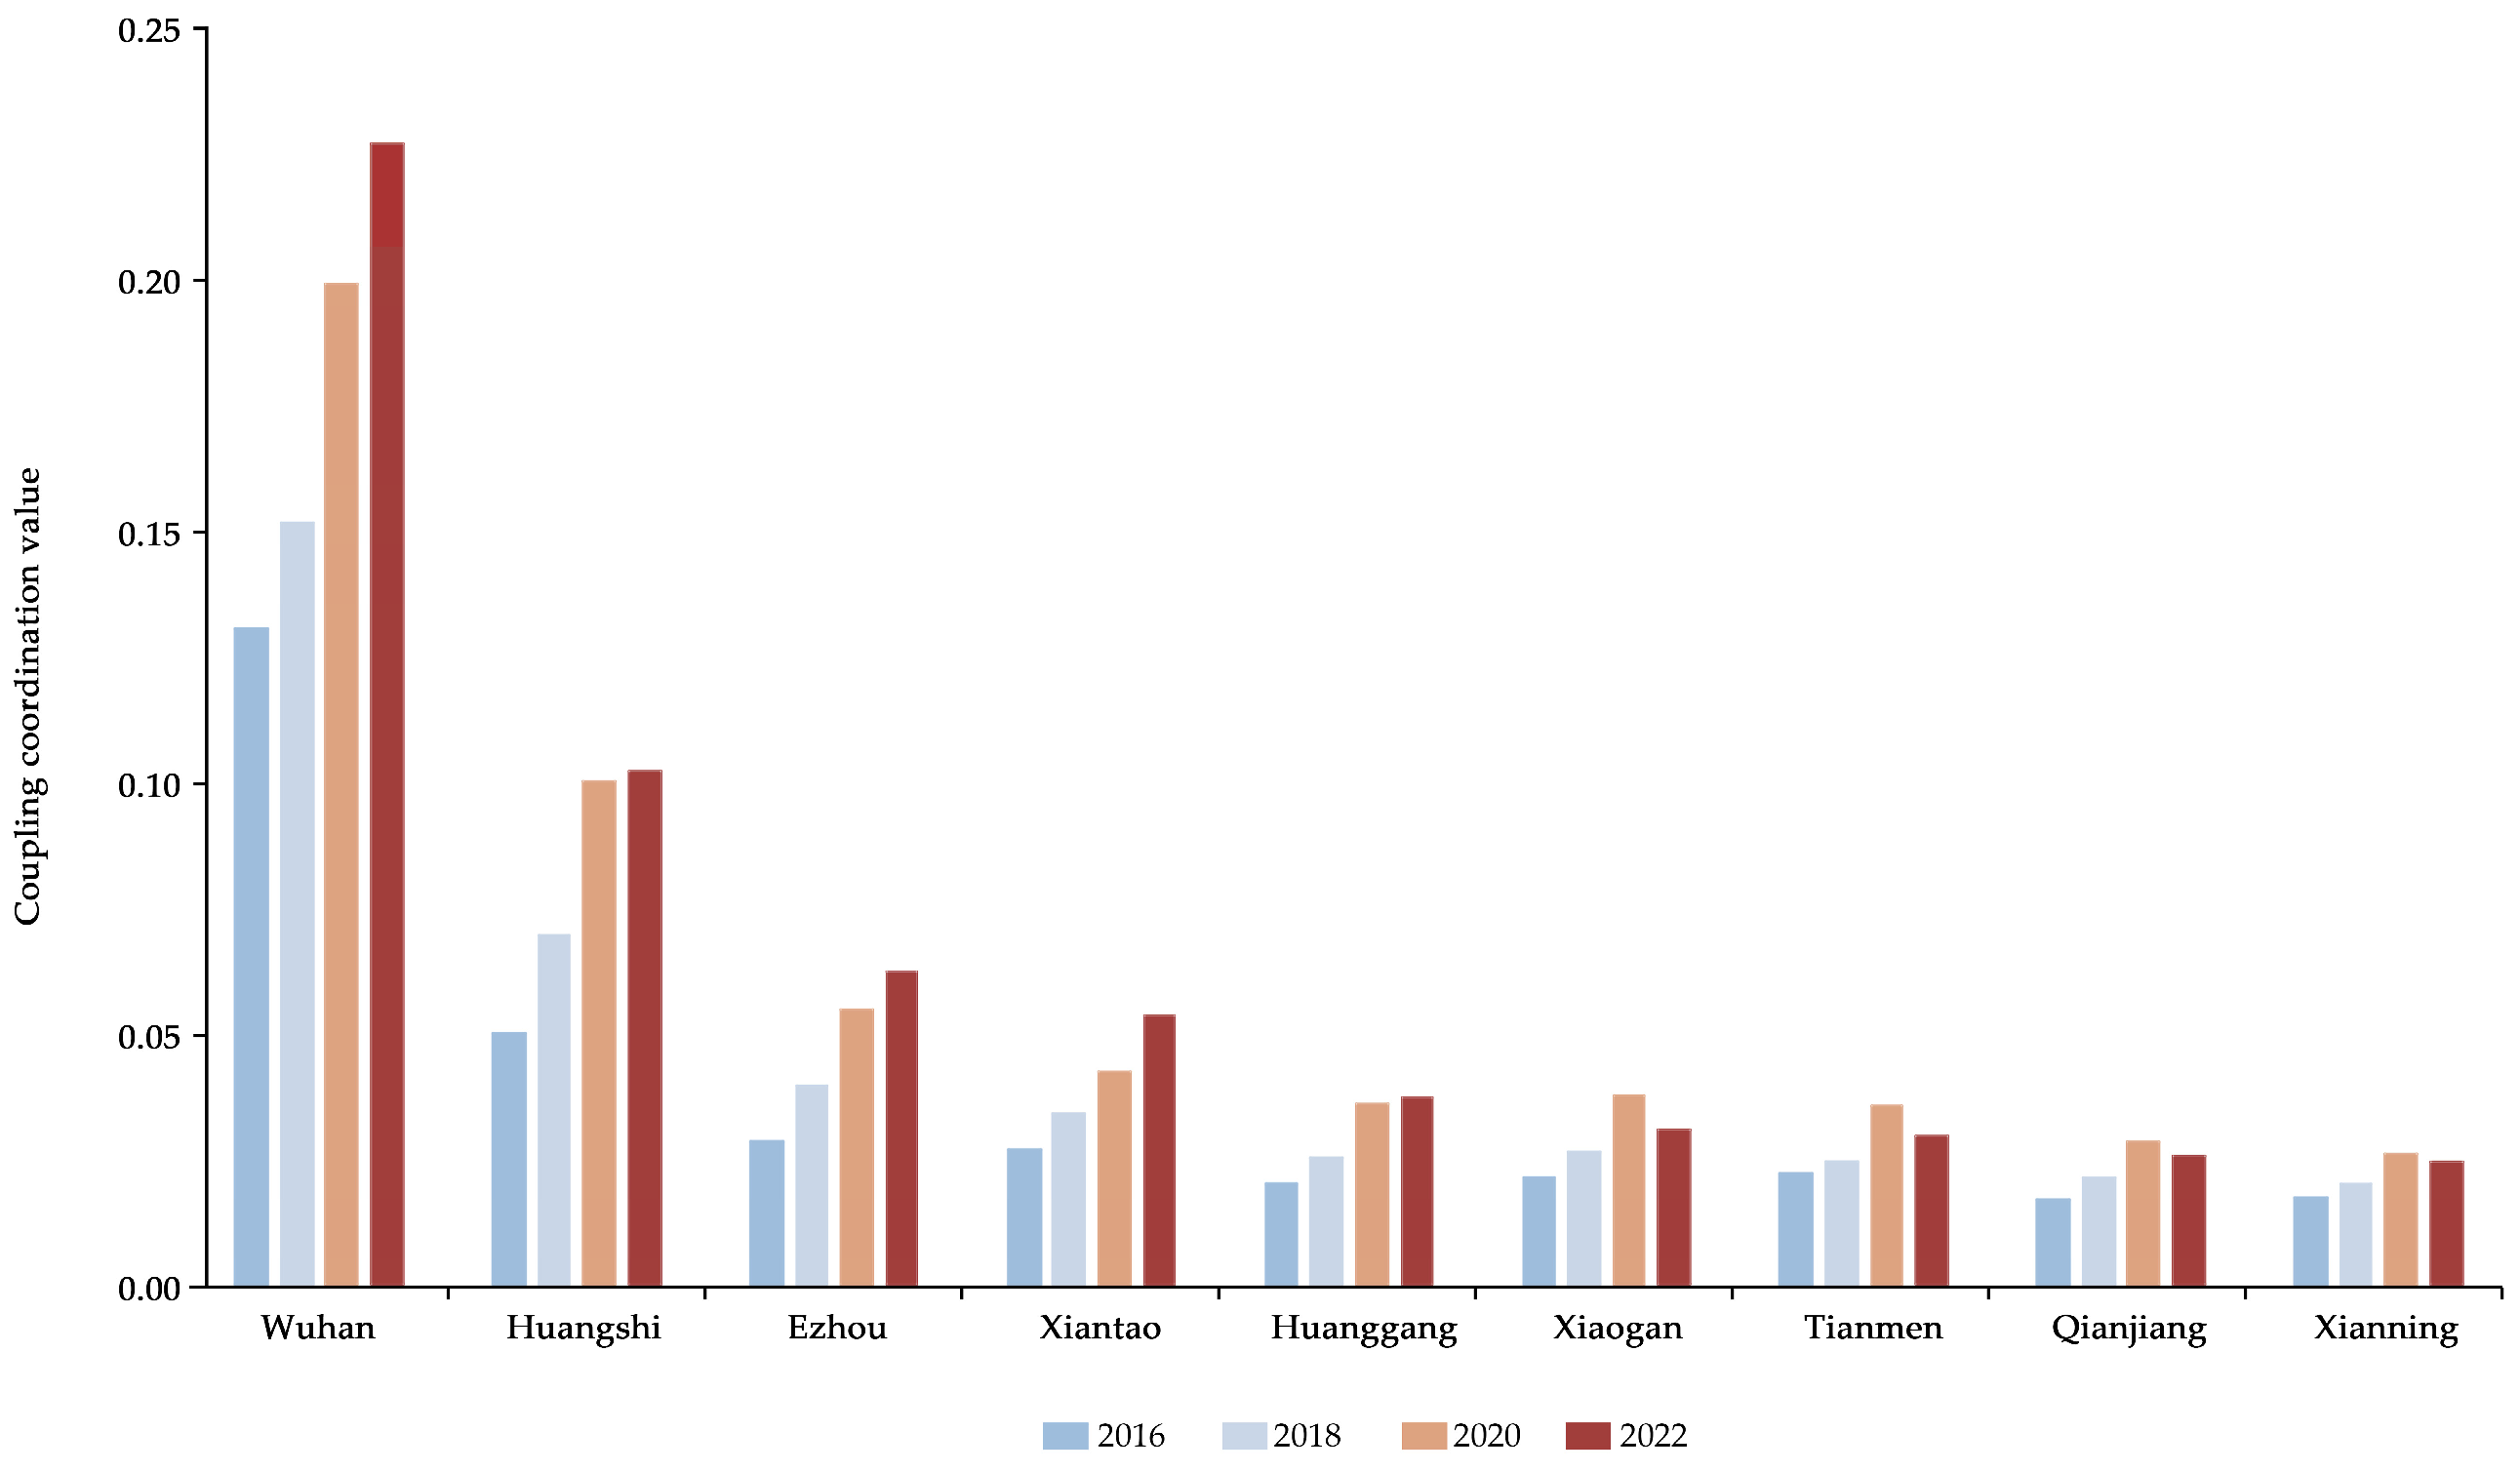
As shown in Figure 6, the intercity distribution characteristics of the public services in the WMA gradually increase, with Wuhan as the central city and Ezhou and Huangshi as the subcentral cities.
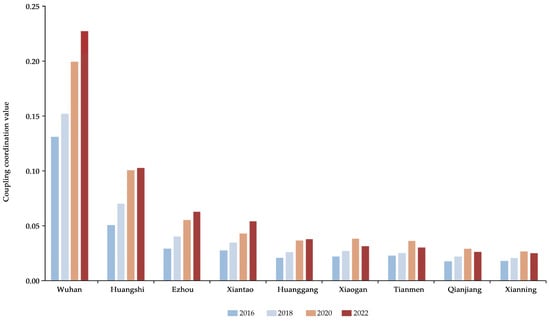
Figure 6.
Histogram of the coupling coordination values of cities over four years.
3.2.2. Coupling Coordination Relationship at the Grid Level
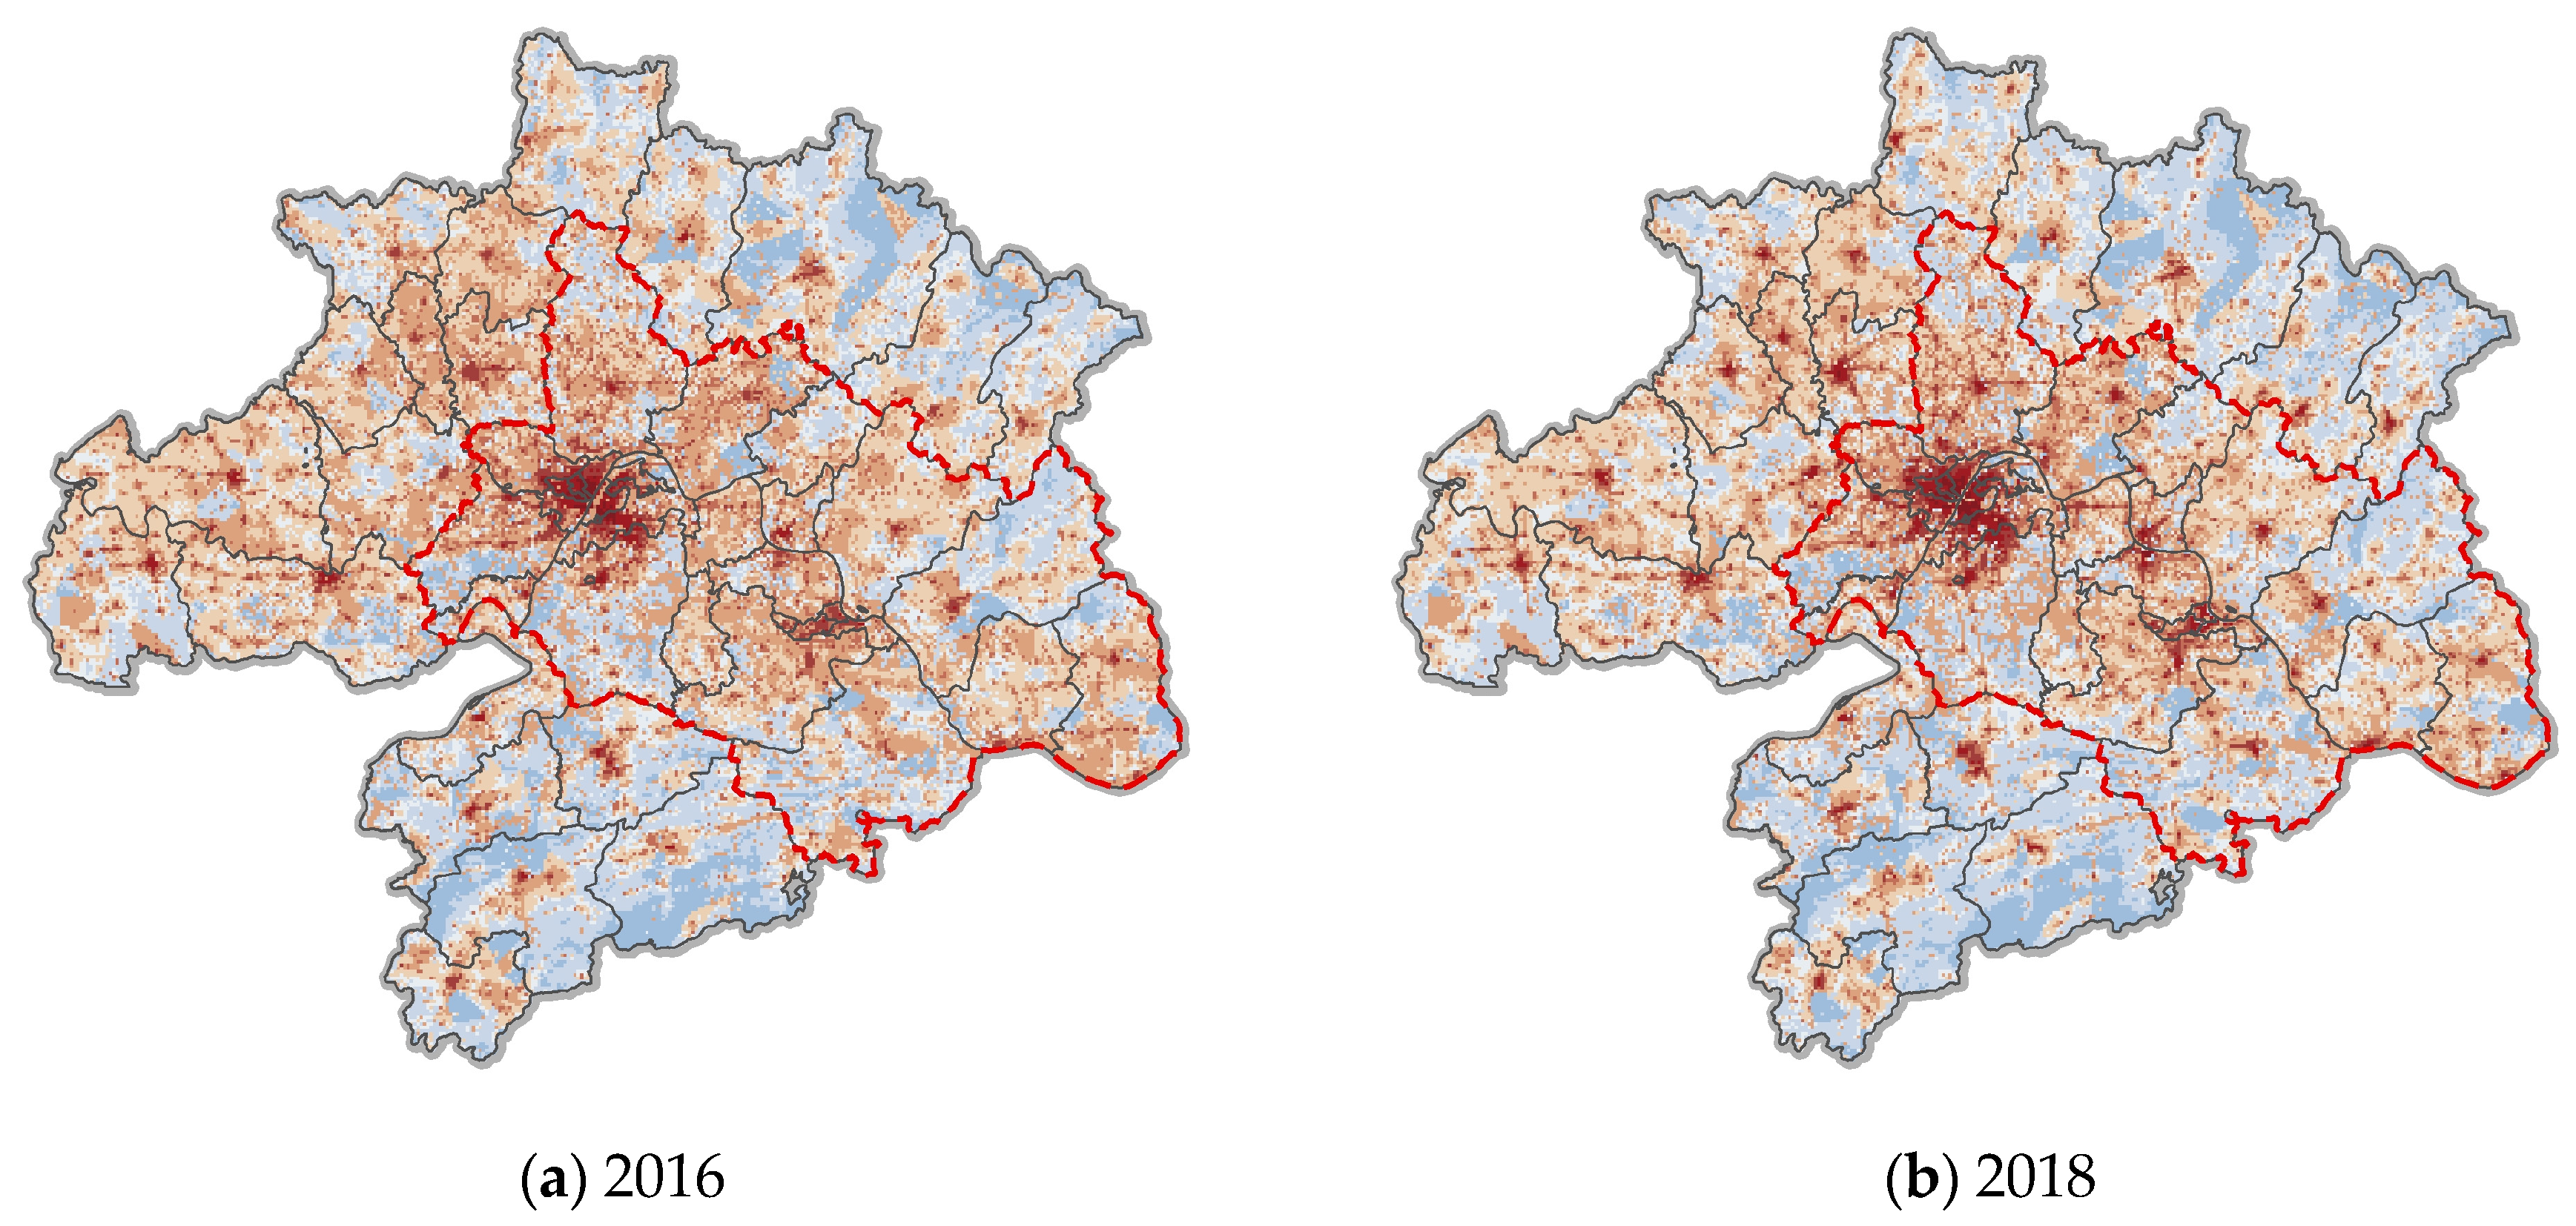
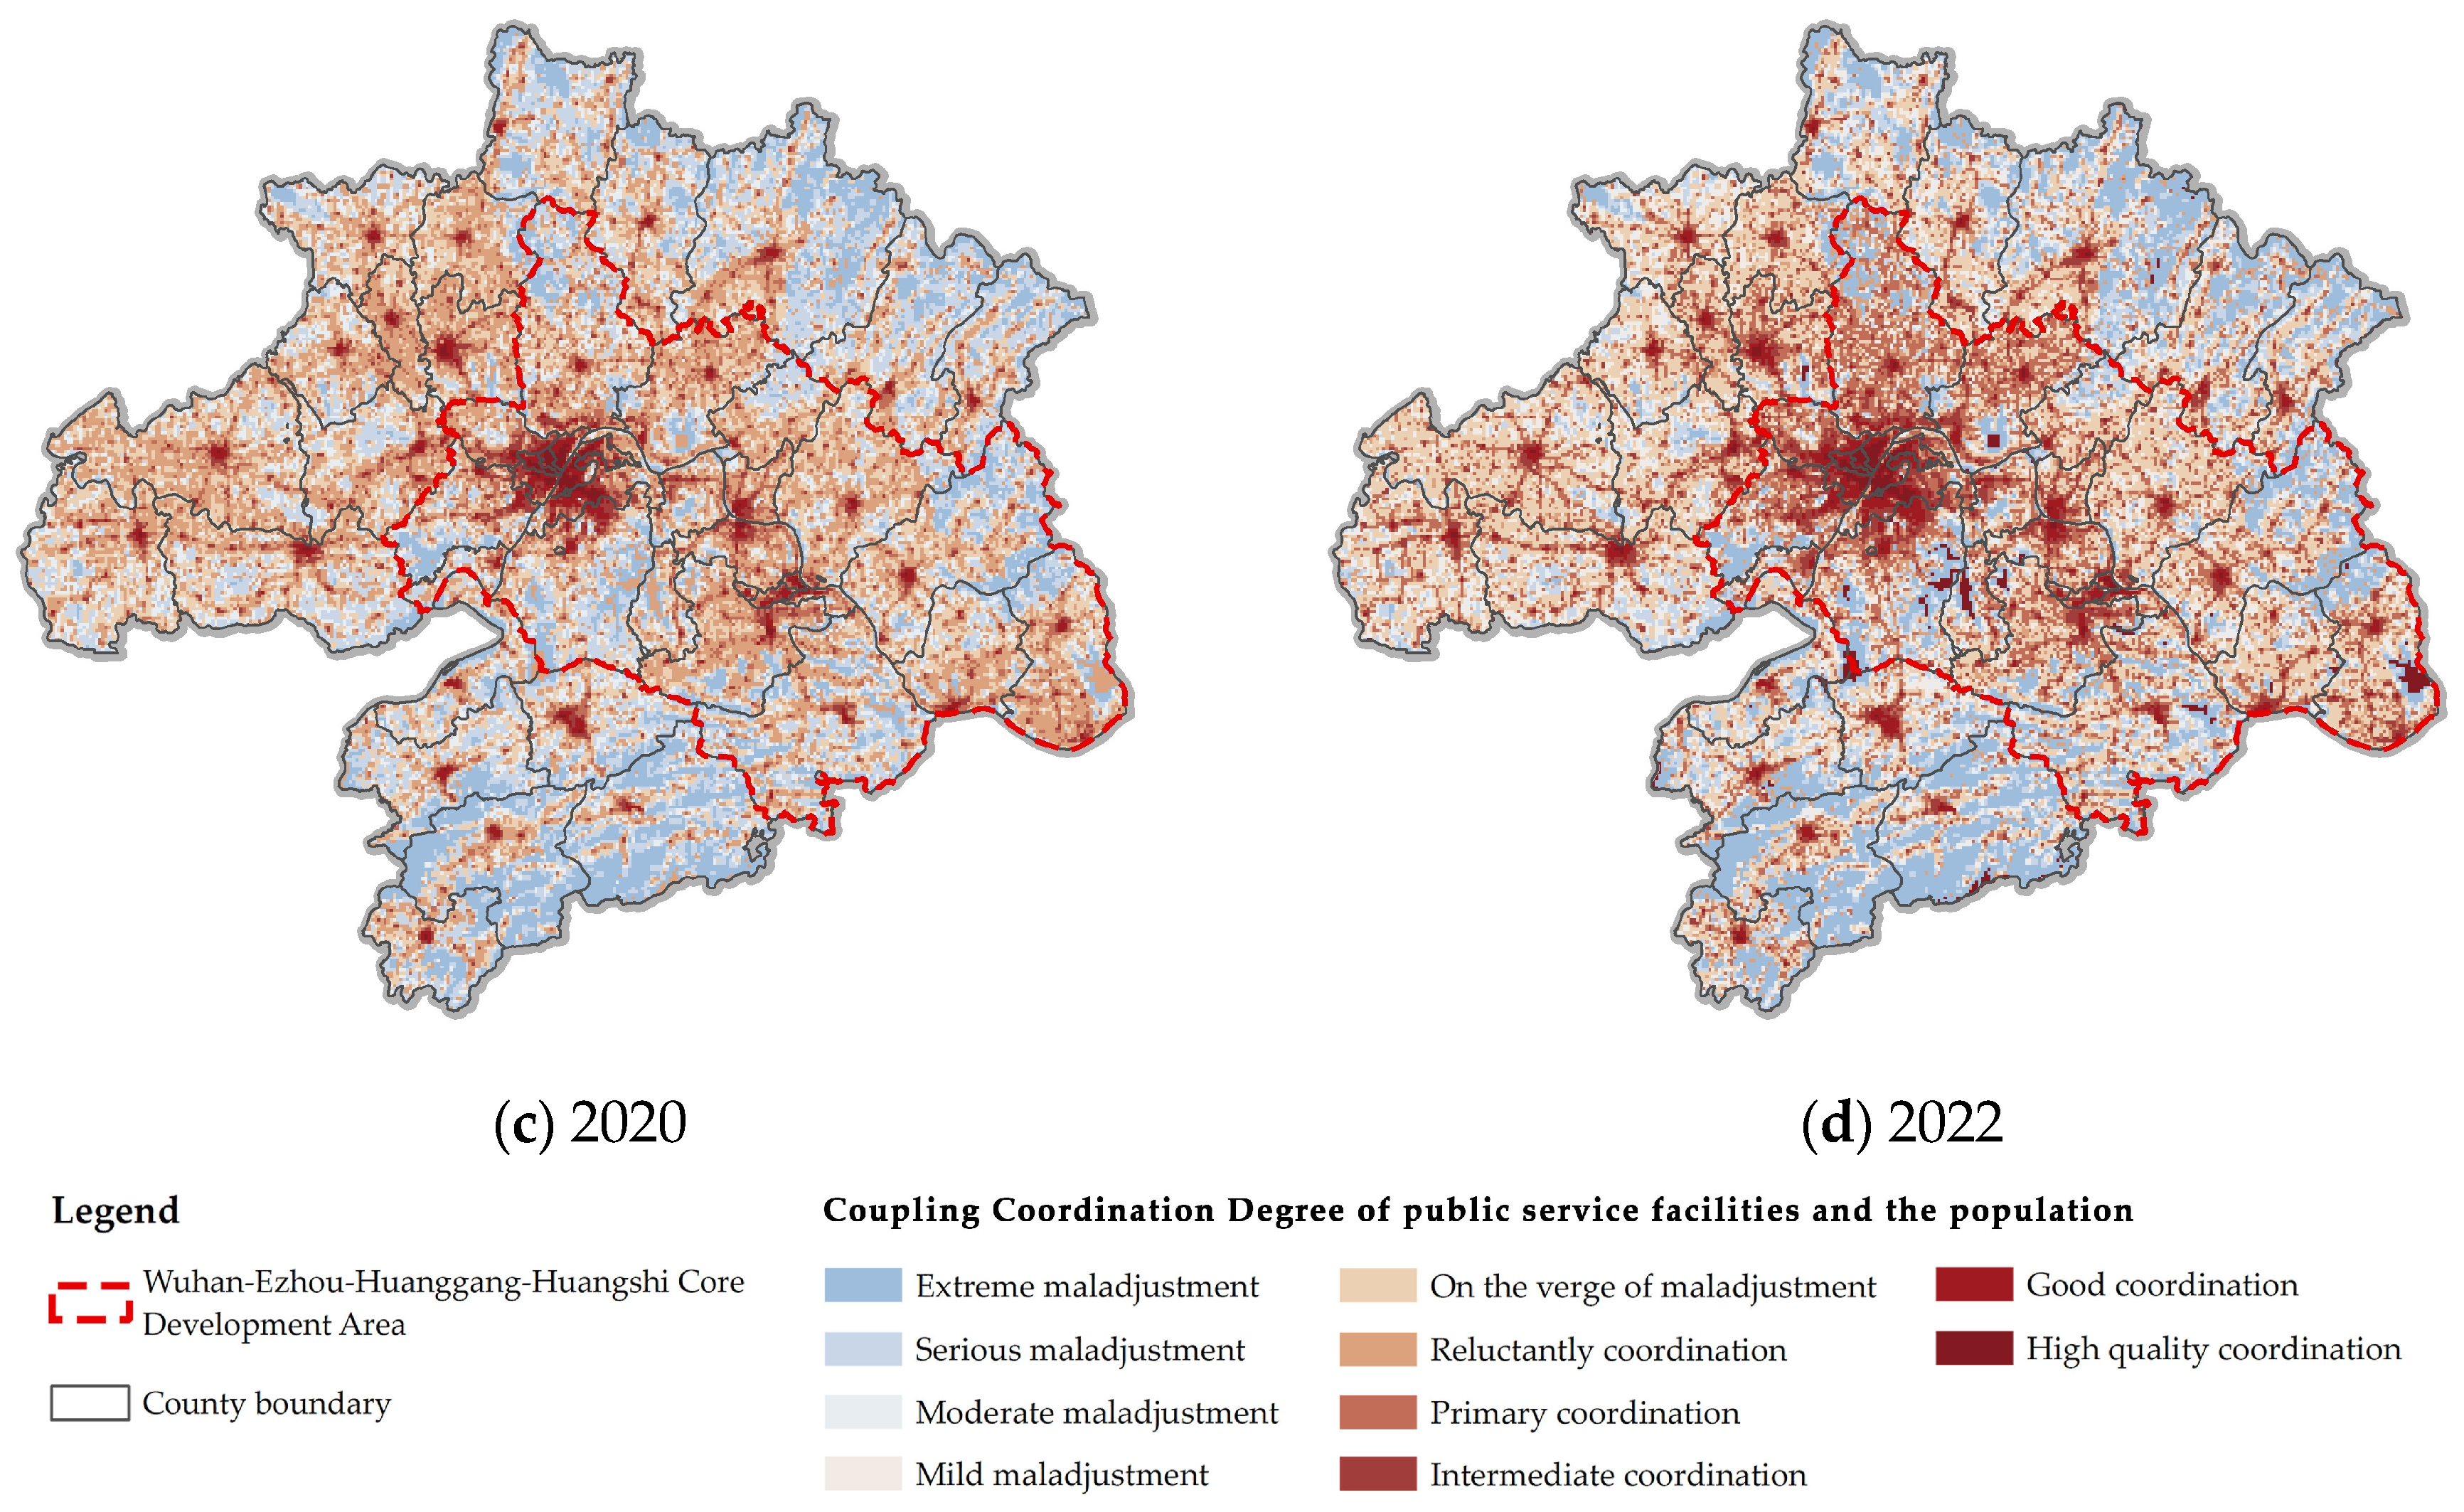
To study the specific situation of the changes in the coupling coordination of public service facilities in the WMA, we analyze the degree of coupling coordination at the grid level. As shown in Figure 7, from 2016 to 2022, the coupling coordination of public service facilities expanded in the main urban area of Wuhan to the far outer urban areas, while the convergence of coupling coordination in the eastern cities gradually strengthened.
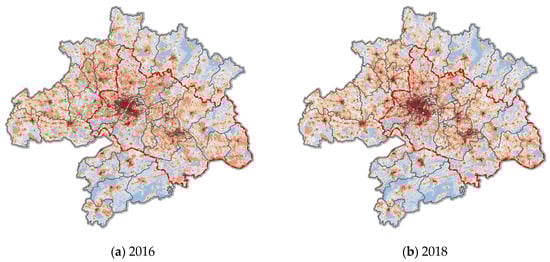
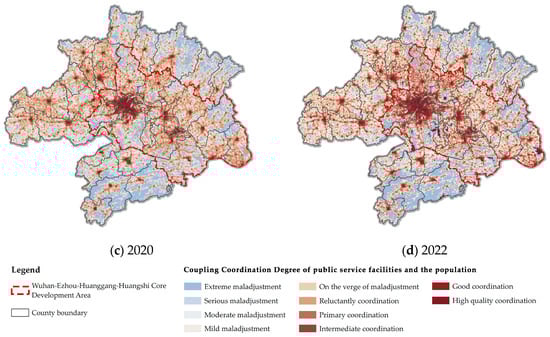
Figure 7.
Coupling coordination grid analysis of public service facilities in the Wuhan Metropolitan Area.
By 2022, the facilities in the administrative centers of all county-level cities are at an intermediate- to high-quality coordination level, among which Xiaonan District, Wuchang District, Echeng District, Daye City, etc. all show large areas of high-level coordination patches.
The public service facilities in the metropolitan area generally present a circular pattern in 2022, with Wuhan as the core city and the other counties and cities clustered and distributed around the central city in the form of groups. However, the public service facilities on the two wings of the WMA, such as Dawu County, Hong’an County, Macheng City, Luotian County and Yingshan County, are imbalanced at different levels of coupling coordination. Large areas of patches show extreme or severe maladjustment. It is speculated that there is an imbalance between the supply and demand of public service facilities due to the influence of Dabie Mountain in the north and Mufu Mountain in the south in the metropolitan area. In the Wu-E-Huang-Huang core development area, the public services in the downtown area of Wuhan are closely linked to those in remote areas, and a relatively continuous public service system has been established with counties and cities such as Huarong District, Huangzhou District, Echeng District, and Xialu City. The high-level coordination patches between Wuxue City and Huangmei County are concentrated, and the links to other cities are weak.
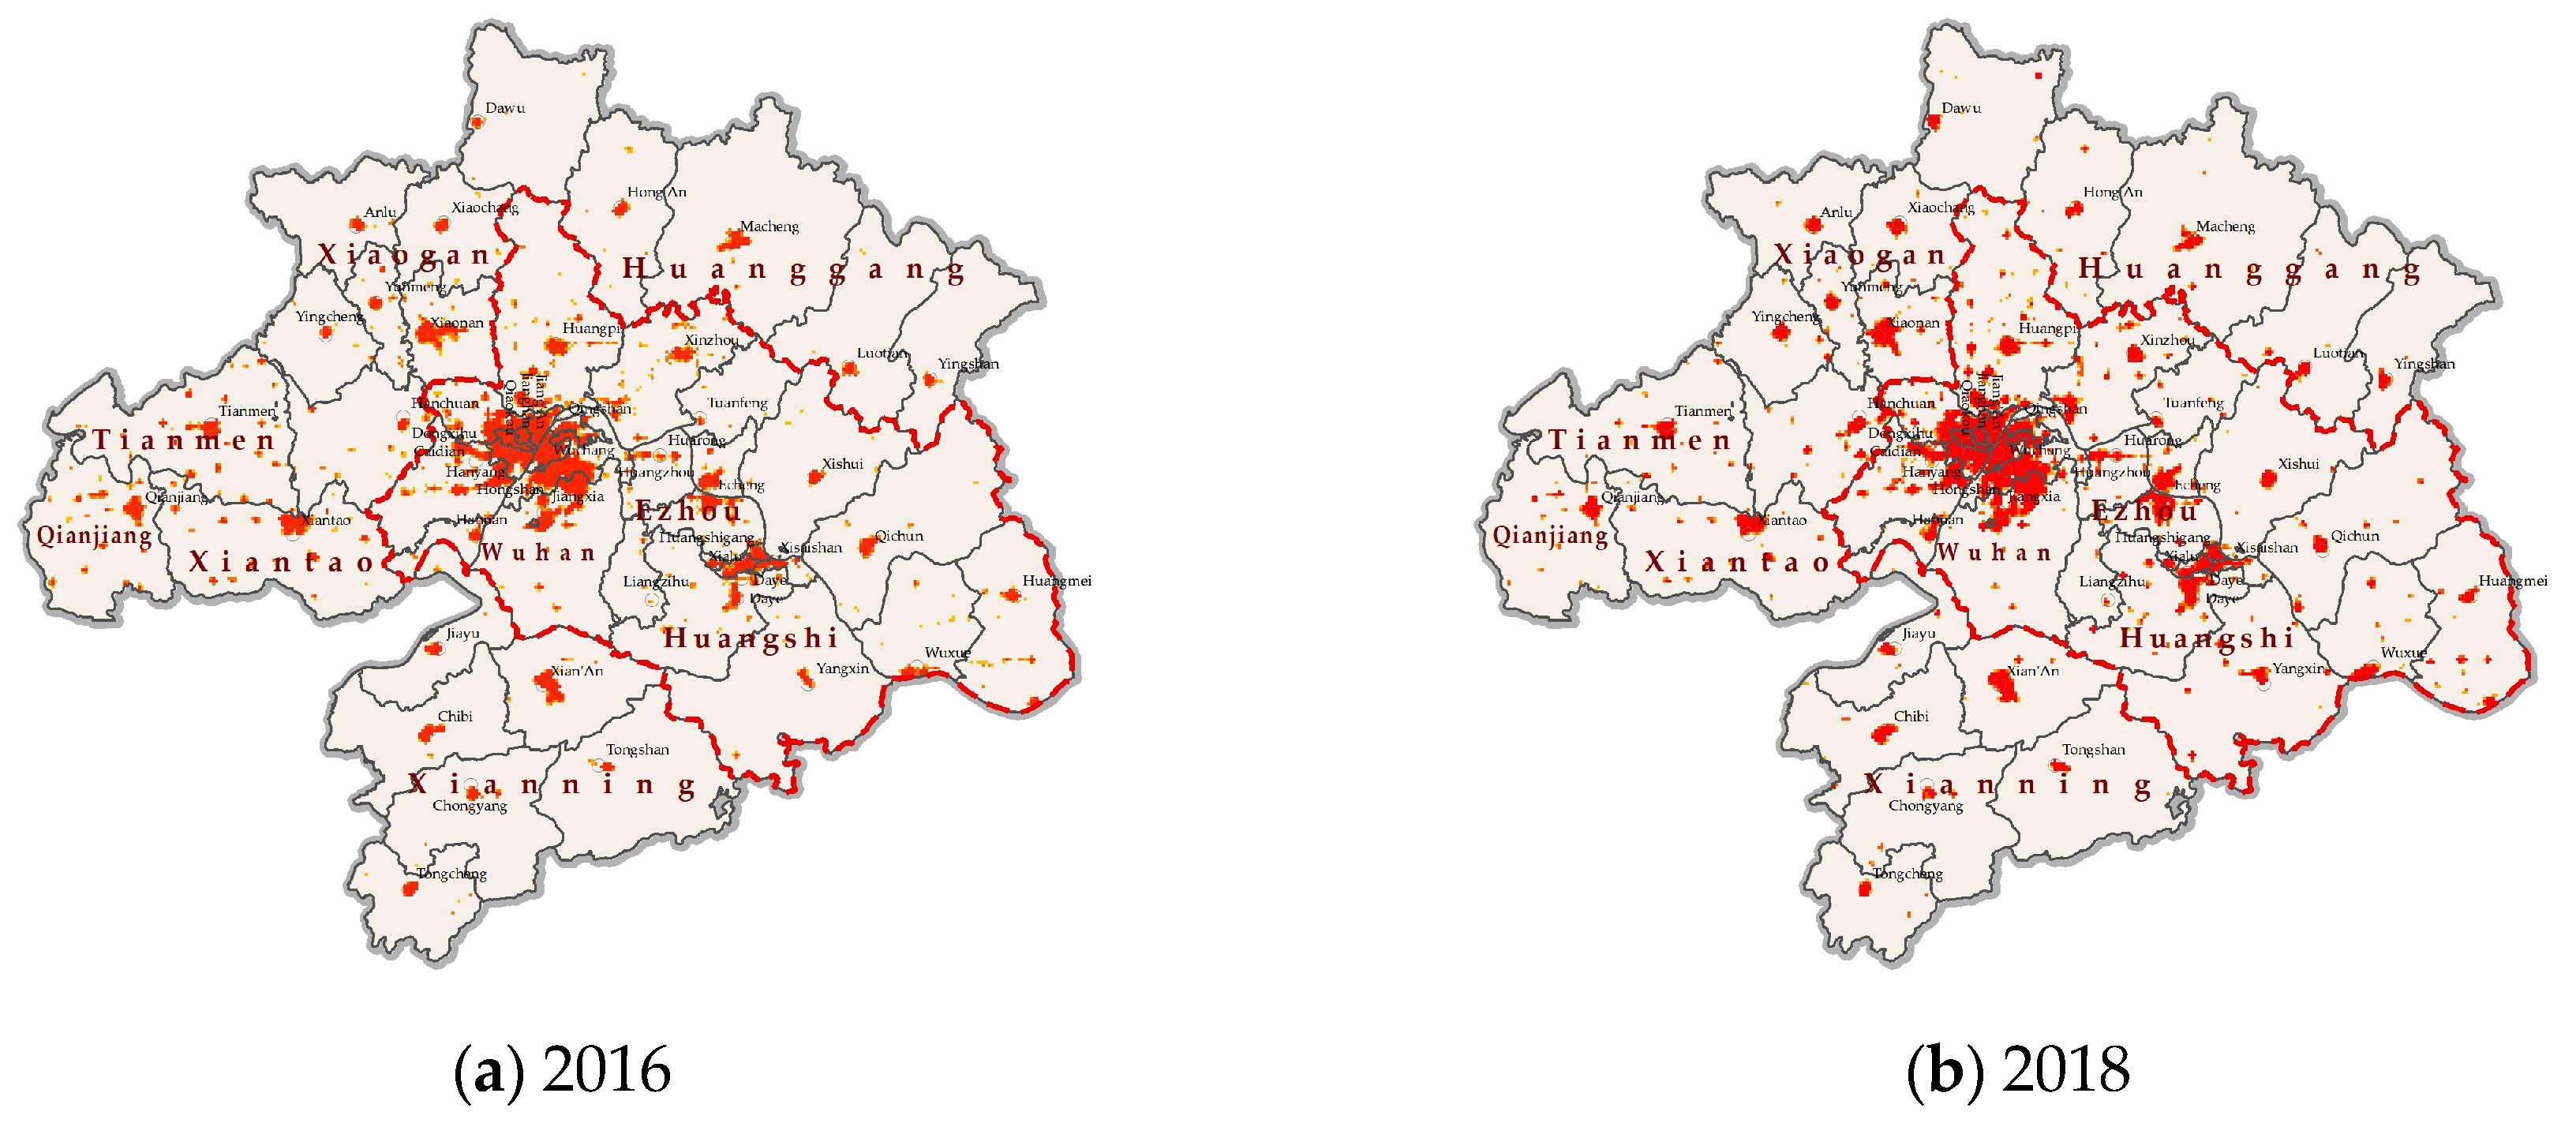
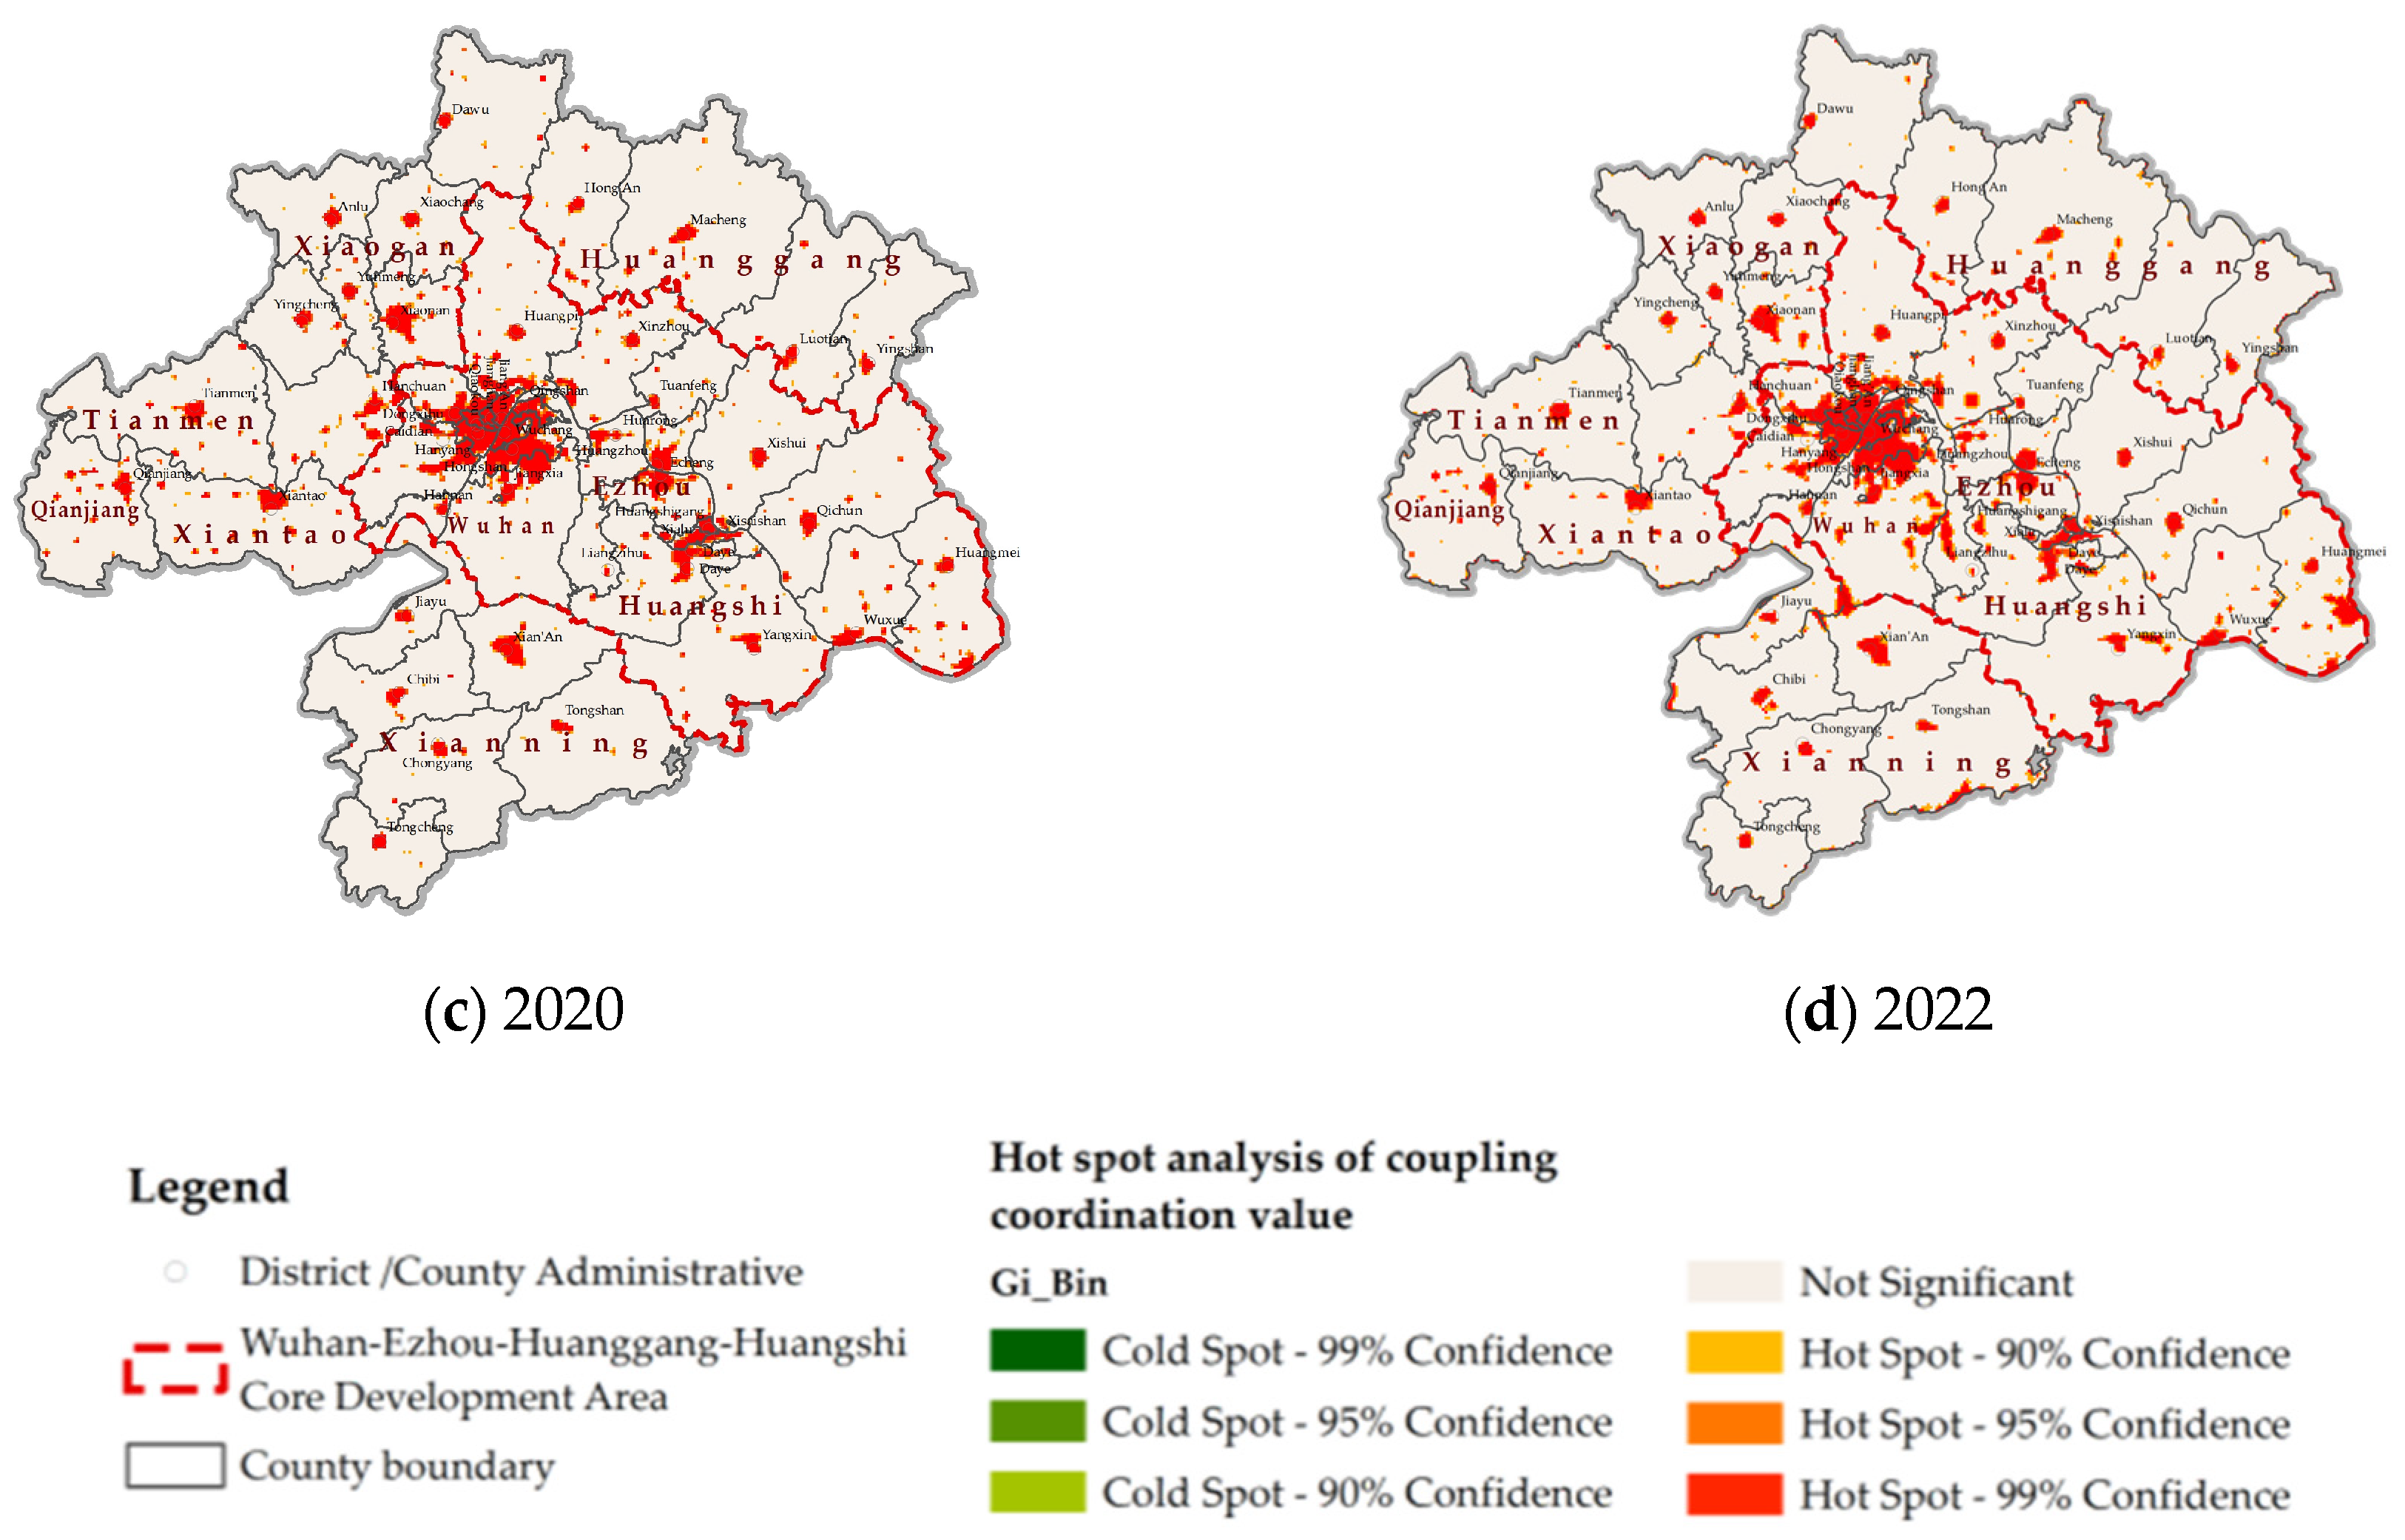
The local G index of ArcGIS(V10.2) was used to analyze the cluster distribution of the coupling coordination values. As shown in Figure 8, the centrality of Wuhan gradually weakens, while new aggregation patches appear in the far urban area. There are large areas of aggregation patches in downtown Wuhan, Echeng District, Huangzhou District, Huangshigang District, and Xialu District. However, the high-level coupling aggregation of public services in Wuhan is still significant within the metropolitan area, while the downtown areas of Ezhou, Huanggang, and Huangshi have also formed large areas of significant aggregation. The coupling coordination level of public service facilities in the Wu-E-Huang-Huang core development area is high.

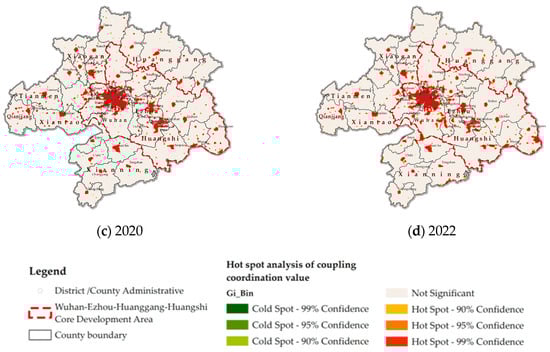
Figure 8.
Hotspot analysis of the coupling coordination value.
4. Discussion
4.1. Evaluation of the Distribution Characteristics of Public Service Facilities
The analysis of the spatial distribution characteristics in the metropolitan area revealed the following findings.
Wuhan is the core of the public services in the WMA, and other counties and cities are distributed in groups around the central city, forming a circular structure. The distribution of shopping and consumption facilities and educational facilities is more uniform from 2016 to 2022. Shopping and consumption facilities, educational facilities, and recreational facilities are evenly distributed in the metropolitan area, while other types of facilities are weakly connected to one another. In the Wu-E-Huang-Huang core development area, the public service facilities in Wuhan are closely related to those in Ezhou and Huangshi, but weakly related to those in Huanggang.
4.2. The Matching Relationship between the Public Service Facilities and the Population
The analysis reveals disparities among the coupling coordination degrees of different types of facilities in the metropolitan area. Shopping consumption facilities and living service facilities are highly coordinated in most counties and cities by 2022. However, the coupling coordination degree of elderly care facilities is decreasing and in a state of serious or extreme maladjustment by 2022, except for some counties and cities.
The analysis also reveals disparities between the supply and demand of public service facilities in different districts and counties in the metropolitan area. In the WMA, by 2022, a majority of the 48 districts and counties, accounting for 52.09%, are on the brink of misalignment, exhibiting a state of reluctant coordination. Additionally, 18.75% of these areas experience coupling misadjustment. Conversely, 29.17% of the districts and counties demonstrate coupling coordination, with a mere 2.08% achieving optimal coordination. Although the coupling coordination values of other cities, especially the eastern cities, increased rapidly from 2016–2022, the centrality of Wuhan was still significant. The spatial distribution of the coupling coordination value shows the difference in the supply and demand between different districts and counties, indicating that the supply of public service facilities in some areas still does not meet the demand of the population. For example, most public service facilities in northern Huanggang City and southern Xianning City show reluctant coordination or less. The high-level coordination of public service facilities is mostly concentrated and distributed within a specific area in the metropolitan area, and a continuous high-level coordinated distribution gradually develops on the east-west axis. For example, transportation facilities, cultural and sports facilities, and recreational facilities have a high degree of coupling coordination within a specified range and are characterized by a concentrated distribution, while educational facilities and medical facilities have a relatively obvious high-level coordinated continuous distribution on the east-west axis of the metropolitan area, with Wuhan as the center.
There are clustering differences in the core groups with high supply and demand synergy in the different districts and counties of the metropolitan area. The grid analysis of 1000 × 1000 m shows the specific distribution of facility coupling coordination within the metropolitan area. Overall, the matching relationship between supply and demand in the western cities of the WMA is good, the coupling coordination degree is high, and there are few breakpoints, while the public service facilities in the northern and southern wings of the metropolitan area have different degrees of coupling coordination maladjustment. Due to the separation of lake water systems, the public service facilities of the Wuhan-Ezhou–Huanggang–Huangshi core development area are affected to some extent. The analysis reveals that the high-level coupling coordination patches between Wuhan and Ezhou City, Daye City, Xishui County, and Qichun County exhibit good connectivity, but the connections between Wuhan and Wuxue City and Huangmei County are weak. The eastward connection and north-south expansion of public service facilities in the Wuhan–Ezhou–Huanggang–Huangshi core development area will create opportunities and challenges for future development.
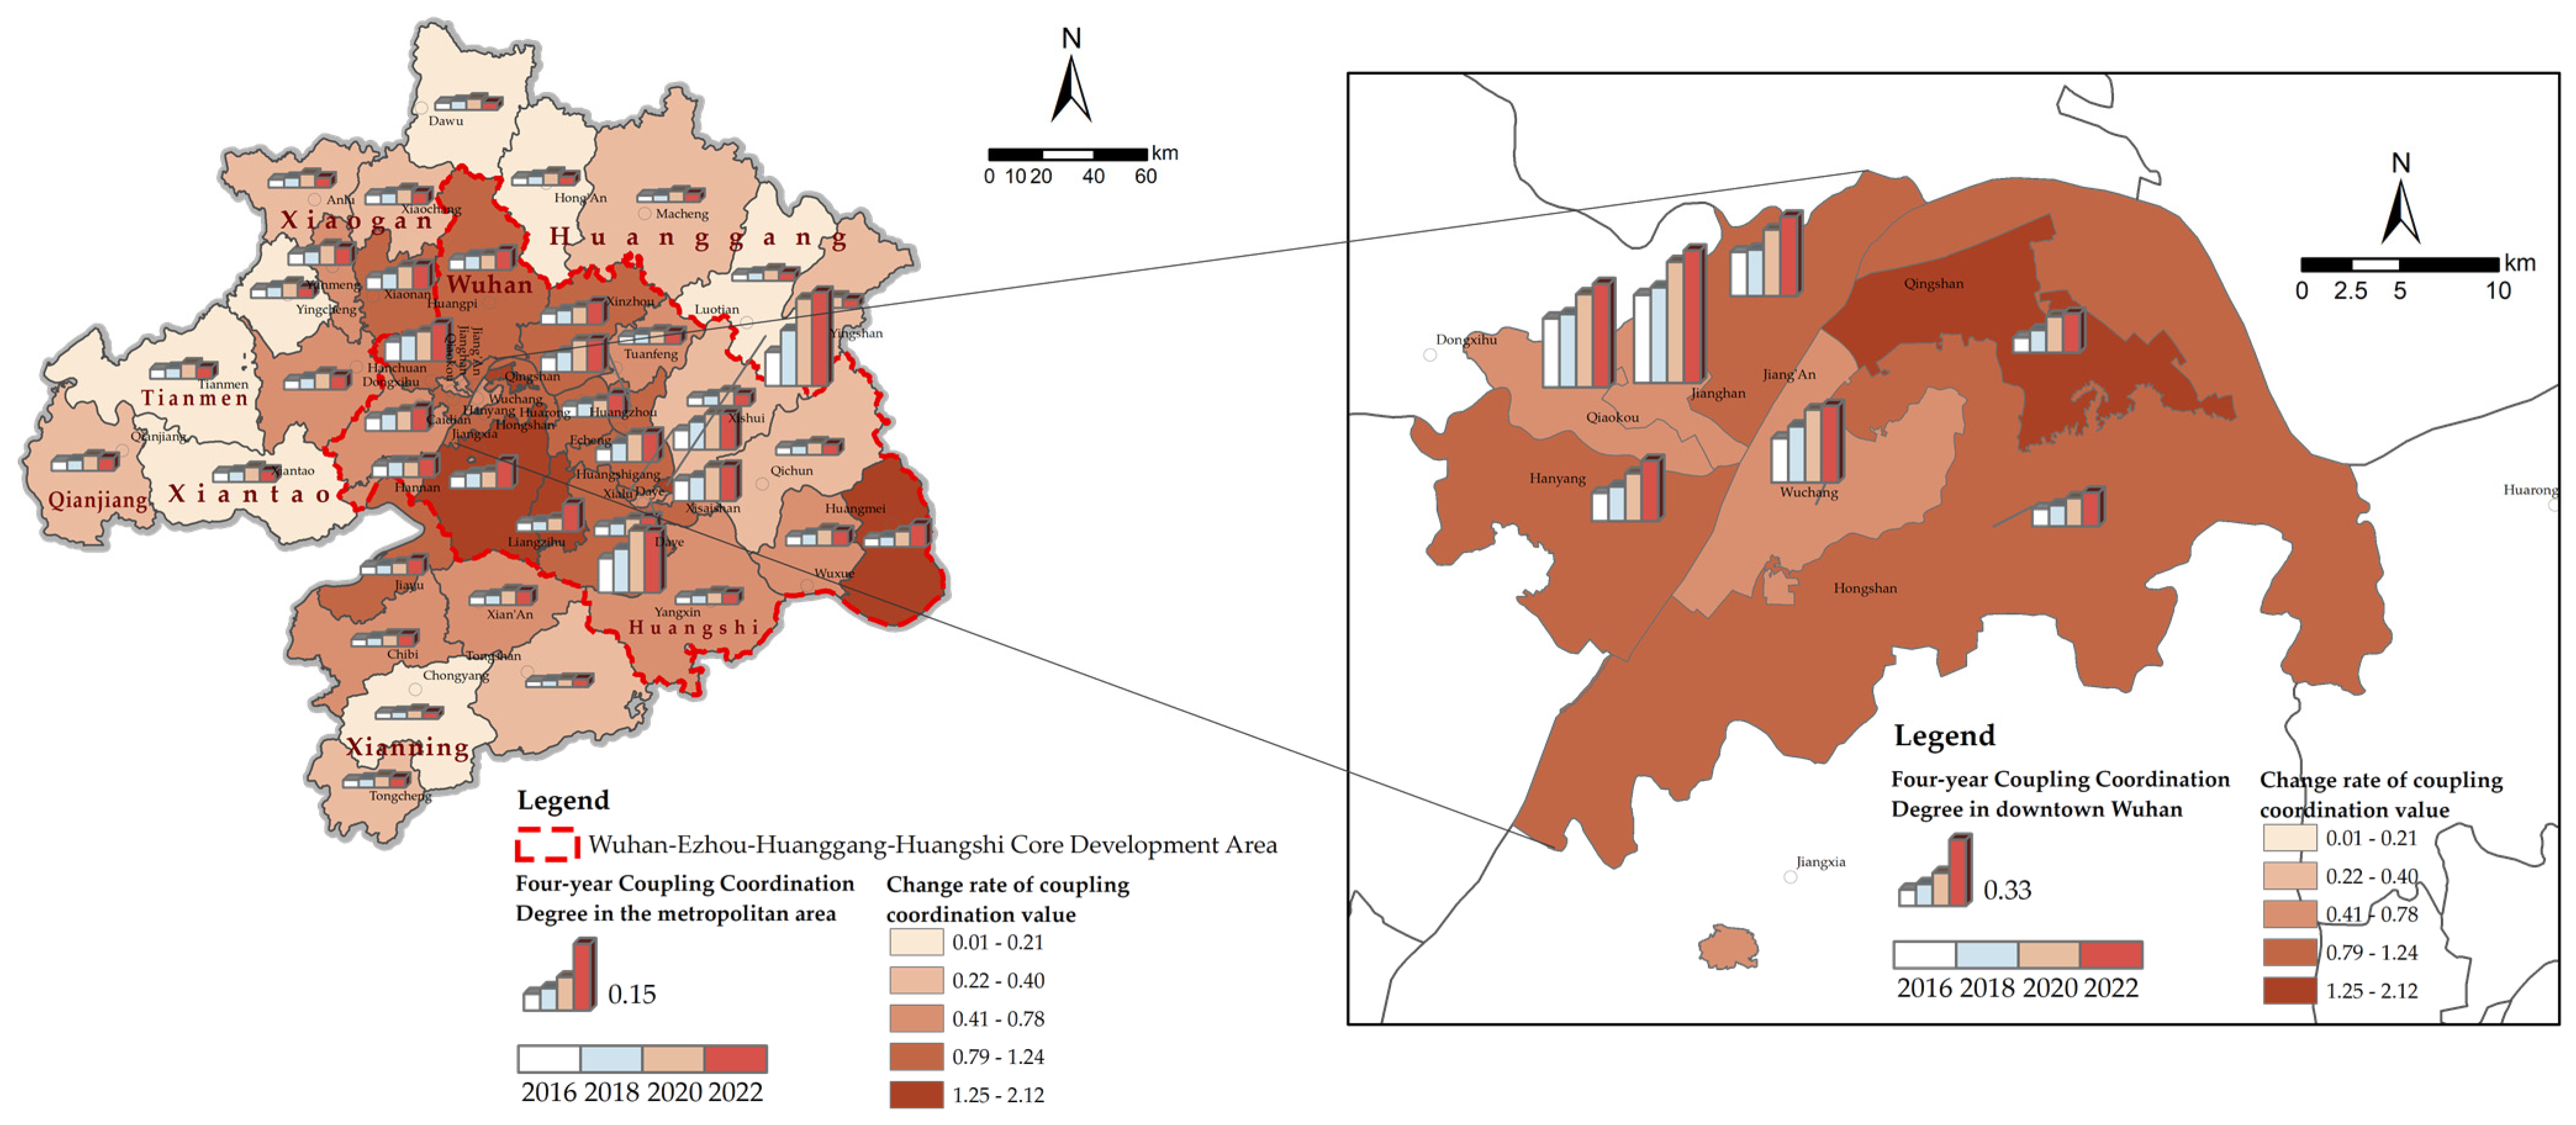
4.3. Analysis of the Dynamic Changes in Coupling and Coordinated Development of Public Service Facilities and the Population
In order to further explore the dynamic changes in the coupling coordination degree of each district and county in the WMA, we derive statistics on the change rate of the coupling coordination value (as shown in Figure 9). On the whole, the change rate of coupling coordination value in the Wu-E-Huang-Huang core development area is greater than that in the outer area, forming an obvious circle structure.
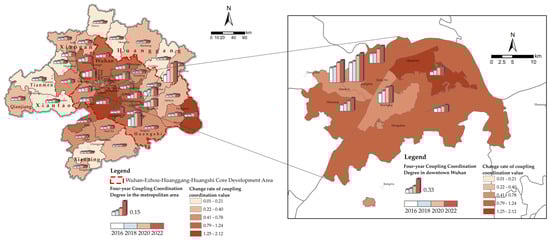
Figure 9.
Change rate of the coupling coordination value of public service facilities in the Wuhan Metropolitan Area.
In the Wu-E-Huang-Huang core development area, the coupling coordination index of most districts and counties increased rapidly from 2016 to 2022, with Qingshan District, Jiangxia District, Liangzihu District and Huangmei County having the fastest growth rate.
In the outer area, Yingcheng City, Tianmen City, Xiantao City, Dawu County, Hong‘an County, Luotian County and Chongyang County have a slow growth rate, and these counties and cities all experienced a decline in coupling coordination from 2020 to 2022.
Based on the above analysis, the changing stages in the coupling coordination relationship between public service facilities and population in the WMA can be summarized as follows.
- (1)
- Antagonistic stage
From 2016 to 2018, the phenomenon of a “single center” in the WMA is obvious. The coupling coordination levels of Huanggang City, Xianning City, and Huangshi City are low, especially for cultural and sports facilities, recreational facilities, and living service facilities. The construction of urban public service facilities in half of the counties and cities in the metropolitan area does not keep up with the development level of the population.
- (2)
- Running-in stage
From 2018 to 2020, the phenomena of intercity differentiation and mismatch of public services are still significant, but due to the matching of subfacilities, shopping and consumption facilities and living service facilities coordinate between the facilities and the population, and the coupling coordination level of different facilities gradually levels off. The axis of high-level coupling between east and west initially takes shape.
- (3)
- Coupling complementary stage
From 2020 to 2022, influenced by factors such as the transformation in land spatial planning and land policy, the construction of public service facilities gradually changes from market-oriented to more scientific and effective planning and allocation modes. Through the stage evolution from 2020 to 2022, although Wuhan is still an irreplaceable central city in terms of its public service level in the WMA, Ezhou and Huangshi are gradually emerging, and most facilities have completed high-level coupling between east and west. With the worsening of the aging problem, the coupling coordination level of elderly care facilities declines in this stage and needs to be allocated to the subsequent public service supply.
Under the influence of previous economic policies, the inland provinces of China usually exhibit a single-center development pattern, and the central cities with economic development advantages could invest more money in the construction of public service facilities. However, the proposal of planning concepts such as metropolitan integration and urbanization emphasizes the necessity of coordinated regional development. The stage analysis of the coordinated development of public service facilities and population in the WMA shows the possibility of public service level integration under the transformation of planning concepts. Because the central city of a metropolitan area usually undertakes more economic development and has greater urban renewal pressure, in the era of stock development, cities with sufficient financial budgets for public service facilities and less population pressure in the metropolitan area can often invest more money in the renewal and construction of urban supporting facilities.
4.4. Promotion Strategies for Space Configuration of Public Service Facilities
In light of the findings presented in this study, the following strategic recommendations are proposed to better ensure the sustainable development of public service facilities in the WMA.
- The layout and scale design of different facilities should take into account future population growth trends and changes and avoid the long-term resource bottleneck caused by short-term behavior. The construction of elderly care facilities should be focused on the resources that can continuously support the growth of the elderly population and meet the service demand in the future. Focus on the coverage of old-age care centers and nursing homes at the life circle level and rely on public participation to strengthen the co-construction of basic old-age facilities in communities. For shopping and consumption facilities and living service facilities that are relatively perfect, the quality should be improved to avoid repeated construction.
- Ensure the balanced distribution of public service facilities in the region and avoid excessive concentration of resources in some areas. Through policy guidance and market mechanism, the inclination of resources will be promoted to underdeveloped areas and improve the accessibility and social fairness of public services. With Wuhan as the center, the foundation of existing public service facilities in the Wu-E-Huang-Huang core development area should be stabilized, and the northern and southern wings of the WMA should be connected to narrow the differences in public service allocation among districts and counties.
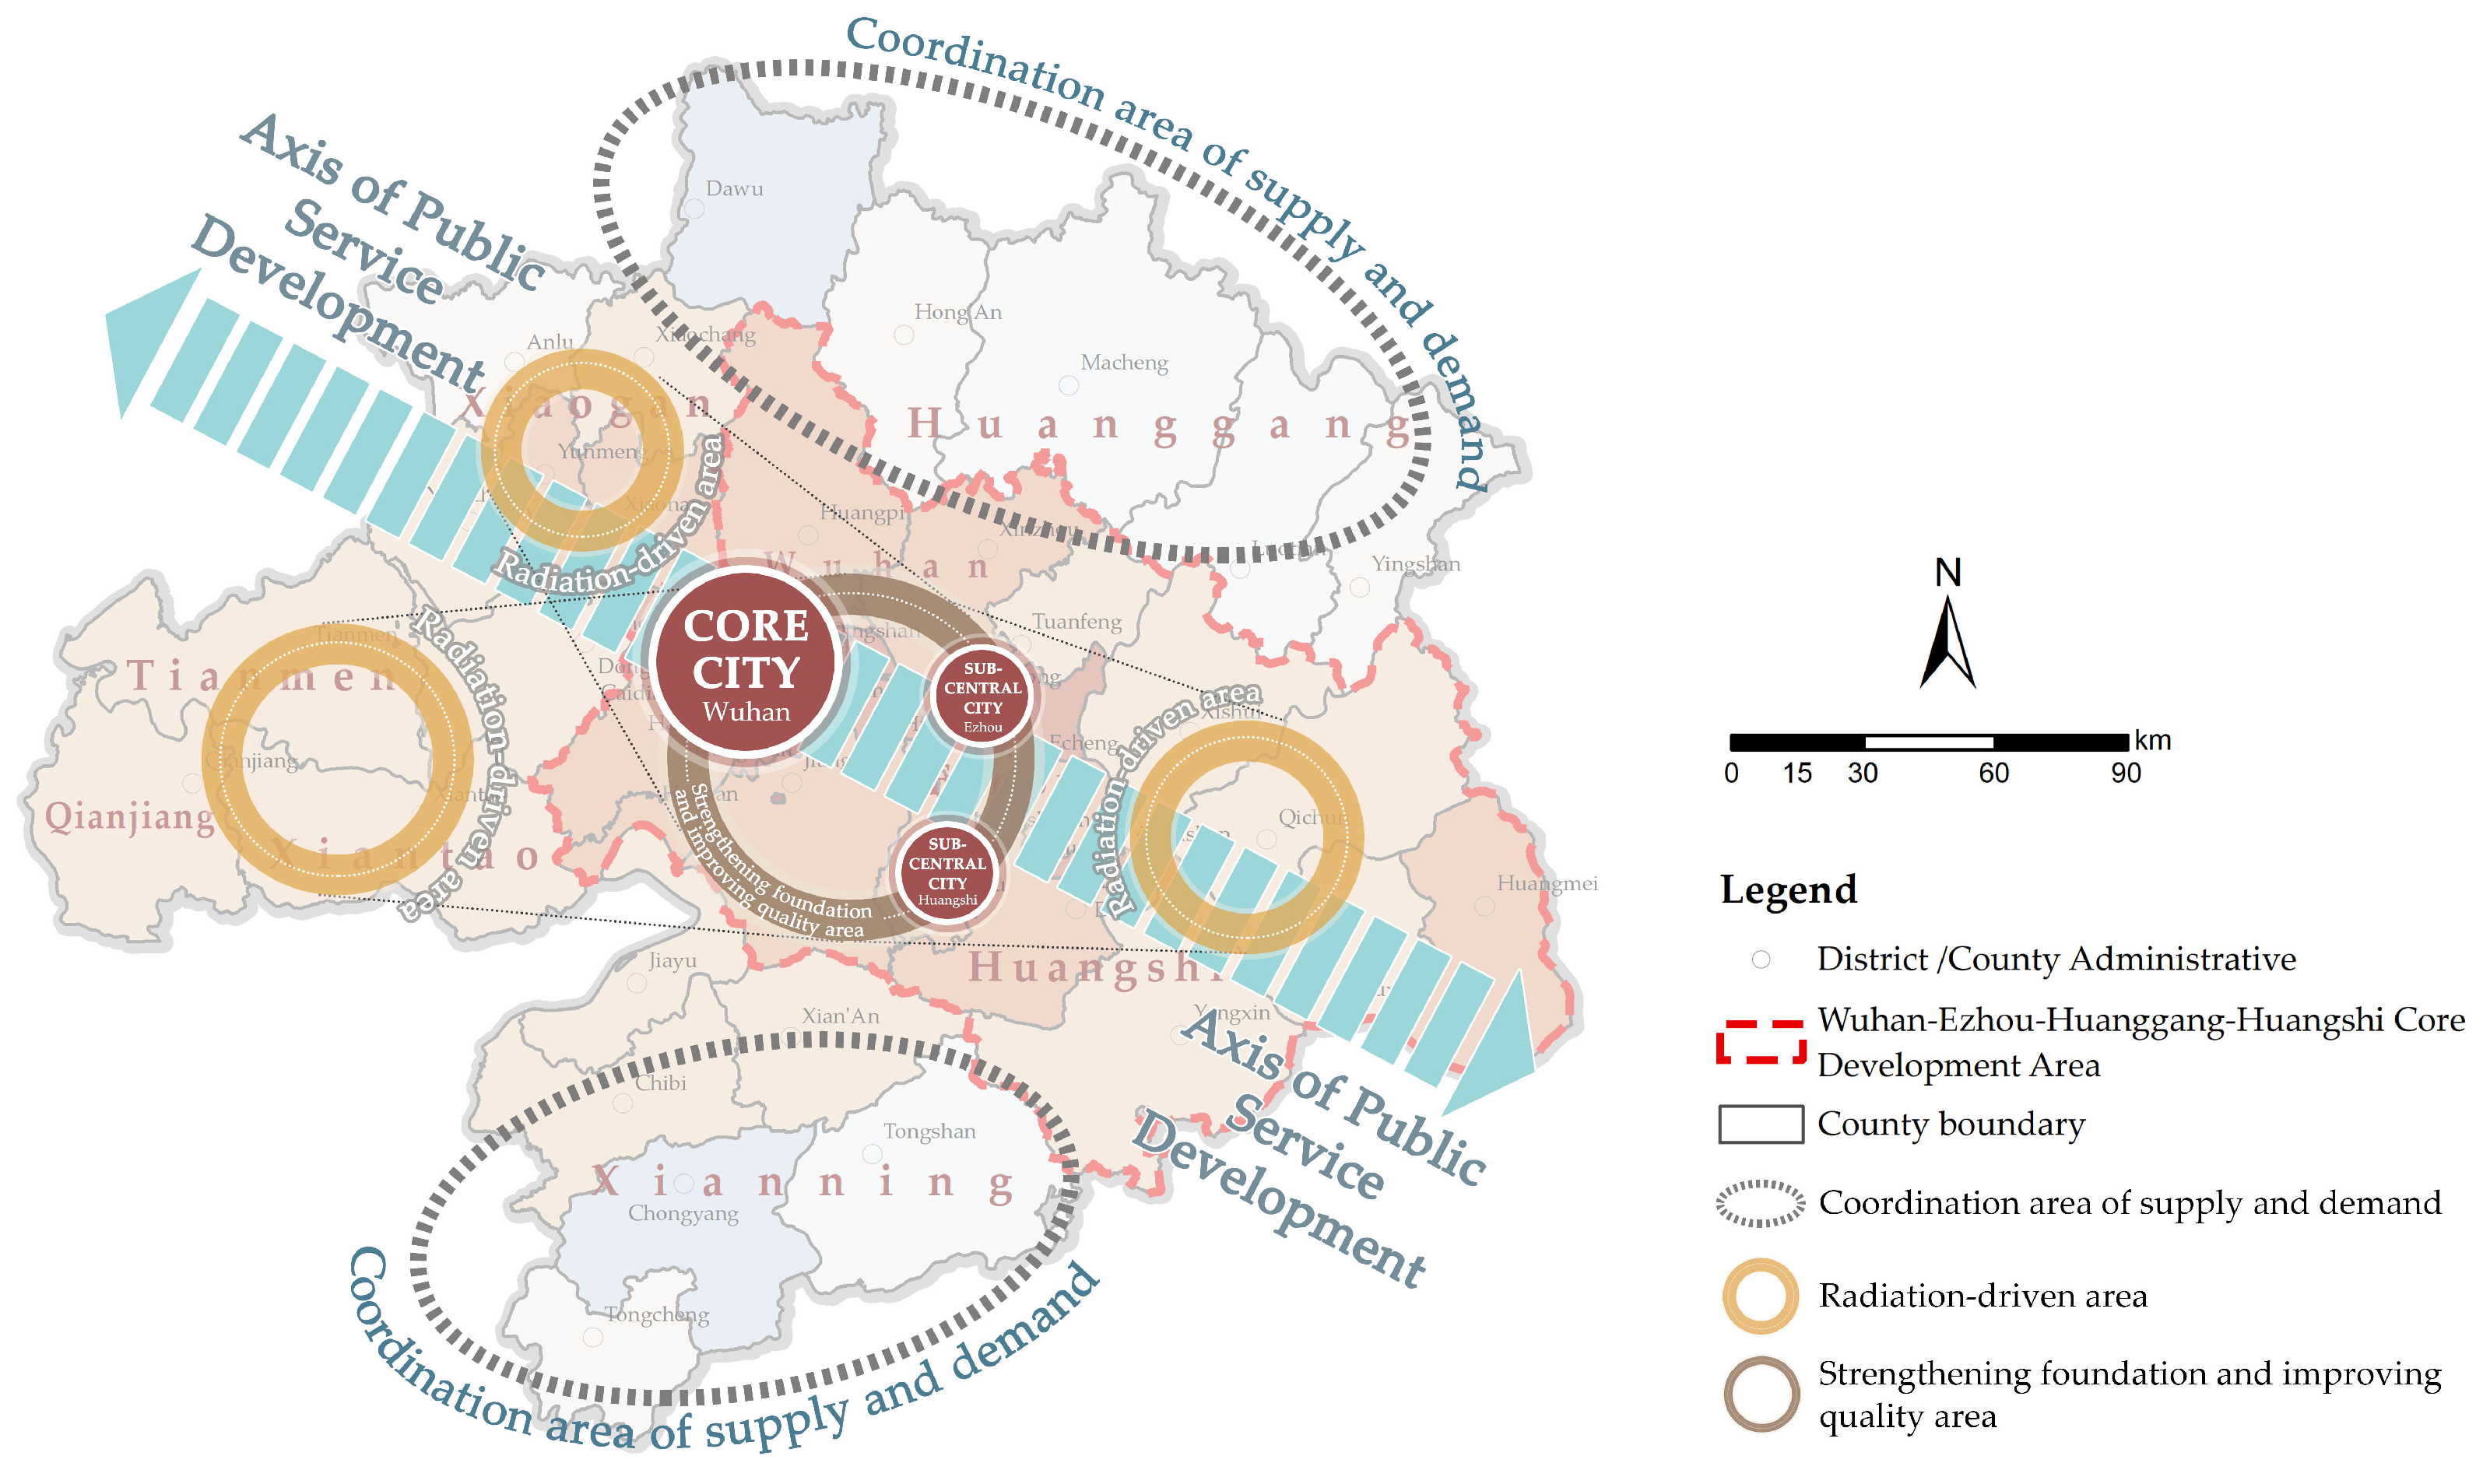
- Regional collaboration should be strengthened, and a high-quality public service facility structure system should be steadily built in the WMA. According to the results of the evaluation of public service facilities in all districts and counties, the metropolitan area was divided into three development areas: strengthening foundation and improving quality area, radiation-driven area, and coordination area of supply and demand (as shown in Figure 10).
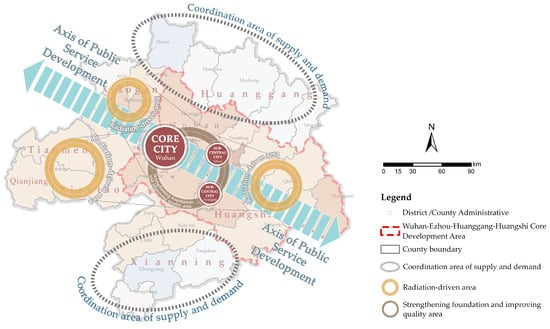 Figure 10. Optimization strategy and development direction of the public service system.
Strengthening foundation and improving quality area.: Stabilize the number of public facilities, improve the service quality of facilities, and promote the construction of livable cities. The public service facilities in Wuhan have formed a coherent and coordinated distribution with those in Ezhou City and Huangshi City. In the future, it will be necessary to improve the quality of the facilities, drive infrastructure construction south of Xianning city and north of Huanggang City, and optimize the coupling and coordination level of public services in the north and south wings of the metropolitan area under the overall pattern of the east-west axis.
Radiation-driven area: The public service facilities in Yunmeng County, Xiaonan District, Hanchuan City and others have a high degree of coupling and coordination, but less contact with the core circle. It is necessary to optimize the public service system and strive to build a high-quality public service belt at the regional scale. The far urban area of Wuhan needs to connect downtown Wuhan and surrounding counties, creating an integrated pattern of public service facilities, and forming a cross-border shared public service system.
Supply and demand coordination area: It is necessary to strengthen infrastructure construction, balance supply and demand, improve the demand for public services within a city, and strengthen contact with other cities in the WMA. The construction of a complete community should be promoted, the problems of job–residence balance should be solved, the coverage of public service facilities within the city should be improved, and the infrastructure construction in remote areas should be strengthened.
5. Conclusions
International metropolitan areas often reflect population gathering, while the rationing of public service facilities is limited and the contradiction of fairness is prominent. However, in metropolitan areas with insufficient vitality and declining cities, the population is declining and the local population is aging, and the distribution of public service facilities is facing the problem of imbalanced matching between supply and demand. Accurately evaluating the allocation and differentiation of public service facilities in metropolitan areas and determining their development laws are important issues that are related to the long-term planning of public service facilities to cope with population changes and the sustainable development of cities. Previous studies have often focused on the resource attributes of public service facilities in metropolitan areas, but have ignored their spatial attributes. The research on evaluation by administrative districts also lacks certain accuracy and depth. At the same time, there are still some problems in the current research on public service facilities, such as unclear classification, inconsistent evaluation indices and systems, and weak time series analysis, which cannot effectively support research on public service allocation evaluation in metropolitan areas. Based on the deficiency of current research, this study considers the spatial attributes of public service facilities, proposes the evaluation concept of precise coupling from the perspective of man–land coupling, coordinates the regional scale and the life circle scale, optimizes the coupling coordination model and CRITIC method, classifies the distribution of public service facilities and their coupling with the population from county and grid levels, and obtains the typical characteristics of public service development in the WMA. This study elucidates the overall trend and dynamic changes in the spatial structure of coupling coordination between public service facilities and population in the WMA, and also found an imbalance between supply and demand of different facilities. This study solved the problem of differences in facility allocation indicators among cities and enhanced the comparability. In addition, this study proposed a framework to effectively identify areas with weak coupling coordination between public services and population in metropolitan area at the county and grid levels, providing scientific support for sustainable regional development.
However, the sample size and accuracy of POI data are restricted, and some grid data contain empty values. With the update and enrichment of the data, the null values will be filled in the future. Second, there are many types of approved metropolitan areas in China, and the development of them is various. The stage characteristics of public service development in different metropolitan areas are also worth discussing. Therefore, in the next step, we will increase the influence of other factors on public service facilities and add more point data and area data to meet accuracy requirements. At the same time, the scope of research will be expanded to different regional metropolitan areas in the future, and comparative studies of different metropolitan areas including coastal and inland areas will be undertaken to make the research results more comprehensive.
Author Contributions
Conceptualization K.L. and Y.Z.; methodology, software, formal analysis, investigation, data curation, visualization, writing—original draft preparation, K.L.; validation, writing—review and editing, K.L., Y.Z. and G.L.; supervision, project administration and funding acquisition, Y.Z. and G.L. All authors have read and agreed to the published version of the manuscript.
Funding
This research was funded by the Natural Science Foundation of China, grant 52078193; National Foreign Expert Project of China, grant G2023027008L; Philosophy and Social Science Research Project of Hubei Provincial Department of Education, grant 22Q059; and Hubei International Science and Technology Cooperation Project, grant 2023EHA032.
Institutional Review Board Statement
Not applicable.
Informed Consent Statement
Not applicable.
Data Availability Statement
The original contributions presented in the study are included in the article, further inquiries can be directed to the corresponding author.
Conflicts of Interest
The authors declare no conflicts of interest.
References
- National New Urbanization Plan (2014–2020). Available online: https://www.gov.cn/gongbao/content/2014/content_2644805.htm (accessed on 1 December 2023).
- Wuhan Metropolitan Area Development Plan. Available online: https://www.wuhan.gov.cn/sy/whyw/202212/t20221208_2111996.shtml (accessed on 10 December 2023).
- Yunitsyna, A.; Shtepani, E. Investigating the socio-spatial relations of the built environment using the Space Syntax analysis—A case study of Tirana City. Cities 2023, 133, 104147. [Google Scholar] [CrossRef]
- Michalos, A.C.; Zumbo, B.D. Public Services and the Quality of Life. Soc. Indic. Res. 1999, 48, 125–157. [Google Scholar] [CrossRef]
- Contreras, D.; Bhamidipati, S.; Wilkinson, S. Social vulnerability and spatial inequality in access to healthcare facilities: The case of the Santiago Metropolitan Region (RMS), Chile. Socio-Econ. Plan. Sci. 2023, 90, 101735. [Google Scholar] [CrossRef]
- TangBo; HuangZhangdi Research on the spatial characteristics of urban integration from multi-dimensions: A case study in the Guangzhou-Qingyuan metropolitan area. Front. Earth Sci. 2023, 10, 1022982.
- Zhang, B.; Zhou, E. The Evaluation of Spatial Distribution Equity of Public Service Facilities in Coastal Cities. J. Coast. Res. 2020, 103, 1060–1064. [Google Scholar] [CrossRef]
- Hui, Y. Research on infrastructure integration of 13 cities in Beijing, Tianjin and Hebei based on Coupling Coordination Degree model. Econ. Manag. 2020, 34, 15–24. [Google Scholar]
- Yang, Y.; Gao, D.; Li, R.; Du, H. The Impact of Basic Public Health Services on Migrant Peasant Workers’ Urban Integration: Evidence from China. Sustainability 2023, 15, 2420. [Google Scholar] [CrossRef]
- Teitz, M. Toward a Theory of Urban Public Facility Location. In Papers in Regional Science; John Wiley & Sons, Ltd.: Hoboken, NJ, USA, 1968; Volume 21, pp. 35–51. [Google Scholar]
- Cao, L.; Wang, J.; Wang, H.; Cui, H. Evolutional Analysis of Coupling between Infrastructure and Population Agglomeration in Beijing-Tianjin-Hebei Region: An Analysis Based on Push-pull Theory. Sci. Geogr. Sin. 2019, 39, 1256–1264. [Google Scholar]
- Yu, Q. Research on the coupling coordination between the carrying capacity of public cultural services and high-quality economic development: Taking Zhengzhou metropolitan area as an example. Resour. Dev. Mark. 2023, 39, 875–883. [Google Scholar]
- Zhang, Y.; Zou, Q.; Yang, C.; Shui, Y.; Cha, J. The Dynamic Evolution and Geographical Differences of Equalization of Basic Public Services in Nanjing Metropolitan Area. Sci. Technol. Ind. 2023, 23, 65–73. [Google Scholar]
- Zeng, P.; Zong, C. Research on the relationship between population distribution pattern and urban industrial facility agglomeration in China. Sci. Rep. 2023, 13, 16225. [Google Scholar] [CrossRef] [PubMed]
- Shi, Y.; Yang, J.; Shen, P. Revealing the Correlation between Population Density and the Spatial Distribution of Urban Public Service Facilities with Mobile Phone Data. ISPRS Int. J. Geo-Inf. 2020, 9, 38. [Google Scholar] [CrossRef]
- Lin, D.; Wang, J.; Xie, B. Research on the Matching Relationship of Transportation Land on Regional Traffic Impact Assessment. J. Transp. Eng. 2024, 24, 94–98+105. [Google Scholar]
- Huang, C.; Feng, Y.; Wei, Y.; Sun, D.; Li, X.; Zhong, F. Assessing Regional Public Service Facility Accessibility Using Multisource Geospatial Data: A Case Study of Underdeveloped Areas in China. Remote Sens. 2024, 16, 409. [Google Scholar] [CrossRef]
- Wang, W.; Zhou, Z.; Chen, J.; Cheng, W.; Chen, J. Analysis of Location Selection of Public Service Facilities Based on Urban Land Accessibility. Int. J. Environ. Res. Public Health 2021, 18, 516. [Google Scholar] [CrossRef]
- Zheng, X.; Zhao, D. Evaluating the accessibility of public service facilities to tourists and residents in island destinations: Evidence from the Changhai County. Front. Public Health 2023, 10, 1090341. [Google Scholar] [CrossRef]
- Wu, J.; Fu, J.; Wang, H.; Zhao, Y.; Yi, T. Identifying Spatial Matching between the Supply and Demand of Medical Resource. Int. J. Environ. Res. Public Health 2022, 19, 2354. [Google Scholar] [CrossRef] [PubMed]
- Lan, F.; Zhang, W.; Wen, H.; Da, H. Stratification, Spatial Agglomeration, and Unequal Public Services: Case Study in Xi’an, China. J. Urban Plan. Dev. 2020, 146, 05020004. [Google Scholar] [CrossRef]
- Sun, A.; Huang, Y.; Yang, L.; Huang, C.; Xiang, H. Assessment of the Impact of Basic Public Service Facility Configuration on Social–Spatial Differentiation: Taking the Zhaomushan District of Chongqing, China. Sustainability 2023, 16, 196. [Google Scholar] [CrossRef]
- Wang, K.; Yuan, Y.; Chen, M.; Wang, D. A POIs based method for determining spatial distribution of urban fire risk. Process Saf. Environ. 2021, 154, 447–457. [Google Scholar] [CrossRef]
- Zhou, L.; Shi, Y.; Zheng, J. Business Circle Identification and Spatiotemporal Characteristics in the Main Urban Area of Yiwu City Based on POI and Night-Time Light Data. Remote Sens. 2021, 13, 5153. [Google Scholar] [CrossRef]
- Chen Hao, Z.J. Rising Dual System of Functional Territory and Administrative Territory: Unraveling the Spatiality of Urban State and its Transformation Based on the Case Study of the City Proper of Nanjing. Econ. Geogr. 2017, 37, 59–67. [Google Scholar]
- Liu, S.; Guo, H.; Su, L. Evaluation of Quality of Life in Urban Life Circles from a Composite Perspective of Subjective Needs and the Supply of Public Amenities: A Case Study of Changbai Island, Shenyang. Sustainability 2023, 15, 10095. [Google Scholar] [CrossRef]
- Li, C.; Xia, W.; Chai, Y. Delineation of an Urban Community Life Circle Based on a Machine-Learning Estimation of Spatiotemporal Behavioral Demand. Chin. Geogr. Sci. 2021, 31, 27–40. [Google Scholar] [CrossRef]
- Zhen, W. Research on Evaluation Method of Supply and Demand Matching Degree of Public Service Facilities in Central City—Taking Tianhe District of Guangzhou as an Example. Master’s Thesis, South China University of Technology, Guangzhou, China, 2021. [Google Scholar]
- Han, J.; Yu, M. A multi-factor integration identification method of ecological security pattern and optimization suggestions: A case of Changshan county, Quzhou city. Geogr. Res. 2021, 40, 1078–1095. [Google Scholar]
- Wang, D.; Fang, Y.; Hu, Y.; Wang, J. Territorial Spatial Planning of Coastal Ecological Areas Under Land-Sea Coordination: The Case of Dapeng New District, Shenzhen. Urban Plan. Forum 2022, 232–239. [Google Scholar]
- Liu, Y.; Wu, K.; Hu, Y.; Liu, Y. Refined Governance of Public Service Facilities Based on Needs of Typical populations: A Case Study of Quarter-hour Community Service Circle in Beijing’s Huitian Area. Shanghai Urban Plan. Rev. 2023, 6, 98–104. [Google Scholar]
- Nie, J.; Huang, Y.; Shan, Z. Study on the characteristics and formation mechanism of urban system in Wuhan metropolitan area—Based on the perspective of urban network. Mod. Urban Res. 2018, 3, 110–116. [Google Scholar]
- Notice on Issuing the Outline of Planning and Construction of Wuhan-Ezhou-Huanggang-Huangshi Core Development Area. Available online: http://fgw.hubei.gov.cn/fbjd/zc/gfwj/gf/202301/t20230104_4475381.shtml (accessed on 10 December 2023).
- Xie, H.; Wang, X.; Wang, Z.; Shi, Z.; Hu, X.; Lin, H.; Xie, X.; Liu, X. Mismatch between infrastructure supply and demand within a 15-minute living circle evaluation in Fuzhou, China. Heliyon 2023, 9, e20130. [Google Scholar] [CrossRef]
- Huang, Y.; Zhou, M. Study on the Spatial Evolution Characteristics, Mechanism and Guiding Strategies of Manufacturing Industry in Wuhan Metropolitan Area. Urban Plan. Forum 2016, 6, 54–64. [Google Scholar]
- Morris, Z.; Weissburg, M.; Bras, B. Ecological network analysis of urban-industrial ecosystems. J. Ind. Ecol. 2021, 25, 193–204. [Google Scholar] [CrossRef]
- Zou, L.; Qiu, C.; Li, H.; Shi, Y. Housing Demand and Supply in the Context of the Transition to a New Development Paradigm. J. Financ. Dev. Res. 2024, 2, 3–15. [Google Scholar]
- Sun, Z.; Yan, X.; Sun, X.; Qiao, Z. Study on the spatial distribution and supporting conditions of living facilities based on POI data—Taking five districts in Jinan as an example. Geogr. Inf. World 2017, 24, 65–70. [Google Scholar]
- Wang, S.; Kong, W.; Ren, L.; Zhi, D.; Dai, B. Misunderstanding and Revision of Domestic Coupling Coordination Degree Model. J. Nat. Resour. 2021, 36, 793–810. [Google Scholar]
- Wang, Y.; Ding, Z.; Yu, M.; Shang, Z.; Song, X.; Chang, X. Quantitative analysis of the coordinated relationship between modern service industry and urbanization based on coupling model—Taking Changshu City, Jiangsu Province as an example. Geogr. Res. 2015, 34, 97–108. [Google Scholar]
- Yang, X.; Zhang, X. Study on Coupling Coordination Degree of Supply and Demand of Medical Service Facilities in China. Chin. Health Econ. 2020, 39, 39–43. [Google Scholar]
- Diakoulaki, D.; Mavrotas, G.; Papayannakis, L. Determining objective weights in multiple criteria problems: The critic method. Comput. Oper. Res. 1995, 22, 763–770. [Google Scholar] [CrossRef]
- Wang, K.; Song, H. Comparative analysis of three objective weighting methods. J. Technol. Econ. Manag. 2003, 6, 48–49. [Google Scholar]
- Xi, W. Comparative Analysis of Three Weighting Methods. China Collect. Econ. 2016, 34, 73–74. [Google Scholar]
- Krishnan, A.; Kasim, M.; Hamid, R.; Ghazali, M. A Modified CRITIC Method to Estimate the Objective Weights of Decision Criteria. Symmetry 2021, 13, 973. [Google Scholar] [CrossRef]
- Shi, Y.; Wang, J.; Zhang, Z. Spatial distribution of air pollution in Xiamen and its spatial correlation with influencing factors. Chin. J. Environ. Eng. 2014, 8, 5406–5412. [Google Scholar]
- Zhan, D.; Zhang, W.; Zhang, J.; Li, J.; Shen, L.; Dang, Y. Analysis on Spatial Agglomeration Characteristics of Beijing Public Service Facilities. Econ. Geogr. 2018, 38, 76–82. [Google Scholar]
- Zhang, X.; Yan, X.; Li, J.; Sun, Y.; Guo, P. Spatial differences in the allocation of public service facilities in downtown Tianjin from the perspective of life circle. J. Arid. Land. Resour. Environ. 2021, 35, 43–51. [Google Scholar]
- Shao, H.; Lv, S.; Cao, C. The Fairness and Influencing Factors of the Spatial Distribution of Public Services in Beijing-Tianjin-Hebei. Sustainability 2023, 15, 9217. [Google Scholar] [CrossRef]
- China Census Yearbook-2020. Available online: http://www.stats.gov.cn/sj/pcsj/rkpc/7rp/indexce.htm (accessed on 30 July 2023).
- Li, Y.; Li, Y.; Zhou, Y.; Shi, Y.; Zhu, X. Investigation of a coupling model of coordination between urbanization and the environment. J. Environ. Manag. 2012, 98, 127–133. [Google Scholar] [CrossRef]
- Wang, M.; Chen, F.; Zhang, D.; Rao, Q.; Li, J.; Tan, S. Supply-Demand Evaluation of Green Stormwater Infrastructure (GSI) Based on the Model of Coupling Coordination. Int. J. Environ. Res. Public Health 2022, 19, 14742. [Google Scholar] [CrossRef]
- Xu, S.; He, W.; Shen, J.; Degefu, D.; Yuan, L.; Kong, Y. Coupling and Coordination Degrees of the Core Water-Energy-Food Nexus in China. Int. J. Environ. Res. Public Health 2019, 16, 1648. [Google Scholar] [CrossRef]
- Song, Q.; Zhou, N.; Liu, T.; Siehr, S.; Qi, Y. Investigation of a “coupling model” of coordination between low-carbon development and urbanization in China. Energy Policy 2018, 121, 346–354. [Google Scholar] [CrossRef]
Disclaimer/Publisher’s Note: The statements, opinions and data contained in all publications are solely those of the individual author(s) and contributor(s) and not of MDPI and/or the editor(s). MDPI and/or the editor(s) disclaim responsibility for any injury to people or property resulting from any ideas, methods, instructions or products referred to in the content. |
© 2024 by the authors. Licensee MDPI, Basel, Switzerland. This article is an open access article distributed under the terms and conditions of the Creative Commons Attribution (CC BY) license (https://creativecommons.org/licenses/by/4.0/).