
The New European Development Scoreboard for SDG11 at the European Level
 ,
,
Abstract
1. Introduction
- O1—Study urban development models in the literature from the perspective of SDG11;
- O2—Data standardization for applying the PCA method;
- O3—Designing the European Scoreboard from an SDG11 perspective using the PCA method;
- O4—Public policy-making on urban development in the European Union.
2. Literature Review
3. Methodology
4. Results and Discussion
- TGE—General Economic Overview Score for country i, i = [1,27] over the analyzed period of 2010–2022;
- —Matrix of own economic vectors for country i in the period;
- En—number of variables considered when determining the score, n = [1,5]; n ϵ {SHDPOV, GDPCAP, LTUNE, LWP, GDERD}.
- TGI—The General Table of Infrastructure Indicators score for country i, i = [1,27] over the period 2010–2022;
- —Matrix of infrastructure eigenvectors for country i in period;
- In—The number of infrastructure variables considered for scoring, n = [1,4]; n ϵ {RTD, BTIPT, LIAH, IUIND}.
- TGM—The score of the General Table of Environmental Indicators for country i, i = [1,27] over the period 2010–2022;
- —Matrix of environmental eigenvectors for country i over the period;
- In—Number of environmental protection variables considered for scoring, n = [1,6]; n ϵ {PHN, PDFP, GMW, NGGE, SREN, EEF}.
- Promoting innovation and increasing the share of R&D spending is a public policy priority that will have the effect of accelerating the development and deployment of green technologies and increasing the sustainability of urban development through the well-being of European cities’ citizens. In this respect, national strategies should focus on effectively exploiting the development options offered by Horizon Europe programs, including by emerging economies, and efficiently implementing innovative projects through country-level collaboration between academia, the private sector and government.
- Another currently underdeveloped public policy is the fight against social inequalities and the promotion of inclusion across the European Community in line with the objectives of the European Strategy on Social Rights. Member States’ national strategies should also focus on financial support from the European Regional Development Fund (ERDF) and the European Social Fund Plus (ESF+). At the urban level, the economic effects of this policy will ensure a more stable and balanced level of well-being of European citizens and will allow the authorities to reallocate funds earmarked for the social protection of disadvantaged citizens towards sustainable community development projects. At the Member State level, depending on the economic score recorded in the scoreboards, policies should be implemented that focus on building social housing and modernizing existing ones, thus reducing inequalities and ensuring a high quality of life for all European citizens. Sound insulation measures and the creation of urban green spaces can also be integrated into urban regeneration strategies financed through the ERDF, contributing to improving the quality of life in urban areas.
- The first category of public policy that we consider necessary is the strengthening of logistics development and transport infrastructure. At the Member State level, this policy should be developed in line with cohesion policies and the funding guidelines provided by the European Regional Development Fund (ERDF). In this respect, national strategies should also incorporate funding for cross-border infrastructure projects (thus taking advantage of the opportunities offered by the Interreg programme) to facilitate cooperation between EU regions. This will enable European regions to improve their connectivity and boost economic growth through the development of road infrastructure that meets high safety and sustainability standards. At the same time, depending on the variations observed between regions, particular attention should be paid to the extension and modernization of the network of motorways and express roads. This will facilitate not only inter-urban mobility but also economic growth with a direct effect on economic development at the European level. Policies should focus on strict construction and maintenance standards to ensure the sustainability and safety of infrastructure, in line with the “traffic fatalities” variable, which emphasizes the importance of road safety.
- Another relevant policy is digital inclusion, which at the national level should take up the facilities offered by the Digital Europe Program and the ERDF, with a particular focus on bridging the digital divide in less developed regions. National policies should focus on expanding high-speed internet networks and promoting digital literacy, ensuring that all citizens have access to the opportunities offered by the digital economy.
- Sustainable waste management and environmental protection should be promoted at the level of each Member State in line with the EU Action Plan for the Circular Economy and with the financial support provided by the European Regional Development Fund and the Cohesion Fund. Member States should implement an effective system of separate waste collection, develop infrastructure for recycling and composting and reduce the environmental impact of waste, in line with the EU’s objectives of reducing pollution and protecting natural resources.
- Promoting green transport and the energy transition in line with the European Green Deal and with the support provided through the Just Transition Fund are very important public policies for all Member States to achieve their targets for renewable energy consumption and energy efficiency in order to make the transition to climate neutrality. Public policies must support the installation of electric vehicle infrastructure and stimulate the purchase of electric vehicles by the population. At the same time, more concrete measures are needed to improve the energy efficiency of buildings and reduce the energy consumption of the population by empowering them and implementing green energy solutions for household consumption.
5. Conclusions
Author Contributions
Funding
Institutional Review Board Statement
Informed Consent Statement
Data Availability Statement
Conflicts of Interest
References
- United Nations Transforming Our World: The 2030 Agenda for Sustainable Development. Available online: https://sdgs.un.org/2030agenda (accessed on 15 August 2024).
- World Health Organization Urban Health. Available online: https://www.who.int/health-topics/urban-health#tab=tab_1 (accessed on 16 August 2024).
- United Nations 68% of the World Population Projected to Live in Urban Areas by 2050. Available online: https://www.un.org/uk/desa/68-world-population-projected-live-urban-areas-2050-says-un (accessed on 18 August 2024).
- Zarco-Soto, I.M.; Zarco-Periñán, P.J.; Sánchez-Durán, R. Influence of Cities Population Size on Their Energy Consumption and CO2 Emissions: The Case of Spain. Environ. Sci. Pollut. Res. 2021, 28, 28146–28167. [Google Scholar] [CrossRef] [PubMed]
- Lomborg, B. Welfare in the 21st Century: Increasing Development, Reducing Inequality, the Impact of Climate Change, and the Cost of Climate Policies. Technol. Forecast. Soc. Change 2020, 156, 119981. [Google Scholar] [CrossRef]
- Smith, G.S.; Anjum, E.; Francis, C.; Deanes, L.; Acey, C. Climate Change, Environmental Disasters, and Health Inequities: The Underlying Role of Structural Inequalities. Curr. Environ. Heal. Rep. 2022, 9, 80–89. [Google Scholar] [CrossRef]
- Han, Y.; He, J.; Liu, D.; Zhao, H.; Huang, J. Inequality in Urban Green Provision: A Comparative Study of Large Cities throughout the World. Sustain. Cities Soc. 2023, 89, 104229. [Google Scholar] [CrossRef]
- World Bank Group Urban Development. Available online: https://www.worldbank.org/en/topic/urbandevelopment/overview (accessed on 15 August 2024).
- McKinsey Global Institute Urban World: Mapping the Economic Power of Cities. Available online: https://www.mckinsey.com/~/media/mckinsey/featured%20insights/urbanization/urban%20world/mgi_urban_world_mapping_economic_power_of_cities_full_report.pdf (accessed on 18 August 2024).
- Koop, S.H.A.; van Leeuwen, C.J. The Challenges of Water, Waste and Climate Change in Cities. Environ. Dev. Sustain. 2017, 19, 385–418. [Google Scholar] [CrossRef]
- Webb, R.; O’Donnell, T.; Auty, K.; Bai, X.; Barnett, G.; Costanza, R.; Dodson, J.; Newman, P.; Newton, P.; Robson, E.; et al. Enabling Urban Systems Transformations: Co-Developing National and Local Strategies. Urban Transform. 2023, 5, 5. [Google Scholar] [CrossRef]
- Teixeira Dias, F.; de Aguiar Dutra, A.R.; Vieira Cubas, A.L.; Ferreira Henckmaier, M.F.; Courval, M.; de Andrade Guerra, J.B.S.O. Sustainable Development with Environmental, Social and Governance: Strategies for Urban Sustainability. Sustain. Dev. 2023, 31, 528–539. [Google Scholar] [CrossRef]
- Gatto, A. A Pluralistic Approach to Economic and Business Sustainability: A Critical Meta-Synthesis of Foundations, Metrics, and Evidence of Human and Local Development. Corp. Soc. Responsib. Environ. Manag. 2020, 27, 1525–1539. [Google Scholar] [CrossRef]
- Zhang, X.; Han, L.; Wei, H.; Tan, X.; Zhou, W.; Li, W.; Qian, Y. Linking Urbanization and Air Quality Together: A Review and a Perspective on the Future Sustainable Urban Development. J. Clean. Prod. 2022, 346, 130988. [Google Scholar] [CrossRef]
- Benites, A.J.; Simões, A.F. Assessing the Urban Sustainable Development Strategy: An Application of a Smart City Services Sustainability Taxonomy. Ecol. Indic. 2021, 127, 107734. [Google Scholar] [CrossRef]
- Puppim de Oliveira, J.A.; Bellezoni, R.A.; Shih, W.; Bayulken, B. Innovations in Urban Green and Blue Infrastructure: Tackling Local and Global Challenges in Cities. J. Clean. Prod. 2022, 362, 132355. [Google Scholar] [CrossRef]
- Hui, C.X.; Dan, G.; Alamri, S.; Toghraie, D. Greening Smart Cities: An Investigation of the Integration of Urban Natural Resources and Smart City Technologies for Promoting Environmental Sustainability. Sustain. Cities Soc. 2023, 99, 104985. [Google Scholar] [CrossRef]
- Arzo, S.; Hong, M. Resilient Green Infrastructure: Navigating Environmental Resistance for Sustainable Development, Social Mobility in Climate Change Policy. Heliyon 2024, 10, e33524. [Google Scholar] [CrossRef] [PubMed]
- Hepburn, C.; Qi, Y.; Stern, N.; Ward, B.; Xie, C.; Zenghelis, D. Towards Carbon Neutrality and China’s 14th Five-Year Plan: Clean Energy Transition, Sustainable Urban Development, and Investment Priorities. Environ. Sci. Ecotechnol. 2021, 8, 100130. [Google Scholar] [CrossRef]
- Rodrigues, M.; Franco, M. The Role of Citizens and Transformation of Energy, Water, and Waste Infrastructure for an Intelligent, Sustainable Environment in Cities. Smart Sustain. Built Environ. 2023, 12, 385–406. [Google Scholar] [CrossRef]
- Choi, C.; Berry, P.; Smith, A. The Climate Benefits, Co-Benefits, and Trade-Offs of Green Infrastructure: A Systematic Literature Review. J. Environ. Manag. 2021, 291, 112583. [Google Scholar] [CrossRef]
- Ying, J.; Zhang, X.; Zhang, Y.; Bilan, S. Green Infrastructure: Systematic Literature Review. Econ. Res. Istraživanja 2022, 35, 343–366. [Google Scholar] [CrossRef]
- Fang, X.; Li, J.; Ma, Q. Integrating Green Infrastructure, Ecosystem Services and Nature-Based Solutions for Urban Sustainability: A Comprehensive Literature Review. Sustain. Cities Soc. 2023, 98, 104843. [Google Scholar] [CrossRef]
- Ding, X.; Liu, X. Renewable Energy Development and Transportation Infrastructure Matters for Green Economic Growth? Empirical Evidence from China. Econ. Anal. Policy 2023, 79, 634–646. [Google Scholar] [CrossRef]
- Kwilinski, A.; Lyulyov, O.; Pimonenko, T. Greenfield Investment as a Catalyst of Green Economic Growth. Energies 2023, 16, 2372. [Google Scholar] [CrossRef]
- Ajayi, A.O.; Amole, O.O. Open Spaces and Wellbeing: The Impact of Outdoor Environments in Promoting Health. Cities Heal. 2022, 6, 1106–1121. [Google Scholar] [CrossRef]
- Shukla, S.; Hait, S. Smart Waste Management Practices in Smart Cities: Current Trends and Future Perspectives; Hussain, C., Hait, S.B.T.-A.O.W.M., Eds.; Elsevier: Amsterdam, The Netherlands, 2022; pp. 407–424. ISBN 978-0-323-85792-5. [Google Scholar]
- Hoang, A.T.; Varbanov, P.S.; Nižetić, S.; Sirohi, R.; Pandey, A.; Luque, R.; Ng, K.H.; Pham, V.V. Perspective Review on Municipal Solid Waste-to-Energy Route: Characteristics, Management Strategy, and Role in Circular Economy. J. Clean. Prod. 2022, 359, 131897. [Google Scholar] [CrossRef]
- Atchike, D.W.; Irfan, M.; Ahmad, M.; Rehman, M.A. Waste-to-Renewable Energy Transition: Biogas Generation for Sustainable Development. Front. Environ. Sci. 2022, 10, 840588. [Google Scholar] [CrossRef]
- Mignogna, D.; Ceci, P.; Cafaro, C.; Corazzi, G.; Avino, P. Production of Biogas and Biomethane as Renewable Energy Sources: A Review. Appl. Sci. 2023, 13, 10219. [Google Scholar] [CrossRef]
- Kabeyi, M.J.B.; Olanrewaju, O.A. Biogas Production and Applications in the Sustainable Energy Transition. J. Energy 2022, 2022, 8750221. [Google Scholar] [CrossRef]
- Rehman, S.; Rehman, E.; Mumtaz, A.; Jianglin, Z. A Multicriteria Decision-Making Approach in Exploring the Nexus Between Wind and Solar Energy Generation, Economic Development, Fossil Fuel Consumption, and CO2 Emissions. Front. Environ. Sci. 2022, 9, 819384. [Google Scholar] [CrossRef]
- Holechek, J.L.; Geli, H.M.E.; Sawalhah, M.N.; Valdez, R. A Global Assessment: Can Renewable Energy Replace Fossil Fuels by 2050? Sustainability 2022, 14, 4792. [Google Scholar] [CrossRef]
- Mostafaeipour, A.; Bidokhti, A.; Fakhrzad, M.-B.; Sadegheih, A.; Zare Mehrjerdi, Y. A New Model for the Use of Renewable Electricity to Reduce Carbon Dioxide Emissions. Energy 2022, 238, 121602. [Google Scholar] [CrossRef]
- Singh, M.K.; Malek, J.; Sharma, H.K.; Kumar, R. Converting the Threats of Fossil Fuel-Based Energy Generation into Opportunities for Renewable Energy Development in India. Renew. Energy 2024, 224, 120153. [Google Scholar] [CrossRef]
- Zhou, Y. Worldwide Carbon Neutrality Transition? Energy Efficiency, Renewable, Carbon Trading and Advanced Energy Policies. Energy Rev. 2023, 2, 100026. [Google Scholar] [CrossRef]
- Ulpiani, G.; Vetters, N.; Shtjefni, D.; Kakoulaki, G.; Taylor, N. Let’s Hear It from the Cities: On the Role of Renewable Energy in Reaching Climate Neutrality in Urban Europe. Renew. Sustain. Energy Rev. 2023, 183, 113444. [Google Scholar] [CrossRef]
- Vijayan, D.S.; Koda, E.; Sivasuriyan, A.; Winkler, J.; Devarajan, P.; Kumar, R.S.; Jakimiuk, A.; Osinski, P.; Podlasek, A.; Vaverková, M.D. Advancements in Solar Panel Technology in Civil Engineering for Revolutionizing Renewable Energy Solutions—A Review. Energies 2023, 16, 6579. [Google Scholar] [CrossRef]
- Mega, V. A New Social Contract for Healthy, Safe and Happy Cities for All. In Human Sustainable Cities: Towards the SDGs and Green, Just, Smart and Inclusive Transitions; Mega, V., Ed.; Springer International Publishing: Cham, Switzerland, 2022; pp. 165–194. ISBN 978-3-031-04840-1. [Google Scholar]
- Winston, N. Sustainable Community Development: Integrating Social and Environmental Sustainability for Sustainable Housing and Communities. Sustain. Dev. 2022, 30, 191–202. [Google Scholar] [CrossRef]
- Harris, P.; Fisher, M.; Friel, S.; Sainsbury, P.; Harris, E.; De Leeuw, E.; Baum, F. City Deals and Health Equity in Sydney, Australia. Health Place 2022, 73, 102711. [Google Scholar] [CrossRef]
- Collins, D.; de Vos, E.; Evans, J.; Severson Mason, M.; Anderson-Baron, J.; Cruickshank, V.; McDowell, K. “When We Do Evict Them, It’s a Last Resort”: Eviction Prevention in Social and Affordable Housing. Hous. Policy Debate 2022, 32, 473–490. [Google Scholar] [CrossRef]
- Frątczak-Müller, J. Innovative Housing Policy and (Vulnerable) Residents’ Quality of Life. Front. Psychol. 2022, 13, 751208. [Google Scholar] [CrossRef]
- Gerőházi, É.; Katona, N.; Kollár, S.G. Mechanisms Linking Economic Potential of European Cities to Housing Inequalities of Young People. Front. Sustain. Cities 2023, 5, 1163984. [Google Scholar] [CrossRef]
- Kössl, G. Affordable Housing and Social Inclusion—The Case of Vienna and Austria. In Future Urban Habitation; Wiley: Hoboken, NJ, USA, 2022; pp. 115–129. ISBN 9781119734895. [Google Scholar]
- Iton, A.; Ross, R.K.; Tamber, P.S. Building Community Power to Dismantle Policy-Based Structural Inequity in Population Health. Health Aff. 2022, 41, 1763–1771. [Google Scholar] [CrossRef] [PubMed]
- Grimm, B.; Ramos, A.K.; Maloney, S.; Abresch, C.; Tibbits, M.; Lyons, K.; Palm, D. The Most Important Skills Required by Local Public Health Departments for Responding to Community Needs and Improving Health Outcomes. J. Community Health 2022, 47, 79–86. [Google Scholar] [CrossRef]
- Mezzanotte, C. The Social and Economic Rationale of Inclusive Education. In OECD Education Working Papers; OECD Publishing: Paris, France, 2022. [Google Scholar] [CrossRef]
- Kim, J.; Florian, L.; Pantić, N. The Development of Inclusive Practice under a Policy of Integration. Int. J. Incl. Educ. 2022, 26, 1068–1083. [Google Scholar] [CrossRef]
- Craig, L. Gender, Economics, and Unpaid Work. In Encyclopedia of Business and Professional Ethics; Poff, D.C., Michalos, A.C., Eds.; Springer International Publishing: Cham, Switzerland, 2023; pp. 961–964. ISBN 978-3-030-22767-8. [Google Scholar]
- Zammitti, A.; Valbusa, I.; Santilli, S.; Ginevra, M.C.; Soresi, S.; Nota, L. Development and Validation of the Decent Work for Inclusive and Sustainable Future Construction Scale in Italy. Sustainability 2023, 15, 11749. [Google Scholar] [CrossRef]
- Abu-Rayash, A.; Dincer, I. Development of Integrated Sustainability Performance Indicators for Better Management of Smart Cities. Sustain. Cities Soc. 2021, 67, 102704. [Google Scholar] [CrossRef]
- Bibri, S.E. Data-Driven Smart Eco-Cities of the Future: An Empirically Informed Integrated Model for Strategic Sustainable Urban Development. World Futures 2023, 79, 703–746. [Google Scholar] [CrossRef]
- Russo, F.; Rindone, C. Smart City for Sustainable Development: Applied Processes from SUMP to MaaS at European Level. Appl. Sci. 2023, 13, 1773. [Google Scholar] [CrossRef]
- Kumar, S.; Banerji, H. Bayesian Network Modeling for Economic-Socio-Cultural Sustainability of Neighborhood-Level Urban Communities: Reflections from Kolkata, an Indian Megacity. Sustain. Cities Soc. 2022, 78, 103632. [Google Scholar] [CrossRef]
- Musa, A.A.; Malami, S.I.; Alanazi, F.; Ounaies, W.; Alshammari, M.; Haruna, S.I. Sustainable Traffic Management for Smart Cities Using Internet-of-Things-Oriented Intelligent Transportation Systems (ITS): Challenges and Recommendations. Sustainability 2023, 15, 9859. [Google Scholar] [CrossRef]
- Faheem, H.; Shorbagy, A.; Gabr, M. Impact of Traffic Congestion on Transportation System: Challenges and Remediations—A Review. Mansoura Eng. J. 2024, 49, 18. [Google Scholar] [CrossRef]
- Wang, Z.; Han, Q.; De Vries, B. Land Use Spatial Optimization Using Accessibility Maps to Integrate Land Use and Transport in Urban Areas. Appl. Spat. Anal. Policy 2022, 15, 1193–1217. [Google Scholar] [CrossRef]
- Al-Hadidi, S.; Sweis, G.; Abu-Khader, W.; Abu-Rumman, G.; Sweis, R. Managing Future Urbanization Growth Patterns Using Genetic Algorithm Modeling. Eng. Constr. Archit. Manag. 2024, 31, 2648–2668. [Google Scholar] [CrossRef]
- Darjee, K.B.; Neupane, P.R.; Köhl, M. Proactive Adaptation Responses by Vulnerable Communities to Climate Change Impacts. Sustainability 2023, 15, 10952. [Google Scholar] [CrossRef]
- Rezvani, S.M.H.S.; de Almeida, N.M.; Falcão, M.J. Climate Adaptation Measures for Enhancing Urban Resilience. Buildings 2023, 13, 2163. [Google Scholar] [CrossRef]
- Mabrouk, M.; Han, H.; Fan, C.; Abdrabo, K.I.; Shen, G.; Saber, M.; Kantoush, S.A.; Sumi, T. Assessing the Effectiveness of Nature-Based Solutions-Strengthened Urban Planning Mechanisms in Forming Flood-Resilient Cities. J. Environ. Manag. 2023, 344, 118260. [Google Scholar] [CrossRef]
- Jiang, N.; Jiang, W. How Does Regional Integration Policy Affect Urban Resilience? Evidence from Urban Agglomeration in China. Environ. Impact Assess. Rev. 2024, 104, 107298. [Google Scholar] [CrossRef]
- Alizadeh, H.; Sharifi, A. Toward a Societal Smart City: Clarifying the Social Justice Dimension of Smart Cities. Sustain. Cities Soc. 2023, 95, 104612. [Google Scholar] [CrossRef]
- Anthony, B. The Role of Community Engagement in Urban Innovation Towards the Co-Creation of Smart Sustainable Cities. J. Knowl. Econ. 2024, 15, 1592–1624. [Google Scholar] [CrossRef]
- Takano, T.; Morita, H.; Nakamura, S.; Togawa, T.; Kachi, N.; Kato, H.; Hayashi, Y. Evaluating the Quality of Life for Sustainable Urban Development. Cities 2023, 142, 104561. [Google Scholar] [CrossRef]
- Bittencourt, T.A.; Giannotti, M. Evaluating the Accessibility and Availability of Public Services to Reduce Inequalities in Everyday Mobility. Transp. Res. Part A Policy Pract. 2023, 177, 103833. [Google Scholar] [CrossRef]
- Rojas-Rueda, D.; Morales-Zamora, E. Equitable Urban Planning: Harnessing the Power of Comprehensive Plans. Curr. Environ. Heal. Rep. 2023, 10, 125–136. [Google Scholar] [CrossRef] [PubMed]
- Kherif, F.; Latypova, A. Principal Component Analysis; Mechelli, A., Vieira, S.B.T.-M.L., Eds.; Academic Press: New York, NY, USA, 2020; pp. 209–225. ISBN 978-0-12-815739-8. [Google Scholar]
- Mohammadnazari, Z.; Aghsami, A.; Rabbani, M. A Hybrid Novel Approach for Evaluation of Resiliency and Sustainability in Construction Environment Using Data Envelopment Analysis, Principal Component Analysis, and Mathematical Formulation. Environ. Dev. Sustain. 2023, 25, 4453–4490. [Google Scholar] [CrossRef]
- Bovkir, R.; Ustaoglu, E.; Aydinoglu, A.C. Assessment of Urban Quality of Life Index at Local Scale with Different Weighting Approaches. Soc. Indic. Res. 2023, 165, 655–678. [Google Scholar] [CrossRef]
- Cartone, A.; Postiglione, P. Principal Component Analysis for Geographical Data: The Role of Spatial Effects in the Definition of Composite Indicators. Spat. Econ. Anal. 2021, 16, 126–147. [Google Scholar] [CrossRef]
- Wang, T.; Zhang, F.; Gu, H.; Hu, H.; Kaur, M. A Research Study on New Energy Brand Users Based on Principal Component Analysis (PCA) and Fusion Target Planning Model for Sustainable Environment of Smart Cities. Sustain. Energy Technol. Assess. 2023, 57, 103262. [Google Scholar] [CrossRef]
- Palit, T.; Bari, A.B.M.M.; Karmaker, C.L. An Integrated Principal Component Analysis and Interpretive Structural Modeling Approach for Electric Vehicle Adoption Decisions in Sustainable Transportation Systems. Decis. Anal. J. 2022, 4, 100119. [Google Scholar] [CrossRef]
- Karji, A.; Namian, M.; Tafazzoli, M. Identifying the Key Barriers to Promote Sustainable Construction in the United States: A Principal Component Analysis. Sustainability 2020, 12, 5088. [Google Scholar] [CrossRef]
- Wanke, P.F.; Yazdi, A.K.; Hanne, T.; Tan, Y. Unveiling Drivers of Sustainability in Chinese Transport: An Approach Based on Principal Component Analysis and Neural Networks. Transp. Plan. Technol. 2023, 46, 573–598. [Google Scholar] [CrossRef]
- Wang, B.; Chen, T. Social Progress beyond GDP: A Principal Component Analysis (PCA) of GDP and Twelve Alternative Indicators. Sustainability 2022, 14, 6430. [Google Scholar] [CrossRef]
- Cling, J.-P.; Delecourt, C. Interlinkages between the Sustainable Development Goals. World Dev. Perspect. 2022, 25, 100398. [Google Scholar] [CrossRef]
- Yin, C.; Zhao, W.; Fu, B.; Meadows, M.E.; Pereira, P. Key Axes of Global Progress towards the Sustainable Development Goals. J. Clean. Prod. 2023, 385, 135767. [Google Scholar] [CrossRef]
- Trane, M.; Marelli, L.; Siragusa, A.; Pollo, R.; Lombardi, P. Progress by Research to Achieve the Sustainable Development Goals in the EU: A Systematic Literature Review. Sustainability 2023, 15, 7055. [Google Scholar] [CrossRef]
- Michalina, D.; Mederly, P.; Diefenbacher, H.; Held, B. Sustainable Urban Development: A Review of Urban Sustainability Indicator Frameworks. Sustainability 2021, 13, 9348. [Google Scholar] [CrossRef]
- Wang, J.; Biljecki, F. Unsupervised Machine Learning in Urban Studies: A Systematic Review of Applications. Cities 2022, 129, 103925. [Google Scholar] [CrossRef]
- Merino-Saum, A.; Halla, P.; Superti, V.; Boesch, A.; Binder, C. Indicators for Urban Sustainability: Key Lessons from a Systematic Analysis of 67 Measurement Initiatives. Ecol. Indic. 2020, 119, 106879. [Google Scholar] [CrossRef]
- Simonnet-Laprade, C.; Bayen, S.; Le Bizec, B.; Dervilly, G. Data Analysis Strategies for the Characterization of Chemical Contaminant Mixtures. Fish as a Case Study. Environ. Int. 2021, 155, 106610. [Google Scholar] [CrossRef]
- Lamichhane, S.; Eğilmez, G.; Gedik, R.; Bhutta, M.K.S.; Erenay, B. Benchmarking OECD Countries’ Sustainable Development Performance: A Goal-Specific Principal Component Analysis Approach. J. Clean. Prod. 2021, 287, 125040. [Google Scholar] [CrossRef]
- Yamasaki, K.; Yamada, T. A Framework to Assess the Local Implementation of Sustainable Development Goal 11. Sustain. Cities Soc. 2022, 84, 104002. [Google Scholar] [CrossRef]
- Jain, A.; Gue, I.H.; Jain, P. Research Trends, Themes, and Insights on Artificial Neural Networks for Smart Cities towards SDG-11. J. Clean. Prod. 2023, 412, 137300. [Google Scholar] [CrossRef]
- Qi, W.; Ma, C.; Xu, H.; Zhao, K.; Chen, Z. A Comprehensive Analysis Method of Spatial Prioritization for Urban Flood Management Based on Source Tracking. Ecol. Indic. 2022, 135, 108565. [Google Scholar] [CrossRef]
- Kourtzanidis, K.; Angelakoglou, K.; Apostolopoulos, V.; Giourka, P.; Nikolopoulos, N. Assessing Impact, Performance and Sustainability Potential of Smart City Projects: Towards a Case Agnostic Evaluation Framework. Sustainability 2021, 13, 7395. [Google Scholar] [CrossRef]
- Maqbool, R.; Jowett, E. Conserving a Sustainable Urban Environment through Energy Security and Project Management Practices. Environ. Sci. Pollut. Res. 2023, 30, 81858–81880. [Google Scholar] [CrossRef]
- Suárez, M.; Benayas, J.; Justel, A.; Sisto, R.; Montes, C.; Sanz-Casado, E. A Holistic Index-Based Framework to Assess Urban Resilience: Application to the Madrid Region, Spain. Ecol. Indic. 2024, 166, 112293. [Google Scholar] [CrossRef]
- Mekonnen, G.B.; dos Muchangos, L.S.; Ito, L.; Tokai, A. Reducing Waste Management Scenario Space for Developing Countries: A Hierarchical Clustering on Principal Components Approach. Waste Manag. Res. 2023, 41, 1622–1631. [Google Scholar] [CrossRef] [PubMed]
- Xia, R.; Wei, D.; Jiang, H.; Ding, Y.; Luo, X.; Yin, J. Research on the Coordinated Development and Convergence Characteristics of China’s Urban Competitiveness and Green Total Factor Productivity. Ecol. Indic. 2024, 161, 111954. [Google Scholar] [CrossRef]
- Eurostat Severe Housing Deprivation Rate by Poverty Status. Available online: https://ec.europa.eu/eurostat/databrowser/view/sdg_11_11/default/table?lang=en&category=sdg.sdg_11 (accessed on 15 August 2024).
- Eurostat Real GDP per Capita. Available online: https://ec.europa.eu/eurostat/databrowser/view/sdg_08_10/default/table?lang=en (accessed on 16 August 2024).
- Eurostat Long-Term Unemployment Rate by Sex. Available online: https://ec.europa.eu/eurostat/databrowser/view/tesem130/default/table?lang=en (accessed on 18 August 2024).
- Eurostat Real Labour Productivity per Person Employed—Annual Data. Available online: https://ec.europa.eu/eurostat/databrowser/view/tipsna70/default/table?lang=en (accessed on 15 August 2024).
- Eurostat Gross Domestic Expenditure on Research and Development (R&D). Available online: https://ec.europa.eu/eurostat/databrowser/view/tipsst10/default/table?lang=en (accessed on 15 August 2024).
- Eurostat Road Traffic Deaths, by Type of Roads. Available online: https://ec.europa.eu/eurostat/databrowser/view/sdg_11_40/default/table?lang=en&category=sdg.sdg_11 (accessed on 15 August 2024).
- Eurostat Share of Buses and Trains in Inland Passenger Transport. Available online: https://ec.europa.eu/eurostat/databrowser/view/sdg_09_50/default/table?lang=en&category=sdg.sdg_11 (accessed on 15 August 2024).
- Eurostat Level of Internet Access—Households. Available online: https://ec.europa.eu/eurostat/databrowser/view/tin00134/default/table?lang=en&category=t_isoc.t_isoc_i.t_isoc_ici (accessed on 15 August 2024).
- Eurostat Internet Use by Individuals. Available online: https://ec.europa.eu/eurostat/databrowser/view/tin00028/default/table?lang=en&category=t_isoc.t_isoc_i.t_isoc_iiu (accessed on 15 August 2024).
- Eurostat Population Living in Households Considering That They Suffer from Noise, by Poverty Status. Available online: https://ec.europa.eu/eurostat/databrowser/view/sdg_11_20/default/table?lang=en&category=sdg.sdg_11 (accessed on 15 August 2024).
- Eurostat Premature Deaths Due to Exposure to Fine Particulate Matter (PM2.5). Available online: https://ec.europa.eu/eurostat/databrowser/view/sdg_11_52/default/table?lang=en&category=sdg.sdg_11 (accessed on 15 August 2024).
- Eurostat Generation of Municipal Waste per Capita. Available online: https://ec.europa.eu/eurostat/databrowser/view/cei_pc031/default/table?lang=en (accessed on 15 August 2024).
- Eurostat Net Greenhouse Gas Emissions. Available online: https://ec.europa.eu/eurostat/databrowser/view/sdg_13_10/default/table?lang=en (accessed on 15 August 2024).
- Eurostat Share of Renewable Energy in Gross Final Energy Consumption by Sector. Available online: https://ec.europa.eu/eurostat/databrowser/view/sdg_07_40/default/table?lang=en (accessed on 15 August 2024).
- Eurostat Energy Efficiency. Available online: https://ec.europa.eu/eurostat/databrowser/view/nrg_ind_eff/default/table?lang=en (accessed on 15 August 2024).


| Section | Symbol | Description | Source |
|---|---|---|---|
| Economic indicators on SDG11 | SHDPOV | Severe housing deprivation rate by poverty status (Percentage) | Eurostat [94] |
| GDPCAP | Real GDP per capita (euro per capita) | Eurostat [95] | |
| LTUNE | Long-term unemployment rate (Percentage) | Eurostat [96] | |
| LWP | Labor productivity per person employed and hour worked (Nominal labor productivity per person) | Eurostat [97] | |
| GDERD | Gross domestic expenditure on R&D Percentage of gross domestic product (Percentage of GDP) | Eurostat [98] | |
| Infrastructure indicators on SDG11 | RTD | Road traffic deaths, by type of roads (Percentage) | Eurostat [99] |
| BTIPT | Share of buses and trains in inland passenger transport (Percentage) | Eurostat [100] | |
| LIAH | Level of internet access—household-(Percentage) | Eurostat [101] | |
| IUIND | Internet use by individuals (Percentage of individuals) | Eurostat [102] | |
| Environmental indicators on SDG11 | PHN | Population living in households considering that they suffer from noise, by poverty status (Percentage) | Eurostat [103] |
| PDFP | Premature deaths due to exposure to fine particulate matter (Percentage) | Eurostat [104] | |
| GMW | Generation of municipal waste per capita (Kilograms per capita) | Eurostat [105] | |
| NGGE | Net greenhouse gas emissions (Tonnes per capita) | Eurostat [106] | |
| SREN | Share of renewable energy in gross final energy consumption (Percentage) | Eurostat [107] | |
| EEF | Energy efficiency of primary energy consumption (million tons of oil equivalent) | Eurostat [108] |
| Indicators | SHDPOV | PHN | RTD | PDFP | BTIPT | GMW | LIAH | IUIND | GDPCAP | LTUNE | LWP | NGGE | SREN | EEF | GDERD |
|---|---|---|---|---|---|---|---|---|---|---|---|---|---|---|---|
| Belgium | 0.92 | 0.845 | 0.939 | 0.808 | 0.851 | 0.591 | 0.967 | 0.974 | 0.751 | 0.936 | 0.971 | 0.95 | 0.972 | 0.926 | 0.979 |
| Bulgaria | 0.99 | 0.967 | 0.636 | 0.86 | 0.945 | 0.805 | 0.995 | 0.989 | 0.976 | 0.814 | 0.97 | 0.849 | 0.959 | 0.939 | 0.881 |
| Czech Republic | 0.958 | 0.834 | 0.868 | 0.852 | 0.847 | 0.95 | 0.975 | 0.965 | 0.961 | 0.982 | 0.963 | 0.952 | 0.975 | 0.892 | 0.844 |
| Denmark | 0.498 | 0.839 | 0.941 | 0.696 | 0.853 | 0.944 | 0.766 | 0.939 | 0.923 | 0.9 | 0.875 | 0.976 | 0.889 | 0.902 | 0.849 |
| Germany | 0.884 | 0.934 | 0.9 | 0.95 | 0.919 | 0.968 | 0.972 | 0.985 | 0.909 | 0.991 | 0.887 | 0.932 | 0.991 | 0.882 | 0.966 |
| Estonia | 0.687 | 0.822 | 0.813 | 0.782 | 0.814 | 0.873 | 0.954 | 0.974 | 0.959 | 0.94 | 0.879 | 0.844 | 0.838 | 0.805 | 0.782 |
| Ireland | 0.811 | 0.809 | 0.824 | 0.794 | 0.747 | 0.886 | 0.962 | 0.904 | 0.986 | 0.914 | 0.982 | 0.874 | 0.875 | 0.94 | 0.95 |
| Greece | 0.915 | 0.689 | 0.986 | 0.788 | 0.878 | 0.907 | 0.982 | 0.977 | 0.918 | 0.936 | 0.932 | 0.966 | 0.966 | 0.955 | 0.983 |
| Spain | 0.829 | 0.834 | 0.953 | 0.523 | 0.791 | 0.976 | 0.991 | 0.995 | 0.939 | 0.908 | 0.938 | 0.97 | 0.965 | 0.933 | 0.957 |
| France | 0.901 | 0.851 | 0.965 | 0.94 | 0.922 | 0.585 | 0.992 | 0.983 | 0.943 | 0.7 | 0.69 | 0.936 | 0.955 | 0.926 | 0.946 |
| Croatia | 0.956 | 0.877 | 0.91 | 0.725 | 0.578 | 0.967 | 0.946 | 0.967 | 0.966 | 0.905 | 0.92 | 0.875 | 0.917 | 0.93 | 0.918 |
| Italy | 0.686 | 0.829 | 0.94 | 0.665 | 0.933 | 0.938 | 0.967 | 0.943 | 0.938 | 0.746 | 0.969 | 0.959 | 0.964 | 0.902 | 0.953 |
| Cyprus | 0.838 | 0.867 | 0.684 | 0.698 | 0.908 | 0.952 | 0.99 | 0.987 | 0.982 | 0.871 | 0.891 | 0.901 | 0.976 | 0.949 | 0.967 |
| Latvia | 0.95 | 0.955 | 0.709 | 0.832 | 0.912 | 0.945 | 0.992 | 0.995 | 0.984 | 0.917 | 0.984 | 0.915 | 0.92 | 0.961 | 0.635 |
| Lithuania | 0.865 | 0.807 | 0.951 | 0.665 | 0.761 | 0.905 | 0.989 | 0.982 | 0.988 | 0.948 | 0.968 | 0.966 | 0.866 | 0.559 | 0.843 |
| Luxembourg | 0.875 | 0.685 | 0.838 | 0.939 | 0.676 | 0.904 | 0.869 | 0.905 | 0.481 | 0.907 | 0.934 | 0.971 | 0.963 | 0.887 | 0.854 |
| Hungary | 0.905 | 0.818 | 0.782 | 0.659 | 0.948 | 0.745 | 0.975 | 0.929 | 0.923 | 0.98 | 0.879 | 0.961 | 0.809 | 0.94 | 0.742 |
| Malta | 0.841 | 0.772 | 0.535 | 0.752 | 0.923 | 0.734 | 0.988 | 0.986 | 0.959 | 0.965 | 0.738 | 0.962 | 0.997 | 0.747 | 0.73 |
| Netherlands | 0.839 | 0.902 | 0.903 | 0.912 | 0.968 | 0.891 | 0.955 | 0.832 | 0.904 | 0.906 | 0.873 | 0.941 | 0.98 | 0.788 | 0.975 |
| Austria | 0.84 | 0.801 | 0.95 | 0.919 | 0.958 | 0.972 | 0.988 | 0.953 | 0.917 | 0.978 | 0.924 | 0.912 | 0.922 | 0.935 | 0.953 |
| Poland | 0.932 | 0.917 | 0.917 | 0.98 | 0.856 | 0.854 | 0.987 | 0.977 | 0.976 | 0.899 | 0.964 | 0.91 | 0.911 | 0.954 | 0.984 |
| Portugal | 0.865 | 0.795 | 0.983 | 0.911 | 0.918 | 0.889 | 0.985 | 0.993 | 0.984 | 0.944 | 0.953 | 0.848 | 0.942 | 0.987 | 0.927 |
| Romania | 0.978 | 0.939 | 0.989 | 0.954 | 0.931 | 0.967 | 0.994 | 0.993 | 0.97 | 0.915 | 0.989 | 0.977 | 0.981 | 0.947 | 0.914 |
| Slovenia | 0.846 | 0.904 | 0.775 | 0.825 | 0.863 | 0.848 | 0.974 | 0.967 | 0.918 | 0.937 | 0.94 | 0.913 | 0.883 | 0.886 | 0.933 |
| Slovakia | 0.775 | 0.975 | 0.692 | 0.778 | 0.973 | 0.971 | 0.964 | 0.944 | 0.961 | 0.973 | 0.92 | 0.915 | 0.903 | 0.854 | 0.646 |
| Finland | 0.916 | 0.761 | 0.834 | 0.844 | 0.889 | 0.947 | 0.969 | 0.97 | 0.887 | 0.717 | 0.531 | 0.924 | 0.972 | 0.958 | 0.978 |
| Sweden | 0.898 | 0.657 | 0.867 | 0.866 | 0.904 | 0.944 | 0.904 | 0.883 | 0.939 | 0.856 | 0.819 | 0.939 | 0.982 | 0.912 | 0.912 |
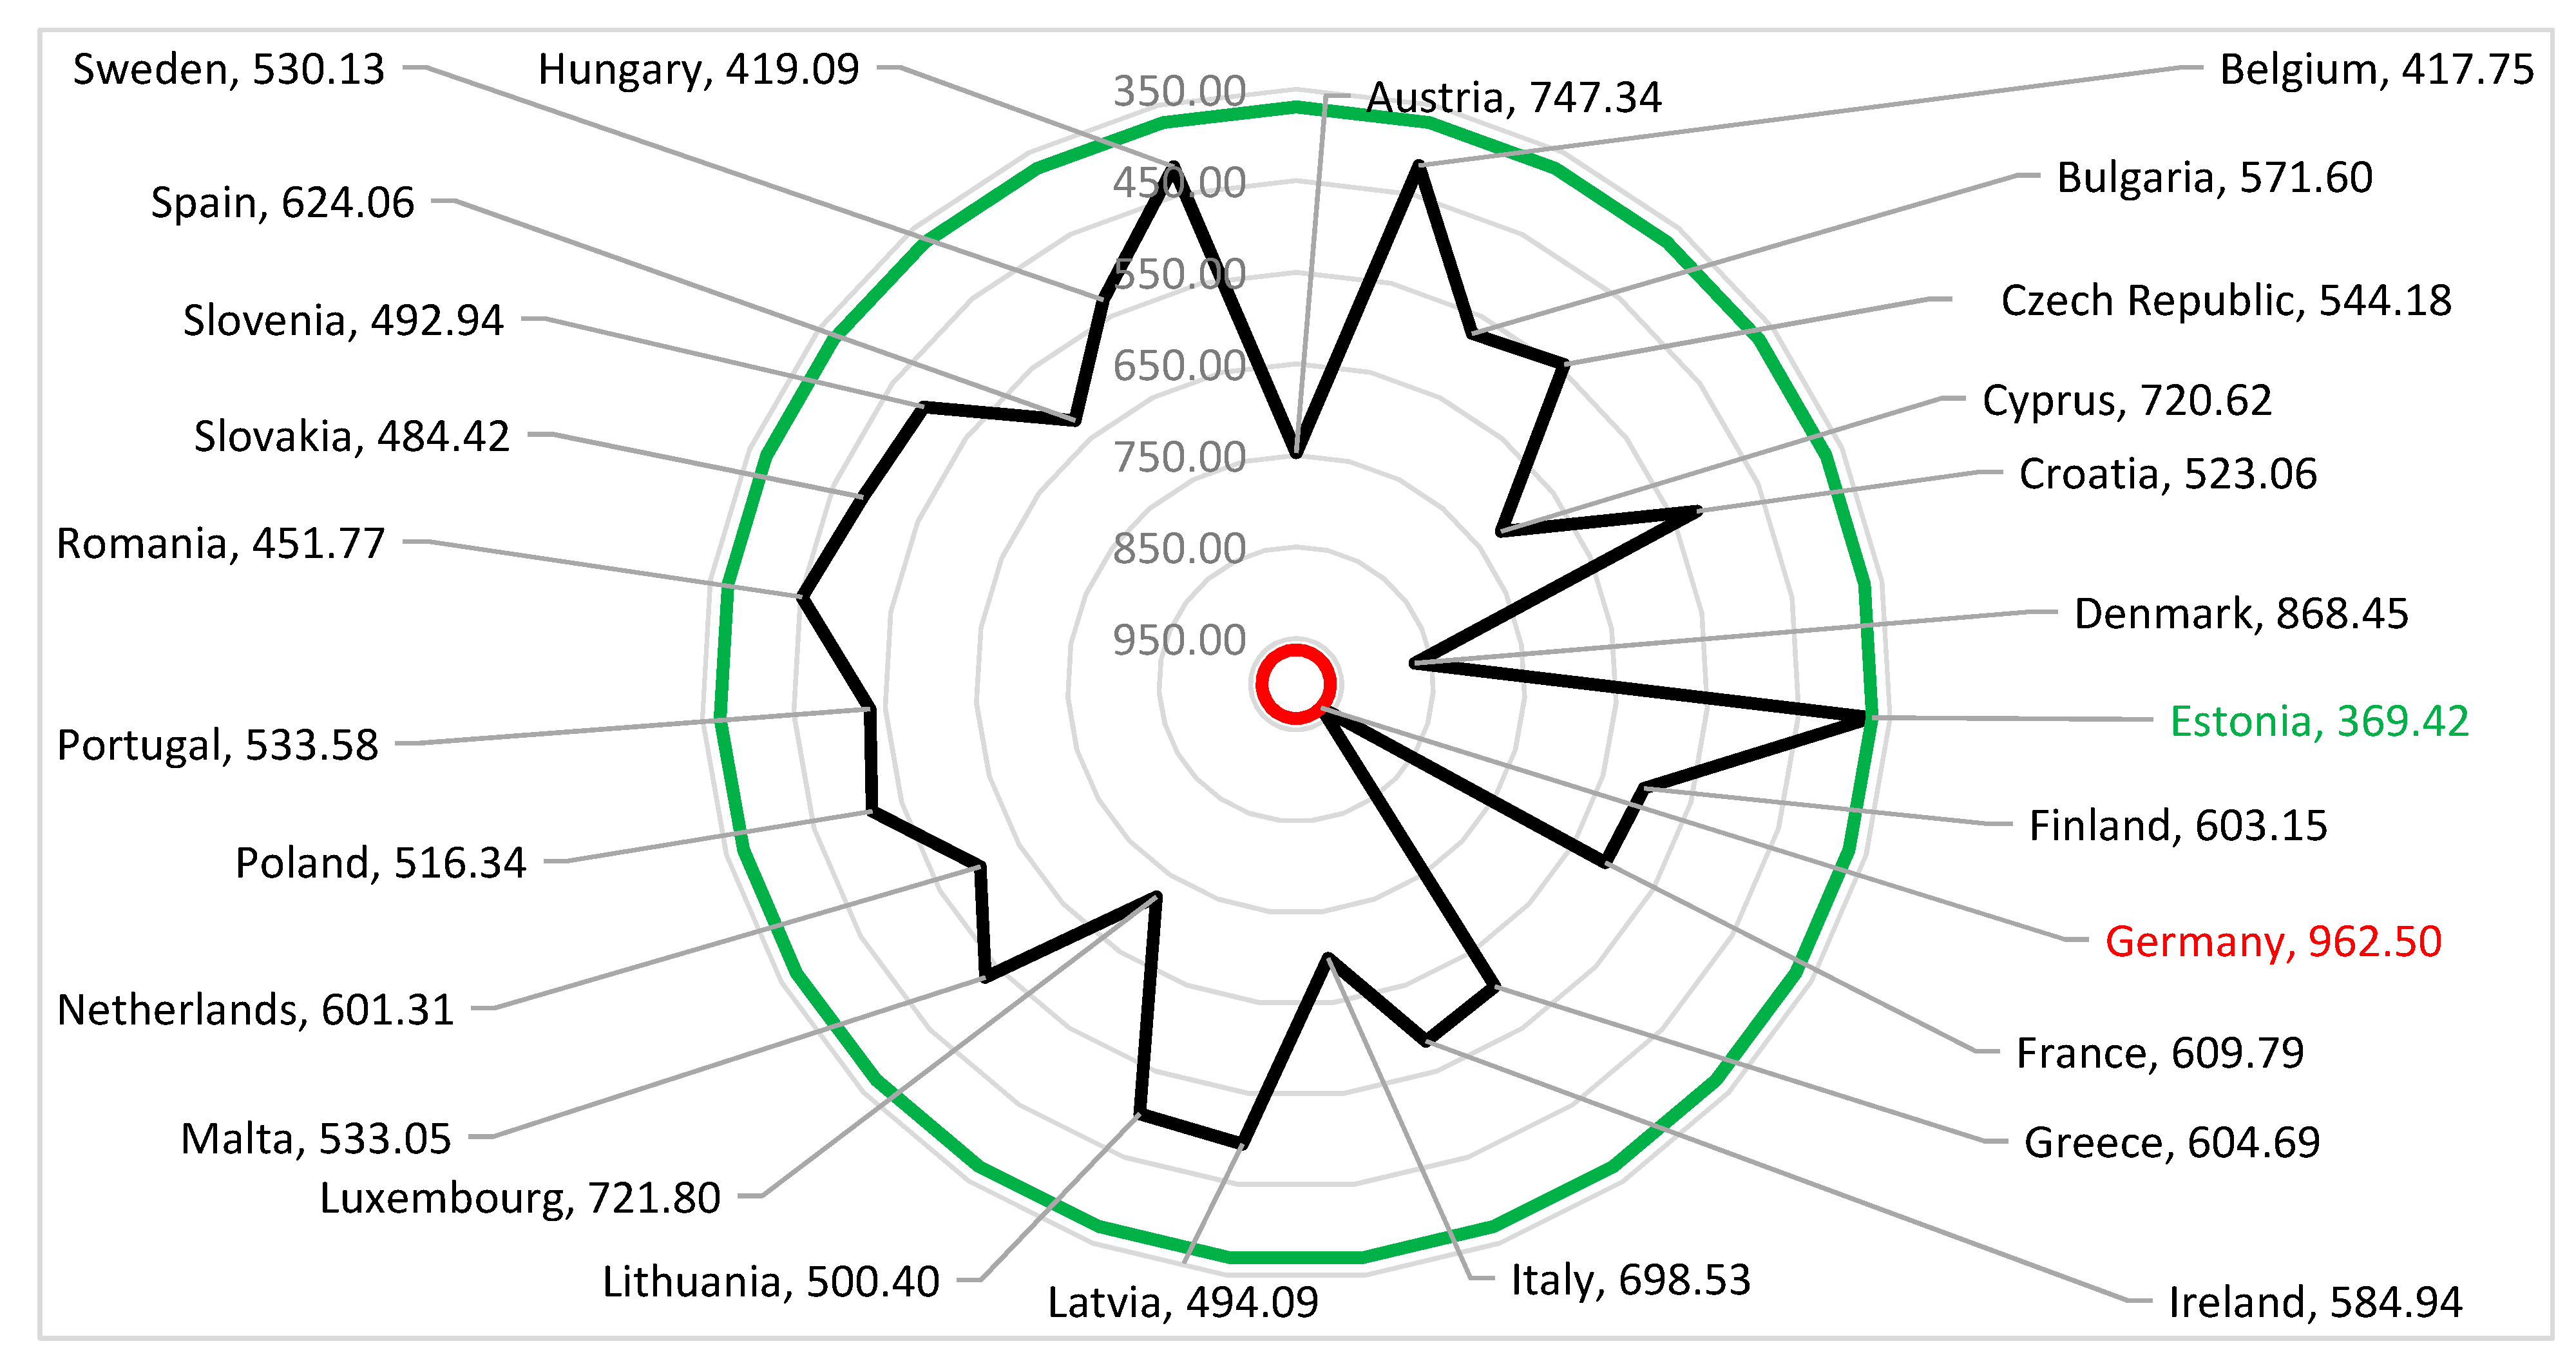
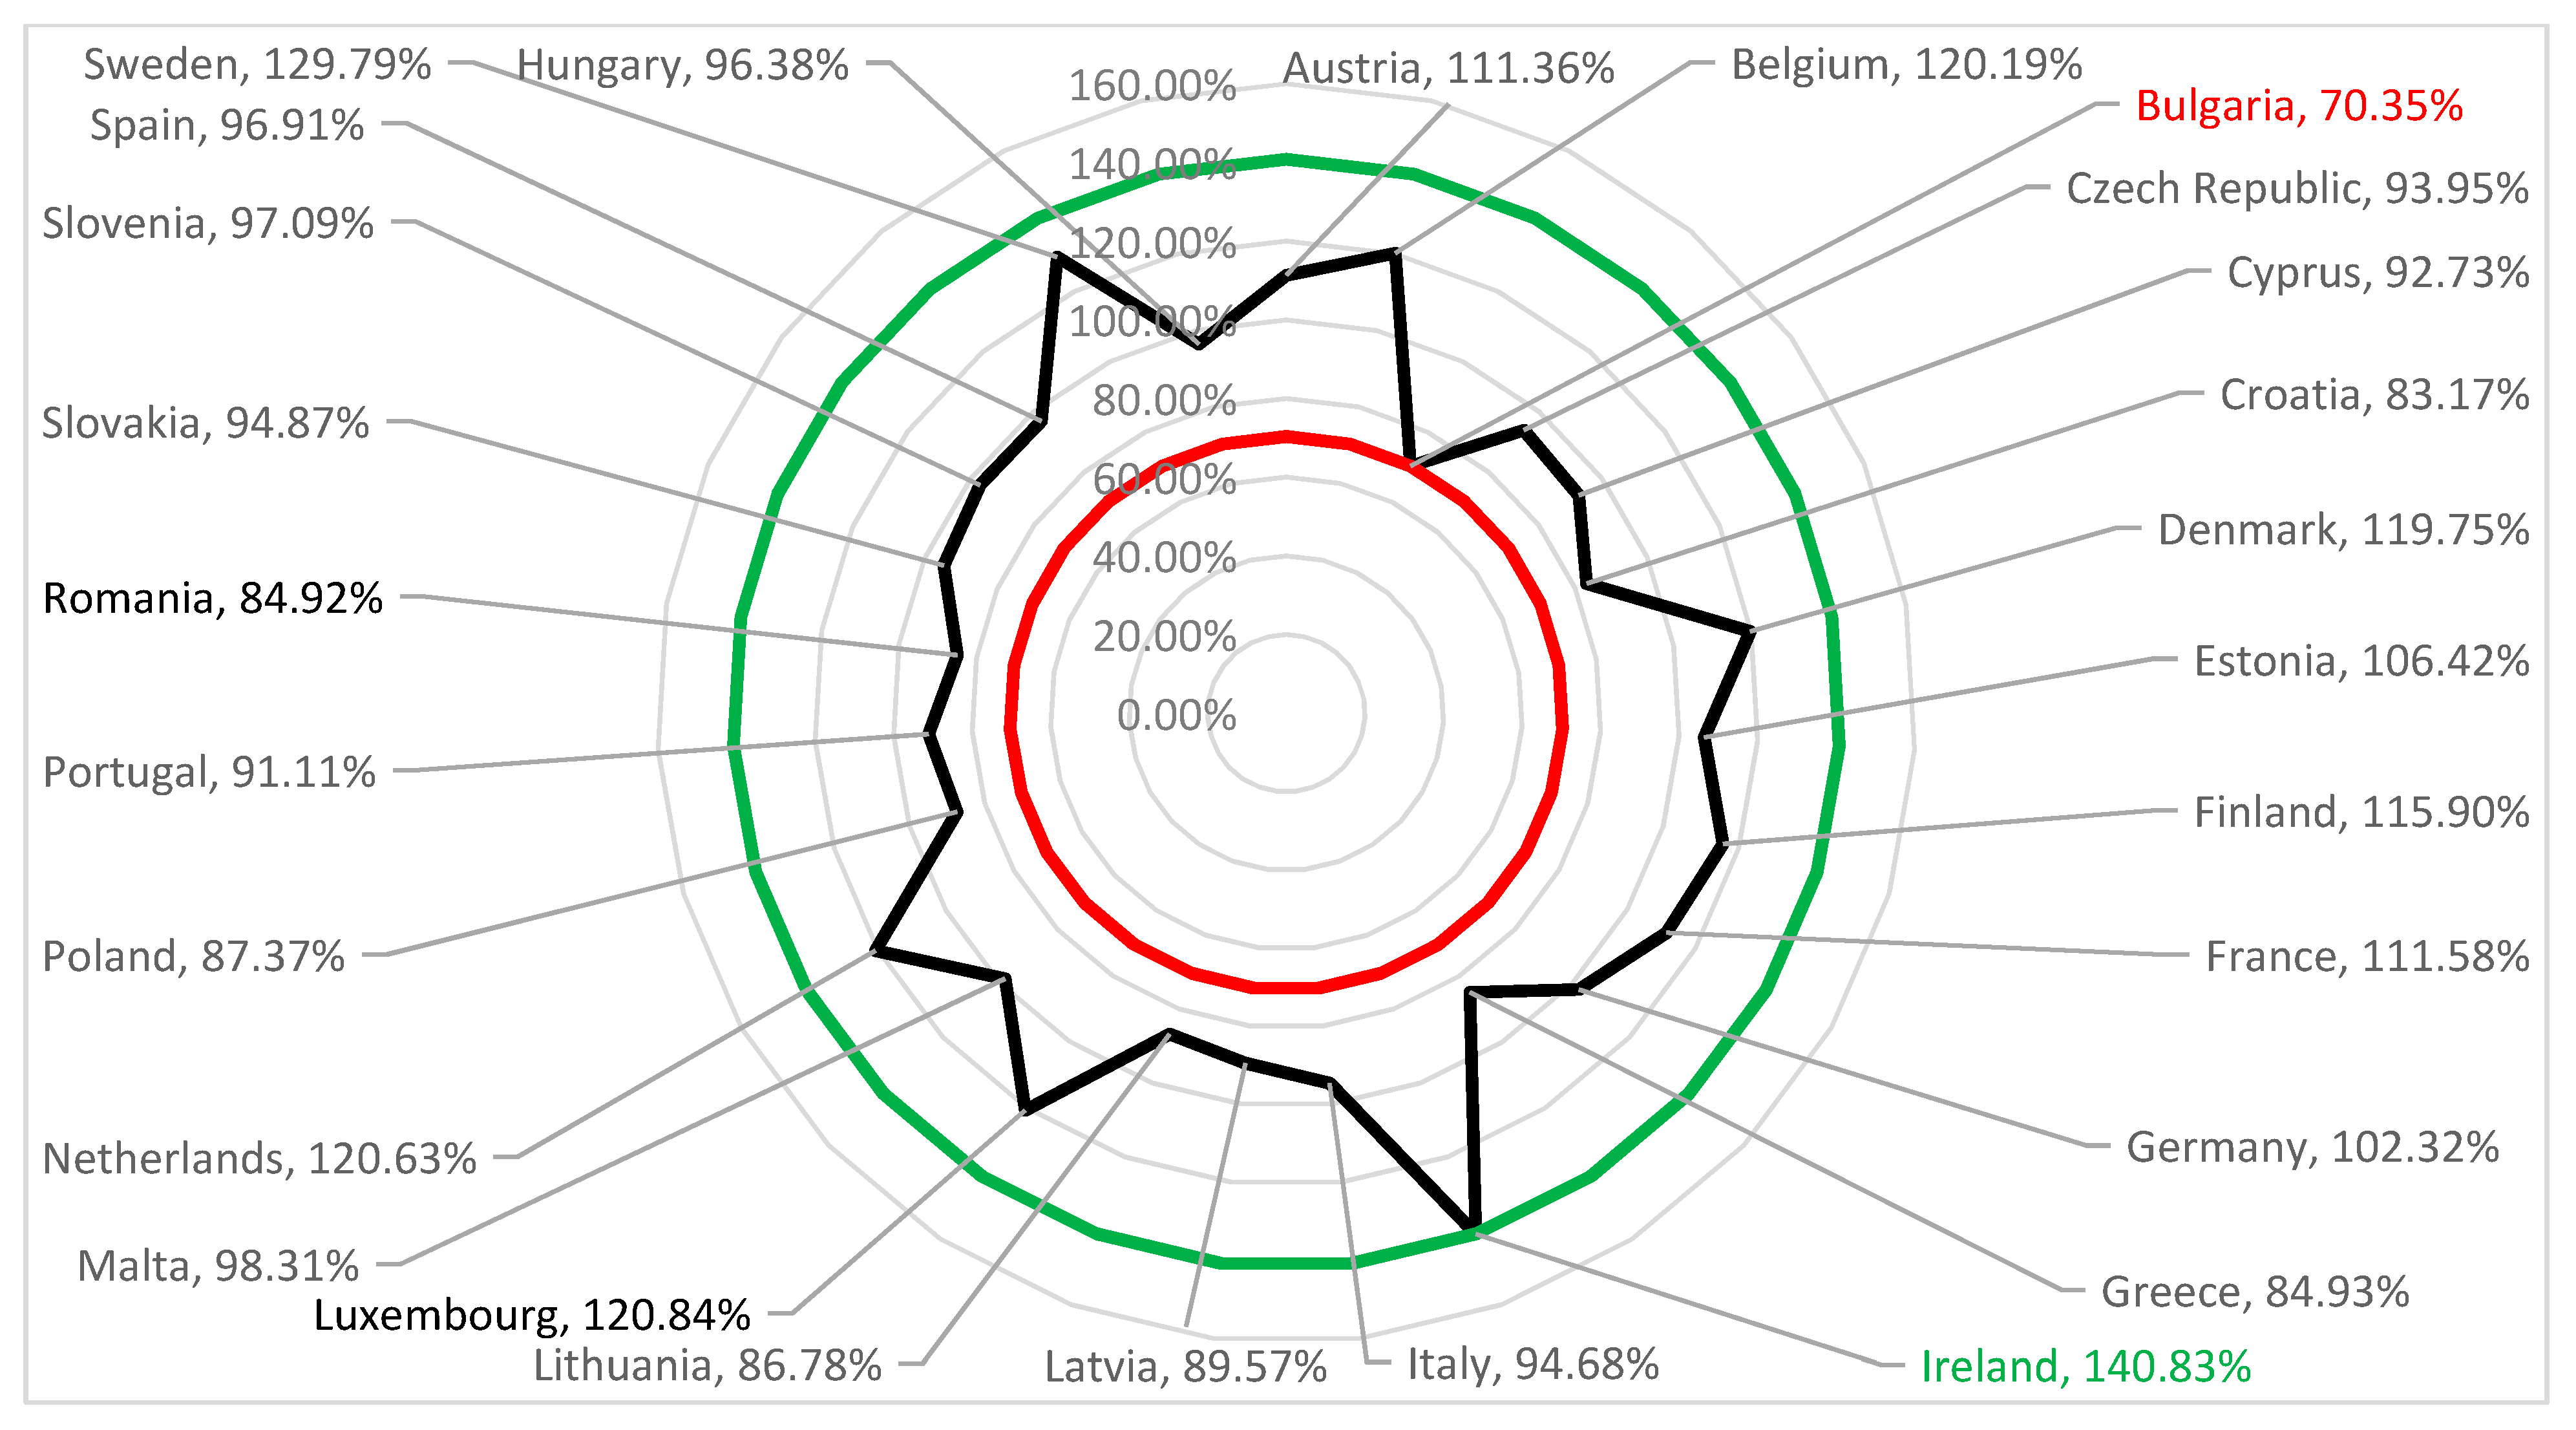
| Indicator/Country | Economic | Infrastructure | Environment | New Sustainability Index for SDG 11 | Ranking | |||
|---|---|---|---|---|---|---|---|---|
| Austria | 33,669.04 | 146.94% | 190.63 | 109.17% | 747.34 | 128.29% | 111.36% | 9 |
| Belgium | 26,168.80 | 114.21% | 186.66 | 106.90% | 417.75 | 71.71% | 120.19% | 5 |
| Bulgaria | 5945.08 | 25.95% | 145.27 | 83.19% | 571.60 | 98.12% | 70.35% | 27 |
| Czech Republic | 16,127.22 | 70.39% | 182.30 | 104.40% | 544.18 | 93.41% | 93.95% | 18 |
| Cyprus | 23,074.58 | 100.71% | 168.76 | 96.64% | 720.62 | 123.70% | 92.73% | 19 |
| Croatia | 11,394.68 | 49.73% | 154.35 | 88.39% | 523.06 | 89.79% | 83.17% | 26 |
| Denmark | 43,375.31 | 189.31% | 179.60 | 102.85% | 868.45 | 149.08% | 119.75% | 6 |
| Estonia | 13,367.59 | 58.34% | 180.23 | 103.22% | 369.42 | 63.41% | 106.42% | 10 |
| Finland | 31,849.44 | 139.00% | 195.75 | 112.10% | 603.15 | 103.54% | 115.90% | 7 |
| France | 30,088.54 | 131.32% | 188.41 | 107.90% | 609.79 | 104.67% | 111.58% | 8 |
| Germany | 31,384.06 | 136.97% | 191.14 | 109.46% | 962.50 | 165.22% | 102.32% | 11 |
| Greece | 16,135.63 | 70.42% | 153.71 | 88.03% | 604.69 | 103.80% | 84.93% | 24 |
| Ireland | 51,061.55 | 222.85% | 174.70 | 100.05% | 584.94 | 100.41% | 140.83% | 1 |
| Italy | 24,978.60 | 109.02% | 159.99 | 91.63% | 698.53 | 119.91% | 94.68% | 17 |
| Latvia | 10,932.06 | 47.71% | 180.03 | 103.10% | 494.09 | 84.81% | 89.57% | 21 |
| Lithuania | 12,192.30 | 53.21% | 158.38 | 90.70% | 500.40 | 85.90% | 86.78% | 23 |
| Luxembourg | 40,361.78 | 176.15% | 184.48 | 105.65% | 721.80 | 123.90% | 120.84% | 3 |
| Malta | 19,448.48 | 84.88% | 175.95 | 100.76% | 533.05 | 91.50% | 98.31% | 12 |
| Netherlands | 36,390.55 | 158.82% | 185.44 | 106.20% | 601.31 | 103.22% | 120.63% | 4 |
| Poland | 11,368.72 | 49.62% | 174.04 | 99.67% | 516.34 | 88.63% | 87.37% | 22 |
| Portugal | 17,094.01 | 74.60% | 156.38 | 89.56% | 533.58 | 91.59% | 91.11% | 20 |
| Romania | 7855.37 | 34.28% | 159.84 | 91.54% | 451.77 | 77.55% | 84.92% | 25 |
| Slovakia | 14,076.96 | 61.44% | 179.71 | 102.92% | 484.42 | 83.15% | 94.87% | 16 |
| Slovenia | 17,572.89 | 76.69% | 168.32 | 96.39% | 492.94 | 84.62% | 97.09% | 13 |
| Spain | 22,066.38 | 96.31% | 176.48 | 101.07% | 624.06 | 107.12% | 96.91% | 14 |
| Sweden | 39,720.39 | 173.36% | 185.34 | 106.14% | 530.13 | 91.00% | 129.79% | 2 |
| Hungary | 10,942.94 | 47.76% | 178.79 | 102.39% | 419.09 | 71.94% | 96.38% | 15 |
Disclaimer/Publisher’s Note: The statements, opinions and data contained in all publications are solely those of the individual author(s) and contributor(s) and not of MDPI and/or the editor(s). MDPI and/or the editor(s) disclaim responsibility for any injury to people or property resulting from any ideas, methods, instructions or products referred to in the content. |
© 2024 by the authors. Licensee MDPI, Basel, Switzerland. This article is an open access article distributed under the terms and conditions of the Creative Commons Attribution (CC BY) license (https://creativecommons.org/licenses/by/4.0/).
Share and Cite
Pricope, L.N.; Antohi, V.M.; Meca, A.; Buboi, A.; Fortea, C.; Zlati, M.L. The New European Development Scoreboard for SDG11 at the European Level. Sustainability 2024, 16, 7736. https://doi.org/10.3390/su16177736
Pricope LN, Antohi VM, Meca A, Buboi A, Fortea C, Zlati ML. The New European Development Scoreboard for SDG11 at the European Level. Sustainability. 2024; 16(17):7736. https://doi.org/10.3390/su16177736
Chicago/Turabian StylePricope, Laurentiu Nicolae, Valentin Marian Antohi, Alina Meca, Angela Buboi (Danaila), Costinela Fortea, and Monica Laura Zlati. 2024. "The New European Development Scoreboard for SDG11 at the European Level" Sustainability 16, no. 17: 7736. https://doi.org/10.3390/su16177736
APA StylePricope, L. N., Antohi, V. M., Meca, A., Buboi, A., Fortea, C., & Zlati, M. L. (2024). The New European Development Scoreboard for SDG11 at the European Level. Sustainability, 16(17), 7736. https://doi.org/10.3390/su16177736