Article

Study on the Selection of Recycling Strategies for the Echelon Utilization of Electric Vehicle Batteries under the Carbon Trading Policy

Glorious Sun School of Business and Management, Donghua University, 1882 West Yan’an Road, Shanghai 200051, China
*
Author to whom correspondence should be addressed.
Sustainability 2024, 16(17), 7737; https://doi.org/10.3390/su16177737
Submission received: 9 August 2024 / Revised: 2 September 2024 / Accepted: 3 September 2024 / Published: 5 September 2024
(This article belongs to the Section Waste and Recycling)

Abstract

:
Global climate change has prompted all sectors of society to take urgent action to reduce carbon emissions. Electric vehicles are the key to low-carbon transportation transformation, but their popularity has led to difficulties in disposing of used batteries. Improper handling will pollute the environment and violate the original goal of promoting low-carbon practices. Therefore, it is crucial to establish a sustainable battery-recycling and disposal system. This study uniquely incorporates the concept of battery echelon utilization into its analytical framework using a Stackelberg game model, exploring the equilibrium strategies for stakeholders in a closed-loop supply chain under carbon emission constraints. We analyzed the impact of multiple factors in the recycling process, as well as the influence of digital technology, on enterprise pricing, recycling efficiency, and the choice of recycling channels. The study found that the market pricing of batteries and electric vehicles is not influenced by recycling participants, but is instead related to the application of digital technology. Numerical simulations further reveal that the battery’s echelon utilization rate and carbon emission limit policies jointly motivate enterprises to be more proactive in recycling. In the joint recycling model, battery suppliers can achieve more substantial profit growth compared to electric vehicle manufacturers, providing new insights and directions for innovation and the development of collaborative models within the supply chain.

1. Introduction

In the urgent context of the global response to climate change, the active development of clean energy and the promotion of green and low-carbon transformation of the economy and society have become a broad consensus among the international community [1,2,3]. As an important representative of clean energy, electric vehicles (EVs) have significantly reduced the proportion of traditional energy sources, such as coal and oil, in the energy mix, becoming a crucial option for addressing climate change and mitigating environmental pollution. Furthermore, with their advantage of zero or low emissions, EVs contribute to the early achievement of carbon peaking and carbon neutrality, attracting considerable attention from various countries [4,5].
As early EVs gradually enter the “retirement” stage, the disposal of used batteries has become increasingly prominent and an urgent problem to be addressed. According to statistics, China will usher in the first peak of power battery retirement beginning from 2021. By 2025, the cumulative amount of retired power batteries in China will approach 800,000 tons. If these large quantities of waste batteries are not handled properly, their harm to the environment will be even more significant. Therefore, their disposal has become an urgent and critical environmental and economic issue [6]. To actively address this challenge, regulators around the world have introduced policies related to battery recycling. Among them, the EU Battery and Waste Battery Regulation proposed in 2023 sets strict standards for power battery recycling. In China, the “Administrative Measures for the Echelon Utilization of Power Batteries in New Energy Vehicles” issued in 2021 also clearly emphasizes the importance of echelon utilization and recycling management of power batteries. That is, for batteries with some performance degradation but still having reusable value, through secondary development, their service life can be extended and resource utilization efficiency can be improved [7]. Most of the raw materials for power batteries can be recycled, so the echelon utilization strategy not only improves recycling efficiency and reduces enterprise costs but also effectively reduces carbon emissions during the battery’s lifecycle, thereby supporting low-carbon sustainable development and achieving the goals of “peak carbon” and “carbon neutrality” [8,9]. Against this backdrop, many companies have actively participated in the field of battery recycling. For example, CATL, a leading global battery recycler, announced at Davos Forum 2023 that it is discussing with European and North American partners to set up an electric vehicle battery (EVB) recycling station for cooperation, to promote the development of the battery recycling industry through practical actions.
The promotion of the EV swap model undoubtedly brings new opportunities for the low-carbon development of the automotive industry. Policy support, such as China’s ‘Several Measures to Promote Automobile Consumption’, which explicitly encourages the application of the EV swap model, has provided solid backing for the promotion of the EV swap model. Enterprises have responded positively, and NIO Automotive Inc., for example, has set up 30 power exchange stations around the world, including five European markets and more than 2200 regions, providing consumers with four to six free power exchanges per month. At the same time, as a leading power battery supplier (BS) in the industry, CATL is working with NIO to build battery rental and purchase systems, power exchange operations, and laddering recycling services based on the vehicle–electricity separation model.
Driven by the “dual carbon” policy, as well as the implementation of battery recycling and echelon utilization policies, coupled with the pressing issues faced by users, such as safety concerns, difficulties in charging, and slow charging speeds [10], the battery-swapping market has ushered in unprecedented opportunities for development. Led by innovations in battery swapping service models, the circulation of EVBs is efficiently managed within the automaker’s system, not only significantly enhancing the efficiency of battery recycling but also substantially reducing carbon emissions over their entire lifecycle, thereby contributing significantly to environmental protection and sustainable development goals [11]. The promotion of EVB swapping models brings new opportunities for the low-carbon development of the automotive industry. Policy support is equally indispensable. For instance, China’s “Several Measures to Promote Automobile Consumption” explicitly encourages the application of battery-swapping models for EVs, thus providing a solid guarantee for the promotion of this model. In response, enterprises have actively taken action. Companies represented by NIO Automotive have established 30 battery swapping stations globally, including five European markets and over 2200 locations, offering consumers 4 to 6 free battery swaps per month. Meanwhile, as an industry-leading power BS, CATL is collaborating with NIO to build services related to battery leasing, swapping operations, and echelon utilization and recycling, all based on the vehicle-battery separation model. It is noteworthy that the newly enacted EU Regulation on Batteries and Waste Batteries stipulates that, starting from 2027, traction batteries exported to Europe must be equipped with a “battery passport”, which includes information such as the battery’s manufacturer, raw material composition, carbon footprint, and supply chain, reflecting the strict and comprehensive oversight of the battery recycling process. Against this backdrop, the application of blockchain technology becomes particularly significant, as it can streamline data flow, enhance collaboration efficiency, and facilitate real-time monitoring and transparent management of the recycling process [12]. Therefore, the adoption of blockchain technology will further strengthen the transparency, security, and traceability of battery information, better meeting policy requirements.
In summary, this paper examines the closed-loop industrial chain operation mode of “design and manufacturing—echelon utilization—dismantling and recycling—circular utilization” throughout the entire lifecycle of EVs, given the constraints of carbon emissions. It provides a comprehensive analysis of the entire value chain, from battery production to vehicle assembly, marketing, sales, and ultimately corporate recycling, ultimately formulating a closed-loop supply chain (CLSC) model tailored for power batteries. Moreover, this paper delves into the selection of power battery recycling channels situated within the context of EVB swapping services and the echelon utilization of batteries. Notably, prior literature focusing on the echelon utilization of batteries within the battery-swapping service model offered by automotive enterprises, while considering the implementation of carbon quota policies and the incorporation of blockchain technology, remains limited. Consequently, this paper endeavors to address the following pivotal research questions:
(1)
What channel models does the recycling system of EVBs encompass? In different recycling channel models, what specific roles do the various members play, and what functions do these members fulfill in the recycling process?
(2)
How does the government implement relevant policies, particularly by limiting carbon emissions during production and establishing carbon trading prices, and what are the subsequent impacts on the economic interests of members within the CLSC?
(3)
How are the equilibrium strategies of BS and electric vehicle manufacturers (EVMs) within a CLSC affected under different recycling channel models? In particular, how do multiple factors related to the exchange and recycling service intertwine to influence the formulation of these strategies: the reuse rate of recycled batteries, the compensation derived from tiered utilization, and the effect of unit exchange and recycling costs on corporate pricing, recycling efforts, and the choice of recycling channels?
(4)
How do the profits of each member change under a joint recycling model with the introduction of blockchain technology versus a joint recycling model without the introduction of blockchain, and is the introduction of blockchain a superior recycling channel model?

2. Literature Review

Fleischmann et al. [13] and Guide et al. [14] introduced the concept of a CLSC, which considers the reverse supply chain within the traditional forward supply chain, resulting in a closed-loop system of production, distribution, recycling, and reuse. An important strategy for e-waste treatment is the development of CLSC. To ensure proper collection, detection, and management of utilization, the supply chain has to be transformed into a closed network system [15]. As EVBs can be regarded as e-waste at the end of their useful life, the discussion on recycling and treatment of EVBs for reuse can also be included in the CLSC. Current research on CLSC can be broadly categorized into several aspects in terms of the competitive and cooperative relationships between members, the setting of transaction prices between layers in the supply chain, the selection of recycling channels, and the analysis of organizational structure.
Relationships between members in the CLSC play a crucial role in supply chain coordination. De et al. [16] proposed that the profit gained by the manufacturer is different in collaborative mode and competitive mode in CLSC; the profit is more in competitive mode and the manufacturer is more willing to carry out the recycling and remanufacturing activities. Lin et al. [17] compared outsourcing and in-house strategies for remanufacturing activities in the CLSC process and found that in-house strategy is better than the external strategy due to discrete time simulation. Feng et al. [18] investigated the integration relationship between competing manufacturers and each supplier in a CLSC for EVs and proposed that manufacturers always choose to cooperate with suppliers when they have higher capabilities. Chen et al. [19] explored the effects of financing rates, government subsidies, and remanufacturing cost savings on the equilibrium decision and profit variance under different financing strategies and found that the introduction of a revenue-sharing contract can achieve Pareto improvement. The above studies suggest that a competitive model between manufacturers is more conducive to promoting firms’ participation in the recycling process and that manufacturers benefit more from entering into partnerships with their suppliers.
Pricing decisions are one of the core elements of CLSC, and reasonable pricing can achieve the optimal allocation of resources and enhance the economic efficiency and competitiveness of the whole CLSC. Therefore, many studies have explored the pricing decision in CLSC. Jena and Meena [20] examined the CLSC of green innovative products in a dual-channel retail model combining physical and online retailing and analyzed and compared the selling prices of manufacturers and remanufacturers under different balance-of-power strategies. Hosseini et al. [21] took the dairy industry’s recycling of empty bottles as an example, developed a compensation-based wholesale price contract to coordinate competitive CLSC, and found that developmental contracts are more favorable for the recycling process than decentralized contracts, improving the performance of sustainable CLSC.
The recycling process is a key link of CLSC. The reasonable choice of recycling channel is directly related to the recycling efficiency, cost, and the quality of recycling. Zhou et al. [22] studied a CLSC consisting of EVMs, retailers, and third-party recyclers and compared the results of the CLSC equilibrium under different recycling bodies. The study found that the recycling rate of third-party recyclers led to higher recycling, and the rest had lower recycling rates. Recycling standards reflect the quality of recycling to a certain extent, and Esenduran et al. [23] found that recyclers choose low recycling standards when there is no competition within or between recycling channels. When there is competition in the recycling process, it instead promotes higher recycling standards.
The ability of a CLSC system to fully play its role depends not only on the operational mechanisms between individual node firms on the CLSC, but also on the organizational structure of the CLSC. Yang et al. [24] investigated a hybrid CLSC system by developing a three-echelon CLSC to investigate and study the impacts of the number and location of product recycling options with a specified rate of return on the performance of the CLSC. Huang et al. [25] explored manufacturers’ CLSC strategies in the presence of green consumers and showed that manufacturing engages in recycling and remanufacturing activities and builds a CLSC that benefits more when green consumers are present in the market. Ma and Meng [26] investigated the problem of optimal financing strategies in a dual-channel CLSC under demand uncertainty and explored how the level of acceptance of online channels affects the optimal CLSC performance. Wu et al. [27] found that the higher the proportion of green consumers, the more the manufacturer’s choice of outsourcing strategy can lead to a win–win situation for both the firm and the environment.
Much of the previous literature has examined the mechanisms of CLSC operation as well as its organizational structure, and with the full implementation of the Paris Agreement, ‘carbon neutrality’ has become the focus of international attention. Consumers’ sensitivity to the carbon footprint of production and their willingness to remanufacture products both have an impact on the recycling process and profits of manufacturers in CLSC [28]. Ghadge et al. [29] constructed a mathematical optimization model of sustainable CLSC considering the complexity of the CLSC’s multi-product, multi-cycle, and mixed-integer nature, and by using a mixed meta-heuristic approach to determine the optimal trade-off between cost and carbon emissions in a CLSC network, and found that the costs and emissions of a forward logistics supply chain are significantly greater than those of a reverse supply chain. This finding broadens the mindset of reverse logistics for companies and promotes the important role of commodities in recycling CLSC. Shahparvari et al. [30] synthesized different scenarios of returns and carbon policies in a real EVM case study, developed a sustainable reverse logistics optimization model and solved it with integrated opportunity-constrained robust as-you-go planning, and found that the cost of carbon emission increase can be used as a lever to control and reduce the total network carbon emissions. The above study shows that considering the reverse supply chain based on the product forward logistics supply chain and, thus, constructing the product CLSC can help to reduce the production carbon footprint.
As automobiles are one of the major sources of global carbon emissions, relevant government policies have paid more attention to the CLSC of automobiles. Liu et al. [31] found that governments can incentivize the recycling of end-of-life cars in the form of a recycling permit fee. Littlejohn and Proost [32], relying on the European Union’s carbon policy, provided the construction of a two-period model to compare the cost and benefit of the policy, finding that the cost of achieving emissions reductions from a carbon standard is much lower than a combination of purchase tax or subsidy mandates for EVs. The implementation of the carbon tax policy effectively reduces total carbon emissions and improves social welfare [33]. Jauhari et al. [34] investigated the impact of recycling incentives for mixed production under stochastic demand and learned that an increase in the carbon tax makes it necessary for manufacturers to produce fewer carbon emissions, which leads to an increase in investment in green technologies. Taken together, these studies found that government restrictions on carbon emissions can promote the benefits of CLSC for EVs. However, fewer studies consider the battery echelon in the CLSC of EVBs.
Considering the safety of remanufacturing activities in CLSC and the pollution of the environment, strategies such as the introduction of green innovation technology, blockchain technology, etc., in CLSC have gained notable attention in academia. Guo [35] investigated the issue of green production decision making by manufacturers under carbon cap-and-trade regulation and found that when the government sets a high carbon quota, the manufacturers are more willing to invest in green technologies to stimulate the recycling environmental effects. Yang [36] found that using blockchain technology can significantly increase the retail prices of new and remanufactured products in CLSC and the profits of third-party recyclers when blockchain fees are low. Zhang et al. [37] investigate the use of digital technology and remanufacturing to optimize third-party recycling and find that the information chain established by blockchain technology has a lower input cost and is easier to use than the previous information-based management systems with the technical advantages of lower input costs and easier information management, and also improved the trust environment between members. Silva et al. [38], through a case study of European EVBs and the stakeholders in their supply chain, concluded that there is a need for more open and secure data sharing for a sustainable EVB supply chain and that blockchain technology facilitates EVB secondary applications. It also highlights that legislation can facilitate a more efficient EVB ecosystem in the EU and beyond. Meyer et al. [39] suggest that smart battery detection and storage monitoring using digital technology are essential. Digital technologies can enable data continuity throughout the battery’s lifecycle and minimize transaction costs. The above study shows that the adoption of green innovation technology and blockchain technology can bring more significant benefits to the production process of enterprises. Blockchain technology not only improves the transparency of information between supply chain members, making the supply chain stronger, but also meets the requirements of the European Union for the carbon footprint information of batteries and other requirements, so it is necessary to consider the introduction of blockchain technology in the CLSC of EVB recycling and remanufacturing.
Compared with previous studies, recycling channel studies have been more extensive on waste products, and limited consideration has been given to the issue of choosing recycling channels under the switching mode. In particular, although there have been restrictions on carbon emissions and references to blockchain in the field of EVB recycling, most of them have focused on a single study, with little consideration of the impact of blockchain references on carbon emissions. In particular, there is a lack of analysis of the impact of the introduction of blockchain technology on EVB recycling under carbon trading policies. To address this research gap, this study proposes four recycling models under a CLSC that includes different players, such as BS, EVM, consumers, and the government. The objective is to investigate the issue of government regulations on the selection of recycling channels for EVB and the level of recycling efforts. In addition, this study is also exploring the responses of the CLSC members to carbon allowance policies and blockchain strategies.

3. Methodology

This paper constructs a CLSC model for EV recycling and remanufacturing, involving stakeholders such as BS, EVM, and the government. The roles of each participant in the CLSC are defined as:
(1)
It is the responsibility of the BS to provide EVM with the batteries needed to produce EVs, either from new manufacturing materials or recycling.
(2)
EVM manufactures new EVs by sourcing batteries from BS. In addition, EVM can obtain batteries for manufacturing that can be directly recycled by participating in the recovery process.
(3)
For the carbon emissions of BS and EVM in the production process, the government controls the carbon emissions of the manufacturers through carbon quotas, and at the same time opens a carbon trading market, where BS and EVM can trade their carbon emission rights.
Next, based on the roles of each participant in the CLSC and government regulation mentioned earlier, four CLSC models for EV recycling and remanufacturing are constructed, as shown in Figure 1. The relevant symbols and descriptions are shown in Table 1.
In Model S, the BS solely bears the cost of power exchange services, meaning that it is responsible for recycling and remanufacturing EVBs and distinguishes between batteries that can be sold directly to EVM for recycling and those that need to be remanufactured and sold to EVM, as well as distinguishing non-reusable batteries for echelon.
In the model M, EVM directly provides consumers with power exchange services. Specifically, EVM solely handles the recycling of EVBs using recyclable batteries for direct production in EVs. It sells batteries that require remanufacturing to BS for further manufacturing and separates non-recyclable batteries for echelon utilization.
In Model L, BS and EVM jointly invest in the recycling process, co-investing to build a power exchange station that provides electricity services. BS sells the batteries that need to be remanufactured along with the raw material production batteries to EVM. The EVM uses batteries purchased from BS and recyclable batteries obtained through recycling to produce EVs. The revenue from batteries used in the echelon is distributed to BS and EVM according to the investment ratio.
In Model C, BS and EVM introduce blockchain technology into the joint investment recycling process, and the adoption of blockchain technology allows companies to better control the use of batteries. In this case, BS remanufactures the batteries that need to be remanufactured and sells them together with the raw materials to EVM, which uses the batteries purchased from BS and the recyclable batteries to produce EVs.
Hypothesis 1.
Consider the single-cycle problem where the batteries of EVs sold in previous cycles can be recycled. Single-cycle models are often seen in the literature on CLSC for recycling and remanufacturing [40,41].
Hypothesis 2.
A remanufactured EV is as competitive as a new product, has the same appeal to consumers, and is sold uniformly in the marketplace. Manufacturing with raw materials is more costly than remanufacturing through recycling [42].
Hypothesis 3.
The demand function for EVs is affected by the retail price [43] as shown in q = a − bpm. The market size of the EV market remains constant in general, there are a certain number of potential consumers in the market, and the willingness of these consumers to buy is influenced by the retail price (a > 0, b > 0).
Hypothesis 4.
The number of EVBs recycled can be expressed as Q = Q0 + kτ, where Q0 > 0, τ > 0 [44]. The EVB recycling quantity function is a linear function of the level of recycling effort τ, where Q0 denotes the total availability in the market at that time and k denotes the sensitivity of consumers to the recycling effort.
Hypothesis 5.
All members of the CLSC for EV recycling and remanufacturing make optimal decisions with symmetric information [45].
Hypothesis 6.
BS produces carbon emissions per unit of batteries at es, the remanufacturing process produces carbon emissions per unit of batteries at er, and the EVM produces carbon emissions per unit of cars at (em > 0). For BS, the remanufacturing process produces fewer carbon emissions per unit compared to manufacturing batteries using raw materials, i.e., es > er [46]. The carbon emissions of BS consist of the carbon emissions from producing new batteries and the carbon emissions from recycling remanufactured batteries. The carbon emissions of EVM are determined by the carbon emissions from the production of EVs using EVB.
Hypothesis 7.
Consider the government’s carbon emission control policy, where the state sets a certain amount of carbon credits T for each firm, firms can buy and sell carbon allowances through the carbon trading market to prevent high fines for exceeding the carbon allowances, and firms exceeding the carbon allowances can buy carbon allowances from firms with surplus carbon allowances at the market trading price through the carbon trading market [47].

4. The Model

In this study, the Stackelberg game is used to analyze the decision-making process [17,22]. The decision sequence is as follows: first, the recycler decides the level of recycling effort; second, the BS decides the selling price of its batteries; and then the EVM decides the selling price of its EVs. The superscript “*” indicates the optimal outcome of the supply chain members, and the pricing, recycling effort level, and profit are known through the backward induction method of game theory.

4.1. Model S—BS Invests Separately

In the BS separate investment model, the profits of the BS and the EVM in model S are denoted by π s s and π s s with the objective function:
Π s s = ( p s s c s ) ( q s φ Q s ) + p s s ( 1 η ) φ Q s + ( p s s c r ) η φ Q s + ( 1 φ ) Q s w c ( τ s ) 2 p c ( E s s T )
Π m s = ( p m s p s s c m ) q s p c ( E m s T )
Among them,
E s s = e s ( q s φ Q s ) + e r η φ Q s ,   E m s = e m q s ,   q s = a b p m s ,   Q s = Q 0 + k τ s
Proposition 1.
The optimal selling price, level of recovery effort, and retail price results for model S are calculated as follows:
τ s = φ k c s η φ k c r + φ k p c e s η φ k p c e r + ( 1 φ ) k ω 2 c
p s s = a 2 b + 1 2 ( c s c m + p c e s p c e m ) , p m s = 3 a 4 b + 1 4 ( c s + c m + p c e s + p c e m )
Corollary 1.
In model S
p s s b = a 2 b 2 < 0 ,   p m s b = 3 a 4 b 2 < 0 , τ s k = φ ( c s η c r ) + φ p c ( e s η e r ) + ( 1 φ ) ω 2 c > 0
p s s p c = e s e m 2 , p m s p c = e s + e m 4 > 0 ,   τ s p c = φ k ( e s η e r ) 2 c > 0
Corollary 1 shows that in Model S, the selling prices of both batteries and EVs decrease as the price sensitivity factor for consumers increases. The recycling rate increases as the consumer sensitivity coefficient for the degree of recycling increases. The change in the price of a battery with the carbon trading price is influenced by the size of the carbon emissions per unit of its production process in the supply chain. The price and recovery rate of EVs increase with the price of carbon emissions.

4.2. Model M—EVM Invests Separately

In Model M, the profits of the BS and the EVM in Model M are denoted by π s m and π m m , and the objective function is:
Π s m = ( p s m c s ) ( q m η φ Q m ) + ( p s m p a c r ) η φ Q m p c ( E s m T )
Π m m = ( p m m p s m c m ) [ q m ( 1 η ) φ Q m ] + ( p m m c m ) ( 1 η ) φ Q m + p a η φ Q m + ( 1 φ ) Q w c ( τ m ) 2 p c ( E m m T )
Among them,
E s m = e s ( q m η φ Q m ) + e r η φ Q m ,   E m m = e m q m ,   q m = a b p m m   , Q m = Q 0 + k τ m
Proposition 2.
The optimal selling price, level of recovery effort, and retail price results for model M are calculated as follows:
τ m = ( 1 η ) φ k 4 c ( c s + p c e s ) ( 1 η ) φ k 4 c ( c m + p c e m ) + ( 1 φ ) k ω 2 c + ( 1 η ) φ k a 4 b c + η φ k p a 2 c
p s m = a 2 b + 1 2 ( c s c m + p c e s p c e m ) , p m m = 3 a 4 b + 1 4 ( c s + c m + p c e s + p c e m )
Corollary 2.
In model M,
p s m b = a 2 b 2 < 0 ,   p m m b = 3 a 4 b 2 < 0 , τ m k = ( 1 η ) φ 2 ( c s c m ) + ( 1 η ) φ 2 p c ( e s e m ) + ( 1 φ ) ω + ( 1 η ) φ a 2 b + η φ p a 2 c > 0 p s m p c = e s e m 2 ,   p m m p c = e s + e m 4 > 0 ,   τ s p c = ( 1 η ) φ k ( e s e m ) 2
Corollary 2 shows that in Model M, the selling prices of both batteries and EVs decrease as the consumer’s price sensitivity factor increases. The recycling rate increases as the consumer sensitivity factor for recycling efforts increases. The changes in battery price and recycling rate in relation to the carbon trading price are affected by the amount of carbon emissions per unit of the manufacturing process of BS and EVM; when the carbon emissions per unit of battery manufacturing are greater than the carbon emissions per unit of automobile manufacturing, the battery price decreases with the increase in carbon tax amount, and vice versa. The sale prices of EVs always increase with the carbon trading price.

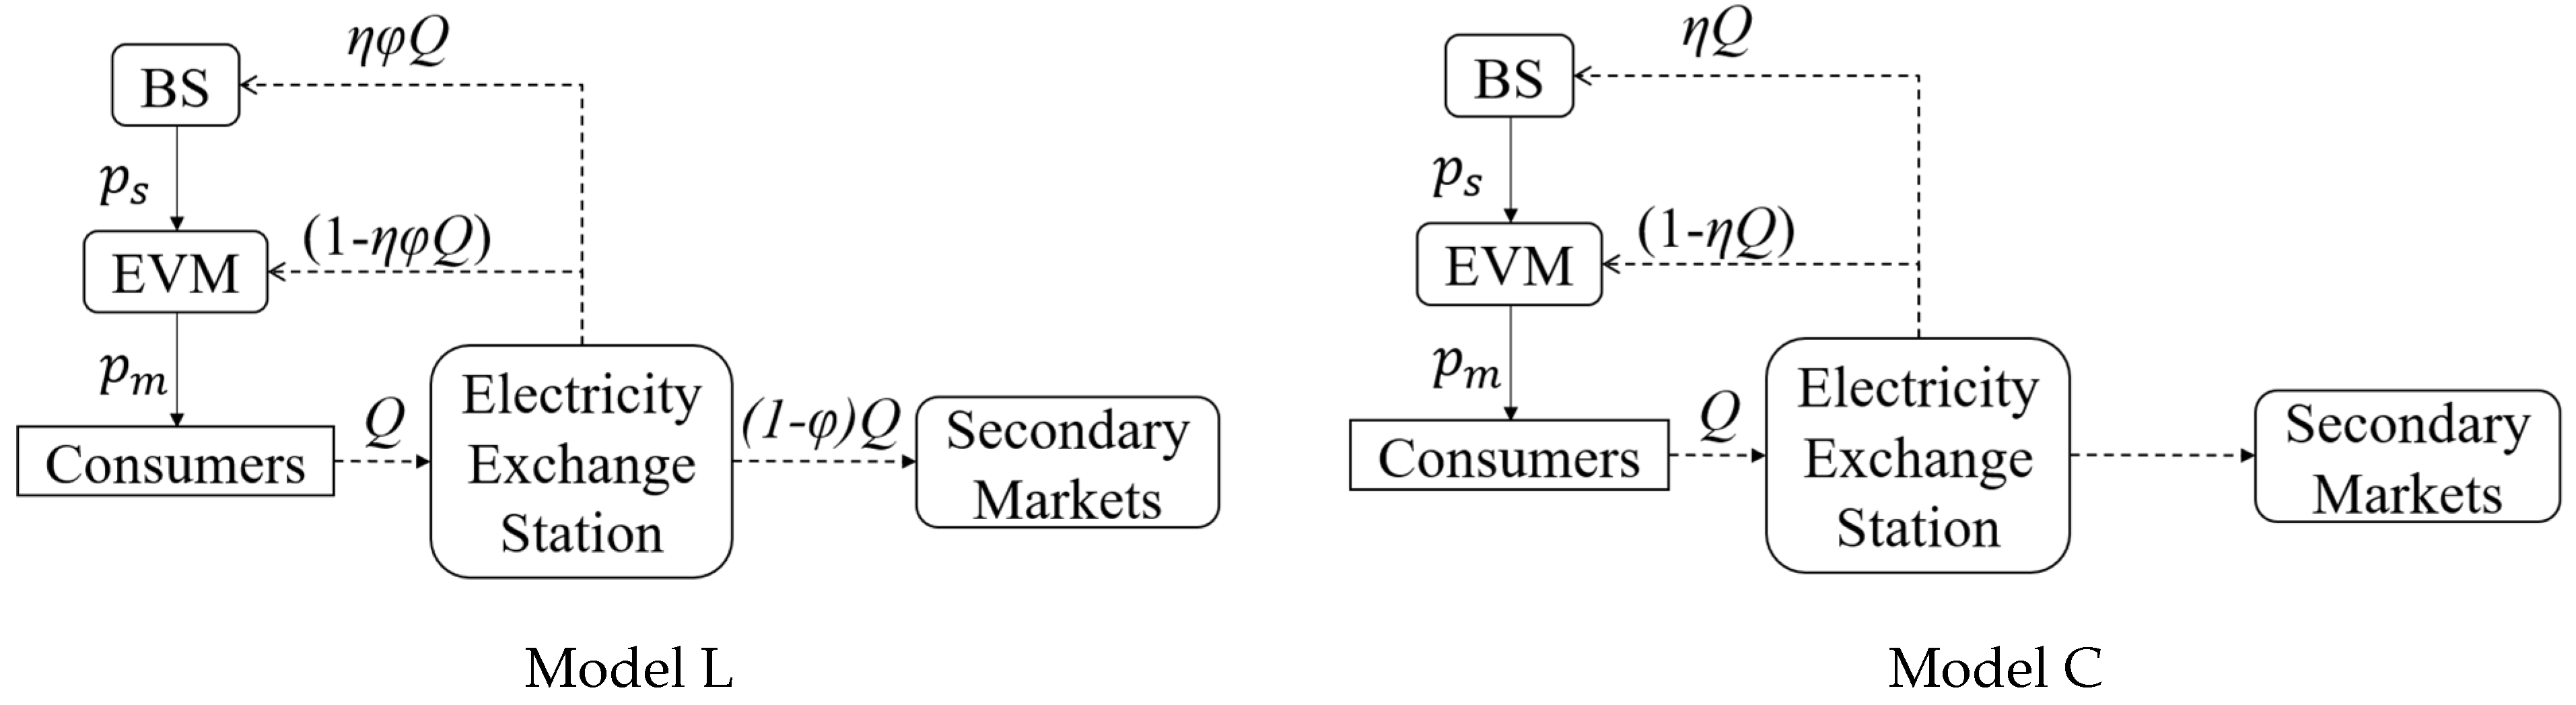
4.3. Model L—Joint Investment Model

In model L, BS and EVM share the responsibility for the recycling of EVB, with the suppliers responsible for the ε part and the manufacturers for the 1 − ε part. Recovered batteries that can be directly reused are given to manufacturers ( ( 1 η ) φ Q ), those that can be remanufactured are handed over to BS for remanufacturing ( η φ Q ), and the remaining portion that can be utilized for gradient recycling is sold to the secondary market ( 1 φ Q ) . The total profits of BS, EVM, and the supply chain in model L are denoted by π s l , π s l and π l with the objective function:
Π s l = ( p s l c s ) ( q l η φ Q l ) + ( p s l c r ) η φ Q l + ε ( 1 φ ) Q l w ε c ( τ l ) 2 p c ( E s l T )
Π m l = ( p m l p s l c m ) [ q l ( 1 η ) φ Q l ] + ( p m l c m ) ( 1 η ) φ Q l + ( 1 ε ) ( 1 φ ) Q l w ( 1 ε ) c ( τ l ) 2 p c ( E m l T )
Π l = Π s l + Π m l = ( p m l c s c m ) q l + ( c s c r ) η φ Q l + p s l ( 1 η ) φ Q l + ( 1 φ ) Q ω c ( τ l ) 2 p c ( E s l + E m l 2 T )
Among them,
E s l = e s ( q l η φ Q l ) + e r η φ Q l ,   E m l = e m q l ,   q l = a b p m l ,   Q l = Q 0 + k τ l
Proposition 3.
The optimal selling price, level of recovery effort, and retail price results for model L are calculated as follows:
τ l = ( 1 + η ) φ k 4 c ( c s + p c e s ) η φ k ( c r + p c e r ) 2 c ( 1 η ) φ k 4 c ( c m + p c e m ) + ( 1 η ) φ k a 4 b c + ( 1 φ ) k ω 2 c
p s l = a 2 b + 1 2 ( c s c m + p c e s p c e m ) , p m l = 3 a 4 b + 1 4 ( c s + c m + p c e s + p c e m )
Corollary 3.
In model L,
p s l b = a 2 b 2 < 0 ,   p m l b = 3 a 4 b 2 < 0 ,
τ l k = ( 1 + η ) φ 4 c ( c s + p c e s ) η φ 2 c ( c r + p c e r ) ( 1 η ) φ 4 c ( c m + p c e m ) + ( 1 η ) φ a 4 b c + ( 1 φ ) ω 2 c > 0
p s l p c = e s e m 2 ,   p m l p c = e s + e m 4 > 0 ,   τ l p c = ( 1 η ) φ ( e s e m ) + 2 η φ ( e s e r ) 4 c
Corollary 3 shows that in Model L, the selling prices of both EVBs and EVs decrease as the consumer’s price sensitivity factor increases. The recycling rate increases as the consumer sensitivity coefficient for the degree of recycling increases. The change in the price of batteries with the carbon trading price is influenced by the amount of carbon emissions per unit produced by the EVBs and the EVM production. The price of EVs increases as the carbon trading price increases. Changes in recycling rates with carbon trading prices are influenced by the amount of carbon emissions per unit of raw material and remanufacturing by BS and manufacturing by EVM. In general, batteries produce more carbon emissions per unit of production than electric vehicles do, so the recovery rate increases as the carbon trading price increases.

4.4. Model C—Introduction of Blockchain under the Co-Investment Model

Hypothesis 8.
Consumer demand when blockchain is not introduced is  q = a b p m , considering the positive promotion effect of blockchain traceability technology on consumer demand, so it is assumed that consumer demand after the introduction of blockchain is  q = a b p m + n g , where n portrays the sensitivity of consumers to the degree of transparency brought about on blockchain technology, and the cost of introducing blockchain is viewed as  k g 2 .
Considering the introduction of blockchain technology in a joint investment recycling model between BS and EVM makes the battery use and recycling process more transparent and increases consumers’ understanding and willingness to buy EVs. It is thought that there will be no more low battery capacity, i.e., φ = 1 . The BS bears the blockchain cost of λ k g 2 , and the EVM bears the blockchain cost of ( 1 λ ) k g 2 . Total profits for the BS, EVM, and supply chain in Model C are denoted by π s , π m , and π with the objective function:
Π s = ( p s c s ) ( q η Q ) + ( p s c r ) η Q ε c τ 2 λ u g 2 p c ( E s T )
Π m = ( p m p s c m ) [ q ( 1 η ) Q ] + ( p m c m ) ( 1 η ) Q ( 1 ε ) c τ 2 ( 1 λ ) u g 2 p c ( E m T )
Π = Π s + Π m = p s ( 1 η ) Q + p m q ( c s + c m ) q + ( c s c r ) η Q c τ 2 u g 2 p c ( E s + E m 2 T )
Among them,
E s = e s ( q η Q ) + e r η Q ,   E m = e m q ,   q = a b p m + r g ,   Q = Q 0 + k τ + r g
Proposition 4.
Consider the optimal selling price, level of recycling effort, and retail price in the model where blockchain is introduced, which are calculated as follows:
p s = a + rg 2 b + 1 2 ( c s c m + p c e s p c e m ) , p m = 3 a + 3 rg 4 b + 1 4 ( c s + c m + p c e s + p c e m )
τ = ( 1 + η ) k 4 c ( c s + p c e s ) η k 2 c ( c r + p c e r ) ( 1 η ) k 4 c ( c m + p c e m ) + ( 1 η ) k a 4 b c + ( 1 η ) k r 4 b c g
g = ( 1 η ) r 2 b Q 0 + ( 1 η ) 2 k 2 r + 7 b c r 4 b c η r 8 b 2 c a + ( 1 η 2 ) k 2 r + b c r + 4 b c η r 8 b c ( c s + p c e s ) + η ( 1 η ) k 2 r + 4 b c η r 4 b c ( c r + p c e r ) ( 1 η ) 2 k 2 r + 7 b c r 4 b c η r 8 b c ( c m + p c e m ) 2 u r 2 ( 1 η ) 2 k 2 + 11 b c 8 b c η 8 b 2 c
Corollary 4.
In the extended model,
p s b = a + r g 2 b 2 < 0 , p m b = 3 a + 3 r g 4 b 2 < 0 , p s p c = e s e m 2 , p m p c = e s + e m 4 > 0 .
Corollary 4 shows that in Model C, both EVB and EV sales prices decrease as the consumer price sensitivity coefficient increases. The change in the prices of batteries with respect to the price of carbon emissions is influenced by the amount of carbon emissions per unit of production of the BS and the EVM. EV prices increase with the price of carbon emissions. The expression for the recycling rate is somewhat complex, and it can be observed that the size of the recycling rate in this model varies with the sensitivity coefficient of the consumer’s recycling effort and the carbon trading price, depending on the relationship between the exogenous variables. Because of the introduction of blockchain technology, it is seen that the effect of consumer sensitivity to the sale price on the recycling rate is no longer constant, but is influenced by the coefficient of correlation between the manufacturing and remanufacturing process.

4.5. Comparative Analysis of EVB Recycling Channel Models

In this section, the equilibrium results of previous models are further analyzed, comparing the effects of relevant variables on the equilibrium solutions of different models. Inferences 5–7 are drawn based on the comparison of the optimal equilibrium results for prices and recycling rates for the four models:
Corollary 5.
The optimal EVB and EV sales price are compared as follows:
( 1 )   p s s = p s m = p s l ,   p m s = p m m = p m l
( 2 )   p s = p s l + r g 2 b ,   p m = p m l + 3 r g 4 b
Corollary 5(1) finds that in Models S, M, and L, prices are not affected by the recycling entity, suggesting that the recycling process does not affect the profit-maximizing pricing process, while participating in recycling incurs a cost and likewise brings about manufacturing cost savings. Corollary 5(2) shows that both batteries and cars are sold at a higher price than they would have been without the introduction of blockchain, and that BS and EVM transfer the cost of introducing blockchain to the sales price. In this case, the sales price of batteries is directly proportional to the manufacturing cost of batteries and inversely proportional to the manufacturing cost of cars; however, the sales price of cars is directly proportional to the manufacturing cost of both EVBs and EVs. And it has the same correlation with carbon emissions per unit. In addition, BS will emphasize how high their unit carbon emissions are in the supply chain, and when they are high, they will add them to the selling price of the battery. When it is low, the selling price of EVBs will be lowered appropriately. For EVM, since their price decisions are made after BS, they do not compare the carbon emissions of the two, but uniformly include them in the sales price of EVs.
Corollary 6.
The optimal level of recycling effort has the following relationship:
0 < p c < N 1 , τ l > τ s ;   p c > N 2 , τ l > τ m ;   ω < N 3 , τ > τ l .
Corollary 6 shows that in Models S, M, and L, the level of recycling effort is affected by the carbon trading price, and when the carbon trading price is less than a certain threshold ( N 1 ), the recycling rate in the market under co-investment is greater than the rate for the BS investment alone. When the carbon trading market price is greater than a certain threshold ( N 2 ), the recycling rate in the market under co-investment is greater than the rate of EVM investing alone. Thresholds are affected by unit carbon emissions and manufacturing costs, and threshold N 1 is inversely proportional to both the unit manufacturing costs and unit carbon emissions of the BS and the EVM. Threshold N 2 is inversely proportional to the difference between the BS unit cost of raw material production and remanufacturing production and unit carbon emissions. When only BS is responsible for recycling in the market, the government can set a higher carbon trading price to promote recycling behavior in the market. When only EVMs are responsible for recycling in the market, the government can set a lower carbon trading price to promote recycling behavior in the market. Comparing the degrees of recycling efforts under models L and C, it can be seen that the introduction of blockchain technology under the joint recycling model positively or negatively affects the degree of recycling in the market by the remanufacturing variable and the environmental variable, and the introduction of blockchain technology in the supply chain can lead to better recycling when the recycling price of the materials that are laddered and utilized in the market is less than the threshold value N 3 .

5. Numerical Experiments

Pricing, the level of recycling effort, and the level of introduction of blockchain technology were solved and analyzed previously, and the EVB price, EV price, and the level of recycling effort were compared under different models. Due to the large number of variables in the profit formula, the equation is more complex and not easy to compare. Later, we will use data simulation to analyze the choice of enterprise recycling model from three aspects—recycling process-related parameters, carbon emission-related parameters, and blockchain technology-related parameters—and put forward relevant management suggestions. Combining the research data of Liu et al. [44] on the actual EV industry, the parameters are set: a = 150,000, b = 15, c = 1000, k = 120, r = 5, u = 1500, T = 10,000, Q 0 = 1500, ε = 0.5, λ = 0.5, c s = 700, c r = 300, c m = 400, e s = 1, e r = 0.4, e m = 0.3, p c = 1000, p a = 200, ω = 50, η = 0.8, and φ = 0.8.

5.1. Impact of Recycling Environment on Profits

5.1.1. Impact of Unit Recovery Costs and Remanufacturability Rates on BS Margins

As can be seen in Figure 2, for BS, the profit decreases with increasing recycling costs, regardless of the investment model. This is consistent with the conclusion from previous studies that recyclers’ willingness to recycle will decrease as the unit recycling cost increases.
When investing in recycling alone, its profitability decreases as the remanufacturable rate of recyclables increases. It indicates that, in the case of the echelon model, the higher the capacity of recycled batteries, the more recyclers are willing to undertake recycling activities. Under the limit of echelon utilization, BS prefers to recover batteries that can be directly reused when recycling, which can result in greater cost savings. Under the manufacturer-responsible recycling and joint recycling modes, the profit of BS increases with the increase in the remanufacturing rate of recyclables. The more remanufactured batteries that need to go through the supplier under the automaker’s separate recycling or joint recycling model, the lower the manufacturing cost and the greater the profit for BS. In the automaker-responsible recycling model, the profit of BS decreases the most as the recycling cost increases. When it is not involved in recycling activities itself, changes in its profits are influenced by changes in the decisions of other firms in the supply chain. At this point, the company’s profit becomes less easy to regulate and control and more subject to external influences.
Comparing the three recycling models, it can be seen that in this case, BS prefers to participate in the recycling process themselves. Only when the proportion of batteries that can go directly into the recycling process is very high, in terms of the percentage of recycled batteries that can be utilized, does BS prefer the joint recycling model. Otherwise, BS prefers to recycle alone.

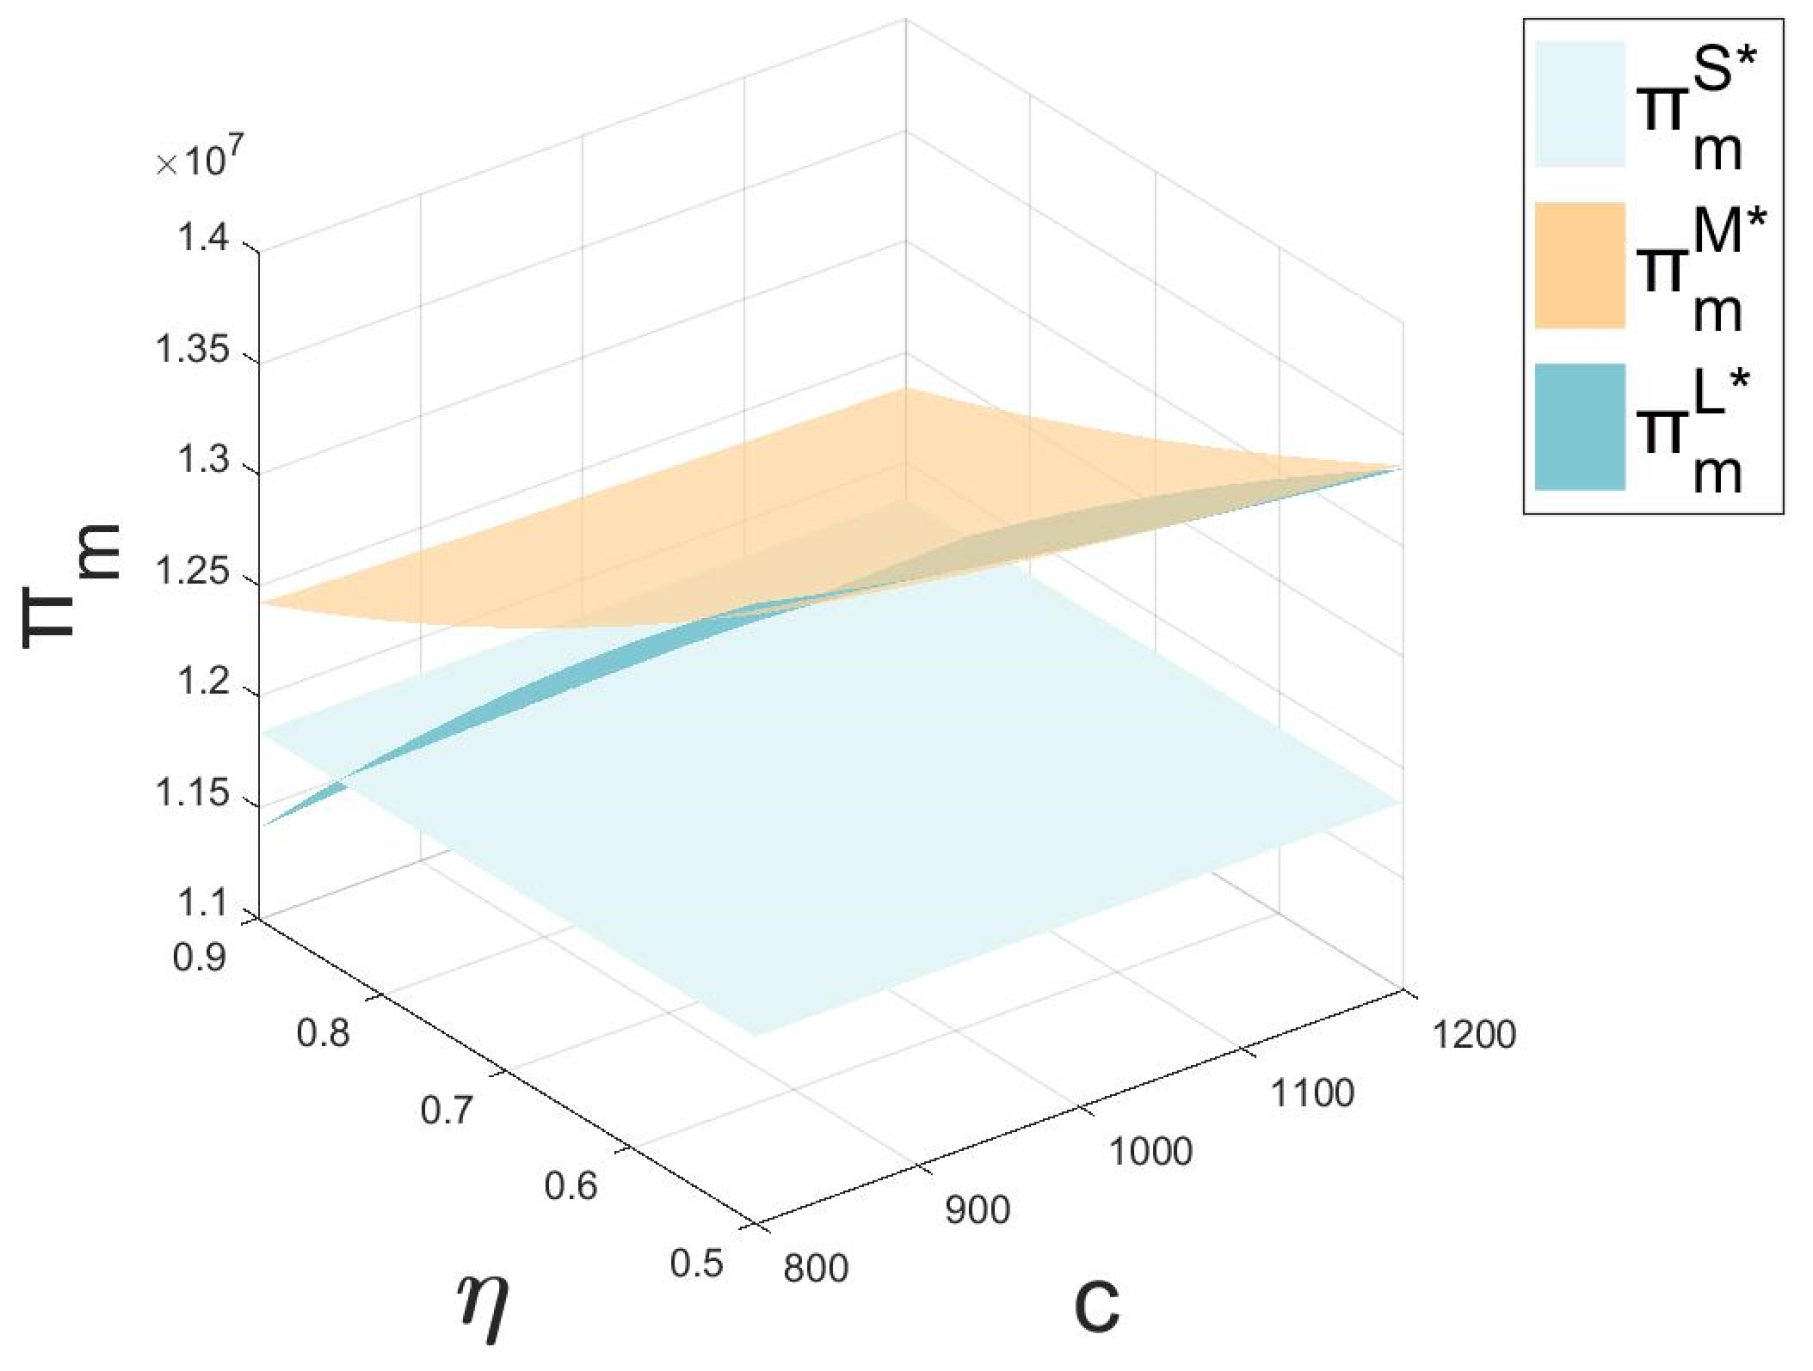
5.1.2. Impact of Unit Recovery Costs and Remanufacturability Rates on EVM Margins

As can be seen in Figure 3, for the EVM, the BS recycling mode does not involve any recycling activities, so the profit does not change with the unit recycling cost or the remanufacturable rate of recyclables. EVM profits become smaller as the remanufacturable rate of recovered products increases under the manufacturer-alone recycling and joint recycling modes. As the change in unit recycling cost is affected by the remanufacturing rate of recyclables, the profit increases with the increase in recycling cost when the remanufacturing rate is larger and decreases with the increase in recycling cost when the remanufacturing rate is smaller. This indicates that the remanufacturing rate compensates for the impact of unit recycling costs on profits.
Comparing the three recycling models, it can be hypothesized that EVMs prefer to participate in the recycling process themselves. Only when the proportion of batteries that can go directly into the recycling process is very small and the cost of recycling is low do automakers favor the joint recycling model. In general, EVM prefers to recycle alone, even though it may be more costly to do so, because instead of purchasing the batteries from BS, the manufacturer can use the recycled batteries directly in the EV manufacturing process, saving manufacturing costs as well as gaining the benefits of transferring the batteries to a BS for remanufacturing.

5.1.3. Impact of Cost-Sharing Ratios and Remanufacturability Rates on BS and EVM’s Profits

As shown in Table A1, Table A2 and Table A3 (see Appendix B), under the co-investment model, the profit of the BS (EVM) decreases as the cost-sharing factor increases and the magnitude of the decrease increases as the remanufacturability ratio increases. Profit increases as the percentage of remanufacturable products increases, and the increase decreases as the percentage of cost-sharing increases. As shown in Figure 4 and Figure 5, for BS, the co-investment recycling model is preferred when the proportion of recyclables that can be remanufactured is large and the proportion of cost-sharing is low. For EVM, the co-investment recycling model is preferred when the remanufacturability of recyclables is low and the cost-sharing ratio is high.

5.1.4. Summary of the Impact of Variables Related to the Recycling Process

The simulation analysis of the variables related to the recycling process shows that, firstly, the reuse of the recycling process can bring about a reduction in production costs and carbon emissions for enterprises, and both BS and EVM are willing to participate in the recycling process themselves. Second, under the joint recycling model, the profit of enterprises decreases with the increase in the proportion of recycling costs borne by them. BS gains significantly more than automakers in the joint recycling model. However, BS and EVM are least profitable under each other’s separate recycling model. Therefore, BS can bear a higher proportion of recycling costs to compensate for the weaker position of EVM in the joint recycling model. Finally, for the government, the existence of recycling and remanufacturing processes in the market can alleviate the pressure of environmental pollution. Although EVs are more environmentally friendly than fuel vehicles, the carbon emissions in the manufacturing process of EVs are higher than those of fuel vehicles, and the echelon utilization of EVBs can alleviate the pollution from the battery production process of EVs to a certain extent. Additionally, policies can subsidize enterprises participating in the recycling process to promote recycling behavior. In terms of policy, enterprises involved in the recycling process can be subsidized and favored to promote recycling behavior.

5.2. Impact of Carbon Emission-Related Variables on Profits

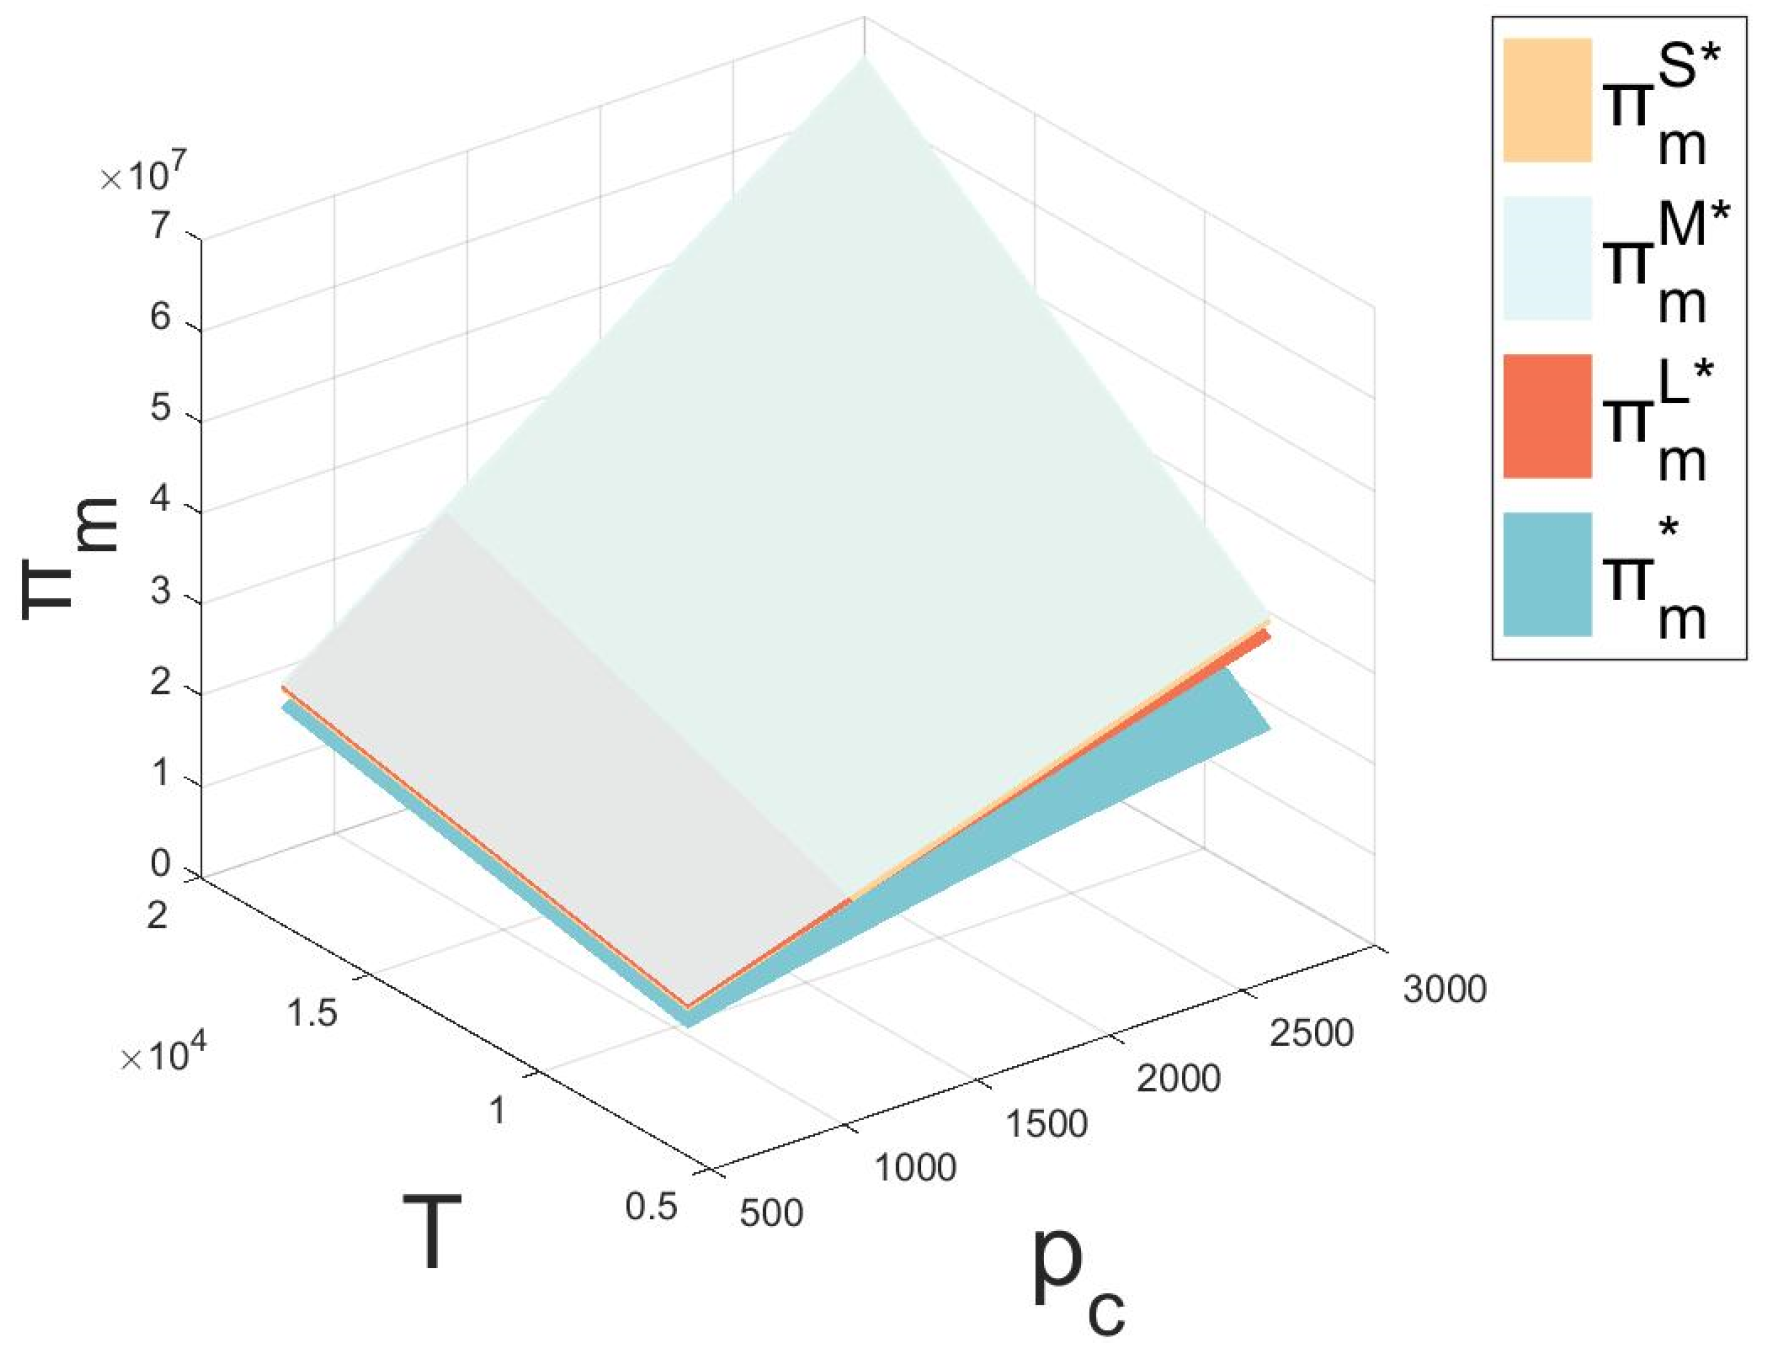
5.2.1. Impact of Carbon Trading Prices and Carbon Emission Allowances on BS’ and EVM’ Profits

As can be seen from Figure 6 and Figure 7, the profits of both BS and EVM increase with the increase in the carbon trading price and carbon limit in all four models. For BS, regardless of how the carbon trading price and carbon limit change in the market, the profit relationship always remains: blockchain model > BS-alone investment model > co-investment model > EVM-alone investment model, regardless of how the carbon trading price and carbon limit change, BS tends to participate in the recycling process and is willing to introduce the blockchain technology.
For EVM, the EVM’s investment model is the most profitable of the four recovery models, followed by the BS’s investment and co-investment models, and the EVM’s profits are greater under the co-investment model when the carbon trading price is lower, and vice versa. As the carbon limit becomes larger, the carbon trading price boundary when their co-investment model profits are better expands. The least profitable strategy is the introduction of the blockchain technology model. For EVM blockchain technology has less impact on the carbon emissions of their manufacturing processes and is therefore less tempting.

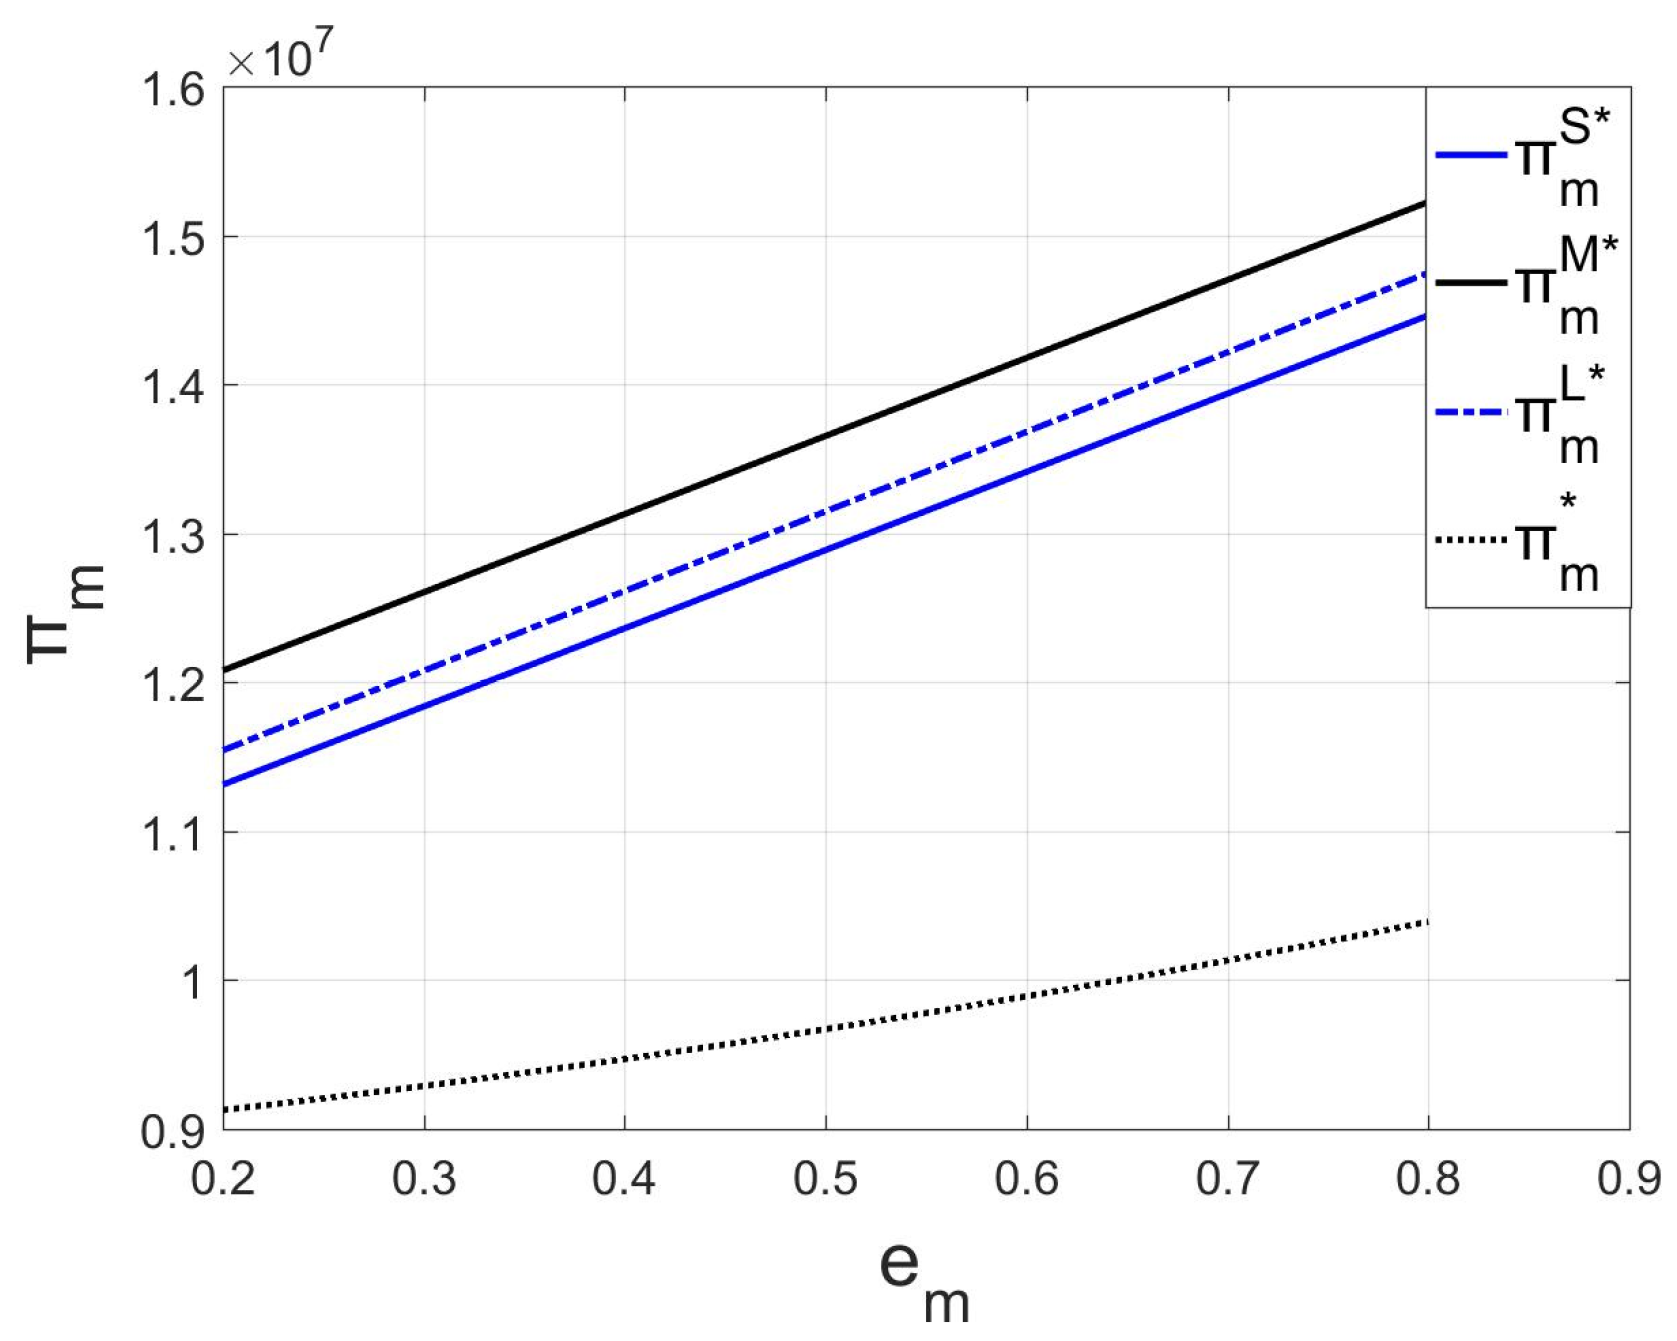
5.2.2. Impact of Carbon Intensity on BS’ and EVM’ Profits

As can be seen in Figure 8 and Figure 9, the profits of the BS all increase with increasing carbon emissions from manufacturing using units of raw materials and decrease with increasing carbon emissions per unit of remanufacturing. As with the consideration of carbon trading prices and carbon allowances, the profit relationship is consistent: blockchain model > BS-alone investment model > co-investment model > EVM-alone investment model. For EVM, the EVM-alone investment model is the most profitable of the four recycling models, followed by the co-investment model and BS-alone investment, and the introduction of the blockchain technology model is the least profitable. The increase in profits for BS is more pronounced with blockchain technology and has less of an impact on EVM.

5.2.3. Impact of Carbon Trading Prices and Carbon Allowances on Total Supply Chain Profits

As shown in Figure 10, it is assumed that the recycling cost-sharing coefficient in the joint recycling model is 0.5. BS and EVM each bear half of the recycling cost. When the carbon trading price is low, the impact of carbon emissions on the profits of enterprises in the supply chain will not have a strong impact on their production strategy. When the price is high, the carbon emissions generated by the production process have a greater impact on the profits of enterprises, and enterprises need to seek ways to reduce emissions, at this time. Blockchain technology can help enterprises better grasp the capacity of the batteries, which effectively realizes the emission reduction of the production process.

5.2.4. Summary of the Impact of Variables Related to Carbon Emissions

The simulation analysis of the variables related to carbon emissions shows that, firstly, the changes in carbon trading price and carbon emission limit and the variable of carbon emissions of the production unit lead to different strategic choices for both parties in the supply chain. For the BS, it is more inclined to introduce blockchain technology to reduce carbon emissions to increase its profit. EVM should invest in recycling alone and is reluctant to introduce blockchain technology. Secondly, compared to carbon allowances, the carbon trading price is an influencing factor for companies’ main strategy choices. Higher carbon trading prices can introduce blockchain technology, and the introduction of blockchain technology is more beneficial to BS when considering blockchain cost sharing. BS can bear a higher proportion of technology cost input or give price concessions to EVM to facilitate cooperation. Finally, carbon allowance and carbon emission trading, as typical carbon emission policies, can encourage enterprises to comply with the requirements of environmental protection policies to implement green production. In this case, the carbon allowance should not be set too high or too low. The government can subsidize blockchain and other technologies that can enhance green production to promote supply chain coordination.

5.3. The Problem of Choosing a Strategy for Introducing Blockchain Technology

5.3.1. Impact of Unit Blockchain Costs and Battery Availability on Total Supply Chain Profitability

As shown in Figure 11, when blockchain technology is introduced in the supply chain, battery recycling will be greatly improved because the battery capacity can be better grasped, and the impact of being affected by the change of the battery availability rate is not considered in Model C. The total profit of the supply chain decreases with the increase in the unit blockchain cost. In model L, the total supply chain profit increases with the increase in battery availability. Thus, the overall picture shows that the profit difference decreases with the increase in unit blockchain cost and battery availability.
In addition, for the supply chain, the change in battery availability has a greater impact on the change in overall supply chain profits. Introducing blockchain technology with or without it has the biggest difference in profits when battery availability is minimal, and the difference gradually decreases to a negative value as battery availability increases. When the battery availability in the recycling market is extremely high, the total profit of the blockchain is higher under the joint recycling model without the introduction of blockchain technology. Universally, the total supply chain profit reflects the suitability of introducing blockchain technology into the recycling and remanufacturing process. The environmental awareness of consumers needs to be taken into account, and when the recycling awareness of consumers in the market is high, introducing blockchain technology can still make the supply chain better.

5.3.2. Impact of Unit Blockchain Costs and Consumer Sensitivity to Blockchain on Strategy

As shown in Figure 12, Model L returns are unaffected by changes in the blockchain correlation coefficient. The total supply chain profit in Model C decreases with increasing unit blockchain cost and increases with increasing consumer sensitivity to blockchain. That is, the profit difference decreases with the increase in unit blockchain cost and increases with the rise in blockchain sensitivity. According to the positive and negative profit difference, it can be found that enterprises in the supply chain should pay more attention to the sensitivity of consumers to blockchain compared with the cost of introducing blockchain technology. And when the sensitivity to blockchain is high, even if the cost of introducing blockchain is high, it can still bring higher benefits to the supply chain. The introduction of blockchain technology allows enterprises in the supply chain to understand the battery capacity of EVs more accurately and add timeliness, which can better realize the utilization of resources and reduce the impact on the environment. At the same time, the more attention consumers pay to information technology in the market, the more consumers can be attracted, and the introduction of blockchain technology can improve the supply chain.

5.3.3. Summary of the Impact of Blockchain Technology-Related Variables

The simulation analysis of the variables related to the introduction of blockchain technology shows that, firstly, the difference in supply chain profits with or without the introduction of blockchain technology decreases with the increase in unit blockchain cost and battery availability. The effect of consumer sensitivity to blockchain on the profit difference is positive. Second, the change in profit difference between battery availability and consumer sensitivity to blockchain is more pronounced compared to the change in unit blockchain cost. When companies in the supply chain make decisions, they should pay more attention to the effects of these two variables. Finally, for the government, the introduction of blockchain technology by enterprises can be used as a green production technology to reduce carbon emissions in the production process, and at the same time, blockchain technology can assist in the construction of infrastructure for the circulation of credible carbon data and the maintenance of the transparency of the carbon trading market. The government can help enterprises reduce investment costs by providing financial incentives to enterprises that adopt blockchain technology, strengthening blockchain technology research and development to reduce the cost of introducing blockchain technology, and other policies.

6. Conclusions and Management Insights

This paper proposes four CLSC models for EVB recycling and remanufacturing to explore the factors influencing the selection of EV recycling models. In addition, this paper explores the impact of carbon emission restrictions and the introduction of blockchain technology on the recycling model. Whereas previous studies have focused on considering the influencing factors individually, further research on recycling model selection under multiple influences is necessary and practical. This study examines the extent of pricing and recycling efforts and the extent of blockchain introduction in the supply chain under four recycling models and investigates the strategic choices of the BS and EVM in terms of the recycling market environment, carbon emissions, and blockchain correlation coefficients. The following conclusions are drawn from the comparative analysis of solving the models under different recycling models and numerical examples.

6.1. Conclusions

This paper constructs four CLSC models for EVBs based on carbon emission constraints, aiming to explore multifaceted factors influencing the selection of EVB recycling channel strategies. Notably, we innovatively incorporate the strategy of echelon utilization for EVBs. On this basis, we comparatively study the impact of blockchain technology-related factors on the equilibrium state of the CLSC. This perspective transcends the limitations of previous single-factor analyses, aligning more closely with complex and dynamic real-world scenarios. To this end, we examine pricing strategies, recycling effort levels, blockchain technology integration, and enterprise profits in the context of the CLSC under four recycling models. Furthermore, we delve into the influence of these factors on the CLSC equilibrium state from multiple perspectives, including the recycling market environment, carbon emission policy constraints, battery echelon utilization, and blockchain technology correlation coefficients, thus providing a theoretical basis for optimal decision making by BS and EVM under different environmental contexts. This paper draws the following conclusions by solving the models under different recycling modes and conducting a comparative analysis of numerical examples.
(1)
From a pricing perspective, whether BS adopts an independent recycling model, EVM pursues an independent recycling approach, or both parties collaborate in a joint recycling model, the differences in recycling channels do not fundamentally alter the optimal pricing strategies of BS and EVM. In this context, the optimal pricing for enterprises is solely influenced by the recycling market environment and carbon emission restrictions. However, upon the introduction of blockchain technology, the optimal pricing for BS and EVM rises compared to when blockchain technology is absent. At this juncture, the optimal pricing is subject to a triple influence: the recycling market environment, carbon emission restrictions, and the correlation coefficients associated with blockchain technology.
(2)
From the perspective of recycling efforts, enterprises under different recycling models have varying degrees of effort. Specifically, when the carbon trading price is low, joint investment models can stimulate greater efforts than BS recycling alone. On the contrary, when carbon trading prices are high, joint investment models outperform EVM recycling alone and show higher enthusiasm for recycling. It is worth noting that the introduction of blockchain technology does not always directly improve recycling efforts, and its effect is influenced by the price of materials for echelon use in the recycling market. When the price is low, the introduction of blockchain technology will bring about higher recycling efforts.
(3)
From the perspective of enterprises’ choice of recycling models, BS and EVM have different equilibrium returns under different recycling models. Therefore, based on their own interests, enterprises tend to choose various recycling models. In general, both BS and EVM obtain more benefits from participating in the recycling process than from not participating. Under the joint recycling model, BS can achieve more significant gains than EVM. The increase in battery utilization rate, the enhancement of consumers’ sensitivity to blockchain, and the higher carbon trading prices are all key factors that drive enterprises to adopt blockchain technology. Likewise, blockchain technology has a greater impact on the gains of BS in CLSC.

6.2. Management Insights

Many well-known European and American automotive companies, including Ford, Caterpillar, and Peugeot, have already implemented recycling strategies for used cars and their components. In Germany, a number of joint ventures have sprung up focusing on the echelon of batteries. These companies are committed to the recovery and reuse of waste batteries, which not only promotes the popularization and application of waste batteries in recycling, but also deeply practices the concept of low-carbon environmental protection, energy conservation, and emission reduction, effectively reducing the manufacturing cost of EVs. Based on the derivation of mathematical models and simulation analysis, this study explores the equilibrium state of enterprises in CLSC under different recycling channels when combining “carbon emission limits”, “battery echelon utilization strategies”, and “blockchain technology”. The aim is to provide innovative and practical management methods for decision makers in the industry, helping them respond flexibly to market changes and challenges.
(1)
From the perspective of BS, faced with carbon emission restrictions and trading policies, the battery recycling and remanufacturing strategy not only significantly reduces production costs, but also effectively curbs carbon emissions generated from the use of raw materials to produce new batteries. Compared to the non-recycling model, participation in the recycling model demonstrates notable profit advantages, making it a favorable strategic business choice for BS. Specifically, the echelon utilization of batteries is intimately linked to the economic benefits of recycling models, meaning that the higher the reusability rate, the more substantial the economic returns from the recycling process. In the CLSC recycling model, the integration of the recycling stage with blockchain technology yields particularly significant gains for BS; therefore, BS should actively engage in related practices. Additionally, given the pivotal position of EVM in the supply chain, BS can explore collaborative models to attract their participation in joint recycling initiatives. Since the gains accruing to BS under joint recycling models typically exceed those of EVM, BS might consider incentivizing EVM’s involvement through reasonable cost-sharing and benefit distribution mechanisms, thereby fostering a mutually beneficial relationship. In summary, when formulating recycling strategies, BS should comprehensively evaluate the current state of echelon utilization of batteries in the market along with the cost-effectiveness of blockchain technology, flexibly selecting the most suitable recycling model. This approach not only aligns with policy directives to achieve sustainable development, but also enables BS to gain a competitive edge in the fierce market competition, thereby enhancing their overall business competitiveness.
(2)
From the perspective of EVM, despite the limited role of battery recycling in directly reducing carbon emissions during vehicle manufacturing in the face of carbon emission restrictions and trading policies, EVM-exclusive recycling remains the most profitable strategy among all recycling models. This is because EVM manufacturers retain pricing power over recycled batteries and reap the benefits of battery echelon utilization. Compared to independent recycling models, the direct benefits of joint recycling models may slightly decrease; yet, when BS undertakes solo recycling, the profits accruing to EVM manufacturers are even more limited. Actively engaging in recycling activities is not only a manifestation of EVM’s environmental responsibility, but also a prudent move to enhance economic efficiency. Notably, when BS shoulders a higher proportion of investments or offers subsidies during collaborative recycling, the joint recycling model transforms into a mutually beneficial solution, deserving serious consideration and adoption by EVM. Furthermore, to further bolster market competitiveness and ensure product compliance with policy directives, EVM should actively explore the potential of integrating blockchain technology into the EV supply chain. The introduction of blockchain technology will forge a highly transparent and traceable information platform, providing manufacturers with robust data support that enables them to excel in the fiercely competitive market. In conclusion, EVM must not only demonstrate flexibility in their recycling strategies, but also fully embrace blockchain technology, applying it to the construction of CLSC networks. By harnessing innovation as a driving force for development, they can lead the industry into the future.
(3)
From the government’s point of view, battery recycling activities not only effectively curb the phenomenon of indiscriminate battery disposal, thereby preventing the potential risk of toxic substance leakage, but also significantly reduce the consumption of natural resources and energy through the strategy of battery echelon utilization, effectively mitigating environmental pollution, which is closely aligned with the government’s environmental protection policy orientation. Therefore, the government should actively promote corporate recycling behavior, advocate for the concept of battery echelon utilization, and incentivize upstream and downstream enterprises in the supply chain to actively participate in battery recycling and reuse. The government can implement recycling subsidy policies to provide economic incentives for recycling enterprises and promote recycling and reuse activities. Addressing the imbalance of interests between BS and EVM in the joint recycling model, government subsidy mechanisms have become crucial in enhancing recycling momentum and balancing the enthusiasm of all parties. Furthermore, promoting the deep integration of digitalization and manufacturing can not only enhance the universality of battery recycling, reducing the complexity of recycling operations for enterprises, but also make production carbon emissions more transparent, helping enterprises establish mutual recognition mechanisms with the European Union, thereby enhancing the international competitiveness of the battery industry. The government can precisely formulate supportive policies such as financial funding support and tax incentives to encourage enterprises to accelerate their integration into the digitalization process. At the same time, given that consumers’ sensitivity to corporate recycling efforts directly impacts the recycling rate, the government needs to strengthen supervision of the recycling market and enhance the attractiveness of recycling services. On the other hand, the implementation of carbon emission regulation policies has also prompted enterprises to participate in recycling and remanufacturing, effectively reducing carbon emissions and fully demonstrating the positive role of government intervention. However, while rising carbon trading prices can incentivize higher recycling rates and reduced carbon emissions, they may also induce a blind pursuit of high carbon prices. Therefore, it is particularly important to reasonably set carbon emission quotas and guide enterprises to participate in carbon trading rationally by regulating their profits. Consequently, regulatory agencies should strive to build a sustainable carbon trading environment, including detailed carbon trading guidelines and setting reasonable price ranges, to promote the stable development of the carbon market and the simultaneous achievement of environmental protection goals.

6.3. Research Contributions and Future Prospects

This paper theoretically examines the impact of carbon emission restrictions and blockchain technology on the selection of battery recycling models for EVs, filling a gap in this research. It provides practical decision support for each company in the supply chain to cope with changes in the external policy environment during the recycling and remanufacturing process. However, it should be noted that this paper only considers the case of a single BS and EVM. In the real world, multiple suppliers and manufacturers are involved. This paper also considers the carbon emission limits of the recycling and remanufacturing process and blockchain technology, which involves a large number of variables and fails to directly compare the different models of the companies. The traditional game model used in the research methodology may not be sufficient to express complex competitive and cooperative relationships, and the specific behaviors of enterprises in practice can be tailored and analyzed through methods such as modeling and simulation of economic systems with multiple actors.

Author Contributions

Conceptualization, W.Y. and Y.Q.; methodology, Y.Q.; software, Y.Q.; validation, J.Z.; formal analysis, Y.Q.; investigation, W.Y., Y.Q. and J.Z.; resources, W.Y.; data curation, Y.Q.; writing—original draft preparation, Y.Q.; writing—review and editing, W.Y.; visualization, Y.Q.; supervision, W.Y. and Y.Q.; project administration, W.Y.; funding acquisition, W.Y. All authors have read and agreed to the published version of the manuscript.

Funding

This research received no external funding.

Informed Consent Statement

Informed consent was obtained from all subjects involved in the study. Written informed consent has been obtained from the patients to publish this paper.

Data Availability Statement

The original contributions presented in the study are included in the article, further inquiries can be directed to the corresponding author.

Conflicts of Interest

The authors declare no conflicts of interest.

Appendix A

Proof of Proposition 1.
First, Equation (3) is brought into (1) and (2), and the first and second-order partial derivatives concerning the manufacturer’s price can be derived for Equation (2) first:
Π m s p m s = 2 b p m s + a + b p s s + b c m + b p c e m = 0 2 Π m s ( p m s ) 2 = 2 b < 0
The first and second-order partial derivatives concerning supplier prices are then derived for Equation (1):
Π s s p s s = a b p m s b 2 p s s + b 2 c s + b 2 p c e s = 0 2 Π s s ( p s s ) 2 = b < 0
Solving Equation (A1) in conjunction with (A2) yields
p m s = 3 a 4 b + 1 4 ( c s + c m + p c e s + p c e m ) p s s = a 2 b + 1 2 ( c s c m + p c e s p c e m )
Substituting (A3) back into Equation (1), the first- and second-order partial derivatives concerning τ s are considered for Π s s :
Π s s τ s = φ k c s η φ k c r + ( 1 φ ) ω 2 c τ s + φ k p c e s η φ k p c e r = 0 2 Π s s ( τ s ) 2 = 2 c < 0
Therefore, it can be obtained from τ s = φ k c s η φ k c r + φ k p c e s η φ k p c e r + ( 1 φ ) k ω 2 c . The pricing and recovery rates under model S are thus obtained, and substituting the results back into Equations (1) and (2) yields the optimal profit for the BS and the EVM Π s s , Π m s . □
Proof of Proposition 2.
First, Equation (8) is brought into (6) and (7), and the first- and second-order partial derivatives concerning the manufacturer’s price can be derived for Equation (7) first:
Π m m p m m = 2 b p m m + a + b p s m + b c m + b p c e m = 0 2 Π m m ( p m m ) 2 = 2 b < 0
The first- and second-order partial derivatives concerning supplier prices are then derived for Equation (6):
Π s m p s m = a b p m m b 2 p s m + b 2 c s + b 2 p c e s = 0 2 Π s m ( p s m ) 2 = b < 0
Solving Equation (A5) in conjunction with (A6) yields
p m m = 3 a 4 b + 1 4 ( c s + c m + p c e s + p c e m ) p s m = a 2 b + 1 2 ( c s c m + p c e s p c e m )
Substituting (A7) back into Equation (7), the first- and second-order partial derivatives concerning τ m are considered for Π m m :
Π m m τ m = ( 1 η ) φ k [ a 2 b + 1 2 ( c s c m + p c e s p c e m ) ] + η φ k p a + ( 1 φ ) ω 2 c τ m = 0 2 Π m m ( τ m ) 2 = 2 c < 0
Therefore, it can be obtained from τ m = ( 1 η ) φ k 2 c s ( 1 η ) φ k 2 c m + ( 1 η ) φ k 2 p c e s ( 1 η ) φ k 2 e m + ( 1 φ ) k ω + ( 1 η ) φ k a 2 b + η φ k p a 2 c .
The pricing and recovery rates under model M are thus obtained, and substituting the results back into Equations (6) and (7) yields the optimal profit for the BS and the EVM Π s m , Π m m . □
Proof of Proposition 3.
First, by bringing Equation (14) into (11)–(13), the first- and second-order partial derivatives concerning the manufacturer’s price can be derived first for Equation (12):
Π m l p m l = 2 b p m l + a + b p s l + b c m + b p c e m = 0 2 Π m l ( p m l ) 2 = 2 b < 0
The first- and second-order partial derivatives concerning supplier prices are then derived for Equation (11):
Π s l p s l = a b p m l b 2 p s l + b 2 c s + b 2 p c e s = 0 2 Π s l ( p s l ) 2 = b < 0
Solving Equation (A5) in conjunction with (A6) yields
p m l = 3 a 4 b + 1 4 ( c s + c m + p c e s + p c e m ) p s l = a 2 b + 1 2 ( c s c m + p c e s p c e m )
Substituting (A11) back into Equation (13), the first- and second-order partial derivatives concerning τ l are considered for Π l :
Π l τ l = ( c s c r ) η φ k + ( 1 η ) φ k [ a 2 b + 1 2 ( c s c m + p c e s p c e m ) ] + ( 1 φ ) ω 2 c τ l = 0 2 Π l ( τ l ) 2 = 2 c < 0
Thus, it can be derived:
τ l = ( 1 + η ) φ k 2 c s η φ k c r ( 1 η ) φ k 2 c m + ( 1 + η ) φ k 2 p c e s η φ k p c e r ( 1 η ) φ k 2 p c e m + ( 1 η ) φ k a 2 b + ( 1 φ ) k ω 2 c
The optimal profit for the BS, EVM, and the total supply chain can be obtained by substituting the results in Equations (17)–(19) in the main text. The pricing and recovery rates under model M are obtained, and substituting the results back into Equations (19)–(21) yields the optimal profit for the BS, the EVM, and the total supply chain Π s l , Π m l , Π l . □
Proof of Proposition 4.
First, by bringing Equation (20) into (17)–(19), the first- and second-order partial derivatives concerning the manufacturer’s price can be derived first for Equation (18):
Π m p m = 2 b p m s + a + r g + b p s s + b c m + b p c e m = 0 2 Π m ( p m ) 2 = 2 b < 0
The first- and second-order partial derivatives concerning supplier prices are then derived for Equation (17):
Π s p s = a b p m + r g b 2 p s + b 2 c s + b 2 p c e s = 0 2 Π s ( p s ) 2 = b < 0
Solving equation (A13) in conjunction with (A14) yields
p m = 3 a + 3 rg 4 b + 1 4 ( c s + c m + p c e s + p c e m ) p s = a + rg 2 b + 1 2 ( c s c m + p c e s p c e m )
Substituting (A15) back into Equation (19), the first- and second-order partial derivatives concerning τ are considered for Π :
Π τ = a + r g 2 b ( 1 η ) k + ( 1 η ) k 2 c s ( 1 η ) k 2 c m η k c r + ( 1 η ) k 2 p c e s ( 1 η ) k 2 p c e m η k p c e r = 0 2 Π ( τ ) 2 = 2 c < 0
We solve Equation (19) for the first- and second-order partial derivatives concerning g:
Π g = r 2 b ( 1 η ) Q + ( 1 η ) ( k 2 ( 1 η ) r 4 b c + r ) [ a + rg 2 b + 1 2 ( c s c m + p c e s p c e m ) ] + 3 r 4 b q + r 4 [ 3 a + 3 rg 4 b + 1 4 ( c s + c m + p c e s + p c e m ) ] r 4 c s r 4 c m + η ( k 2 ( 1 η ) r 4 b c + r ) ( c s c r ) ( 1 η ) k r 2 b τ 2 u g p c [ e s ( r 4 k 2 r ( 1 η ) η 4 b c η r ) + e r ( k 2 r ( 1 η ) η 4 b c η r ) + r 4 e m ] = 0 2 Π ( g ) 2 = 2 u < 0
We bring in (A16) to find:
g = ( 1 η ) r 2 b Q 0 + ( 1 η ) 2 k 2 r + 7 b c r 4 b c η r 8 b 2 c a + ( 1 η 2 ) k 2 r + b c r + 4 b c η r 8 b c c s η ( 1 η ) k 2 r + 4 b c η r 4 b c c r ( 1 η ) 2 k 2 r + 7 b c r 4 b c η r 8 b c c m + ( 1 η 2 ) k 2 r + b c r + 4 b c η r 8 b c p c e s η ( 1 η ) k 2 r + 4 b c η r 4 b c p c e r ( 1 η ) 2 k 2 r + 7 b c r 4 b c η r 8 b c p c e m 2 u r 2 ( 1 η ) 2 k 2 + 11 b c 8 b c η 8 b 2 c
Organized:
g = 4 b c r ( 1 η ) Q 0 + [ ( 1 η ) 2 k 2 r + 7 b c r 4 b c η r ] a + [ ( 1 η 2 ) k 2 b r + b 2 c r + 4 b 2 c η r ] c s [ 2 η ( 1 η ) k 2 b r + 8 b 2 c η r ] c r [ ( 1 η ) 2 k 2 b r + 7 b 2 c r 4 b 2 c η r ] c m + [ ( 1 η 2 ) k 2 b r + b 2 c r + 4 b 2 c η r ] p c e s [ 2 η ( 1 η ) k 2 b r + 8 b 2 c η r ] p c e r [ ( 1 η ) 2 k 2 b r + 7 b 2 c r 4 b 2 c η r ] p c e m 16 b 2 c u ( 1 η ) 2 k 2 r 2 11 b c r 2 + 8 b c η r 2
The optimal recovery rate under model M is obtained by bringing g into (A16) and substituting the results back into Equations (17)–(19) in the main text to obtain the optimal profit of the BS, the EVM, and the total supply chain under this model Π s , Π m , Π . □
Proof of Corollary 4.
τ k = ( 1 + η ) 2 c s η c r ( 1 η ) 2 c m + ( 1 + η ) 2 p c e s η p c e r ( 1 η ) 2 p c e m + ( 1 η ) a 2 b + ( 1 η ) r 2 b g + ( 1 η ) k r 2 b g k 2 c
Among them,
g = 4 b c r ( 1 η ) Q 0 + [ ( 1 η ) 2 k 2 r + 7 b c r 4 b c η r ] a + [ ( 1 η 2 ) k 2 b r + b 2 c r + 4 b 2 c η r ] c s [ 2 η ( 1 η ) k 2 b r + 8 b 2 c η r ] c r [ ( 1 η ) 2 k 2 b r + 7 b 2 c r 4 b 2 c η r ] c m + [ ( 1 η 2 ) k 2 b r + b 2 c r + 4 b 2 c η r ] p c e s [ 2 η ( 1 η ) k 2 b r + 8 b 2 c η r ] p c e r [ ( 1 η ) 2 k 2 b r + 7 b 2 c r 4 b 2 c η r ] p c e m 16 b 2 c u ( 1 η ) 2 k 2 r 2 11 b c r 2 + 8 b c η r 2
g k = Y [ 16 b 2 c u ( 1 η ) 2 k 2 r 2 11 b c r 2 + 8 b c η r 2 ] 2
Y = [ 2 ( 1 η ) 2 k r a + 2 ( 1 η 2 ) k c s 2 η ( 1 η ) k 2 b r c r 2 ( 1 η ) 2 k b r c m + 2 ( 1 η 2 ) k b r p c e s 4 η ( 1 η ) k b r p c e r 2 ( 1 η ) 2 k b r p c e m ] [ 16 b 2 c u ( 1 η ) 2 k 2 r 2 11 b c r 2 + 8 b c η r 2 ] + { 4 b c r ( 1 η ) Q 0 + [ ( 1 η ) 2 k 2 r + 7 b c r 4 b c η r ] a + [ ( 1 η 2 ) k 2 b r + b 2 c r + 4 b 2 c η r ] c s [ 2 η ( 1 η ) k 2 b r + 8 b 2 c η r ] c r [ ( 1 η ) 2 k 2 b r + 7 b 2 c r 4 b 2 c η r ] c m + [ ( 1 η 2 ) k 2 b r + b 2 c r + 4 b 2 c η r ] p c e s [ 2 η ( 1 η ) k 2 b r + 8 b 2 c η r ] p c e r [ ( 1 η ) 2 k 2 b r + 7 b 2 c r 4 b 2 c η r ] p c e m } [ 2 ( 1 η ) 2 k r 2 ]
Proof of Corollary 6.
τ l τ s = ( 1 η ) φ k 4 c ( c s c m p c e s p c e m + a b )
0 < p c < a b ( c s + c m ) e s + e m , τ l > τ s
Honorific   title :   N 1 = a b ( c s + c m ) e s + e m
τ l τ m = η φ k 2 c ( c s c r + p c e s p c e r p a )
p c > c s c r p a e r e s , τ l > τ m
The   order :   N 2 = p a ( c s c r ) e s e r .
τ τ l = ( 1 + η ) ( 1 φ ) k 4 c c s ( 1 φ ) η k 2 c c r ( 1 η ) ( 1 φ ) k 4 c c m + ( 1 + η ) ( 1 φ ) k 4 c p c e s η k ( 1 φ ) 2 c p c e r ( 1 η ) ( 1 φ ) k 4 c p c e m + ( 1 η ) ( 1 φ ) k 4 b c a ( 1 φ ) k 2 c ω + ( 1 η ) k r 4 b c g
Let :   Z = 4 b c ( 16 b 2 c u ( 1 η ) 2 k 2 r 2 11 b c r 2 + 8 b c η r 2 ) ( 1 η ) k r
Get : τ τ l = ( 1 + η ) ( 1 φ ) k 4 c c s ( 1 φ ) η k 2 c c r ( 1 η ) ( 1 φ ) k 4 c c m + ( 1 + η ) ( 1 φ ) k 4 c p c e s η k ( 1 φ ) 2 c p c e r ( 1 η ) ( 1 φ ) k 4 c p c e m + ( 1 η ) ( 1 φ ) k 4 b c a ( 1 φ ) k 2 c ω + ( 1 η ) k r 4 b c g
We bring g into the get expression:
τ τ l = [ ( 1 + η ) ( 1 φ ) k 4 c ( 1 η 2 ) k 2 b r + b 2 c r + 4 b 2 c η r Z ] ( c s + p c e s ) [ ( 1 φ ) η k 2 c 2 η ( 1 η ) k 2 b r + 8 b 2 c η r Z ] ( c r + p c e r ) [ ( 1 η ) ( 1 φ ) k 4 c ( 1 η ) 2 k 2 b r + 7 b 2 c r 4 b 2 c η r Z ] ( c m + p c e m ) + [ ( 1 η ) ( 1 φ ) k 4 b c ( 1 η ) 2 k 2 r + 7 b c r 4 b c η r Z ] a ( 1 φ ) k 2 c ω k r 2 ( 1 η ) 2 Q 0 16 b 2 c u ( 1 η ) 2 k 2 r 2 11 b c r 2 + 8 b c η r 2 > 0
The honorific title:
N 3 = [ ( 1 + η ) ( 1 φ ) k 4 c ( 1 η 2 ) k 2 b r + b 2 c r + 4 b 2 c η r Z ] 2 c ( c s + p c e s ) ( 1 φ ) k [ ( 1 φ ) η k 2 c 2 η ( 1 η ) k 2 b r + 8 b 2 c η r Z ] 2 c ( c r + p c e r ) ( 1 φ ) k [ ( 1 η ) ( 1 φ ) k 4 c ( 1 η ) 2 k 2 b r + 7 b 2 c r 4 b 2 c η r Z ] 2 c ( c m + p c e m ) ( 1 φ ) k + [ ( 1 η ) ( 1 φ ) k 4 b c ( 1 η ) 2 k 2 r + 7 b c r 4 b c η r Z ] 2 c a ( 1 φ ) k 2 ck r 2 ( 1 η ) 2 Q 0 ( 1 φ ) [ 16 b 2 c u ( 1 η ) 2 k 2 r 2 11 b c r 2 + 8 b c η r 2 ]

Appendix B

Table A1. Profits under the joint recovery model at η = 0.9 ( π s s = 16,846,897.6, π m m = 12,369,697.6).
ε π s l π s l π s s π m l π m l π m m
0.417,228,117381,219.811,346,341−1,023,357
0.616,890,38243,484.1611,684,077−685,621
0.816,552,646−294,25212,021,812−347,885
0.417,228,117381,219.811,346,341−1,023,357
Table A2. Profits under the joint recovery model at η = 0.7 ( π s s = 17,141,694.4, π m m = 12,872,790.4).
ε π s l π s l π s s π m l π m l π m m
0.416,177,102−964,5931,2461,216−411,575
0.615,899,823−1,241,87112,738,495−134,296
0.815,622,544−1,519,15013,015,773142,982.9
0.416,177,102−964,59312,461,216−411,575
Table A3. Profits under the joint recovery model at η = 0.5 ( π s s = 17,407,000, π m m = 13,512,280).
ε π s l π s l π s s π m l π m l π m m
0.415,247,000−2,160,00013,410,940−101,340
0.615,024,280−2,382,72013,633,660121,380
0.814,801,560−2,605,44013,856,380344,100
0.415,247,000−2,160,00013,410,940−101,340

References

  1. Foumani, M.; Smith-Miles, K. The impact of various carbon reduction policies on green flow shop scheduling. Appl. Energy 2019, 249, 300–315. [Google Scholar] [CrossRef]
  2. Halat, K.; Hafezalkotob, A. Modeling carbon regulation policies in inventory decisions of a multi-stage green supply chain: A game theory approach. Comput. Ind. Eng. 2019, 128, 807–830. [Google Scholar] [CrossRef]
  3. Liu, J.; Qiu, F.; Zhang, T.; Liu, H. Dynamics of green economic development in countries joining the belt and road initiative: Is it driven by green investment transformation? J. Environ. Manag. 2023, 347, 118969. [Google Scholar] [CrossRef] [PubMed]
  4. Zahoor, A.; Yu, Y.; Zhang, H.; Nihed, B.; Afrane, S.; Peng, S.; S’api, A.; Lin, C.J.; Mao, G. Can the new energy vehicles (NEVs) and power battery industry help China to meet the carbon neutrality goal before 2060? J. Environ. Manag. 2023, 336, 117663. [Google Scholar] [CrossRef] [PubMed]
  5. Eichner, T.; Pethig, R. EU-type carbon regulation and the waterbed effect of green energy promotion. Energy Econ. 2019, 80, 656–679. [Google Scholar] [CrossRef]
  6. Vaughan, A. The looming electric car battery waste mountain. New Sci. 2023, 244, 12. [Google Scholar] [CrossRef]
  7. Bobba, S.; Mathieux, F.; Blengini, G.A. How will second-use of batteries affect stocks and flows in the EU? A model for traction Li-ion batteries. Resour. Conserv. Recycl. 2019, 145, 279–291. [Google Scholar] [CrossRef]
  8. Malinauskaite, J.; Anguilano, L.; Rivera, X.S. Circular waste management of electric vehicle batteries: Legal and technical perspectives from the EU and the UK post Brexit. Int. J. Thermofluids 2021, 10, 100078. [Google Scholar] [CrossRef]
  9. Schultmann, F.; Engels, B.; Rentz, O. Closed-Loop Supply Chains for Spent Batteries. Interfaces 2003, 33, 57–71. [Google Scholar] [CrossRef]
  10. Virmani, N.; Agarwal, V.; Karuppiah, K.; Agarwal, S.; Raut, R.D.; Paul, S.K. Mitigating barriers to adopting electric vehicles in an emerging economy context. J. Clean. Prod. 2023, 414, 137557. [Google Scholar] [CrossRef]
  11. Vallera, A.M.; Nunes, P.M.; Brito, M.C. Why we need battery swapping technology. Energy Policy 2021, 157, 112481. [Google Scholar] [CrossRef]
  12. Majeed, U.; Khan, L.U.; Yaqoob, I.; Kazmi, S.M.A.; Salah, K.; Hong, C.S. Blockchain for IoT-based smart cities: Recent advances, requirements, and future challenges. J. Netw. Comput. 2021, 181, 103007. [Google Scholar] [CrossRef]
  13. Fleischmann, M.; Bloemhof-Ruwaard, J.M.; Dekker, R. Quantitative Models for Reverse Logistics: A Review. Eur. J. Oper. Res. 1997, 103, 1–17. [Google Scholar] [CrossRef]
  14. Guide, J.V.; Jayaraman, V.; Srivastava, R.; Benton, W.C. Supply-chain management for recoverable manufacturing systems. Interfaces 2000, 30, 125–142. [Google Scholar] [CrossRef]
  15. Karuppiah, K.; Sankaranarayanan, B. An integrated multi-criteria decision-making approach for evaluating e-waste mitigation strategies. Appl. Soft Comput. 2023, 144, 110420. [Google Scholar] [CrossRef]
  16. De, A.; Ray, A.; Kundu, T.; Sheu, J.B. Is it wise to compete or to collaborate? Remanufacturing business models under collective extended producer responsibility legislation. Transp. Res. Part E Logist. Transp. Rev. 2023, 179, 103294. [Google Scholar] [CrossRef]
  17. Lin, J.; Naim, M.; Tang, O. In-house or outsourcing? The impact of remanufacturing strategies on the dynamics of component remanufacturing systems under lifecycle demand and returns. Eur. J. Oper. Res. 2024, 315, 965–979. [Google Scholar] [CrossRef]
  18. Feng, Z.; Li, F.; Tan, C. Supplier development or supplier integration? Equilibrium analysis in competing electric vehicle supply chains with power battery recycling. Expert Syst. Appl. 2024, 238, 121519. [Google Scholar] [CrossRef]
  19. Chen, J.; Tian, Y.; Chan, F.T.S.; Tang, H.; Che, P.H. Pricing, greening, and recycling decisions of capital-constrained closed-loop supply chain with Pricing, greening, and recycling decisions of capital-constrained closed-loop supply chain with government subsidies under financing strategies. J. Clean. 2024, 438, 140797. [Google Scholar] [CrossRef]
  20. Jena, S.K.; Meena, P. Competitive sustainable processes and pricing decisions in omnichannel closed-up supply chains under different channel power structures. J. Retail. Consum. Serv. 2022, 69, 103114. [Google Scholar] [CrossRef]
  21. Hosseini-Motlagh, S.M.; Ebrahimi, S.; Zirakpourdehkordi, R. Coordination of dual-function acquisition price and corporate social responsibility in a sustainable closed-loop supply chain. J. Clean. Prod. 2020, 251, 119629. [Google Scholar] [CrossRef]
  22. Zhou, Y.; Zhang, Y.; Wahab, M.I.M.; Goh, M. Channel leadership and performance for a closed-loop supply chain considering competition. Transp. Res. Part E Logist. Transp. Rev. 2023, 175, 103151. [Google Scholar] [CrossRef]
  23. Esenduran, G.; Lin, Y.T.; Xiao, W.L.; Jin, M.Y. Choice of electronic waste recycling standard under recovery channel competition. Manuf. Serv. Oper. Manag. 2020, 22, 495–512. [Google Scholar] [CrossRef]
  24. Yang, Y.; Lin, J.; Hedenstierna, C.P.T.; Zhou, L. The more the better? The impact of the number and location of product recovery options on the system dynamics in a closed-loop supply chain. Transp. Res. Part E Logist. Transp. Rev. 2023, 175, 109863. [Google Scholar] [CrossRef]
  25. Huang, Q.L.; Hou, J.; Shen, H.C. Remanufacturing and pricing strategies under modular architecture. Comput. Ind. Eng. 2024, 188, 109863. [Google Scholar] [CrossRef]
  26. Ma, P.; Meng, Y. Optimal financing strategies of a dual-channel closed-loop supply chain. Electron. Commer. Res. 2022, 53, 101140. [Google Scholar] [CrossRef]
  27. Wu, J.; Zhang, L.; Shen, X. Outsourcing or Authorizing? Optimal Options for Third-Party Remanufacturing Modes with Green Consumerism. Sustainability 2024, 16, 1914. [Google Scholar] [CrossRef]
  28. Shekarian, E.; Marandi, A.; Majava, J. Dual-channel remanufacturing closed-loop supply chains under carbon footprint and collection competition. Sustain. Prod. Consum. 2021, 28, 1050–1075. [Google Scholar] [CrossRef]
  29. Ghadge, A.; Mogale, D.G.; Bourlakis, M.; Maiyar, L.M.; Moradlou, H. Link between Industry 4.0 and green supply chain management: Evidence from the automotive industry. Comput. Ind. Eng. 2022, 169, 108303. [Google Scholar] [CrossRef]
  30. Shahparvari, S.; Soleimani, H.; Govindan, K.; Bodaghi, B.; Fard, M.T.; Jafari, H. Closing the loop: Redesigning sustainable reverse logistics network in uncertain supply chains. Comput. Ind. Eng. 2021, 157, 107093. [Google Scholar] [CrossRef]
  31. Liu, X.; Sun, X.; Zheng, H.; Huang, D. Do policy incentives drive electric vehicle adoption? Evidence from China. Transp. Res. Part A Policy Pract. 2021, 150, 49–62. [Google Scholar] [CrossRef]
  32. Littlejohn, C.; Proost, S. What role for electric vehicles in the decarbonization of the car transport sector in Europe? Econ. Transp. 2022, 32, 100283. [Google Scholar] [CrossRef]
  33. Li, S.; Bin, Z.; Jia, D. Optimal decisions for hybrid manufacturing and remanufacturing with trade-in program and carbon tax. Omega 2024, 124, 103012. [Google Scholar] [CrossRef]
  34. Jauhari, W.A.; Pujawan, I.N.; Suef, M. A closed-loop supply chain inventory model with stochastic demand, hybrid production, carbon emissions, and take-back incentives. J. Clean. Prod. 2021, 320, 128835. [Google Scholar] [CrossRef]
  35. Guo, Y.; Wang, M.; Yang, F. Joint emission reduction strategy considering channel inconvenience under different recycling structures. Comput. Ind. Eng. 2022, 169, 108159. [Google Scholar] [CrossRef]
  36. Yang, L.; Lan, L.; Wan, Y. Recycling and differential pricing strategies in closed-loop supply chains considering blockchain. Electron. Commer. Res. 2024. [Google Scholar] [CrossRef]
  37. Zhang, X.G.; Zhu, S.L.; Dai, S.Q.; Jiang, Z.G.; Gong, Q.S.; Wang, Y. Optimization of third party take-back enterprise collection strategy based on blockchain and remanufacturing reverse logistics. Comput. Ind. Eng. 2024, 187, 109846. [Google Scholar] [CrossRef]
  38. Silva, E.R.D.S.; Lohmer, J.; Rohla, M.; Angelis, J. Unleashing the circular economy in the electric vehicle battery supply chain: A case study on data sharing and blockchain potential, Resources. Conserv. Recycl. 2023, 193, 106969. [Google Scholar] [CrossRef]
  39. Meyer, D.; Schaupensteiner, N.; Riquel, J. Business Models and Ecosystems in the Circular Economy Using the Example of Battery Second Use Storage Systems. Sustainability 2024, 16, 1906. [Google Scholar] [CrossRef]
  40. Bera, S.; Giri, B.C. Evolutionary game analysis for non-cooperative behavior of entities in a closed-loop green supply chain under government intervention. Soft Comput. 2023, 27, 17785–17808. [Google Scholar] [CrossRef]
  41. Zhang, Z.; Liang, H. Research on coordination of the NEV battery closed-loop supply chain considering CSR and fairness concerns in third-party recycling models. Sci. Rep. 2023, 13, 22172. [Google Scholar] [CrossRef]
  42. Wei, J.; Govindan, K.; Li, Y.; Zhao, J. Pricing and collecting decisions in a closed-loop supply chain with symmetric and asymmetric information. Comput. Oper. Res. 2015, 54, 257–265. [Google Scholar] [CrossRef]
  43. Jena, S.K.; Sarmah, S.P.; Padhi, S.S. Impact of government incentive on price competition of closed-loop supply chain systems. INFOR Inf. Syst. Oper. Res. 2018, 56, 192–224. [Google Scholar] [CrossRef]
  44. Liu, H.; Ye, L.L.; Sun, J.N. Automotive parts remanufacturing models: Consequences for ELV take-back under government regulations. J. Clean. Prod. 2023, 416, 137760. [Google Scholar] [CrossRef]
  45. Savaskan, R.C.; Bhattacharya, S.; Wassenhove, L.N.V. Closed-loop supply chain models with product remanufacturing. Manag. Sci. 2004, 50, 239–252. [Google Scholar] [CrossRef]
  46. Turki, S.; Sauvey, C.; Rezg, N. Modeling and optimization of a manufacturing/remanufacturing system with storage facility under carbon cap and trade policy. J. Clean. Prod. 2018, 193, 441–458. [Google Scholar] [CrossRef]
  47. Wei, Y.; Zhu, R.; Tan, L. Emission trading scheme, technological innovation, and competitiveness: Evidence from China’s thermal power enterprises. J. Environ. Manag. 2022, 320, 115874. [Google Scholar] [CrossRef]
Figure 1. CLSC model of EVB under carbon emission control.
Sustainability 16 07737 g001aSustainability 16 07737 g001b
Figure 2. Impact of unit recovery costs and remanufacturability rates on BS margins.
Sustainability 16 07737 g002
Figure 3. Impact of unit recovery costs and remanufacturability rates on EVM margins.
Sustainability 16 07737 g003
Figure 4. Impact of cost-sharing ratios and remanufacturability rates on BS margins.
Sustainability 16 07737 g004
Figure 5. Impact of cost-sharing ratios and remanufacturability rates on EVM margins.
Sustainability 16 07737 g005
Figure 6. Impact of carbon emission-related variables on BS margins.
Sustainability 16 07737 g006
Figure 7. Impact of carbon emission-related variables on EVM margins.
Sustainability 16 07737 g007
Figure 8. Impact of carbon intensity on BS margins.
Sustainability 16 07737 g008
Figure 9. Impact of carbon intensity on EVM margins.
Sustainability 16 07737 g009
Figure 10. Impact of carbon trading prices and carbon allowances on total supply chain profits.
Sustainability 16 07737 g010
Figure 11. Impact of unit blockchain costs and battery availability on total supply chain profita-bility.
Sustainability 16 07737 g011
Figure 12. Impact of unit bockchain costs and consumer sensitivity to blockchain on Strategy.
Sustainability 16 07737 g012
Table 1. Parameters and definitions.
ParametersDefinition
p c Carbon allowance market prices
ω Unit price of metal elements sold under recycled battery echelon
c s / c r Unit cost of raw materials/remanufacturing used by BS
c m Unit cost of manufacturing carried out by EVM
q i Market demand under the i-model
TFree carbon allowances allocated to businesses by the government
E s i ,   E m i Carbon emissions from BS and EVM under model i
p s S , p s M , p s L , p s Selling price of batteries in S, M, L, and C modes by BS
p m S , p m M , p m L , p m Selling prices of EVs by EVM in S, M, L, and C modes
τ Level of the recycling effort
π s S , π s M , π s L , π s Profitability of BS in S, M, L, and C models
π m S , π m M , π m L , π m EVB profits in S, M, L, and C models
Disclaimer/Publisher’s Note: The statements, opinions and data contained in all publications are solely those of the individual author(s) and contributor(s) and not of MDPI and/or the editor(s). MDPI and/or the editor(s) disclaim responsibility for any injury to people or property resulting from any ideas, methods, instructions or products referred to in the content.

