Abstract
The sharing economy is beneficial for sustainable development. It effectively utilizes underused resources and reduces unnecessary production, consumption, and waste through resource sharing. This study investigates the factors that can increase consumers’ perceived sustainability of a sharing economy service and examines the impact of perceived sustainability on their intentions to continue using the service. Furthermore, the study considers the moderating effect of perceived green transparency. Internet surveys are conducted to collect responses from users of a transportation service (Uber) and an on-demand logistics service (Uber Eats). This study provides suggestions for service providers in the sharing economy to develop sustainability strategies.
1. Introduction
In recent years, sustainability has become an important issue. Sustainable development can be divided into environmental, social, and economic dimensions [1,2,3]. The main goals of sustainable development are environmental protection, social equality, and economic growth. Therefore, it is essential to improve economic development while enhancing environmental protection and social development.
A sharing economy is built on online platforms to make better use of underused assets. The sharing economy helps improve sustainability [2,4]. With people increasingly accepting sharing economy services, prior studies have found that sustainability is a key factor driving people to use sharing economy services [3,5,6]. However, only a few studies have explored the antecedents of perceived sustainability. This study aims to bridge this knowledge gap and explore the strategies that a sharing economy company can employ to heighten consumers’ perceptions of sustainability, thereby intensifying their intention to use sharing economy services.
This study explores the factors that determine consumers’ perceived sustainability of a sharing economy service and how this perception influences consumers’ intention to continue using the service. The moderating effects of perceived green transparency and the type of sharing economy service were also examined. The remainder of this paper is organized as follows: The literature on the sharing economy and sustainability is reviewed in Section 2. The research model and hypotheses are presented in Section 3. Section 4 describes the research methodology, and Section 5 presents the data analysis results. Finally, we conclude with the research findings and theoretical and practical implications in Section 6.
2. Literature Review
2.1. Sharing Economy
The concept of sharing economy services emerged in the early 2000s, paralleling the advancement of information and communication technology. This new business model has fostered the proliferation of product and service sharing on online platforms. An increasing number of companies are actively engaging in the sharing economy, implying that not only individuals participate in the sharing of goods and services but also that businesses join the shared economy to refrain from wasting energy and overconsumption. GlobalNewsWire [7] reported that the market size of the sharing economy will reach USD 600 billion by 2027. The sharing economy is an umbrella term that includes a wide variety of activities that aim to maximize the use of under-utilized assets, generally for a fee [8,9]. The sharing economy involves various types of transactions, including peer-to-peer (P2P), business-to-consumer (B2C), and business-to-business (B2B) models [8]; among them, P2P is the major business model [10].
The sharing economy has provided significant benefits to society; for example, Airbnb and Uber are models with significant success [11]. The sharing economy can help address various environmental and societal issues such as air pollution and excessive energy consumption, foster interpersonal connections, enhance access to resources, and alleviate poverty [10]. The sharing economy improves sustainability by reducing consumption because sharing resources instead of individual ownership can help reduce resource depletion. People use sharing platforms to rent assets and services to others to maximize the use of assets and minimize unnecessary production, consumption, and waste.
Prior studies have shown that sustainability is a key factor that drives consumers to participate in the sharing economy. Hamari et al. [10] argued that sustainability is an intrinsic motivation that enhances consumers’ attitudes toward the sharing economy and further increases their intention to participate in the sharing economy. Huang and Kuo [12] reported that people with environmental consciousness have a favorable attitude toward sharing idle assets in the sharing economy and thus have intentions to share. Arteaga-Sánchez et al. [13] showed that the positive environmental impact of a sharing economy service can increase consumers’ satisfaction and further increase their continuance intentions. Gazzola et al. [14] and Llanos et al. [6] also confirmed that sustainability has a positive and direct impact on consumers’ participation in the sharing economy. Although the positive impact of sustainability on consumers’ attitudes, satisfaction, and behavioral intentions has been established, how companies improve consumers’ perceived sustainability of sharing economy services remains unclear. In addition, prior studies have focused on the environmental aspect and neglected the social and economy aspects.
2.2. Sustainability
Sustainability fulfills the demands of the present generation without harming the ability of future generations to fulfill their own demands, and has become essential for companies [15]. The triple bottom line of sustainability consists of economic performance, society, and the natural environment [16]. To achieve sustainability, the strategic integration of the three pillars (i.e., economy, society, and environment) determines the financial, social and environmental performance measures of business sustainability [3,15].
Sustainability key performance indicators (KPIs) are quantifiable measurements that companies use to gauge their progress toward specific sustainability goals. These KPIs provide a tangible way to assess and track the effectiveness of sustainability strategies across various sectors, including both service and manufacturing industries. Sustainability KPIs must be aligned with a firm’s sustainability goals and strategic objectives, and must be regularly monitored and reviewed to ensure ongoing relevance and performance improvement. Neri et al. [17] outlined six perspectives (financial, internal process, learning and growth, consumer, environment, and social) along with 33 KPIs to assess sustainability in industrial supply chains. Hristov and Chirico [2] identified appropriate KPIs that affect a company’s performance and proposed a method to integrate sustainability into company strategies. This study indicates that satisfaction is a useful key performance indicator from a social perspective. Employee satisfaction can also be a significant driver of sustainability because a higher level of job satisfaction results in higher service quality, which increases consumer loyalty and provides economic benefits.
Sustainability KPIs are used to evaluate the effectiveness of sustainability within a company. By contrast, perceived sustainability refers to consumers’ subjective perceptions of a company’s sustainability. Sustainability KPIs may have exhibit limitations when attempting to understand the qualitative aspects of sustainability performance [18], which can be captured through perceived sustainability. Perceived sustainability is a concept based on the degree to which consumers feel that a company’s products or services positively impact environmental, social, and economic sustainability [10]. This concept stems from the subjective evaluation of a company’s efforts toward sustainability. Three factors are related to perceived sustainability: strength, magnitude, and mobilizability [19]. Strength refers to the extent to which consumers believe in a company’s proficiency and expertise in sustainability. Proficiency includes specialized skills, social relationships, and knowledge in the field of sustainability [20]. Magnitude represents the degree to which consumers believe in a company’s commitment to sustainability. Companies should extend their focus beyond profits by considering social responsibility and environmental protection. Mobilizability is the capacity of a company to inspire consumers to engage in actions that promote sustainable development [21]. Sharing economy companies should recognize the importance of sustainability in ensuring that consumers prefer their brands and integrate the elements of perceived sustainability into their green strategies [22,23].
2.3. Green Transparency
Many companies claim that they commit to being environmentally friendly through advertising and corporate social responsibility (CSR) reports, letting consumers believe that the company is eco-friendly and socially responsible, which leads to better continuance intention and brand value [24]. However, some companies act as sustainability decoys, enabling greenwashing with a lack of green transparency but without penalty. According to the Eco-Age [25], famous fashion brands are exacerbating plastic pollution and climate crises by persistently relying on synthetic fibers derived from fossil fuels. These brands make sustainability claims, with their products featuring some form of green labeling. However, the worst offenders were found to make false claims in 96% of cases. TerraChoice [26] has reported that in Canada and the United States, over 95% of products claiming to be “greener” commit one or more of the seven “Sins of Greenwashing.” The greenwashing of brands includes the use of ambiguous keywords, such as eco-friendly, organic, no chemicals and sustainability, and false messages to mislead consumers.
Perceived green transparency refers to the degree to which consumers believe that a company is honest and shares genuine information on environmental improvements and sustainability. This can reduce greenwashing [24] and consumers’ doubtful attitudes toward a company’s green initiatives [27]. Transparent information on sustainability assists consumers in understanding the motives behind a company’s green initiatives [28]. Companies can increase transparency by sharing sustainability information [29]. Therefore, a transparent and authentic green policy is crucial for consumers to believe that a company truly engages in sustainability.
3. Research Model and Hypothesis Development
The research model is illustrated in Figure 1. Perceived sustainability is conceptualized as a second-order reflective construct with the aspects of economic, social, and environmental performance [30]. The antecedents of perceived sustainability are expertise in sustainability (i.e., strength), extent of sustainable development (i.e., magnitude), and ability to mobilize consumers (i.e., mobilizability). Consumers’ perceived sustainability of a sharing economy service affects their intention to continue using it. This impact is moderated by perceived green transparency. In this context, we formulate the hypotheses in subsequent subsections.
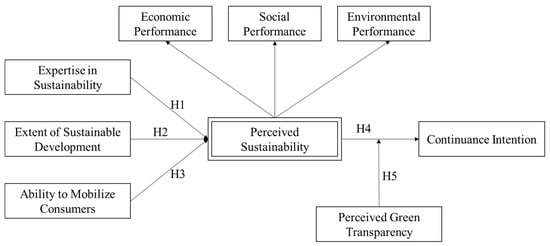
Figure 1.
Research model of perceived sustainability.
3.1. Antecedents of Perceived Sustainability
Expertise in sustainability refers to the degree to which a consumer believes that a company has the relevant competencies, social relations, and knowledge of sustainability. It determines a company’s success in sustainable development [19]. Prior studies have shown that a company’s green and technical expertise plays an important role in green innovation [31,32]. Therefore, we posit that consumers’ perceived sustainability of a sharing economy service increases when they believe that the company possesses expertise in sustainability.
H1.
Expertise in sustainability is positively associated with perceived sustainability.
The extent of sustainable development refers to companies’ scope of sustainability goals and their activities. According to the triple bottom line model proposed by Elkington [16], companies should not only focus on their own business profits but also try to enhance social wealth and environmental protection, which emphasizes the importance of considering all three aspects when formulating their sustainability strategies. Expansion of scope is necessary to strengthen perceived sustainability [19]. The larger the extent of sustainable development, the more extensive and far-reaching the action a company takes toward sustainable development, thereby enhancing consumers’ perception of sustainability. Hence, we propose the following hypothesis.
H2.
The extent of sustainable development is positively associated with perceived sustainability.
The ability to mobilize consumers refers to the ability to drive consumers to take action to make changes for sustainability. Engaging the public in sustainability initiatives enables the community to contribute to solutions and participate in shaping policies and actions that promote a sustainable future [33]. Mobilizability can fortify consumers’ beliefs about a company’s sustainable development [19]. If a company can promote public engagement in sustainability, such as by reducing resource waste, minimizing pollution, and choosing sustainable products, consumers will become aware of the importance of sustainability and believe that the company’s products or services are favorable for sustainability. Hence, we propose the following hypothesis.
H3.
The ability to mobilize consumers is positively associated with perceived sustainability.
In summary, we consider that a company’s expertise in sustainability, extent of sustainable development, and ability to mobilize consumers are antecedents of the consumer-perceived sustainability of the service provided by that company. A company’s sustainability strategies influence consumer beliefs and perceptions regarding its performance, products, or services in terms of sustainability. Companies must focus on these key antecedents to enhance consumers’ perceived sustainability.
3.2. Perceived Sustainability and Continuance Use Intention
The Theory of Planned Behavior [34] indicates that an individual’s intention to perform a behavior is shaped by their attitudes toward the behavior, subjective norms, and perceived behavioral control. Therefore, if consumers perceive a service as sustainable and aligned with their personal values and societal norms, this could positively influence their attitude toward the behavior, thereby increasing their behavioral intention. Similarly, the Value-Belief-Norm theory [35] also indicates that individuals’ behaviors are driven by their personal norms, which are influenced by their social values. If consumers believe in the sustainability of a sharing economy service, this could shape their personal norms in favor of continuing to use the service. Previous studies have shown that when consumers believe that the sharing economy is favorable for sustainable development, they are willing to participate in the sharing economy [13,14]. Consumers are more likely to continue using a sharing economy service if they perceive it as sustainable. Thus, we propose the following hypothesis.
H4.
Perceived Sustainability is positively associated with continuance intention.
3.3. Perceived Green Transparency as a Moderator
High levels of green transparency can enhance consumers’ comprehension of a company’s commitment to sustainability and socially responsible activities [27]. Green transparency in the business context refers to the extent to which a company discloses pertinent and significant information about its green operations and management [36]. Nonetheless, not all companies are forthright about their green policies, with some making deceptive assertions about the environmental merits of their products [37,38]. An increase in transparency regarding a company’s environmental performance reduces the company’s incentive to greenwash [39]. Companies can offer consumers information about their sustainability performance to improve their perceived green transparency. When consumers perceive a high level of green transparency in a company, they feel more confident that the company is genuinely sustainable and less likely to greenwash. This could reinforce the credibility of perceived sustainability and thus strengthen the positive influence of perceived sustainability on consumers’ intention to continue using a product. Thus, the following hypothesis is developed.
H5.
Perceived green transparency positively moderates the relationship between perceived sustainability and continuance intention.
4. Research Methodology
All the measurement items used in this study were adapted from previous studies. The items measuring expertise in sustainability, the extent of sustainable development, and the ability to mobilize consumers were adapted from Lee [19]. The aspects of perceived sustainability, economic performance, social performance, and environmental performance were adapted from Jelinkova et al. [40]. The items measuring perceived green transparency were adapted from Lin et al. [41]. The items measuring continuance intention were adapted from Bhattacherjee [42]. Each item was assessed on a 7-point Likert scale (1 = strongly disagree, 4 = neutral, and 7 = strongly agree). The questionnaire was designed for two types of sharing economy services, Uber and Uber Eats, to understand whether different types of sharing economy services result in different consumer perceptions. The measurement items are listed in Appendix A.
We conducted an Internet survey to collect the data. The invitation was posted on PTT (https://www.ptt.cc) and Dcard (https://www.dcard.tw/). These are the two most popular online forums in Taiwan. The participants must have had experience using Uber or Uber Eats services in the last six months. To ensure the respondents’ eligibility, the questionnaire asked them to indicate the number of times they had used the service in the past month and half a year. Additionally, we included a trap item in the questionnaire to check whether the participants had read and answered the questionnaire carefully. To incentivize participation in the survey, we provided gift cards from a convenience store as tokens of appreciation for completing the questionnaire.
5. Data Analysis and Results
A total of 220 valid responses were collected from Uber users and 209 valid responses were collected from Uber Eats users. Table 1 presents demographic data. Most respondents were women and aged 20–39 years.

Table 1.
Demographic data.
5.1. Measurement Model
In the responses for both Uber and Uber Eats, one item on the extent of sustainable development, one item on economic performance, and two items on social performance were deleted because the factor loading values of these items were lower than 0.7.
Table 2 presents the measurement model of Uber. The Cronbach’s alpha (CA) and composite reliability (CR) values are greater than 0.7, the average variance extracted (AVE) is greater than 0.5, and the factor loadings are greater than 0.7, indicating that the scales have good reliability and convergent validity. The diagonal line of the correlation matrix (see Table 3) represents the square roots of the AVE, which surpasses the inter-construct correlations. These results indicate good discriminant validity. As shown in Table 4, all variance inflation factors (VIFs) are below 10, indicating that multicollinearity is not a significant concern in this study [43]. Table 5 shows that all the condition index values are smaller than 30 and that no two or more than two variance proportions are greater than 0.9 in one row, indicating that the multicollinearity is not serious [44,45].
Table 2.
Measurement model of Uber.
Table 3.
Correlation matrix of Uber.
Table 4.
Variance inflation factors of Uber.
Table 5.
Collinearity diagnostics of Uber.
Table 6 provides the measurement model of Uber Eats. The values of CA and CR are greater than 0.7, the AVE values are greater than 0.5, and the factor loadings are greater than 0.7, indicating that the scales have good reliability and convergent validity. Table 7 demonstrates that the square root of the AVE for each construct is greater than its correlations with other constructs, indicating good discriminant validity. Table 8 indicates that all VIF values are lower than 10, suggesting that multicollinearity is not an issue in the present study. Table 9 shows that all the condition index values are smaller than 30 and that no two or more than two variance proportions are greater than 0.9 in one row, indicating that the multicollinearity is not severe [44,45].
Table 6.
Measurement model of Uber Eats.
Table 7.
Correlation matrix of Uber Eats.
Table 8.
Variance inflation factors of Uber Eats.
Table 9.
Collinearity diagnostics of Uber Eats.
5.2. Structural Model
We used partial least squares structural equation modeling (PLS-SEM) to analyze the data. PLS-SEM maximizes the explained variance of the endogenous latent variables by estimating partial model relationships in an iterative sequence of ordinary least square (OLS) regressions [46]. Bootstrapping is used to obtain the inference statistics for all model parameters, in which a large number of resamples with replacement are drawn from the original sample and then the model parameters are estimated for each bootstrap resample [47]. The advantages of PLS-SEM are that it relaxes the assumption of multivariate normality and has minimum demands regarding the sample size.
We employed SmartPLS 4.0, with a bootstrapping algorithm (5000 resamples), to examine the proposed hypotheses. The significance level is set at 0.05. The structural model of Uber is illustrated in Figure 2. Expertise in sustainability has a marginally significant impact on perceived sustainability (β = 0.223, p < 0.1, SE = 0.133), and the ability to mobilize consumers has a significant impact on perceived sustainability (β = 0.413, p < 0.001, SE = 0.098). Conversely, the impact of the extent of sustainable development is not significant (β = 0.15, p = 0.215, SE = 0.121). Furthermore, perceived sustainability has a significant impact on continuance intention (β = 0.687, p < 0.001, SE = 0.166). This impact is significantly moderated by perceived green transparency (β = 0.223, p < 0.05, SE = 0.111).
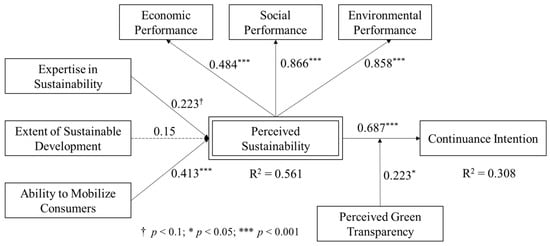
Figure 2.
PLS analysis for Uber.
In summary, the results show that consumers’ perceived sustainability of Uber is mainly determined by its ability to mobilize consumers, followed by its expertise in sustainability. The antecedents explain 56 percent of the variance in perceived sustainability. The perceived sustainability has a positive impact on continuance intention and explains 31 percent of its variance. This positive impact can be enhanced when the perceived green transparency increases.
As depicted in Figure 3, the structural model of Uber Eats illustrates that the impact of expertise in sustainability is not significant (β = 0.043, p = 0.726, SE = 0.133), while the extent of sustainable development (β = 0.438, p < 0.001, SE = 0.114) and ability to mobilize consumers (β = 0.288, p < 0.01, SE = 0.110) have a significant impact on perceived sustainability. Additionally, the impact of perceived sustainability on continuance intention is significant (β = 0.603, p < 0.001, SE = 0.131). This impact is significantly moderated by perceived green transparency (β = 0.259, p < 0.05, SE = 0.132).
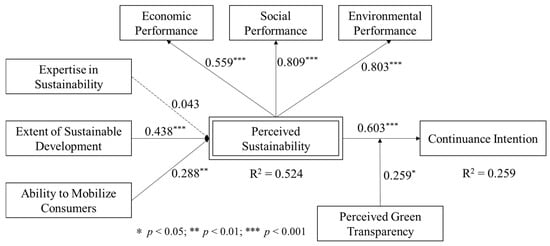
Figure 3.
PLS analysis for Uber Eats.
In summary, the results show that the perceived sustainability of Uber Eats is determined by the extent of sustainable development and the ability to mobilize consumers. The antecedents explain 52 percent of the variance in perceived sustainability. The perceived sustainability has a positive impact on continuance intention and explains 26 percent of its variance. This positive impact can be enhanced when the perceived green transparency increases.
A PLS marker variable approach has been used to diagnose the common method variance (CMV) [48]. Fashion consciousness and fantasizing items were used as indicators to create a marker variable [49]. This marker variable was incorporated into the structural models and linked to all endogenous variables. The PLS results showed that the original significant paths remained significant after incorporating the marker variable, indicating that there is no common method bias.
6. Conclusions
6.1. Major Findings and Discussion
The sustainable value of sharing economy services has received increasing attention in recent years. Corporate strategies are advancing toward environmental and social sustainability. However, limited research has explored the antecedents of perceived sustainability and whether perceived green transparency enhances the impact of perceived sustainability on continuance intention. The results demonstrate that the proposed model is suitable for explaining the antecedents and consequences of perceived sustainability. Consumers’ perceived sustainability of a sharing economy service increases their intention to continue using it. Their perceived green transparency of the company can make them believe that the perceived sustainability is genuine, thus increasing its impact on continuance intention. A company’s expertise in sustainability, extent of sustainable development, and ability to mobilize consumers increase perceived sustainability. However, the impact of antecedents may vary for different types of services.
For Uber users, expertise in sustainability and the ability to mobilize consumers determine their perceived sustainability. However, the extent of sustainable development does not influence perceived sustainability. By contrast, for Uber Eats users, its extent of sustainable development and ability to mobilize consumers have a significant and positive impact on perceived sustainability, but expertise in sustainability does not. One possible reason is that people have both environmental and societal concerns regarding online food delivery services. Food packaging, delivery, and waste generation produce significant CO2 emissions [50]. Moreover, online food delivery services involve labor rights, traffic risks, and public health issues [51,52,53]. As such, the extent of sustainable development is more important than expertise in sustainability, leading to consumers’ perceptions of the sustainability of Uber Eats.
6.2. Theoretical Implications
The main contributions of this study include identifying the antecedents of perceived sustainability and examining the moderating effects of perceived green transparency. Prior studies have shown that if people believe that the sharing economy is environmentally friendly, they are willing to participate in the sharing economy [10,12,13]. These studies focused on sustainability in terms of environmental performance and did not consider how a sharing economy company increases consumers’ perceived sustainability of its services. Lee [19] proposed that strength, magnitude, and mobilizability are related to perceived sustainability, but she did not examine how strength, magnitude, and mobilizability determine perceived sustainability. Our study focused on sustainability from an economic, environmental, and social performance perspective according to the triple bottom line [13] and showed that a company can enhance its expertise in sustainability, its extent of sustainable development, and its ability to mobilize consumers to increase consumers’ perception of sustainability.
Prior studies on green transparency have shown that it can reduce a company’s intention to greenwash and reduce consumers’ doubtful attitudes toward a company’s green initiatives [24,27,39]. This study advances our understanding of green transparency by examining its moderating effect on the relationship between perceived sustainability and continuance intentions. Consumers’ perceived green transparency of a company makes them believe that the company truly engages with sustainability and enhances the positive impact of perceived sustainability on their intention to continue using the service.
6.3. Practical Implications
A sharing economy company should devise sustainability strategies to communicate its strength, magnitude, and mobilizability for sustainable development to consumers. To increase its expertise in sustainability, a company should improve its competence through education, training, and learning, and utilize social media, websites, or advertisements to show its sustainability-related significance and expertise in a particular sustainability issue. To increase the extent of sustainable development, a company should show its concerns about environmental protection and societal issues via advertisements, CSR reports, and sustainability-related activities. To increase their ability to mobilize consumers, companies should inspire and encourage them to act in the interests of sustainability.
It is also suggested that sharing economy companies make their green policies and operations transparent by disclosing how their services affect sustainability and what policies and practices are adopted for sustainable development. Consumers with high environmental awareness may perceive a company as less transparent because they expect to find complete and detailed information about the company’s sustainable development [27]. A company should understand the detailed information that consumers expect and design communication strategies that deliver sufficient information on sustainability.
6.4. Limitations and Future Research
Our study collected data from the users of Uber and Uber Eats. Therefore, the results may not be generalizable to other types of services. In addition, the research results show that expertise in sustainability is more important for ride-hailing services such as Uber, while the extent of sustainable development is more important for online food delivery services such as Uber Eats. The antecedents of the perceived sustainability of different types of services warrant future research. Furthermore, most respondents in the surveys were females and young people. Companies’ expertise in sustainability and ability to mobilize consumers could be more influential to men than to women because men sometimes focus more on utility (expertise and action) than women [19]. Young consumers are more aware and more educated about environmental issues than older consumers [54]. How consumer characteristics such as age and gender moderate the influences of sustainability strategies, perceived sustainability and green transparency needs further investigation.
Author Contributions
Conceptualization, S.-L.H. and Y.-R.L.; methodology, S.-L.H. and Y.-R.L.; formal analysis, S.-L.H. and Y.-R.L.; writing—original draft preparation, Y.-R.L.; writing—review and editing, S.-L.H.; supervision, S.-L.H. All authors have read and agreed to the published version of the manuscript.
Funding
This research received no external funding.
Institutional Review Board Statement
Not applicable.
Informed Consent Statement
Informed consent was obtained from all subjects involved in the study.
Data Availability Statement
The data presented in this study are available on request from the corresponding author.
Conflicts of Interest
The authors declare no conflicts of interest.
Appendix A
Measurement items (note: [the company] is either Uber or Uber Eats in the questionnaire):
- Expertise in sustainability (EIS)
- EIS1: [The company] uses media exposure and activity hosting to show its sustainability-related significance.
- EIS2: [The company] improves its competence in particular sustainability issues through education, training, and learning.
- EIS3: [The company] refers to a particular sustainability issue with a higher frequency and gives it more coverage, which guides me on how to think and act on sustainability issues.
- EIS4: [The company] devotes itself to improve and show its expertise in dealing with particular sustainability issues.
- Extent of sustainable development (ESD)
- ESD2: [The company] employs communications such as ads, CSR reports, and activities to show its concern for society’s interests.
- ESD3: [The company] employs communications such as ads, CSR reports, and activities to show its concern for nature protection.
- Ability to mobilize consumers (AMC)
- AMC1: [The company] encourages me to take action to protect our living environment.
- AMC2: [The company] encourages me to reduce pollution.
- AMC3: [The company] mobilizes consumers to take action for sustainability.
- Perceived sustainability—Economic performance (PSE)
- PSE1: [The company]’s service is beneficial to the economy of the country.
- PSE2: [The company]’s service is a way to ensure more efficient utilization of resources.
- PSE4: [The company]’s service may be an interesting source of income for providers of assets.
- Perceived sustainability—Social performance (PSS)
- PSS1: [The company]’s service contributes toward a greater level of employment and creates new jobs.
- PSS2: Participation in [the company]’s service simplifies the work–life balance.
- Perceived sustainability—Environmental performance (PSN)
- PSN1: Sharing via [the company]’s platform is environmentally friendly because it saves resources.
- PSN2: Sharing via [the company]’s platforms limits waste production.
- Perceived green transparency (PGT)
- PGT1: [The company] clearly explains how it controls the emissions caused by its service processes that could harm the environment.
- PGT2: Overall, [the company] provides the information needed to understand the environmental impact of its service processes.
- PGT3: [The company] provides relevant information regarding sustainability issues associated with its service processes.
- PGT4: [The company]’s policies and practices of sustainable development are provided to consumers in a clear and complete manner.
- Continuance intention (COI)
- COI1: I want to continue using [the company]’s services rather than discontinue them.
- COI2: My intentions are to continue using [the company]’s services, rather than any alternative means.
- COI3: If I could, I would like to continue using [the company]’s services.
References
- Chuah, S.H.-W.; Tseng, M.-L.; Wu, K.-J.; Cheng, C.-F. Factors influencing the adoption of sharing economy in B2B context in China: Findings from PLS-SEM and fsqca. Resour. Conserv. Recycl. 2021, 175, 105892. [Google Scholar] [CrossRef]
- Hristov, I.; Chirico, A. The role of sustainability key performance indicators (kpis) in implementing sustainable strategies. Sustainability 2019, 11, 5742. [Google Scholar] [CrossRef]
- Hu, J.; Liu, Y.-L.; Yuen, T.W.W.; Lim, M.K.; Hu, J. Do green practices really attract customers? The sharing economy from the sustainable supply chain management perspective. Resour. Conserv. Recycl. 2019, 149, 177–187. [Google Scholar] [CrossRef]
- Sundararajan, A. The Sharing Economy: The End of Employment and the Rise of Crowd-Based Capitalism; MIT Press: Cambridge, MA, USA, 2017. [Google Scholar]
- Mattia, G.; Mugion, R.G.; Principato, L. Shared mobility as a driver for sustainable consumptions: The intention to re-use free-floating car sharing. J. Clean. Prod. 2019, 237, 117404. [Google Scholar] [CrossRef]
- Llanos, G.; Guiñez-Cabrera, N.; Mansilla-Obando, K.; Gómez-Sotta, E.; Buchuk, P.; Altamirano, M.; Alviz, M. Collaborative consumption in an emerging market: What motivates consumers to adopt it under economic and political uncertainty? Sustainability 2023, 15, 15482. [Google Scholar] [CrossRef]
- GlobalNewsWire. Sharing Economy Market Size in 2022–2027. Available online: https://www.globenewswire.com/en/news-release/2022/10/14/2534618/0/en/Sharing-Economy-Market-Size-in-2022-2027-New-Report-reaching-USD-600000-0-million-by-2027-data-is-Newest-for-global-separately-with-Impact-of-domestic-and-global-market-Top-players.html (accessed on 25 March 2023).
- Frenken, K.; Schor, J. Putting the sharing economy into perspective. Environ. Innov. Soc. Transit. 2017, 23, 3–10. [Google Scholar] [CrossRef]
- Wang, Y.; Xiang, D.; Yang, Z.; Ma, S.S. Unraveling customer sustainable consumption behaviors in sharing economy: A socio-economic approach based on social exchange theory. J. Clean. Prod. 2019, 208, 869–879. [Google Scholar] [CrossRef]
- Hamari, J.; Sjöklint, M.; Ukkonen, A. The sharing economy: Why people participate in collaborative consumption. J. Assoc. Inf. Sci. Technol. 2016, 67, 2047–2059. [Google Scholar] [CrossRef]
- Martin, C.J. The sharing economy: A pathway to sustainability or a nightmarish form of neoliberal capitalism? Ecol. Econ. 2016, 121, 149–159. [Google Scholar] [CrossRef]
- Huang, S.-L.; Kuo, S.-Y. Understanding why people share in the sharing economy. Online Inf. Rev. 2020, 44, 805–825. [Google Scholar] [CrossRef]
- Arteaga-Sánchez, R.; Belda-Ruiz, M.; Ros-Galvez, A.; Rosa-Garcia, A. Why continue sharing: Determinants of behavior in ridesharing services. Int. J. Mark. Res. 2000, 62, 725–742. [Google Scholar] [CrossRef]
- Gazzola, P.; Vătămănescu, E.M.; Andrei, A.G.; Marrapodi, C. Users’ motivations to participate in the sharing economy: Moving from profits toward sustainable development. Corp. Soc. Responsib. Environ. Manag. 2019, 26, 741–751. [Google Scholar] [CrossRef]
- Carter, C.R.; Rogers, D.S. A framework of sustainable supply chain management: Moving toward new theory. Int. J. Phys. Distrib. Logist. Manag. 2008, 38, 360–387. [Google Scholar] [CrossRef]
- Elkington, J. Cannibals with Forks: The Triple Bottom Line of 21st Century Business; Capstone: Oxford, UK, 1999. [Google Scholar]
- Neri, A.; Cagno, E.; Lepri, M.; Trianni, A. A triple bottom line balanced set of key performance indicators to measure the sustainability performance of industrial supply chains. Sustain. Prod. Consum. 2021, 26, 648–691. [Google Scholar] [CrossRef]
- Herzig, C.; Schaltegger, S. Corporate sustainability reporting. In Sustainability Communication: Interdisciplinary Perspectives and Theoretical Foundation; Springer: Dordrecht, The Netherlands, 2011; pp. 151–169. [Google Scholar]
- Lee, Y.C. Communicating sustainable development: Effects of stakeholder-centric perceived sustainability. Corp. Soc. Responsib. Environ. Manag. 2020, 27, 1540–1551. [Google Scholar] [CrossRef]
- Moran, L.; Rau, H. Mapping divergent concepts of sustainability: Lay knowledge, local practices and environmental governance. Local Environ. 2016, 21, 344–360. [Google Scholar] [CrossRef]
- Ghoshal, M. Green marketing—A changing concept in changing time. BVIMR Manag. Edge 2011, 4, 82–92. [Google Scholar]
- Matharu, M.; Jain, R.; Kamboj, S. Understanding the impact of lifestyle on sustainable consumption behavior: A sharing economy perspective. Manag. Environ. Qual. 2021, 32, 20–40. [Google Scholar] [CrossRef]
- Ek Styvén, M.; Mariani, M.M. Understanding the intention to buy secondhand clothing on sharing economy platforms: The influence of sustainability, distance from the consumption system, and economic motivations. Psychol. Mark. 2020, 37, 724–739. [Google Scholar] [CrossRef]
- Nyilasy, G.; Gangadharbatla, H.; Paladino, A. Perceived greenwashing: The interactive effects of green advertising and corporate environmental performance on consumer reactions. J. Bus. Ethics 2014, 125, 693–707. [Google Scholar] [CrossRef]
- Eco-Age Fashion Industry Addicted to Greenwashing and Fossil-Fuel Based Synthetics: New Report from Changing Markets. Available online: https://eco-age.com/resources/synthetics-anonymous-changing-markets-report/ (accessed on 19 February 2023).
- TerraChoice. The Sins of Greenwashing: Home and Family Edition. Available online: https://www.twosides.info/wp-content/uploads/2018/05/Terrachoice_The_Sins_of_Greenwashing_-_Home_and_Family_Edition_2010.pdf (accessed on 6 August 2024).
- Vaccaro, A.; Patiño Echeverri, D. Corporate transparency and green management. J. Bus. Ethics 2010, 95, 487–506. [Google Scholar] [CrossRef]
- Reynolds, M.; Yuthas, K. Moral discourse and corporate social responsibility reporting. J. Bus. Ethics 2008, 78, 47–64. [Google Scholar] [CrossRef]
- Meise, J.N.; Rudolph, T.; Kenning, P.; Phillips, D.M. Feed them facts: Value perceptions and consumer use of sustainability-related product information. J. Retail. Consum. Serv. 2014, 21, 510–519. [Google Scholar] [CrossRef]
- Iniesta-Bonillo, M.A.; Sánchez-Fernández, R.; Jiménez-Castillo, D. Sustainability, value, and satisfaction: Model testing and cross-validation in tourist destinations. J. Bus. Res. 2016, 69, 5002–5007. [Google Scholar] [CrossRef]
- de Medeiros, J.F.; Vidor, G.; Ribeiro, J.L.s.D. Driving factors for the success of the green innovation market: A relationship system proposal. J. Bus. Ethics 2018, 147, 327–341. [Google Scholar] [CrossRef]
- Su, R.; Shui, X.; Zhang, M.; Li, S. Too hot to be innovative: Examining the relationship between high temperatures and corporate green innovation. Int. J. Prod. Econ. 2024, 274, 109316. [Google Scholar] [CrossRef]
- Segura-Salazar, J.; Tavares, L.M. Sustainability in the minerals industry: Seeking a consensus on its meaning. Sustainability 2018, 10, 1429. [Google Scholar] [CrossRef]
- Ajzen, I. The theory of planned behavior. Organ. Behav. Hum. Decis. Process. 1991, 50, 179–211. [Google Scholar] [CrossRef]
- Stern, P.C.; Dietz, T.; Abel, T.; Guagnano, G.A.; Kalof, L. A value-belief-norm theory of support for social movements: The case of environmentalism. Hum. Ecol. Rev. 1999, 6, 81–97. [Google Scholar]
- Bushman, R.M.; Piotroski, J.D.; Smith, A.J. What determines corporate transparency? J. Account. Res. 2004, 42, 207–252. [Google Scholar] [CrossRef]
- Chen, Y.S.; Chang, C.H. Enhance green purchase intentions: The roles of green perceived value, green perceived risk, and green trust. Manag. Decis. 2012, 50, 502–520. [Google Scholar] [CrossRef]
- Szabo, S.; Webster, J. Perceived greenwashing: The effects of green marketing on environmental and product perceptions. J. Bus. Ethics 2021, 171, 719–739. [Google Scholar] [CrossRef]
- Delmas, M.A.; Burbano, V.C. The drivers of greenwashing. Calif. Manag. Rev. 2011, 54, 64–87. [Google Scholar] [CrossRef]
- Jelinkova, M.; Tetrevova, L.; Vavra, J.; Munzarova, S. The sharing economy in the context of sustainable development and social responsibility: The example of the czech republic. Sustainability 2021, 13, 9886. [Google Scholar] [CrossRef]
- Lin, J.; Lobo, A.; Leckie, C. The role of benefits and transparency in shaping consumers’ green perceived value, self-brand connection and brand loyalty. J. Retail. Consum. Serv. 2017, 35, 133–141. [Google Scholar] [CrossRef]
- Bhattacherjee, A. An empirical analysis of the antecedents of electronic commerce service continuance. Decis. Support Syst. 2001, 32, 201–214. [Google Scholar] [CrossRef]
- Chatterjee, S.; Price, B. Regression Analysis by Example; Wiley-Interscience: New York, NY, USA, 1991. [Google Scholar]
- Hair, J.F.; Black, W.C.; Babin, B.J.; Anderson, R.E. Multivariate Data Analysis: Advanced Diagnostics for Multiple Regression; Pearson Education: London, UK, 2013. [Google Scholar]
- Thompson, C.G.; Kim, R.S.; Aloe, A.M.; Becker, B.J. Extracting the variance inflation factor and other multicollinearity diagnostics from typical regression results. Basic Appl. Soc. Psychol. 2017, 39, 81–90. [Google Scholar] [CrossRef]
- Hair, J.F.; Sarstedt, M.; Ringle, C.M.; Mena, J.A. An assessment of the use of partial least squares structural equation modeling in marketing research. J. Acad. Mark. Sci. 2012, 40, 414–433. [Google Scholar] [CrossRef]
- Henseler, J.; Hubona, G.; Ray, P.A. Using PLS path modeling in new technology research: Updated guidelines. Ind. Manag. Data Syst. 2016, 116, 2–20. [Google Scholar] [CrossRef]
- Rönkkö, M.; Ylitalo, J. PLS marker variable approach to diagnosing and controlling for method variance. In Proceedings of the International Conference on Information Systems, Shanghai, China, 4–7 December 2011. [Google Scholar]
- Malhotra, N.K.; Kim, S.S.; Patil, A. Common method variance in is research: A comparison of alternative approaches and a reanalysis of past research. Manag. Sci. 2006, 52, 1865–1883. [Google Scholar] [CrossRef]
- Hu, X.; Liu, C.; Zhuo, Q.; Moon, D. Assessing CO2 emissions of online food delivery in Japan. Sustainability 2023, 15, 8084. [Google Scholar] [CrossRef]
- Sinha, D.; Pandit, D. Assessing the economic sustainability of gig work: A case of hyper-local food delivery workers in Kolkata, India. Res. Transp. Econ. 2023, 100, 101335. [Google Scholar] [CrossRef]
- Duthie, C.; Pocock, T.; Curl, A.; Clark, E.; Norriss, D.; Bidwell, S.; McKerchar, C.; Crossin, R. Online on-demand delivery services of food and alcohol: A scoping review of public health impacts. SSM-Popul. Health 2023, 21, 101349. [Google Scholar] [CrossRef] [PubMed]
- Fan, B.; Lv, L.; Han, G. Online platform’s corporate social responsibility for mitigating traffic risk: Dynamic games and governmental regulations in O2O food delivery industry. Comput. Ind. Eng. 2022, 169, 108188. [Google Scholar] [CrossRef]
- Lisboa, A.; Vitorino, L.; Antunes, R. Gen zers’ intention to purchase products with sustainable packaging: An alternative perspective to the attitude-behaviour gap. J. Mark. Manag. 2022, 38, 967–992. [Google Scholar] [CrossRef]
Disclaimer/Publisher’s Note: The statements, opinions and data contained in all publications are solely those of the individual author(s) and contributor(s) and not of MDPI and/or the editor(s). MDPI and/or the editor(s) disclaim responsibility for any injury to people or property resulting from any ideas, methods, instructions or products referred to in the content. |
© 2024 by the authors. Licensee MDPI, Basel, Switzerland. This article is an open access article distributed under the terms and conditions of the Creative Commons Attribution (CC BY) license (https://creativecommons.org/licenses/by/4.0/).