
Research on Wind Environment Simulation in Five Types of “Gray Spaces” in Traditional Jiangnan Gardens, China


Abstract
1. Introduction
2. Materials and Methods
2.1. Enclosure Interface Forms Shaping “Gray Spaces”
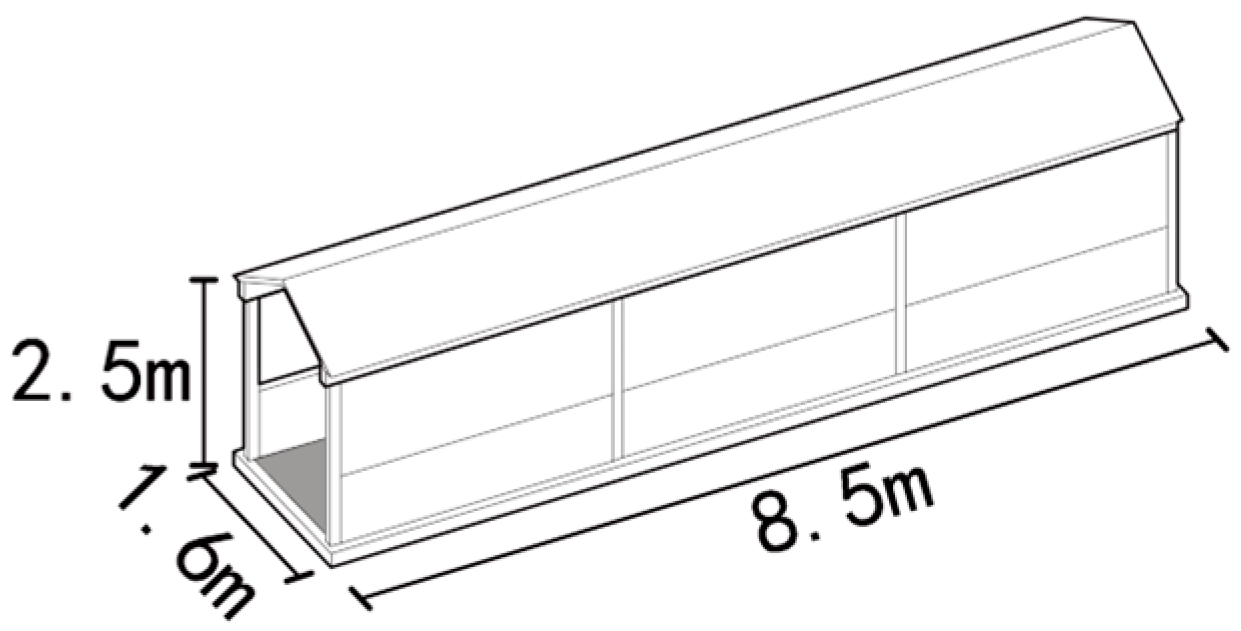
2.1.1. Pavilion Space
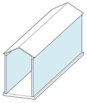
2.1.2. Corridor Space
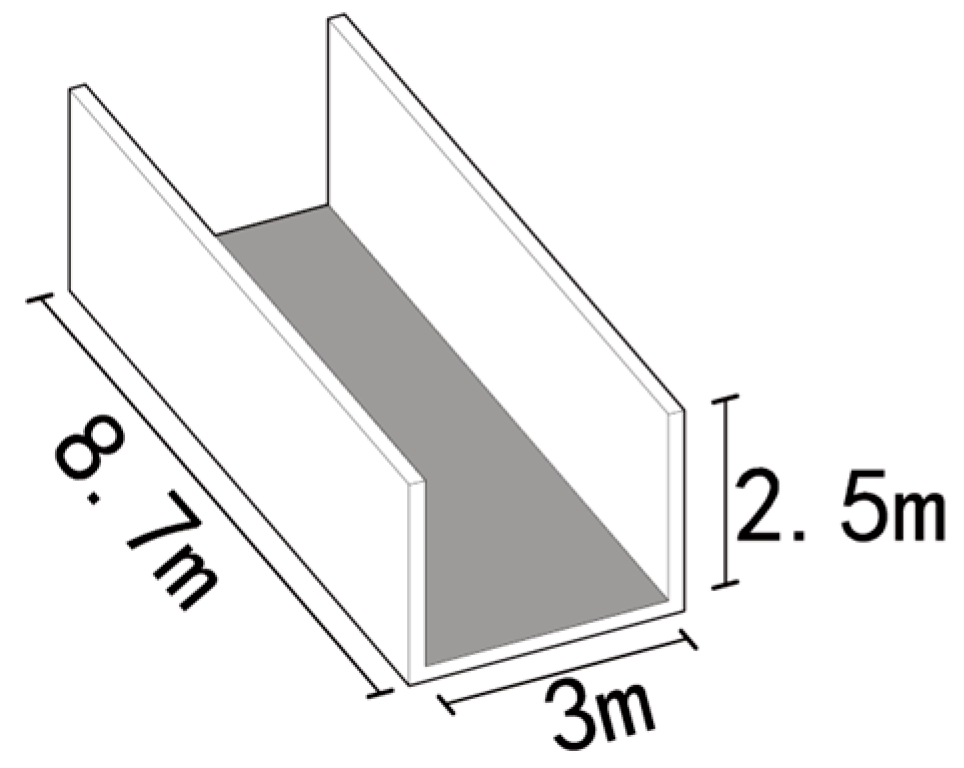
2.1.3. Alley Space
2.1.4. Courtyard Space
2.1.5. Atrium Space
2.2. Simulation of Outdoor Wind Environment in “Gray Space”
2.2.1. Numerical Simulation Technology
2.2.2. Parameter Variables and Simulation Methods
3. Quantitative Simulation Study of Five Types of Gray Spaces
3.1. Pavilion Space
3.1.1. Height-to-Depth Ratio (HDR)
3.1.2. Open Space Ratio (OSR)
3.1.3. Spatial Direction (DIR)
3.2. Corridor Space
3.2.1. Height-to-Depth Ratio (HDR)
3.2.2. Spatial Direction (DIR)
3.3. Alley Space
3.3.1. Height-to-Depth Ratio (HDR)
3.3.2. Spatial Direction (DIR)
3.4. Courtyard Space
3.4.1. Height-to-Depth Ratio (HDR)
3.4.2. Spatial Direction (DIR)
3.5. Atrium Space
3.5.1. Height-to-Depth Ratio (HDR)
3.5.2. Spatial Direction (DIR)
3.6. Validation
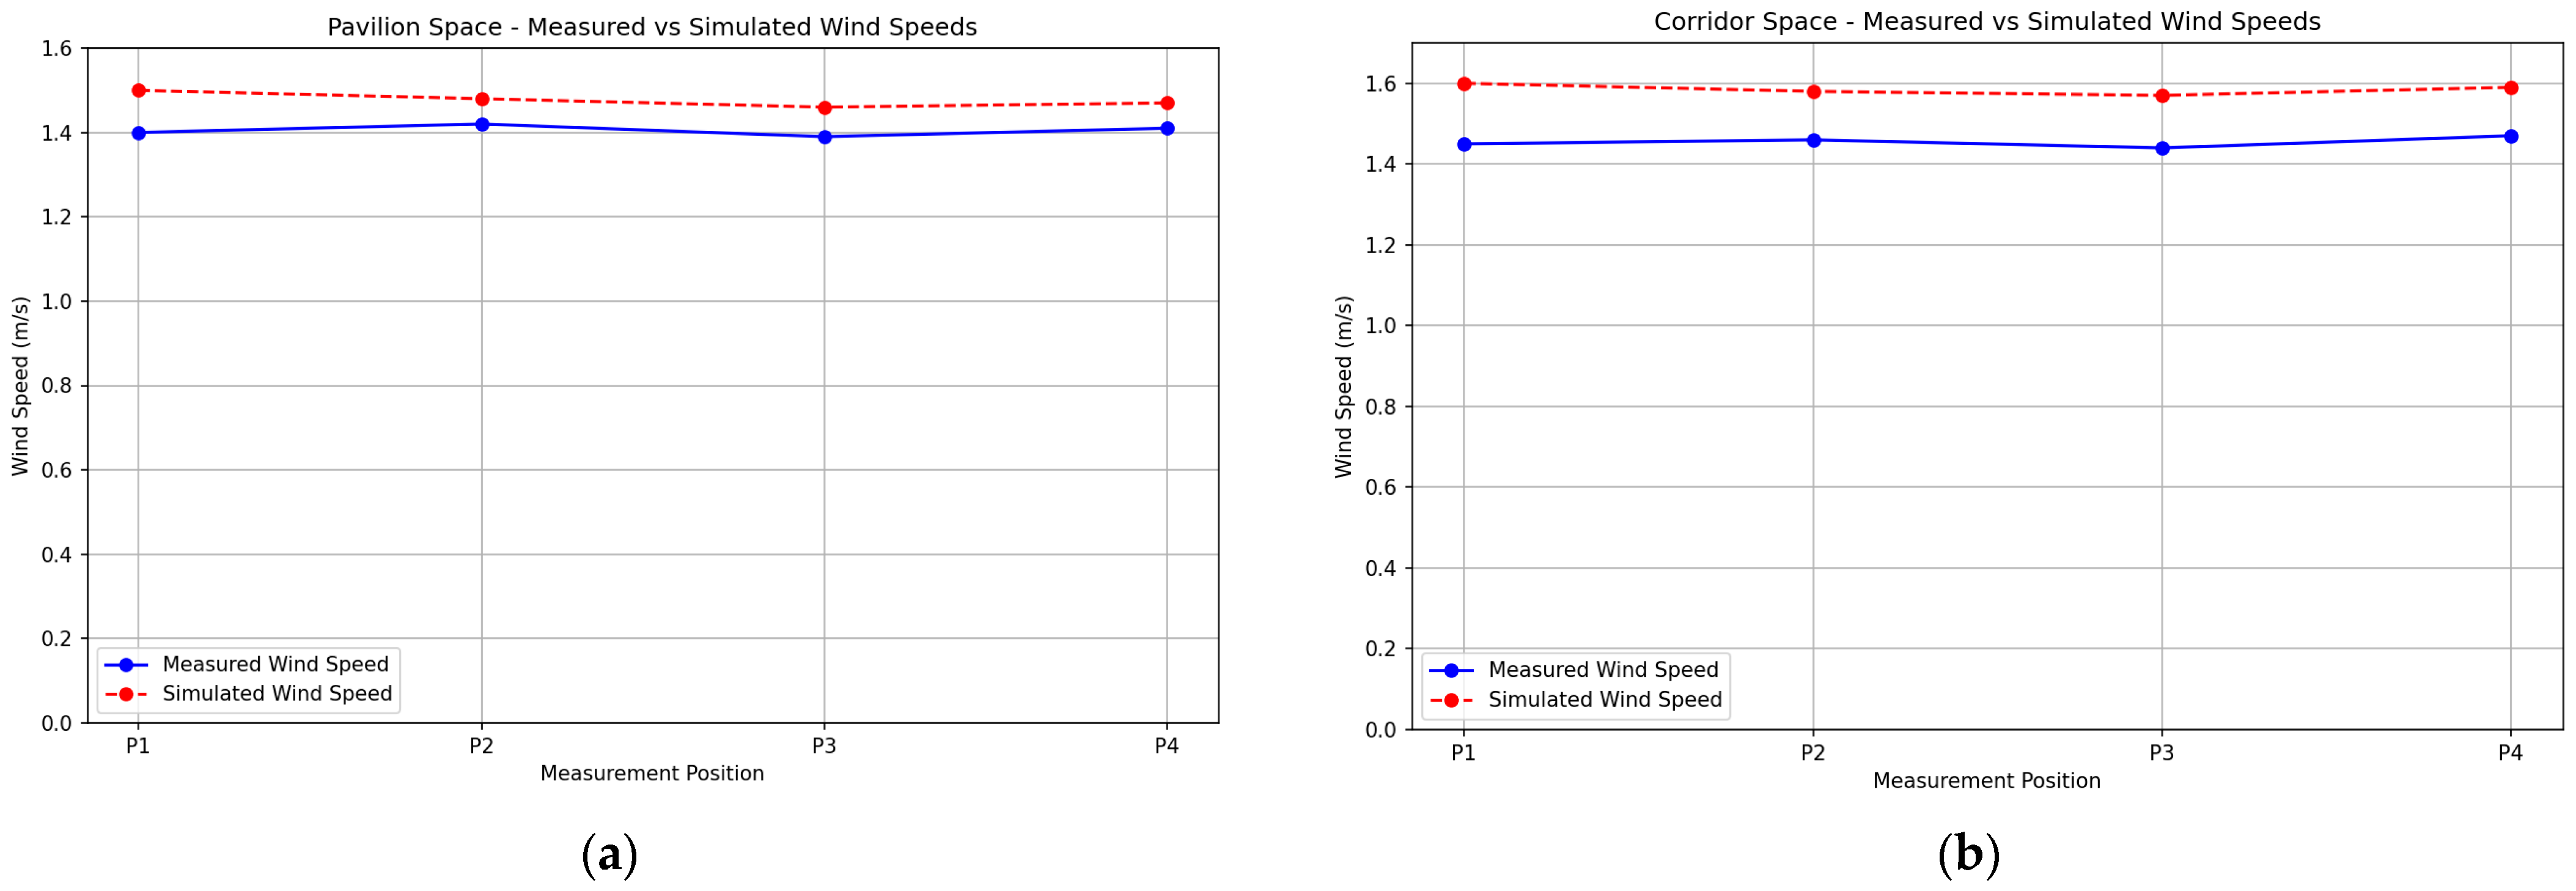
- Pavilion Space (Figure 9a)Point Layout: The measurement points were distributed at the four corners inside the pavilion (P1, P2, P3, P4) to reflect the wind speed variations within the space. The measured data show that the wind speed was uniform across the four points. The simulated data were slightly higher than the measured values, but the overall trend was consistent. This result indicates that the numerical simulation can effectively capture the wind speed distribution within the space.
- Corridor Space (Figure 9b)The measurement points were arranged along the corridor length (P1, P2, P3, P4) to capture the variations in wind speed along the corridor direction. The measured data were slightly lower than the simulated data. The simulation results showed a slight increase in wind speed along the direction of the corridor, which was related to the geometric characteristics of the corridor and the simulation method used.
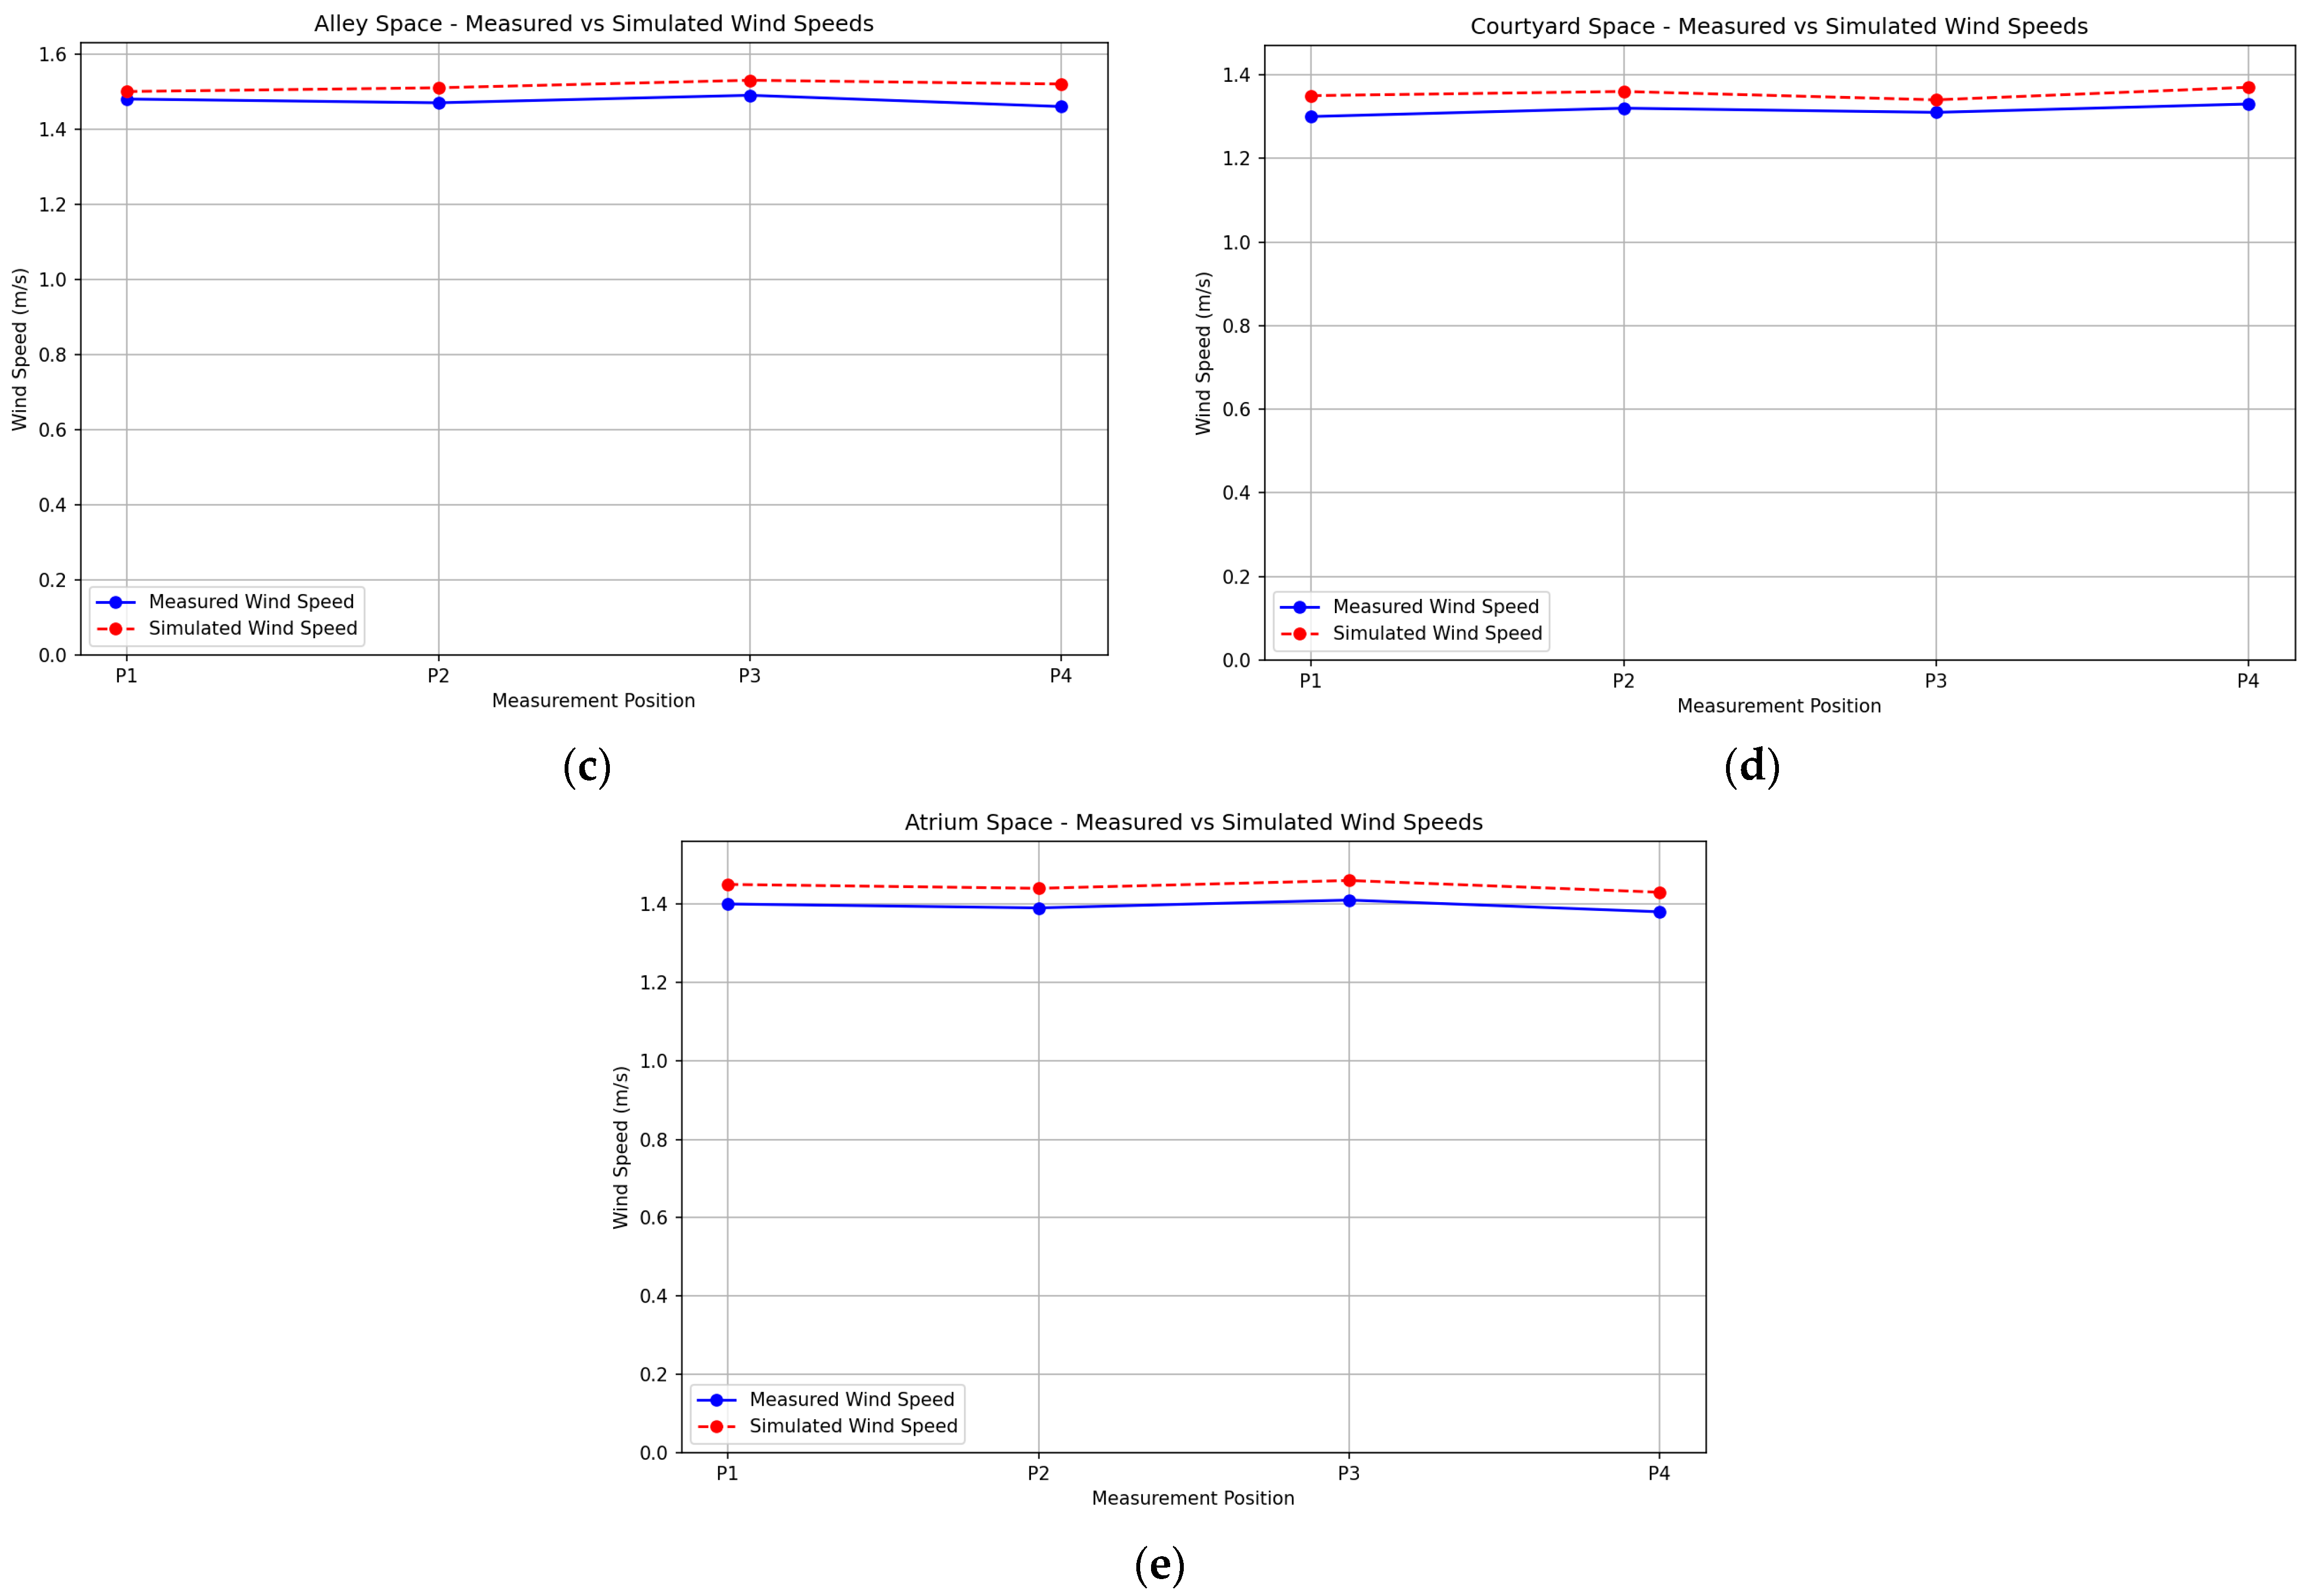
- Alley Space (Figure 9c)The measurement points were arranged along the length of the alleyway (P1, P2, P3, P4) to reflect the wind speed variations within the alleyway. The measured data were very close to the simulated data, and the simulation results accurately captured the wind speed variations within the alleyway, verifying the model’s reliability.
- Courtyard Space (Figure 9d)The measurement points were arranged at the four corners of the courtyard (P1, P2, P3, P4) to reflect the wind speed variations in different corners. The measured data were close to the simulated data, with the simulated values being slightly higher, but the difference was not significant. This result indicates that the simulation method can effectively reflect the wind speed distribution within the courtyard.
- Atrium Space (Figure 9e)The measurement points were set at the four corners of the atrium (P1, P2, P3, P4) to capture the wind speed variations. The simulated data were slightly higher than the measured data, but the trends were consistent, indicating that the simulation results were relatively accurate and suitable for analyzing the wind environment in the atrium.
4. Discussion
5. Conclusions
- The most suitable height-to-depth ratio for pavilion spaces is 1.0, at which wind speed is maximized, helping to create a cooler microclimate in summer. Additionally, appropriate open space ratio and spatial direction settings can significantly improve the wind environment and enhance spatial comfort. In winter, pavilion spaces can reduce heat loss from solar radiation through roof shading. During spring and autumn, pavilion spaces have good ventilation, making them suitable for comfortable outdoor activities.
- For single-sided open corridor spaces, a height-to-depth ratio of 1.6 is ideal for ventilation. Wind speed is highest when the corridor is oriented south, highlighting the importance of proper direction selection for improving corridor ventilation. In winter, the corridor spaces can absorb solar radiation through the walls, creating a warm environment. In spring and autumn, these spaces have moderate ventilation and sunshine, providing a comfortable transition area.
- For alley spaces, with a height-to-depth ratio of 0.8, such spaces are suitable for a cool microclimate in summer. Wind speed is highest when facing south, indicating that wind direction significantly influences the alley’s wind environment. With appropriate sheltering, alley areas can reduce the penetration of cold winds in winter. During spring and autumn, alley spaces offer good ventilation, making them comfortable walking passages.
- The height-to-depth ratio primarily impacts heat transfer in courtyard spaces, with minimal effect on wind speed. Proper orientation can greatly enhance the courtyard’s ventilation and temperature conditions. By improving the thermal radiation of hard surfaces and plants, courtyard spaces can be inviting throughout winter. In spring and fall, these areas provide a pleasant microclimate for various outdoor activities.
- Atrium spaces with a height-to-depth ratio of 1.2 have good ventilation in summer. When facing south and north directions, this provides the best ventilation and promotes a favorable microclimate. During winter, atrium spaces provide warmth through the thermal radiation of high walls. Conversely, in spring and autumn, atrium spaces offer moderate ventilation and temperature, providing a comfortable environment as a resting place.

| “Gray Space” Types | Optimal HDR | Optimal DIR | Optimal OSR | Seasonal Suitability | Optimization Effect |
|---|---|---|---|---|---|
| Pavilion | 1 | Reasonable setting | 1 (totally opened-up) | Cool in summer, comfortable in spring and autumn, and reduces heat loss in winter | Achieving maximum wind speed, creating a cool summer microclimate |
| Corridor | 1.6 | Facing south | N/A | Ventilation in summer, moderate spring and autumn, and absorption of solar radiation in winter | Achieving optimal ventilation effect |
| Alley | 0.8 | Facing south | N/A | Cool in summer, comfortable in spring and autumn, and less cold wind in winter | Achieving maximum wind speed, creating a cool summer microclimate |
| Courtyard | Minimal impact | Reasonable setting | Less affected | Ventilation in summer, moderate spring and autumn, and increased heat radiation in winter | Improving ventilation and thermal environment |
| Atrium | 1.2 | Facing south and north | N/A | Ventilation in summer, moderate in spring and autumn, and warmth in winter | Achieving good ventilation effect, forming a favorable microclimate environment. |
Author Contributions
Funding
Institutional Review Board Statement
Informed Consent Statement
Data Availability Statement
Conflicts of Interest
References
- Kurokawa, K. The Philosophy and Methods of Urban Design by Kisho Kurokawa; Qin, L., Translator; China Architecture & Building Press: Beijing, China, 2004. (In Chinese) [Google Scholar]
- Taleghani, M.; Tenpierik, M.; van den Dobbelsteen, A. Energy performance and thermal comfort of courtyard/atrium dwellings in the Netherlands in the light of climate change. Renew. Energy 2014, 63, 486–497. [Google Scholar] [CrossRef]
- Liu, H.; Liao, J.; Yang, D.; Du, X.; Hu, P.; Yang, Y.; Li, B. The response of human thermal perception and skin temperature to step-change transient thermal environments. Build. Environ. 2014, 73, 232–238. [Google Scholar] [CrossRef]
- Acero, J.A.; Ruefenacht, L.A.; Koh, E.J.Y.; Tan, Y.S.; Norford, L.K. Measuring and comparing thermal comfort in outdoor and semi-outdoor spaces in tropical Singapore. Urban Clim. 2022, 42, 101122. [Google Scholar] [CrossRef]
- Kwong, J.; Adam, N.M. Perception of thermal comfort in the enclosed transitional space of tropical buildings. Indoor Built Environ. 2011, 20, 524–533. [Google Scholar] [CrossRef]
- Pitts, A.; Saleh, J. Potential for energy saving in building transition spaces. Energy Build. 2007, 39, 815–822. [Google Scholar] [CrossRef]
- Tse, J.M.Y.; Jones, P. Evaluation of thermal comfort in building transitional spaces—Field studies in Cardiff, UK. Build. Environ. 2019, 156, 191–202. [Google Scholar] [CrossRef]
- Chun, C.; Kwok, A.; Tamura, A. Thermal comfort in transitional spaces—Basic concepts: Literature review and trial measurement. Build. Environ. 2004, 39, 1187–1192. [Google Scholar] [CrossRef]
- Hou, G.; Zhai, X.; Kuai, Y.; Shu, P.; Zhang, P.; Wei, S. A systematic review on studies of thermal comfort in building transitional space. J. Build. Eng. 2024, 89, 109280. [Google Scholar] [CrossRef]
- Chun, C.; Tamura, A. Thermal comfort in urban transitional spaces. Build. Environ. 2005, 40, 633–639. [Google Scholar] [CrossRef]
- Cao, B.; Luo, M.; Li, M.; Zhu, Y. Thermal comfort in semi-outdoor spaces within an office building in Shenzhen: A case study in a hot climate region of China. Indoor Built Environ. 2018, 27, 1431–1444. [Google Scholar] [CrossRef]
- Hwang, R.L.; Lin, T.P. Thermal comfort requirements for occupants of semi-outdoor and outdoor environments in hot-humid regions. Archit. Sci. Rev. 2007, 50, 357–364. [Google Scholar] [CrossRef]
- Othman, N.E.; Zaki, S.A.; Rijal, H.B.; Ahmad, N.H.; Razak, A.A. Field study of pedestrians’ comfort temperatures under outdoor and semi-outdoor conditions in Malaysian university campuses. Int. J. Biometeorol. 2021, 65, 453–477. [Google Scholar] [CrossRef] [PubMed]
- Spagnolo, J.; de Dear, R. A field study of thermal comfort in outdoor and semi-outdoor environments in subtropical Sydney, Australia. Build. Environ. 2003, 38, 721–738. [Google Scholar] [CrossRef]
- Potvin, A. Assessing the Microclimate of Urban Transitional Spaces. In Proceedings of the PLEA2000 (Passive Low Energy Architecture), Cambridge, UK, 2–5 July 2000. [Google Scholar]
- Kwon, C.; Lee, K.J. Outdoor Thermal Comfort in a Transitional Space of Canopy in Schools in the UK. Sustainability 2017, 9, 1753. [Google Scholar] [CrossRef]
- Huang, X.; Lu, Z.; Zhuang, Z. Analysis of the Wind Environment to Improve the Thermal Comfort in the Colonnade Space of a Qilou Street Based on the Relative Warmth Index. Sustainability 2019, 11, 4402. [Google Scholar] [CrossRef]
- Kotopouleas, A.; Nikolopoulou, M. Thermal comfort conditions in airport terminals: Indoor or transition spaces? Build. Environ. 2016, 99, 184–199. [Google Scholar] [CrossRef]
- Gong, C.; Hu, C. The research of gray space design of architecture based on green stormwater infrastructure application. Energy Procedia 2017, 115, 219–228. [Google Scholar] [CrossRef]
- Abdulkareem, H. Thermal Comfort through the Microclimates of the Courtyard. A Critical Review of the Middle-eastern Courtyard House as a Climatic Response. Procedia-Soc. Behav. Sci. 2016, 216, 667–678. [Google Scholar] [CrossRef]
- Shi, M.; Chen, L.; Luo, J. The Type and Spatial Characteristics of Landscape Prototype in Entrance Space of Traditional Blocks in Jiangnan Area. Adv. Mater. Res. 2013, 671–674, 2806–2812. [Google Scholar] [CrossRef]
- Xue, S.; Xiao, Y. Study on the Outdoor Thermal Comfort Threshold of Lingnan Garden in Summer. Procedia Eng. 2016, 169, 422–430. [Google Scholar] [CrossRef]
- Xu, X.; Liu, S.; Sun, S.; Zhang, W.; Liu, Y.; Lao, Z.; Zhu, J. Evaluation of energy saving potential of an urban green space and its water bodies. Energy Build. 2019, 188, 58–70. [Google Scholar] [CrossRef]
- Xiong, Y.; Zhang, J.; Xu, X.; Yan, Y.; Sun, S.; Liu, S. Strategies for improving the microclimate and thermal comfort of a classical Chinese garden in the hot-summer and cold-winter zone. Energy Build. 2020, 215, 109914. [Google Scholar] [CrossRef]
- Kong, F.; Sun, C.; Liu, F.; Yin, H.; Jiang, F.; Pu, Y.; Cavan, G.; Skelhorn, C.; Middel, A.; Dronova, I. Energy saving potential of fragmented green spaces due to their temperature regulating ecosystem services in the summer. Appl. Energy 2016, 183, 1428–1440. [Google Scholar] [CrossRef]
- Xu, X.; Sun, S.; Liu, W.; García, E.H.; He, L.; Cai, Q.; Xu, S.; Wang, J.; Zhu, J. The cooling and energy saving effect of landscape design parameters of urban park in summer: A case of Beijing, China. Energy Build. 2017, 149, 91–100. [Google Scholar] [CrossRef]
- Li, T.; Zhang, B. The Enlightenment of the Grey Space Elements of Pavilion Gallery in Jiangnan Garden to Modern Public “Gallery Space”. World Sci. Res. J. 2022, 8, 644–647. [Google Scholar]
- Lan, S. Research on the Creation of “corridor” Space in Jiangnan Gardens. Master’s Thesis, Beijing University of Civil Engineering and Architecture, Beijing, China, 2016. (In Chinese). [Google Scholar]
- Wang, J. The Research on the Evolution of Veranda Space in Traditional Chinese Architecture. Archit. Cult. 2023, 6, 228–231. (In Chinese) [Google Scholar]
- Xu, Y.; Yang, Z.; Zheng, X.; Ren, J.; Feng, C.; Tang, M. Thermal environments of vernacular dwellings and the adjacent alley in summer: An experimental study in Southwest China. Build. Environ. 2024, 261, 111634. [Google Scholar] [CrossRef]
- Akbari, H.; Cherati, S.M.; Monazam, N.H.; Noguchi, M. Effect of courtyards’ geometrical parameters on climate adaptability and shading performance in hot-arid climate of Yazd (Iran). Sustain. Energy Technol. Assess. 2021, 48, 101594. [Google Scholar] [CrossRef]
- Shen, C.; Yu, C. The virtual-real measurement of Chinese garden impression: A quantitative analysis of cognitive experience of Jiangnan gardens with virtual reality experiments. Front. Archit. Res. 2024, 13, 895–911. [Google Scholar] [CrossRef]
- Liu, X. Research on Climate Adaptability of Spatial Forms in Traditional Suzhou Gardens. Master’s Thesis, Xi’an University of Architecture and Technology, Xi’an, China, 2021. (In Chinese). [Google Scholar]
- Men, C. Spatial Characteristics and Derivations of Tuku Dwellings in the Poyang Lake Basin. Archit. Herit. 2018, 4, 49–61. (In Chinese) [Google Scholar]
- Ahadi, A.; Saghafi, M.R.; Tahbaz, M. The optimization of light-wells with integrating daylight and stack natural ventilation systems in deep-plan residential buildings: A case study of Tehran. J. Build. Eng. 2018, 18, 220–244. [Google Scholar] [CrossRef]
- Gotoh, T.; Khayyer, A.; Gotoh, H. Enhanced schemes for resolution of the continuity equation in projection-based SPH. Eng. Anal. Bound. Elem. 2024, 166, 105848. [Google Scholar] [CrossRef]
- Uh Zapata, M.; Hernandez-Lopez, F.J.; Itzá Balam, R. A parallel unstructured multi-color SOR solver for 3D Navier–Stokes equations on graphics processing units. Comput. Fluids 2023, 260, 105909. [Google Scholar] [CrossRef]
- Wang, Q.; Li, X.; Zhang, J.; Wang, T.; Ma, S.; Zhang, B.; Ma, T. Analysis methodology during heat transfer in fluid domain: Conduction-advection thermal resistance in parallel. Int. J. Heat Mass Transf. 2024, 226, 125491. [Google Scholar] [CrossRef]
- Cheshmehzangi, A.; Zhu, Y.; Li, B. Application of environmental performance analysis for urban design with Computational Fluid Dynamics (CFD) and EcoTect tools: The case of Cao Fei Dian eco-city, China. Int. J. Sustain. Built Environ. 2017, 6, 102–112. [Google Scholar] [CrossRef]
- EnergyPlus. Weather Data by Location. Available online: https://energyplus.net/weather-location/asia_wmo_region_2/CHN/CHN_Shanghai.Shanghai.583620_CSWD (accessed on 23 August 2024).
- Gamero-Salinas, J.; Kishnani, N.; Monge-Barrio, A.; López-Fidalgo, J.; Sánchez-Ostiz, A. The influence of building form variables on the environmental performance of semi-outdoor spaces. A study in mid-rise and high-rise buildings of Singapore. Energy Build. 2021, 230, 110544. [Google Scholar] [CrossRef]
- Tao, Y.; Lau SS, Y.; Gou, Z.; Zhang, J.; Tablada, A. An investigation of semi-outdoor learning spaces in the tropics: Spatial settings, thermal environments and user perceptions. Indoor Built Environ. 2019, 28, 1368–1382. [Google Scholar] [CrossRef]
- Gamero-Salinas, J.; Kishnani, N.; Monge-Barrio, A.; López-Fidalgo, J.; Sánchez-Ostiz, A. Evaluation of thermal comfort and building form attributes in different semi-outdoor environments in a high-density tropical setting. Build. Environ. 2021, 205, 108255. [Google Scholar] [CrossRef]
- Sun, D.; Xu, J.; Zhao, J.; Zhang, D.; Chen, K. Study on a new model for urban residential quarter of 21st century. J. Univ. Shanghai Sci. Technol. 2000, 22, 347–351. [Google Scholar]
- Yang, A.S.; Juan, Y.H.; Wen, C.Y.; Su, Y.M.; Wu, Y.C. Investigation on wind environments of surrounding open spaces around a public building. J. Mech. 2017, 33, 101–113. [Google Scholar] [CrossRef]
- Li, Y.; Chen, H.; Yu, P.; Yang, L. Analysis and reflection on the green, low-carbon, and energy-saving design of the super high-rise building. Sustainability 2024, 16, 4146. [Google Scholar] [CrossRef]
- Sokar, L.; Brakez, A.; Sobhy, I. A scientific process for a sustainable architectural design: A case study of a rural pavilion in a hot semi-arid climate. J. Build. Eng. 2023, 79, 107816. [Google Scholar] [CrossRef]
- Shaeri, J.; Aflaki, A.; Yaghoubi, M.; Janalizadeh, H. Investigation of passive design strategies in a traditional urban neighborhood: A case study. Urban Clim. 2018, 26, 31–50. [Google Scholar] [CrossRef]
- Li, Y.; Chen, L. Study on the influence of voids on high-rise building on the wind environment. Build. Simul. 2020, 13, 419–438. [Google Scholar] [CrossRef]
- Wen, Y.; Leng, J.; Yu, F.; Yu, C.W. Integrated design for underground space environment control of subway stations with atriums using piston ventilation. Indoor Built Environ. 2020, 29, 1300–1315. [Google Scholar] [CrossRef]


| Without One Side Surface | Without Two Side Surface | Without Three Side Surface | Without Four Side Surface | Without the Top Surface |
|---|---|---|---|---|
 |  |  |  |  |
| Single-Sided Open Corridor | Double-Sided Open Corridor | Warm Corridor |
|---|---|---|
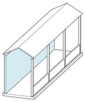 | 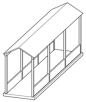 |  |
| Spatial Types | Parameter Variables |
|---|---|
| Pavilion space | HDR, OSR, DIR |
| Corridor space | HDR, DIR |
| Alley space | HDR, DIR |
| Courtyard space | HDR, OSR, DIR |
| Atrium space | HDR, OSR, DIR |
| Schematic Illustration |  | 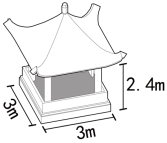 | 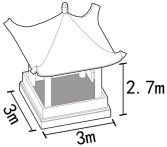 |
| HDR | 0.7 | 0.8 | 0.9 |
| Schematic Illustration | 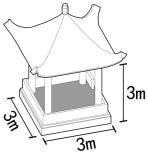 |  | 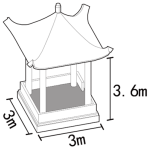 |
| HDR | 1 | 1.1 | 1.2 |
| Analysis Diagram |  |  | 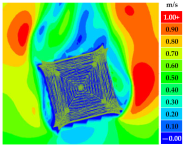 |
| HDR | 0.7 | 0.8 | 0.9 |
| Analysis Diagram | 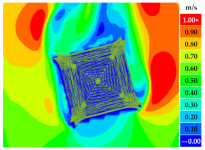 |  | 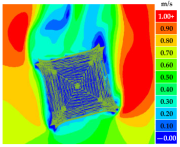 |
| HDR | 1 | 1.1 | 1.2 |
| Schematic Illustration |  |  | 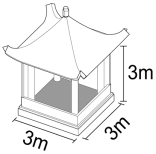 | 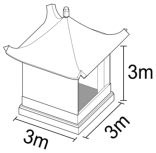 |
| OSR | 1 | 0.75 | 0.5 | 0.25 |
| Analysis Diagram | 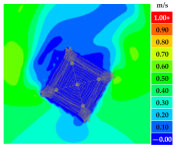 | 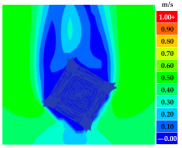 |  | 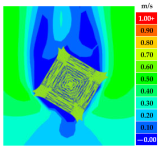 |
| OSR | 1 | 0.75 | 0.5 | 0.25 |
| Schematic Illustration | 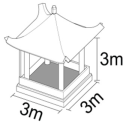 | 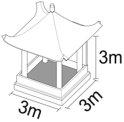 | 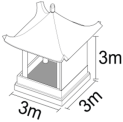 | 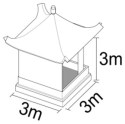 |
| DIR | South | East | North | West |
| Analysis Diagram |  | 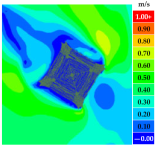 | 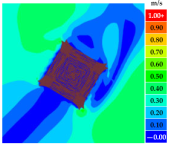 |  |
| DIR | South | East | North | West |
| Schematic Illustration |  | 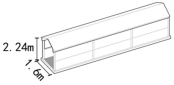 |  |
| HDR | 1.2 | 1.4 | 1.6 |
| Schematic Illustration | 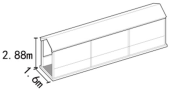 | 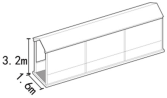 | 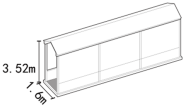 |
| HDR | 1.8 | 2.0 | 2.2 |
| Analysis Diagram | 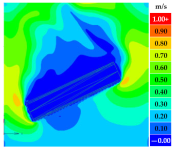 | 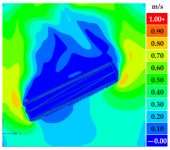 |  |
| HDR | 1.2 | 1.4 | 1.6 |
| Analysis Diagram | 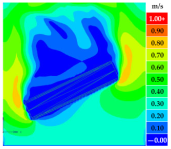 | 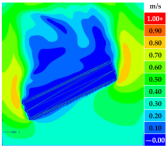 | 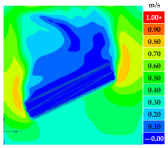 |
| HDR | 1.8 | 2.0 | 2.2 |
| Schematic Illustration |  |  |  |
| DIR | Southwest | South | Southeast |
| Analysis Diagram | 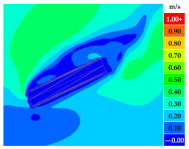 | 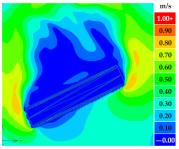 |  |
| DIR | Southwest | South | Southeast |
| Schematic Illustration | 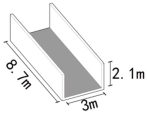 |  |  |
| HDR | 0.7 | 0.8 | 0.9 |
| Schematic Illustration | 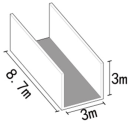 | 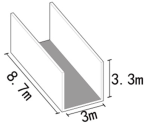 | 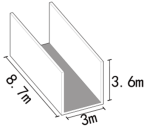 |
| HDR | 1 | 1.1 | 1.2 |
| Analysis Diagram | 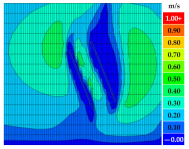 | 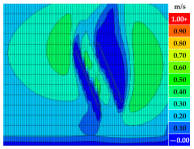 | 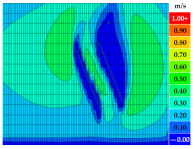 |
| HDR | 0.7 | 0.8 | 0.9 |
| Analysis Diagram |  |  | 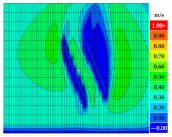 |
| HDR | 1 | 1.1 | 1.2 |
| Schematic Illustration | 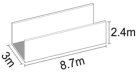 | 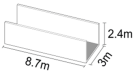 |  | 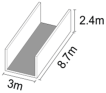 |
| DIR | West | Southwest | South | Southeast |
| Analysis Diagram | 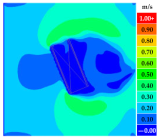 | 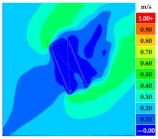 | 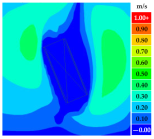 |  |
| DIR | West | Southwest | South | Southeast |
| Schematic Illustration |  |  | 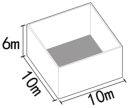 |
| HDR | 0.2 | 0.4 | 0.6 |
| Schematic Illustration | 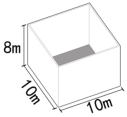 | 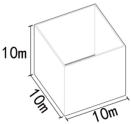 |  |
| HDR | 0.8 | 1 | 1.2 |
| Analysis Diagram | 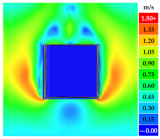 | 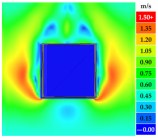 | 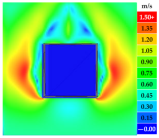 |
| HDR | 0.2 | 0.4 | 0.6 |
| Analysis Diagram | 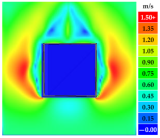 | 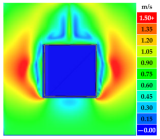 | 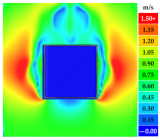 |
| HDR | 0.8 | 1 | 1.2 |
| Schematic Illustration |  |  |  |  |
| DIR | North | West | South | East |
| Analysis Diagram | 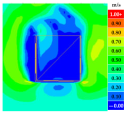 | 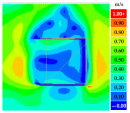 | 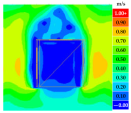 | 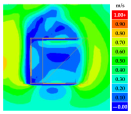 |
| DIR | North | West | South | East |
| Schematic Illustration |  |  |  |
| HDR | 0.8 | 1 | 1.2 |
| Schematic Illustration |  |  | 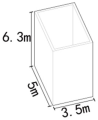 |
| HDR | 1.4 | 1.6 | 1.8 |
| Analysis Diagram | 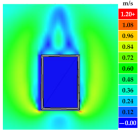 | 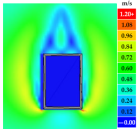 | 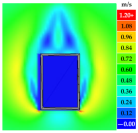 |
| HDR | 0.8 | 1 | 1.2 |
| Schematic Illustration | 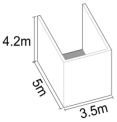 |  |  | 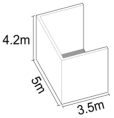 |
| DIR | South | North | West | East |
| Analysis Diagram | 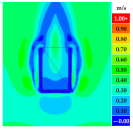 |  | 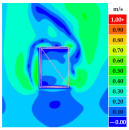 | 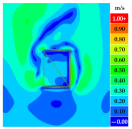 |
| DIR | South | North | West | East |
Disclaimer/Publisher’s Note: The statements, opinions and data contained in all publications are solely those of the individual author(s) and contributor(s) and not of MDPI and/or the editor(s). MDPI and/or the editor(s) disclaim responsibility for any injury to people or property resulting from any ideas, methods, instructions or products referred to in the content. |
© 2024 by the authors. Licensee MDPI, Basel, Switzerland. This article is an open access article distributed under the terms and conditions of the Creative Commons Attribution (CC BY) license (https://creativecommons.org/licenses/by/4.0/).
Share and Cite
Chen, H.; Tan, Z.; Sun, P. Research on Wind Environment Simulation in Five Types of “Gray Spaces” in Traditional Jiangnan Gardens, China. Sustainability 2024, 16, 7765. https://doi.org/10.3390/su16177765
Chen H, Tan Z, Sun P. Research on Wind Environment Simulation in Five Types of “Gray Spaces” in Traditional Jiangnan Gardens, China. Sustainability. 2024; 16(17):7765. https://doi.org/10.3390/su16177765
Chicago/Turabian StyleChen, Huishu, Zheng Tan, and Piman Sun. 2024. "Research on Wind Environment Simulation in Five Types of “Gray Spaces” in Traditional Jiangnan Gardens, China" Sustainability 16, no. 17: 7765. https://doi.org/10.3390/su16177765
APA StyleChen, H., Tan, Z., & Sun, P. (2024). Research on Wind Environment Simulation in Five Types of “Gray Spaces” in Traditional Jiangnan Gardens, China. Sustainability, 16(17), 7765. https://doi.org/10.3390/su16177765