Article

Is Younger Population Generating Higher CO2 Emissions? A Dynamic Panel Analysis on European Countries

by
Claudia Diana Sabău-Popa
1,*,
Diana Claudia Perțicaș
1,
Adrian Florea
1,
Luminița Rus
1 and
Hillary Wafula Juma
2
1
Faculty of Economic Sciences, University of Oradea, 410087 Oradea, Romania
2
Faculty of Engineering and Built Environment, The Technical University of Kenya, Nairobi 00200, Kenya
*
Author to whom correspondence should be addressed.
Sustainability 2024, 16(17), 7791; https://doi.org/10.3390/su16177791
Submission received: 1 August 2024 / Revised: 1 September 2024 / Accepted: 4 September 2024 / Published: 6 September 2024

Abstract

:
Ensuring a balance between economic growth and environmental sustainability is crucial to reduce the impact of CO2 emissions and ensure sustainable economic development for future generations. The goal of this study is to investigate the influences of the adjusted gross dispensable income (GDI) per capita, the gross domestic product (GDP) per capita, energy consumption per capita, economic inequality in the population (GINI), and the median age on the carbon emissions in 27 European countries. In the dynamic panel analysis, CO2 emissions represent the dependent variable, while adjusted GDI/capita, GDP/capita, energy use/capita, median age, and GINI are the independent variables. The valid results of the model show us that only the past values of CO2 emissions, GDP/capita, and median age significantly influence the carbon emissions in the European countries analyzed. The median age and the GDP/capita have inversely proportional impacts on the carbon emissions in Europe. A 1% increase in GDP/capita produced a 0.006% decrease in carbon emissions in Europe. The younger the population is, the higher the carbon emissions. In contrast, the adjusted gross disposable income/capita, the energy consumption/capita, and economic inequality do not significantly influence CO2 emissions/capita in the European countries and period analyzed.

1. Introduction

A green environment is necessary to have sustainable economic growth and development. Energy is necessary for the economy’s and population’s well-being; the adverse effects of energy consumption represent hot topics regarding the polluting effects it generates on the environment. Ecological development is an alternative to the development of companies through sustainability policies, with minimal polluting effects [1].
The research area of environmental protection and CO2 emissions is vast and diversified in the association of causes, terms, or indicators. In summarizing the literature of several authors, we identified associations of research interests: fossil fuel use and economic growth [2]; GDP and CO2 [3]; carbon emissions and GDP per capita; renewable energy and CO2 emissions; globalization and CO2 emissions [4]; aging population, CO2 emissions, and sustainable development [5]; income inequality, financial development, institutional quality, and carbon emissions; and income inequality, energy consumption, economic growth, and carbon emissions [6].
Considered directly responsible by their applicability, government policies to reduce polluting emissions consider the economic balance between energy consumption and environmental losses [7], as well as between green economic development and carbon emissions [8]. However, governments are not solely responsible for caring for the environment. Research highlights that in a society increasingly concerned with environmental protection and climate change, the role of the population increases in terms of economic growth and the approach of the actions it takes in this regard.
Studies show a clear link between economic growth, income inequality, GDP/capita, and CO2 emissions. Thus, the Environmental Kuznets Curve hypothesis suggests an inverted U-shaped relationship between CO2 emissions and per capita income; i.e., environmental pressure increases until a certain income level is reached. After that, the CO2 emissions decrease [9]. The empirical study by the authors M. Azam and A.Q. Khan [10] validates the Environmental Kuznets Curve hypothesis for countries with a low and medium level of income (Tanzania and Guatemala). In contrast, the hypothesis is invalid for countries with high and above-average incomes (USA and China) [10]. Moreover, D. Stern’s study [11] comes with evidence that invalidates the Environmental Kuznets Curve hypothesis, showing that there is no simple and predictable relationship between pollution and per capita income. In slower-growing economies, reductions in CO2 emissions due to technological transformations in many OECD countries may outpace per capita income growth. In middle-income economies that are in the fast-growing stage, the effects of income growth have exceeded the contribution of technological changes to reducing CO2 emissions [11].
For OECD countries, studies show that population aging has led to changes in environmental quality, which has generated research on the impact on carbon emissions of population age [12] in association with economic globalization [13] or income growth [14]—as positive outcomes for both companies and the population—in contrast to the impact of population age on environmental degradation [15], industrial structure [16], and, in particular, on road transport [17,18]. Also, higher population density is negatively correlated with CO2 emissions and energy consumption [19].
Aging populations can have a unique relationship with environmental sustainability. For example, older adults may have different consumption patterns [20,21,22] and may be more vulnerable to environmental hazards. Sustainable development strategies must consider these factors to protect both the environment and the well-being of older adults [23,24,25].
Research on the well-being of the aging population and its effect on CO2 emissions demonstrates that gender differences within the same age groups also affect carbon emissions in Asian countries [26]; regional differences have even been identified in China [17].
The link between median age and pollution is also an area of research that explores how demographic changes, particularly the aging population, influence environmental outcomes such as pollution levels [27]. The median age of a population is a useful indicator for assessing the level of aging within that population. The median age is what divides the population into two parts, in the first part people are younger and in the second part they are older. An increasing median age is often a sign of an aging population, as it indicates that a larger proportion of the population is older. Also, median age provides a straightforward and easily understandable statistic that encapsulates the overall age distribution of a population. It is particularly useful for quickly comparing the age structure of different countries or regions.
Therefore, care for the environment is manifested primarily by older people, as they are wise throughout their lives, and the younger generation is considered energy-consuming, with more actions that generate CO2 emissions. What about middle-aged people? In which of the two situations would they find themselves? If the energy consumed—by companies or individuals—in actions on economic growth can generate polluting emissions, can the age of the population be a factor that influences the environment? In this context, in this paper, we also focus on the median age of the population and CO2 emissions, the GINI index on social inequality, the GDI/capita, and the country’s GDP/capita, aiming to fill this gap in current research.
So, the main objective of this article is to analyze the influences of the adjusted gross dispensable income (GDI) per capita, the gross domestic product (GDP) per capita, energy consumption per capita, economic inequality in the population (GINI), and the median age on the carbon emissions in 27 European countries.
Our study is innovative because it is based on a dynamic and univariate regression and highlights the significant correlation between CO2 emissions on the one hand and GDP/capita, energy consumption/capita, GINI, GDI/capita, and the median age of the population on the other hand. Also, the originality lies in the unique approach and the combination of variables used in the model [28].
This article is structured as follows: Section 2 shows the state of the literature on the existing correlation between population age, GDP/capita, sustainable economic development, CO2 emissions and the causes of CO2 emissions. Section 3 presents the data, the research methodology, and the empirical results obtained. Section 4 presents the conclusions based on the analysis performed and its limitations.
The empirical analysis revealed a close connection between CO2 emissions, on the one hand, and GDP/capita and the median age of the population from the European countries analyzed on the other.

2. Literature Review

2.1. The Relationship between Population Age, CO2 Emissions, and Sustainable Economic Development

The age of the population and its correlation with the CO2 emissions generated have been and are the subjects of research as influences or results of interventions on the environment. As a database containing significant research papers, the Web of Science has been a starting point for the state of knowledge and this research. Searches for “CO2 emissions” and “population age” revealed 322 scientific papers, of which 137 were open access. Starting from 2020, the number of papers published annually on the analyzed topic increased to an average of 40 papers per year, compared to previous years. By processing the information extracted from these papers, with VOS viewer, a map of all links between all keywords—author’s keywords and keywords plus—was created in the form of the one presented in Figure 1, with 748 links between keywords.
We note a predominant cluster of links around keywords “energy-consumption”, “economic growth” and “CO2 emissions” (green color). The other four clusters show keywords within the relative same dimension and with the same bond intensity: “China”, “decomposition”, and “stirpat model” (purple color); “population aging”, “growth”, “energy use”, “income”, and “impact” (blue color); “greenhouse gas emissions”, “consumption”, “energy”, “population”, “panel data”, and “sustainability” (red color); and “carbon dioxide emissions”, “age structure”, “stirpat”, and “urbanization” (khaki color). This clustering expresses research on how these factors can influence each other for different countries and periods, the timespan of the 322 scientific papers being 1993–2024 (including early-access articles).
The authors with the most relevant papers to our research come from China, the United States of America, Japan, Australia, Norway, Russia, and Saudi Arabia, which proves that there is interest on all continents in pollutant emissions for the environment and the impact they have in the short or long term. Figure 2 explores the productivity of authors over the entire analyzed period, presenting the top 20 authors with the most publications. We note that there are two authors with the highest number of papers, namely Wang Q with eleven papers and Li RR with nine papers. Highlighting the fact that fractional authorship value describes the author’s contribution to a series of published works [29], we show that the author Wang Q from China obtained the highest fractional value of 3.83 on the analyzed topic, followed by Li RR with a fractional value of 2.83 and Ahmad M. with a total of four papers published on the analyzed topic and a fractional value of 1.25; these authors are from China.
The trend of interest in research topics in 2020–2024 (including early-access articles) has significantly changed compared to 1993–2019, as shown in Figure 3. We notice that starting from 2021, the keywords “energy consumption”, “economic growth”, “CO2 emissions” and “age structure” are among the top ten most important research topics on” climate-change” and” environmental protection”.
The link between sustainable development and aging is about creating resilient [21,30,31], inclusive, and adaptable societies that can meet the needs of an aging population while also ensuring long-term sustainability across all dimensions [21,24].
Following this turn of research interest, we cannot ignore the link between “age”, “sustainable development”, and “CO2 emissions” through the use of different energy sources, which leads us to study points of view on different cause-and-effect links researched so far.

2.2. The Causes of CO2 Emissions and Their Connection with Energy Consumption, GDP/Capita, and Income Inequality

Carbon dioxide (CO2) emissions are a critical factor [32] in discussions around sustainable development. The increase in CO2 emissions, primarily due to the burning of fossil fuels [33], is a significant contributor to global climate change, which threatens to undermine progress towards several Sustainable Development Goals (SDGs). High levels of CO2 emissions exacerbate environmental degradation, adversely affecting ecosystems, human health, and economic stability. This, in turn, affects efforts to reduce poverty [34], ensure food security, promote health and well-being, and create sustainable cities and communities. Achieving a balance between economic growth and environmental sustainability is essential to mitigate the impacts of CO2 emissions and ensure that development is truly sustainable for future generations [35].
The causes of CO2 emissions are multifaceted [36], stemming from various human activities and industrial processes, highlighting the strong correlation between emissions and the wealth of a country, indicating that developed countries with mature economies have a more attainable goal of reducing greenhouse gas emissions [37,38,39,40]. Overall, the causes of CO2 emissions are deeply intertwined with economic development, technological choices, and the global consequences of emissions [41].
Thus, Menyah and Wolde-Rufael [42], for the US, explore the causal relationship between carbon dioxide emissions, renewable and nuclear energy consumption, and real GDP for 1960–2007, with results indicating that the consumption of nuclear energy can reduce CO2 emissions. On the other hand, Salari et al. [43], exploring the same relationships for the period 1997–2016, show a long-term relationship between different types of energy consumption and CO2 emissions at the state level for both static and dynamic models.
In the same context, Shahbaz et al. [2] examine the effect of renewable energy consumption on economic growth in 38 renewable-energy-consuming countries from 1990 to 2018, concluding that the using renewable energy reduces CO2 emissions and strengthens energy efficiency. The results of their study show that renewable energy, capital, and labor have a positive impact on economic growth, and renewable energy consumption contributes significantly to reducing CO2 emissions. Al-Mulali [44] investigates the influence of nuclear energy consumption on GDP growth and carbon emissions in 30 nuclear-intensive countries from 1990 to 2010, with the results of its study indicating, based on the Pedroni integration test, that nuclear energy is co-integrated with both GDP growth and carbon emissions. Recently, Mirziyoyeva and Salahodjaev [4], focusing on the top 50 most globalized countries, researched the multidimensional relationship between economic growth, renewable energy, climate change, and carbon emissions, concluding that policymakers in the analyzed countries are trying to identify predictors of CO2 emissions and, by applying them, pollution can be reduced without affecting economic growth.
Mediterranean countries formed the basis of the research by Belaïd and Zrelli [45] concerning electricity consumption from renewable or non-renewable sources, GDP, and carbon emissions for the period 1980–2014, with their results suggesting the adoption of policies aimed at encouraging the use of renewable energy and increasing energy efficiency as the main ways to reduce pollutant emissions and support economic growth. Because the energy consumed in Turkey, as a Mediterranean country, is derived primarily from renewable sources, Karaaslan and Çamkaya [3] explore the long- and short-term effects of gross domestic product, health spending, and renewable and non-renewable energy consumption on Turkey’s carbon emissions for the period 1980–2016, with the research finding that, in the long term, renewable energy and health spending reduce CO2 emissions, and non-renewable energy growth and GDP increase carbon emissions.
A summary of the ten most relevant and cited scientific publications is presented in Table 1, highlighting the relationships identified and the statistical method used to formulate conclusions. We note the diversity of associations in the research of polluting factors with those of good condition, the diversity of the degree of development and technology of the analyzed countries, and the diversity of the category of renewable or non-renewable energy consumers. However, we found that there is also research on people’s incomes and their availability to protect the environment.
Khan et al. [5] studied the effect of social inequality on carbon emissions in 180 countries for the period 2002–2019, using the GINI index to measure social inequality and country GDP; the analysis takes into account a set of six indicators: accountability, rule of law, quality of regulation, political stability, control of corruption, and efficiency of government. Their research concludes that GINI (income inequality coefficient), financial development through internal credit to the private sector, and renewable energy consumption positively affect carbon emissions.
Kang H. [54] statistically analyzes the link between income inequality, economic growth, and CO2 emissions for 38 OECD countries for the period 1990–2015. Based on the Environmental Kuznets Curve hypothesis, this study’s results show that the effects of economic growth and income inequality on carbon emissions have an inverted U-shaped relationship. Using the extended hypothesis of the Kuznets curve, Atici C [55] analyzes the influence of GDP/capita, energy used/capita, and trade openness on CO2 emissions in Bulgaria, Hungary, Romania, and Turkey. The study’s results confirm the validation of a Kuznets curve for the region, with CO2 emissions decreasing as GDP per capita increases. The energy used/capita variable is significantly correlated with CO2 emissions, indicating that the region produces and consumes ecologically unhealthy energy. The trade openness variable does not significantly influence CO2 emissions. On the contrary, Abid, M. [53] shows in his study that the Environmental Kuznets Curve hypothesis is not valid for Sub-Saharan African economies, indicating that there is a linear relationship between CO2 emissions and GDP/capita.
Tutak and Brodnythere [56] show in their research that the increase in the use of renewable energy in the period of 2000–2019 had a positive effect on GDP per capita and determined the reduction in CO2 emissions per capita in European Union countries. This finding is also supported by the research results of the authors Saidi and Omri [57].
Our research, which delves into the complex interplay of energy consumption, economic factors, and carbon emissions, holds significant implications for the population, companies, and the environment. It also sheds light on the influence of the population on the use of renewable or non-renewable energy sources and carbon emissions. This research is particularly relevant to the broader context of 27 European countries. We aim to investigate how carbon emissions are influenced by the adjusted gross disposable income (GDI) per capita, the gross domestic product (GDP), energy consumption per capita, the median age, and economic inequality in the population (GINI) over a 22-year period from 2000 to 2021.

3. Materials and Methods

The data set for this study is robust, comprising 594 observations from 27 countries, including EU member states (without Malta) and Iceland, with an annual frequency. The analysis period spans from 2000 to 2021. Our study focuses on the relationship between CO2 emissions/capita and several independent variables, including adjusted gross disposable income (GDI) per capita, gross domestic product (GDP)/capita, energy consumption per capita, median age, and economic inequality in the population (GINI).
The analysis carried out has the following four research hypotheses:
H1. 
The increase in energy consumption generates an increase in CO2 emissions.
H2. 
The median age significantly and negatively influences CO2 emissions.
H3. 
GDP/capita significantly and negatively influences CO2 emissions.
H4. 
The adjusted gross dispensable income (GDI) per capita and the economic inequality in the population (GINI) significantly influence the CO2 emissions.

3.1. Analysis of the Data and Variables Used in Dynamic Panel Analysis

Next, we will present the variables considered in the dynamic regression. Table 2 shows the variables analyzed from a statistical point of view.
CO2 emissions/capita—the dependent variable—come from burning fossil fuels (oil and petroleum products, natural gas, coal, and peat) for energy use in the EU. CO2 emissions from energy use contribute significantly to global warming and account for around 75% of all greenhouse gas emissions in the EU [58].
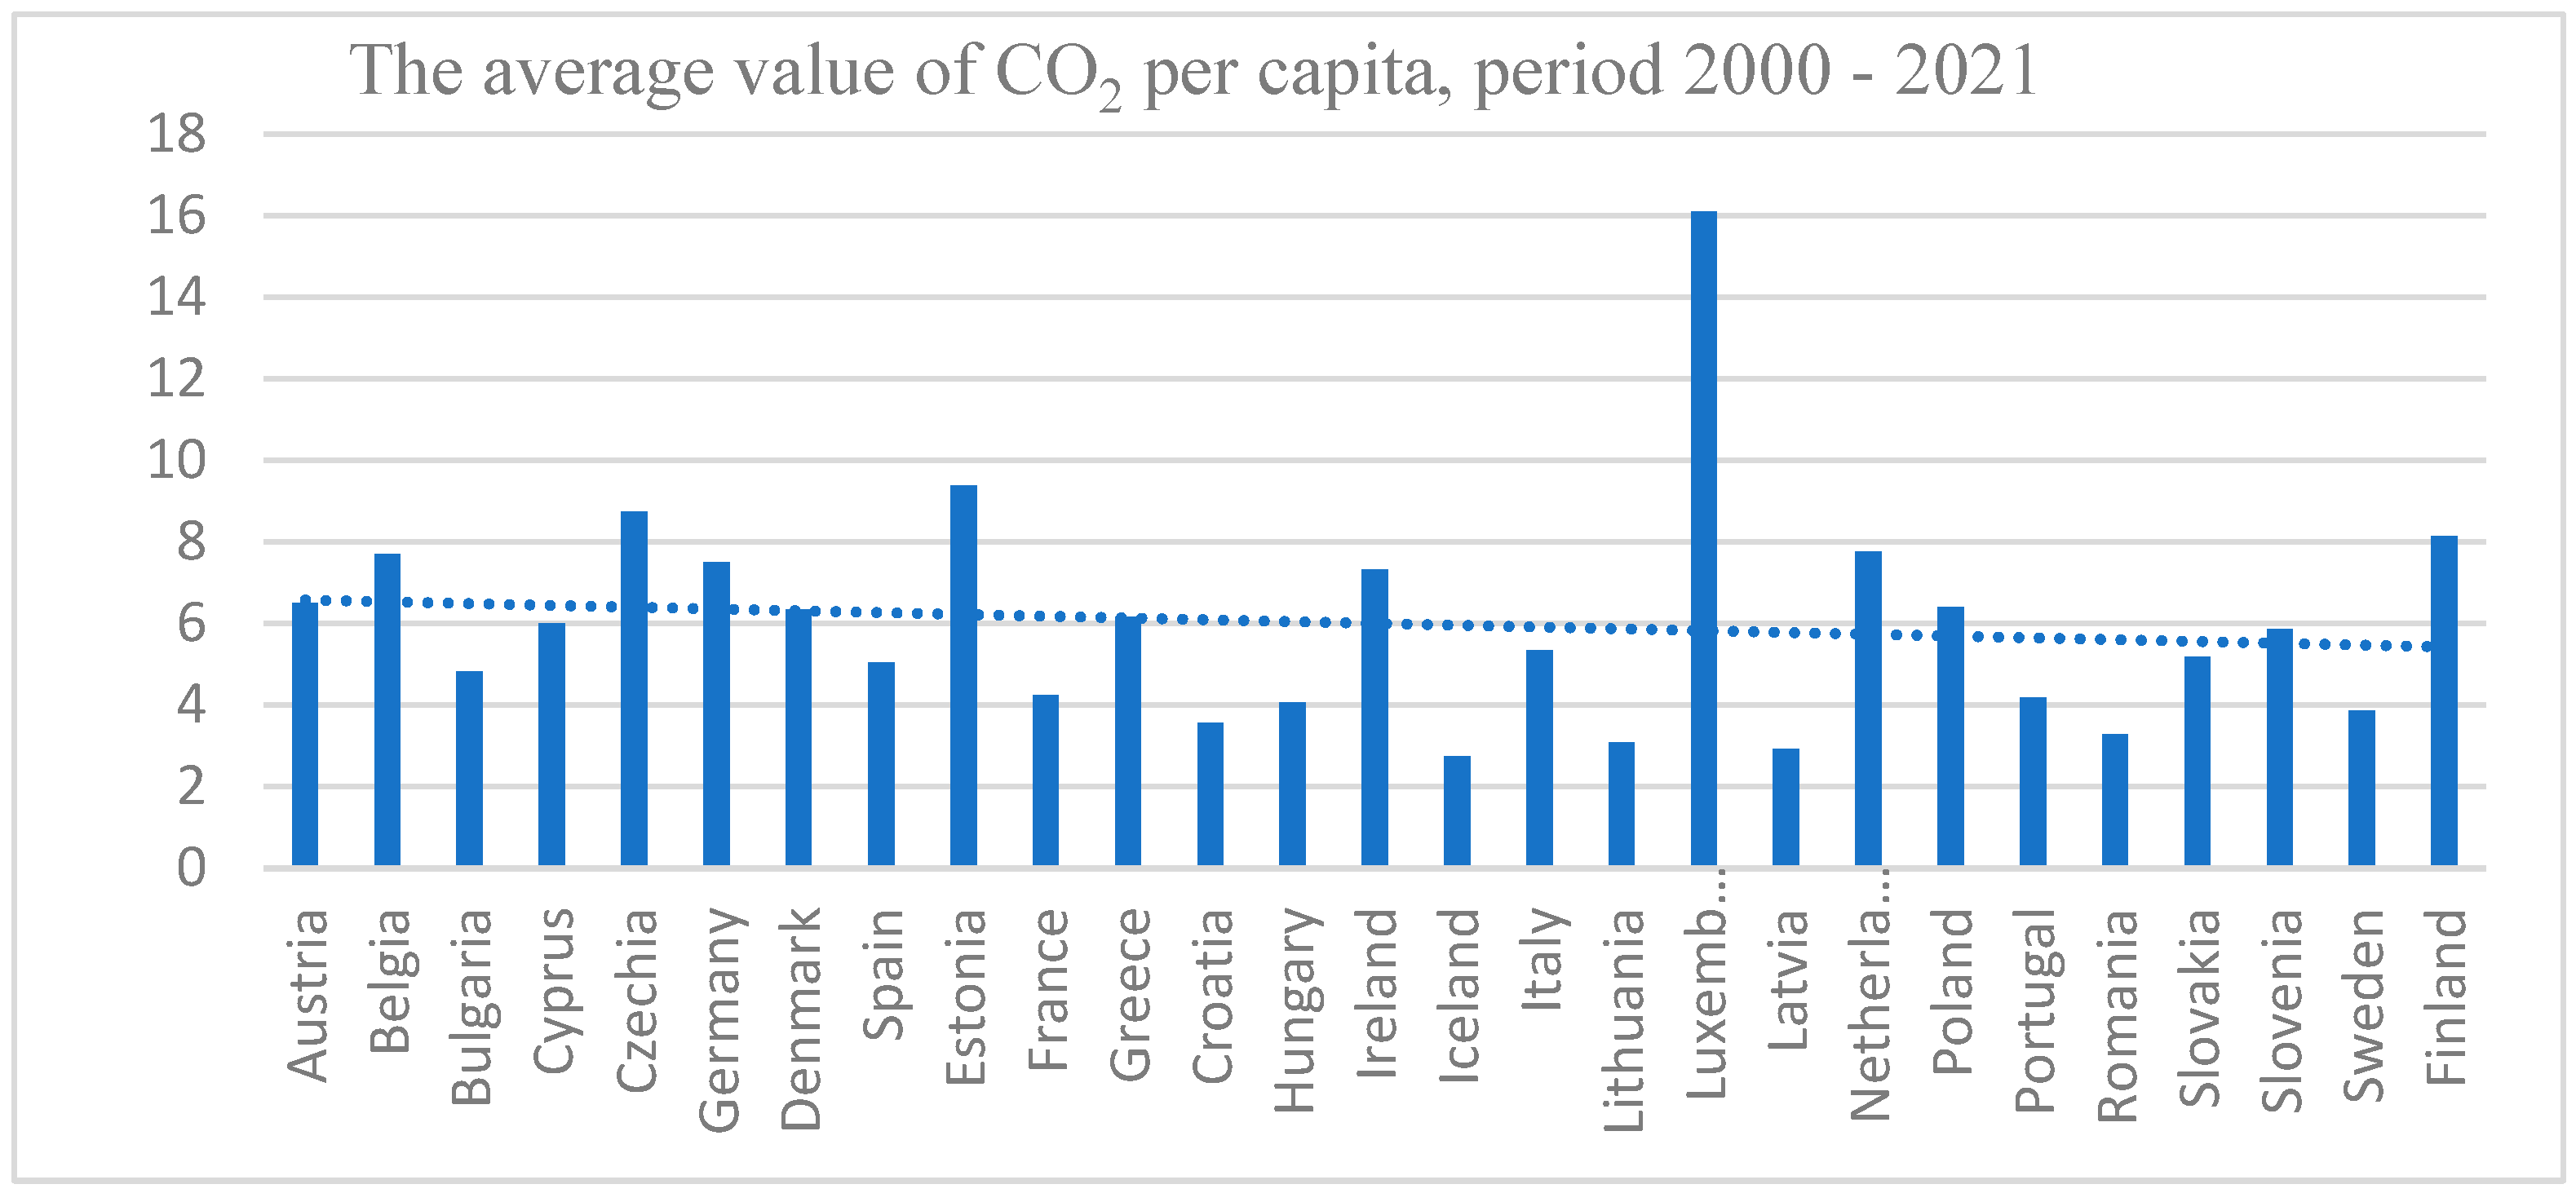
Figure 4 captures the CO2 emissions from 2000 until 2021 and shows us a real decrease in all 27 countries. The values are between 2.32 tons per inhabitant (the lowest value), registered in Croatia (2012), and 25.61 tons per inhabitant (the higher value), recorded in Luxembourg (2006). In 2021, the lowest value of CO2 emissions was registered in Latvia (3.65 tones), and the highest value was in Luxembourg (12.46 tones).
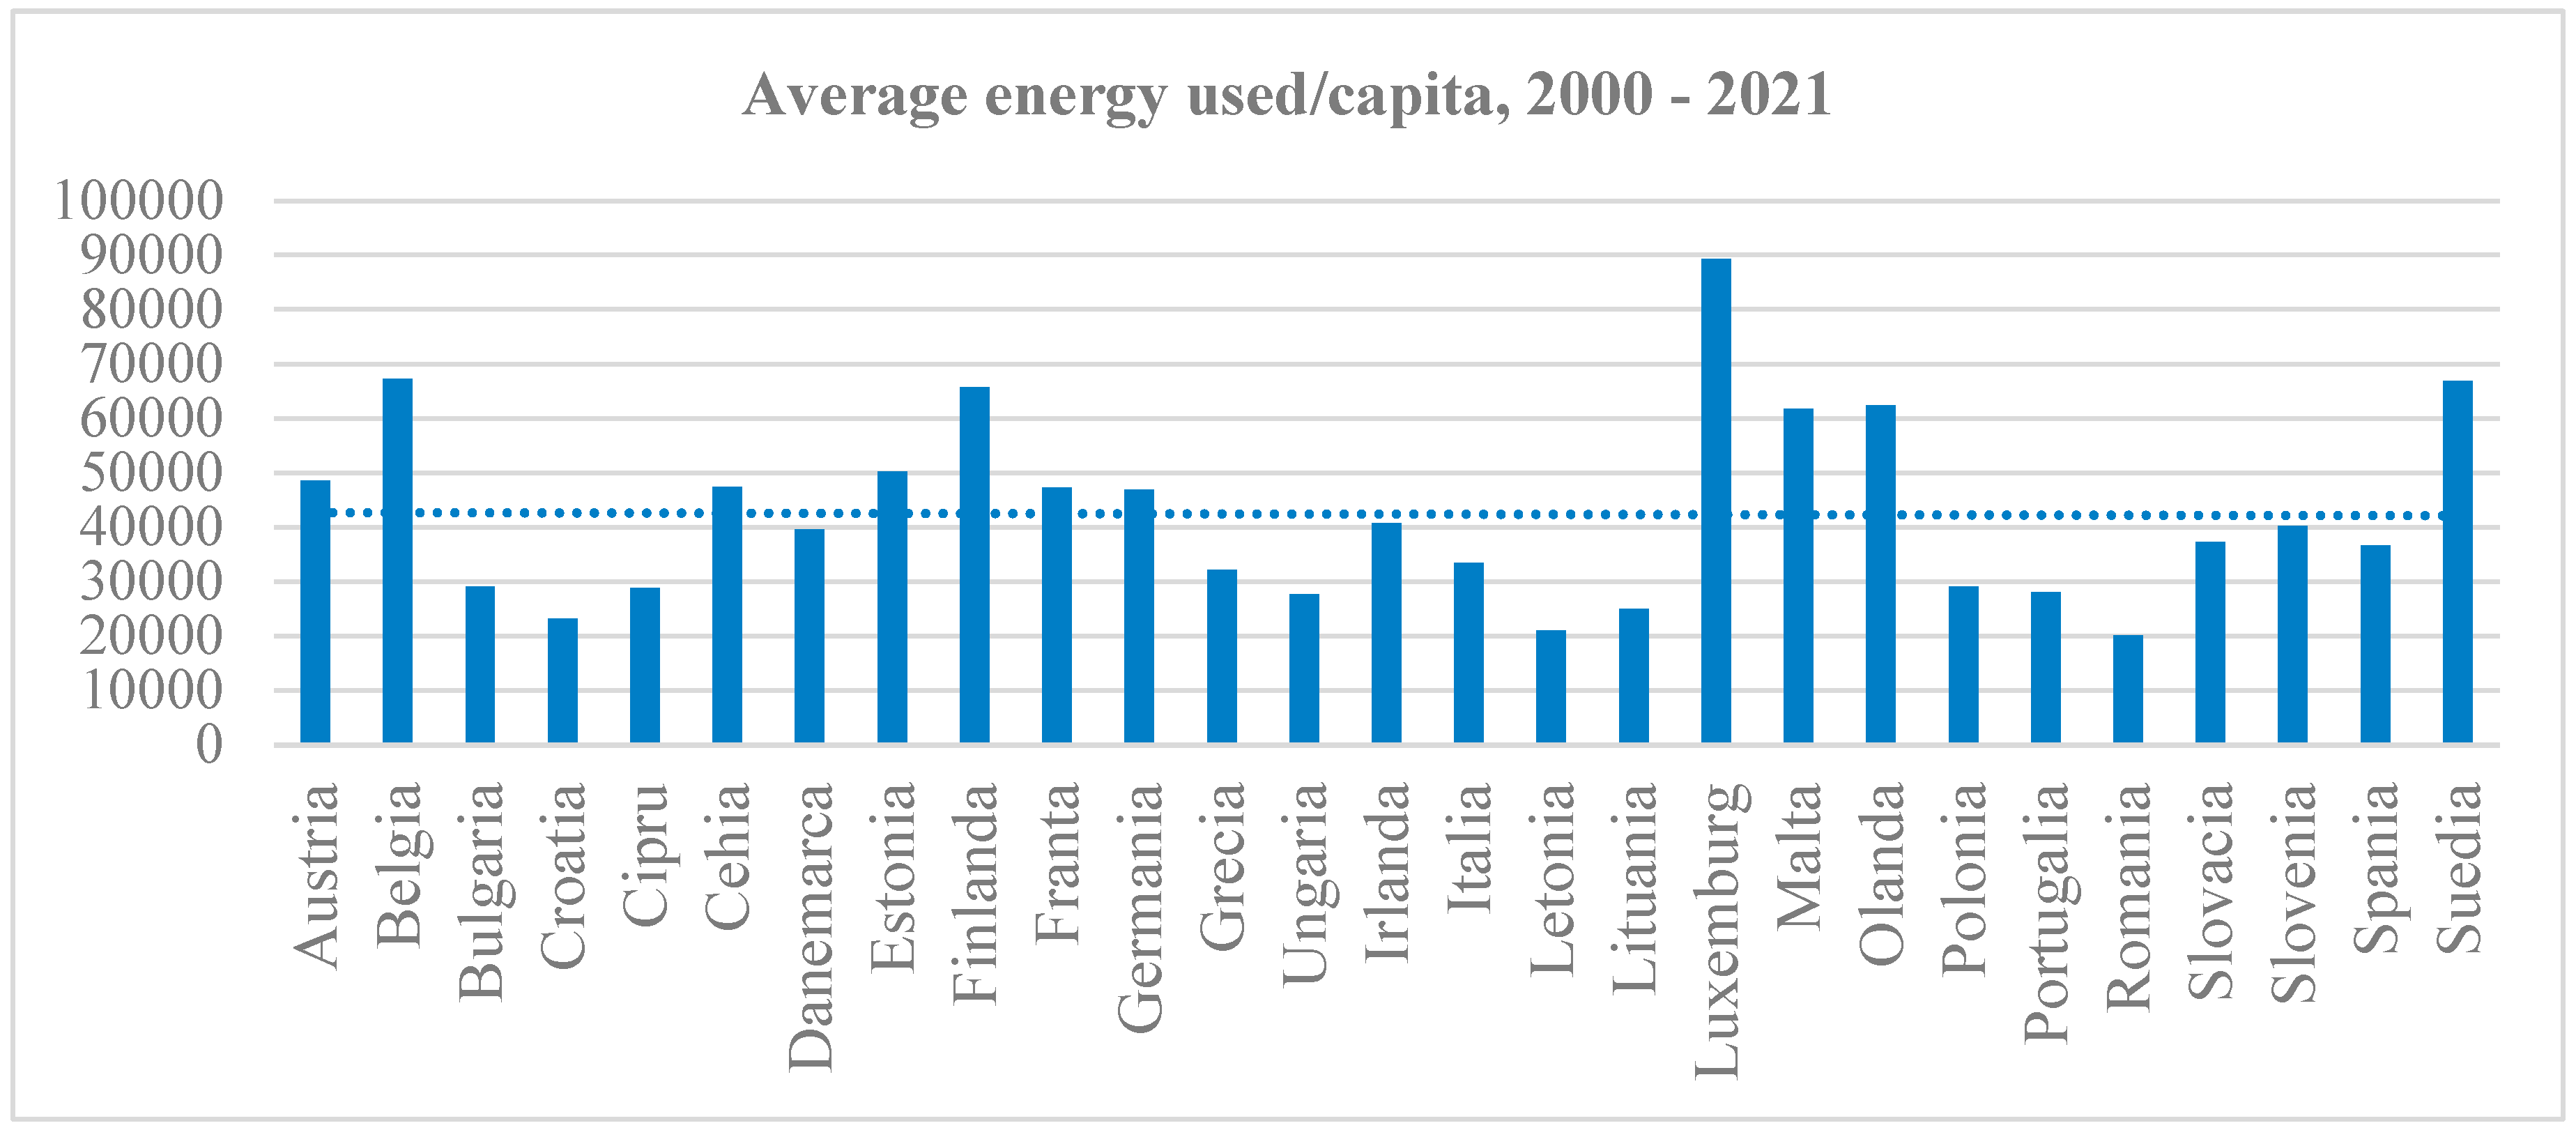
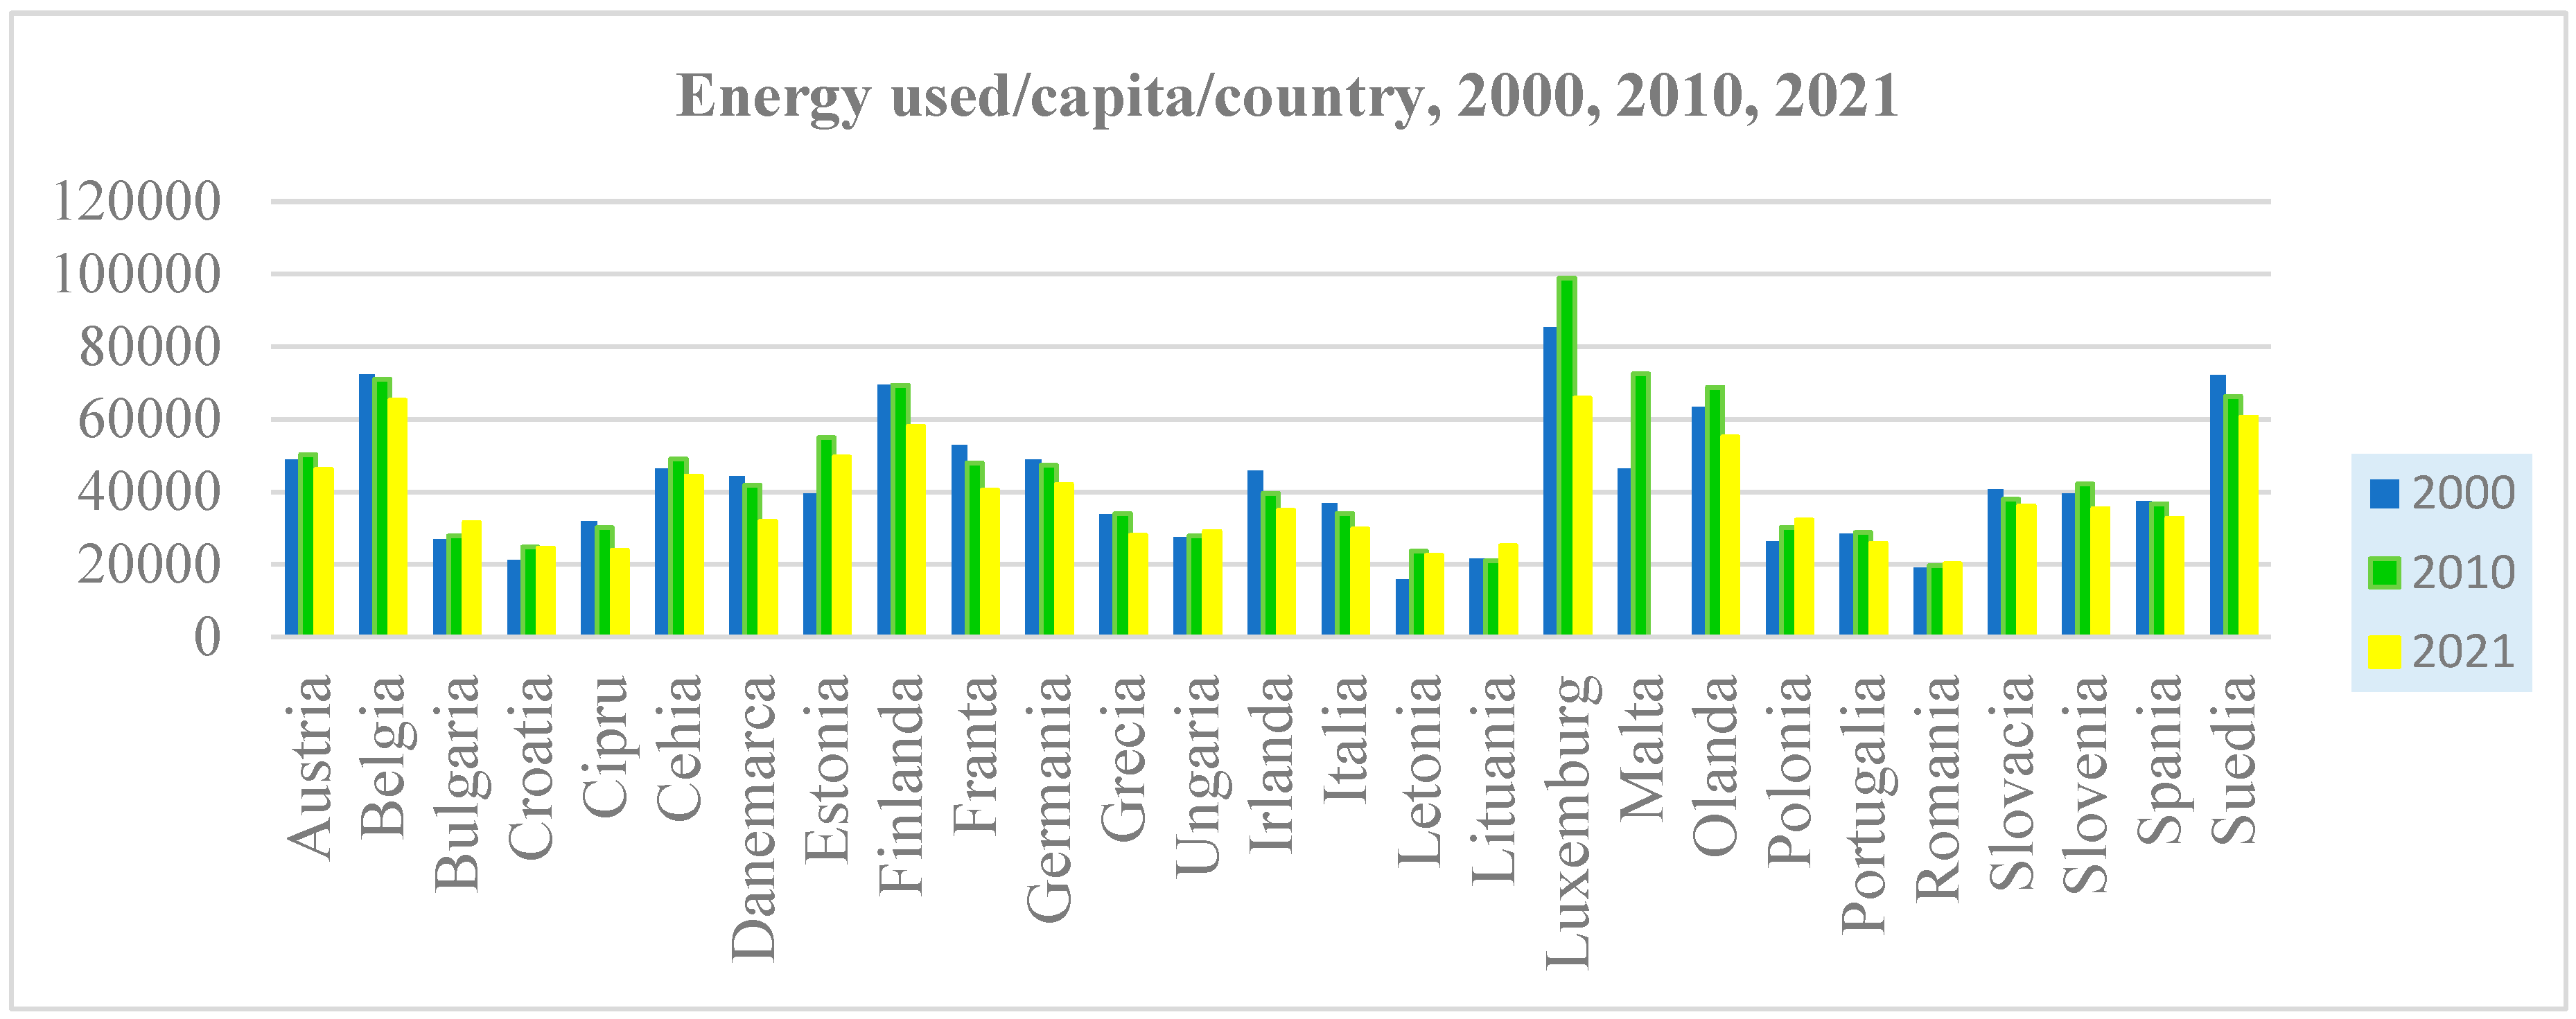
The independent variable of primary energy consumption/capita measures energy consumption per person in a given country. While the world’s population is growing rapidly, the total primary energy consumption (and electricity in particular) is growing much faster [58]. The minimum value of the energy consumption variable was recorded in Latvia in 2000 at 15,780 kWh/person, and the maximum value was reached in 2004 in Luxembourg at 113,106 kWh/person.
Figure 5, which reflects energy consumption per capita in the 27 countries between 2000 and 2021, shows us a downward trend, without significant fluctuations. However, the most notable variation occurred between 2019 and 2020, when consumption dropped from 39,374 kWh/person to 35,037 kWh/person, due to the COVID-19 pandemic affecting primary energy consumption.
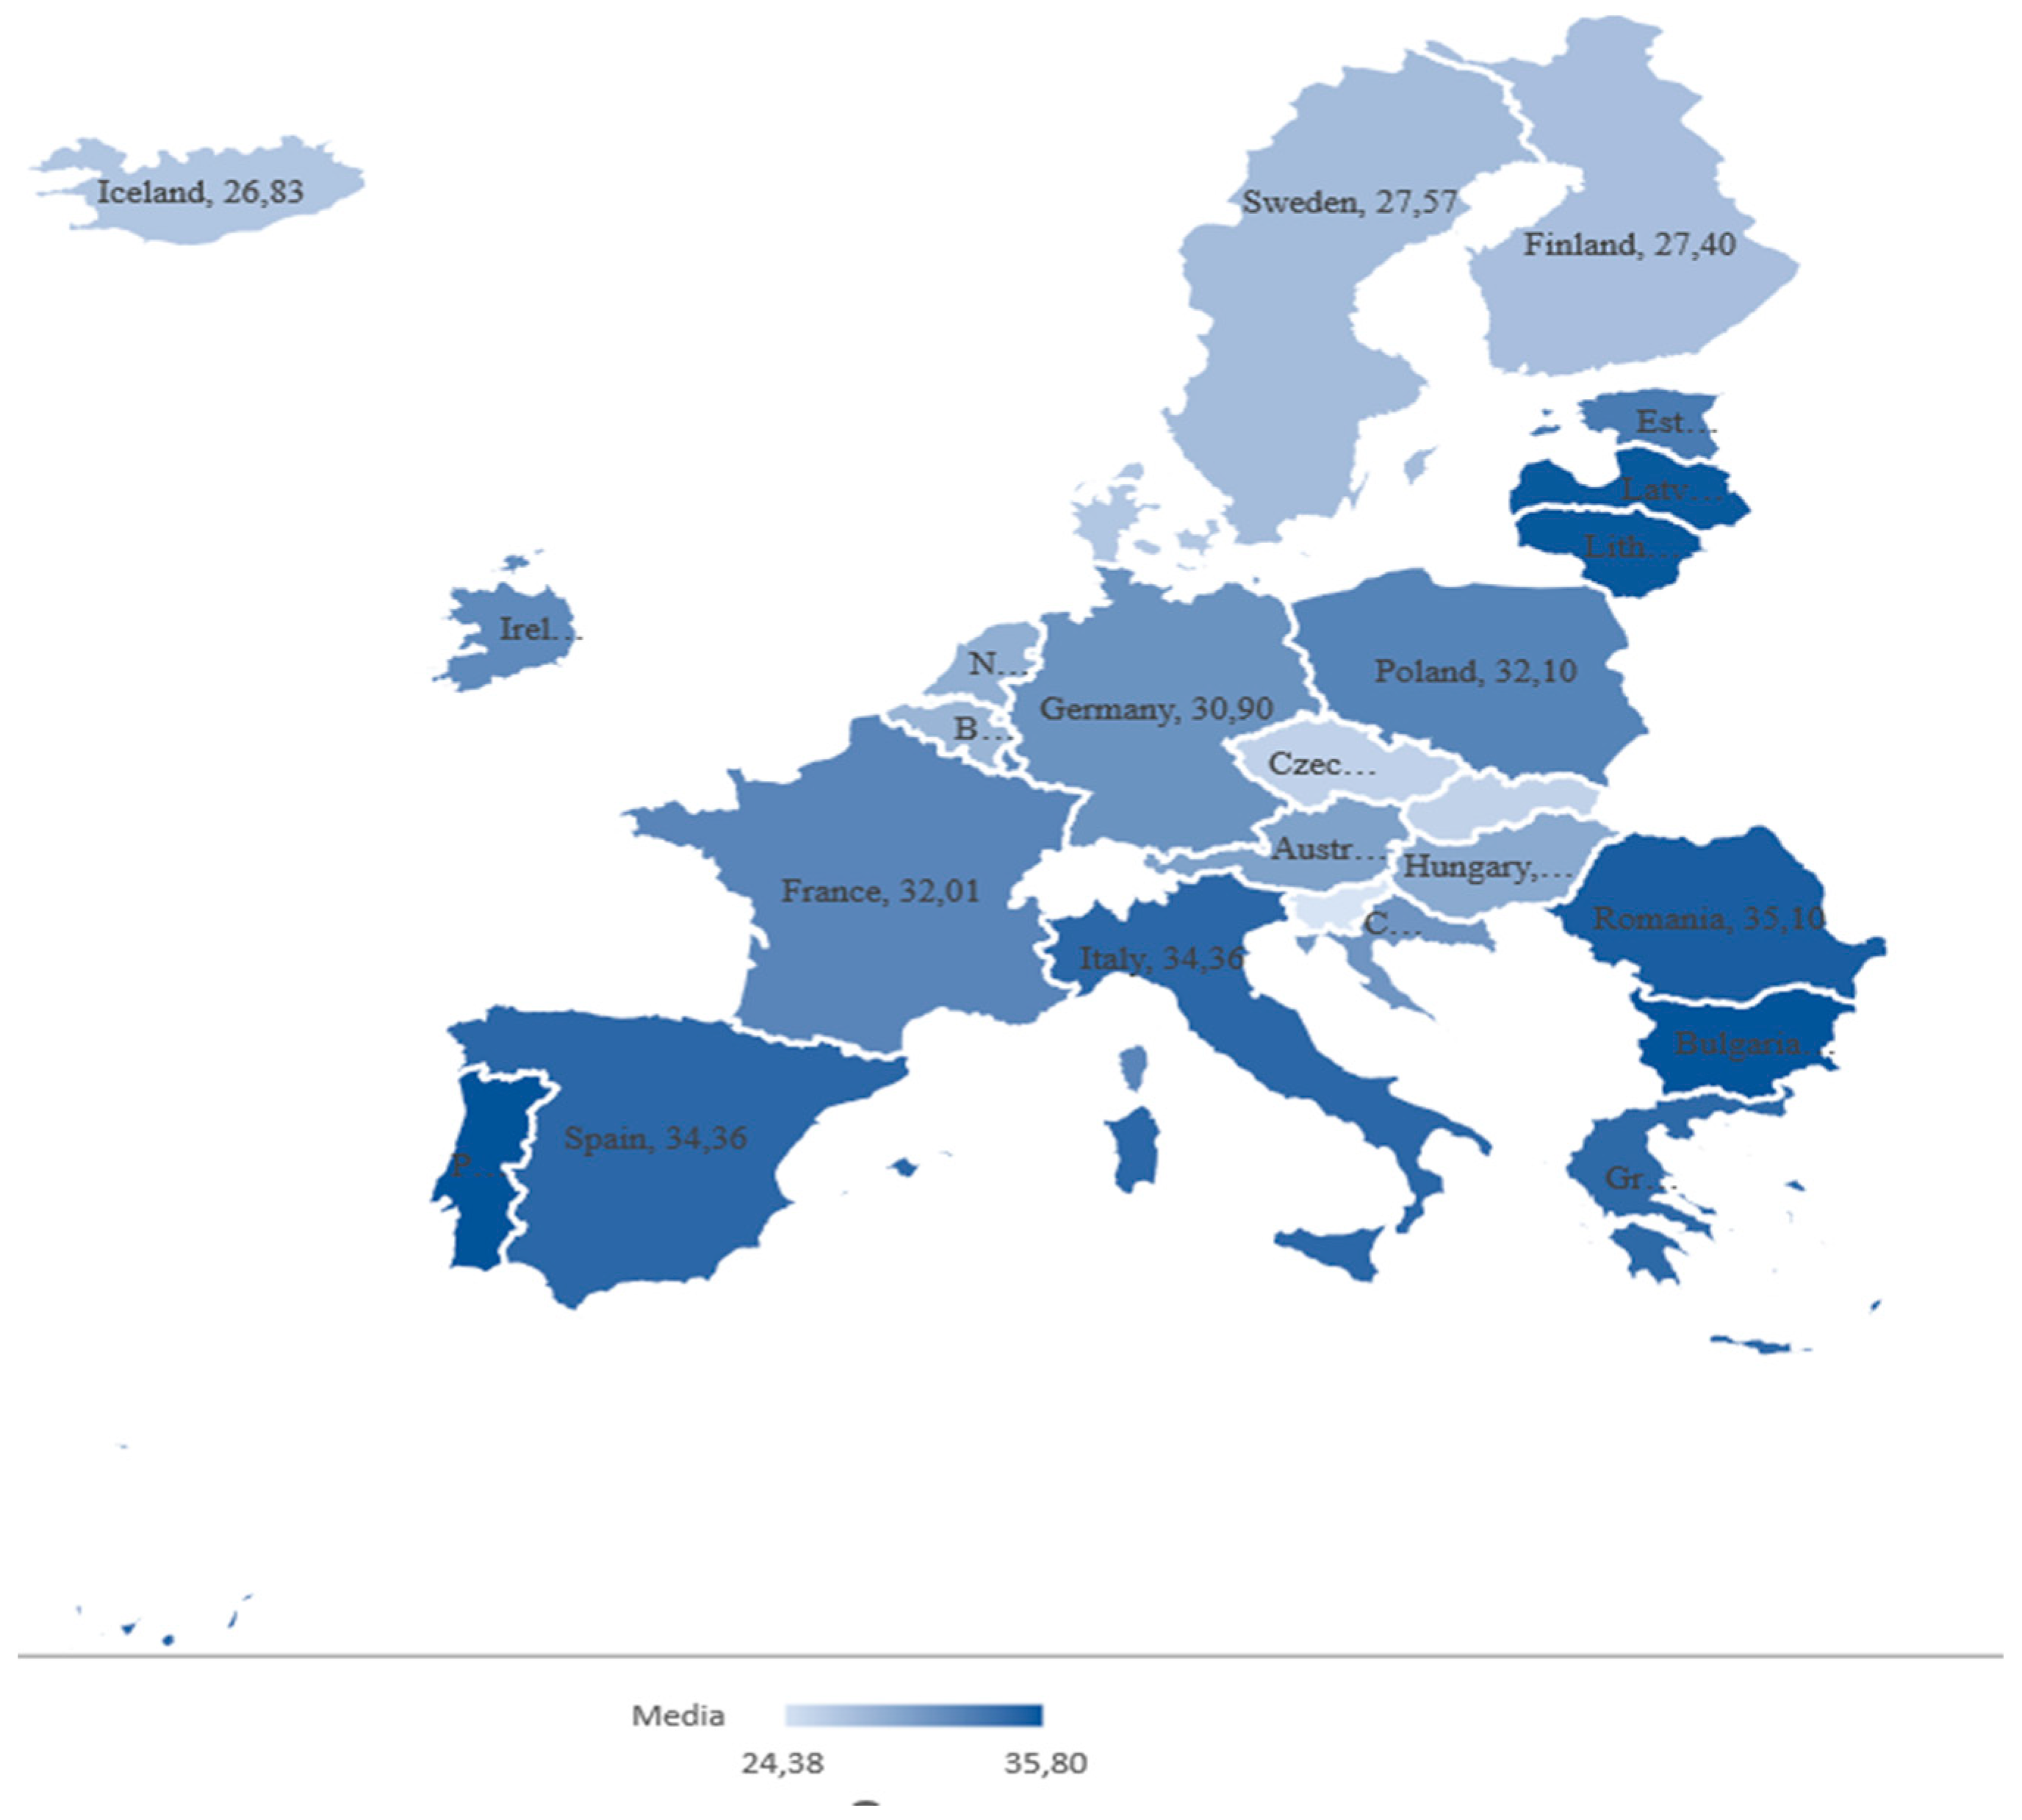
The variable economic inequality in the population (GINI index) synthetically expresses the degree of economic inequality and “measures the extent to which the distribution of income or consumption among individuals or households within an economy deviates from a perfectly equal distribution” [59]. Compared with 2007, the GINI index for analyzed countries decreased by 0.4% in 2021. The lowest value of the GINI index was recorded in Slovenia in 2000 with 22, and the highest value was registered in 2004 in Bulgaria with 41.3. As shown in Figure 6, the countries with the most significant economic inequalities are Bulgaria, Lithuania, Portugal, and Romania, with GINI index values above 35.
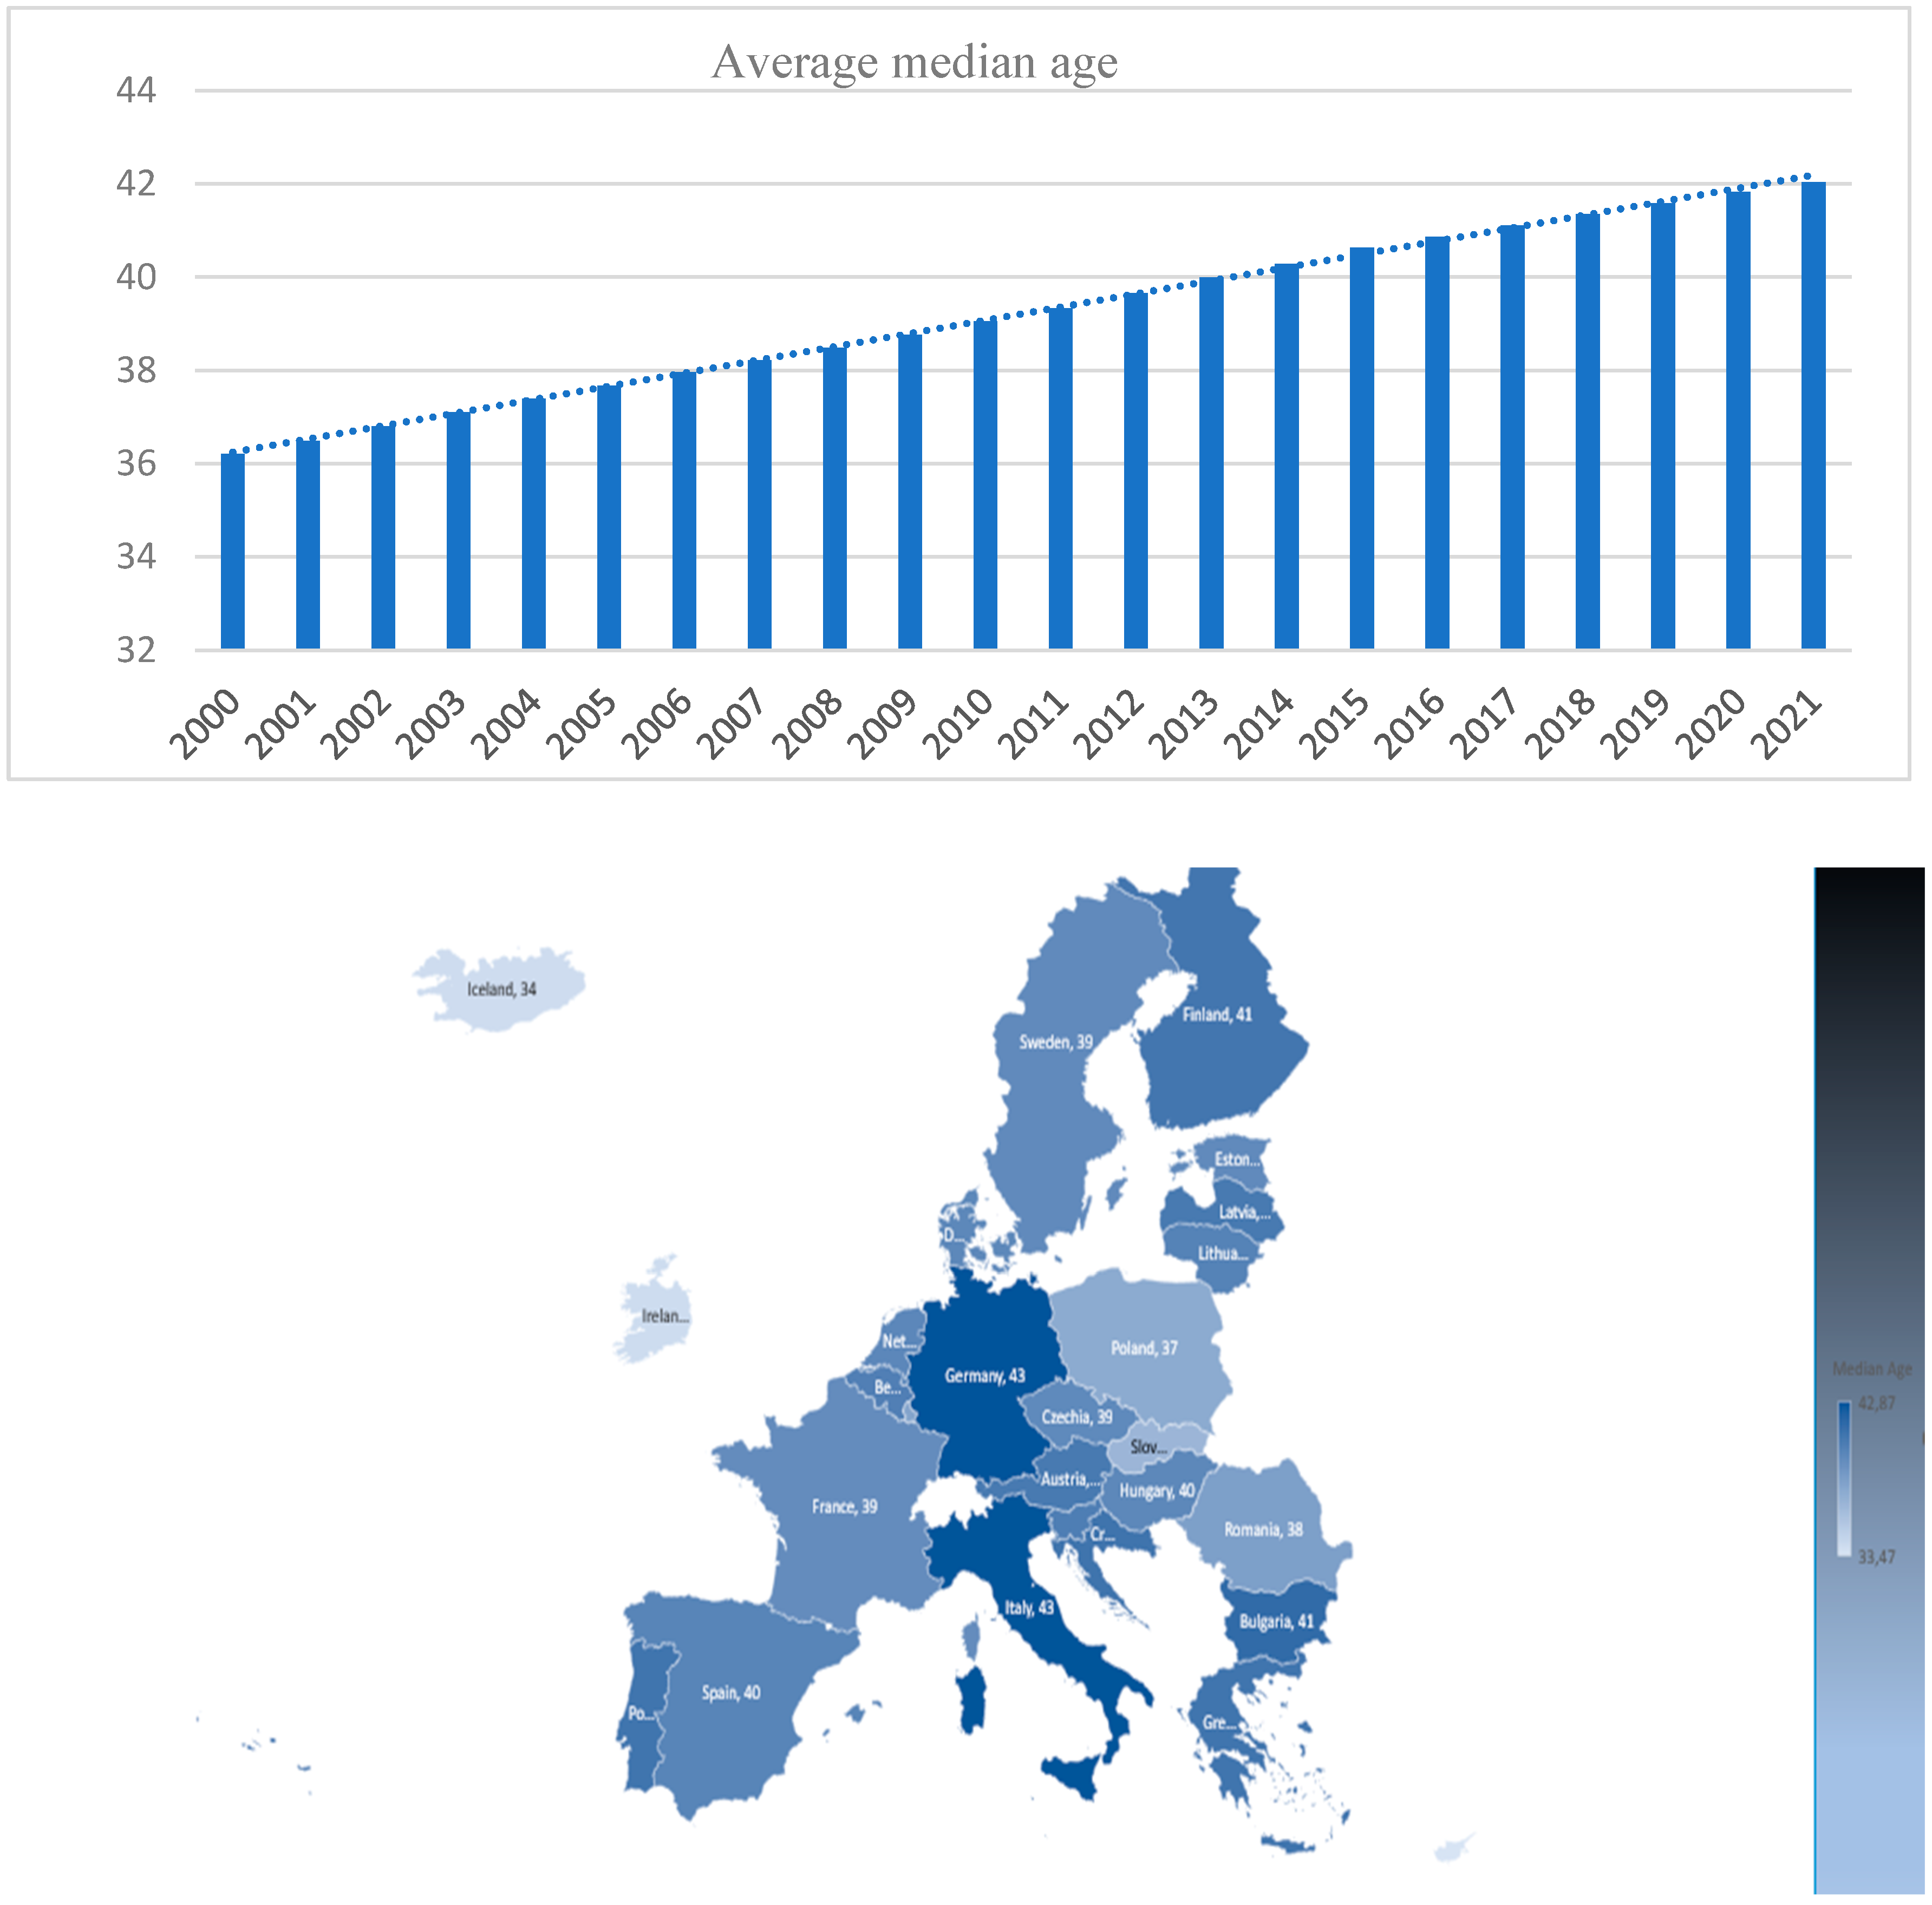
The independent variable median age divides the population into two parts of equal size; that is, 50% of the population is above the median age and 50% of the population is below the median age. As shown in Figure 7, the trend of the median age variable is continuously increasing.
The lowest value of the variable was registered in Cyprus in 2000 at 30.4 years, and the highest value was recorded in the year 2021 in Italy at 46.8 years. Bulgaria, Italy, and Germany represent the oldest populations in Europe. The youngest populations of Europe live in Cyprus, Iceland, Ireland, and Slovakia.
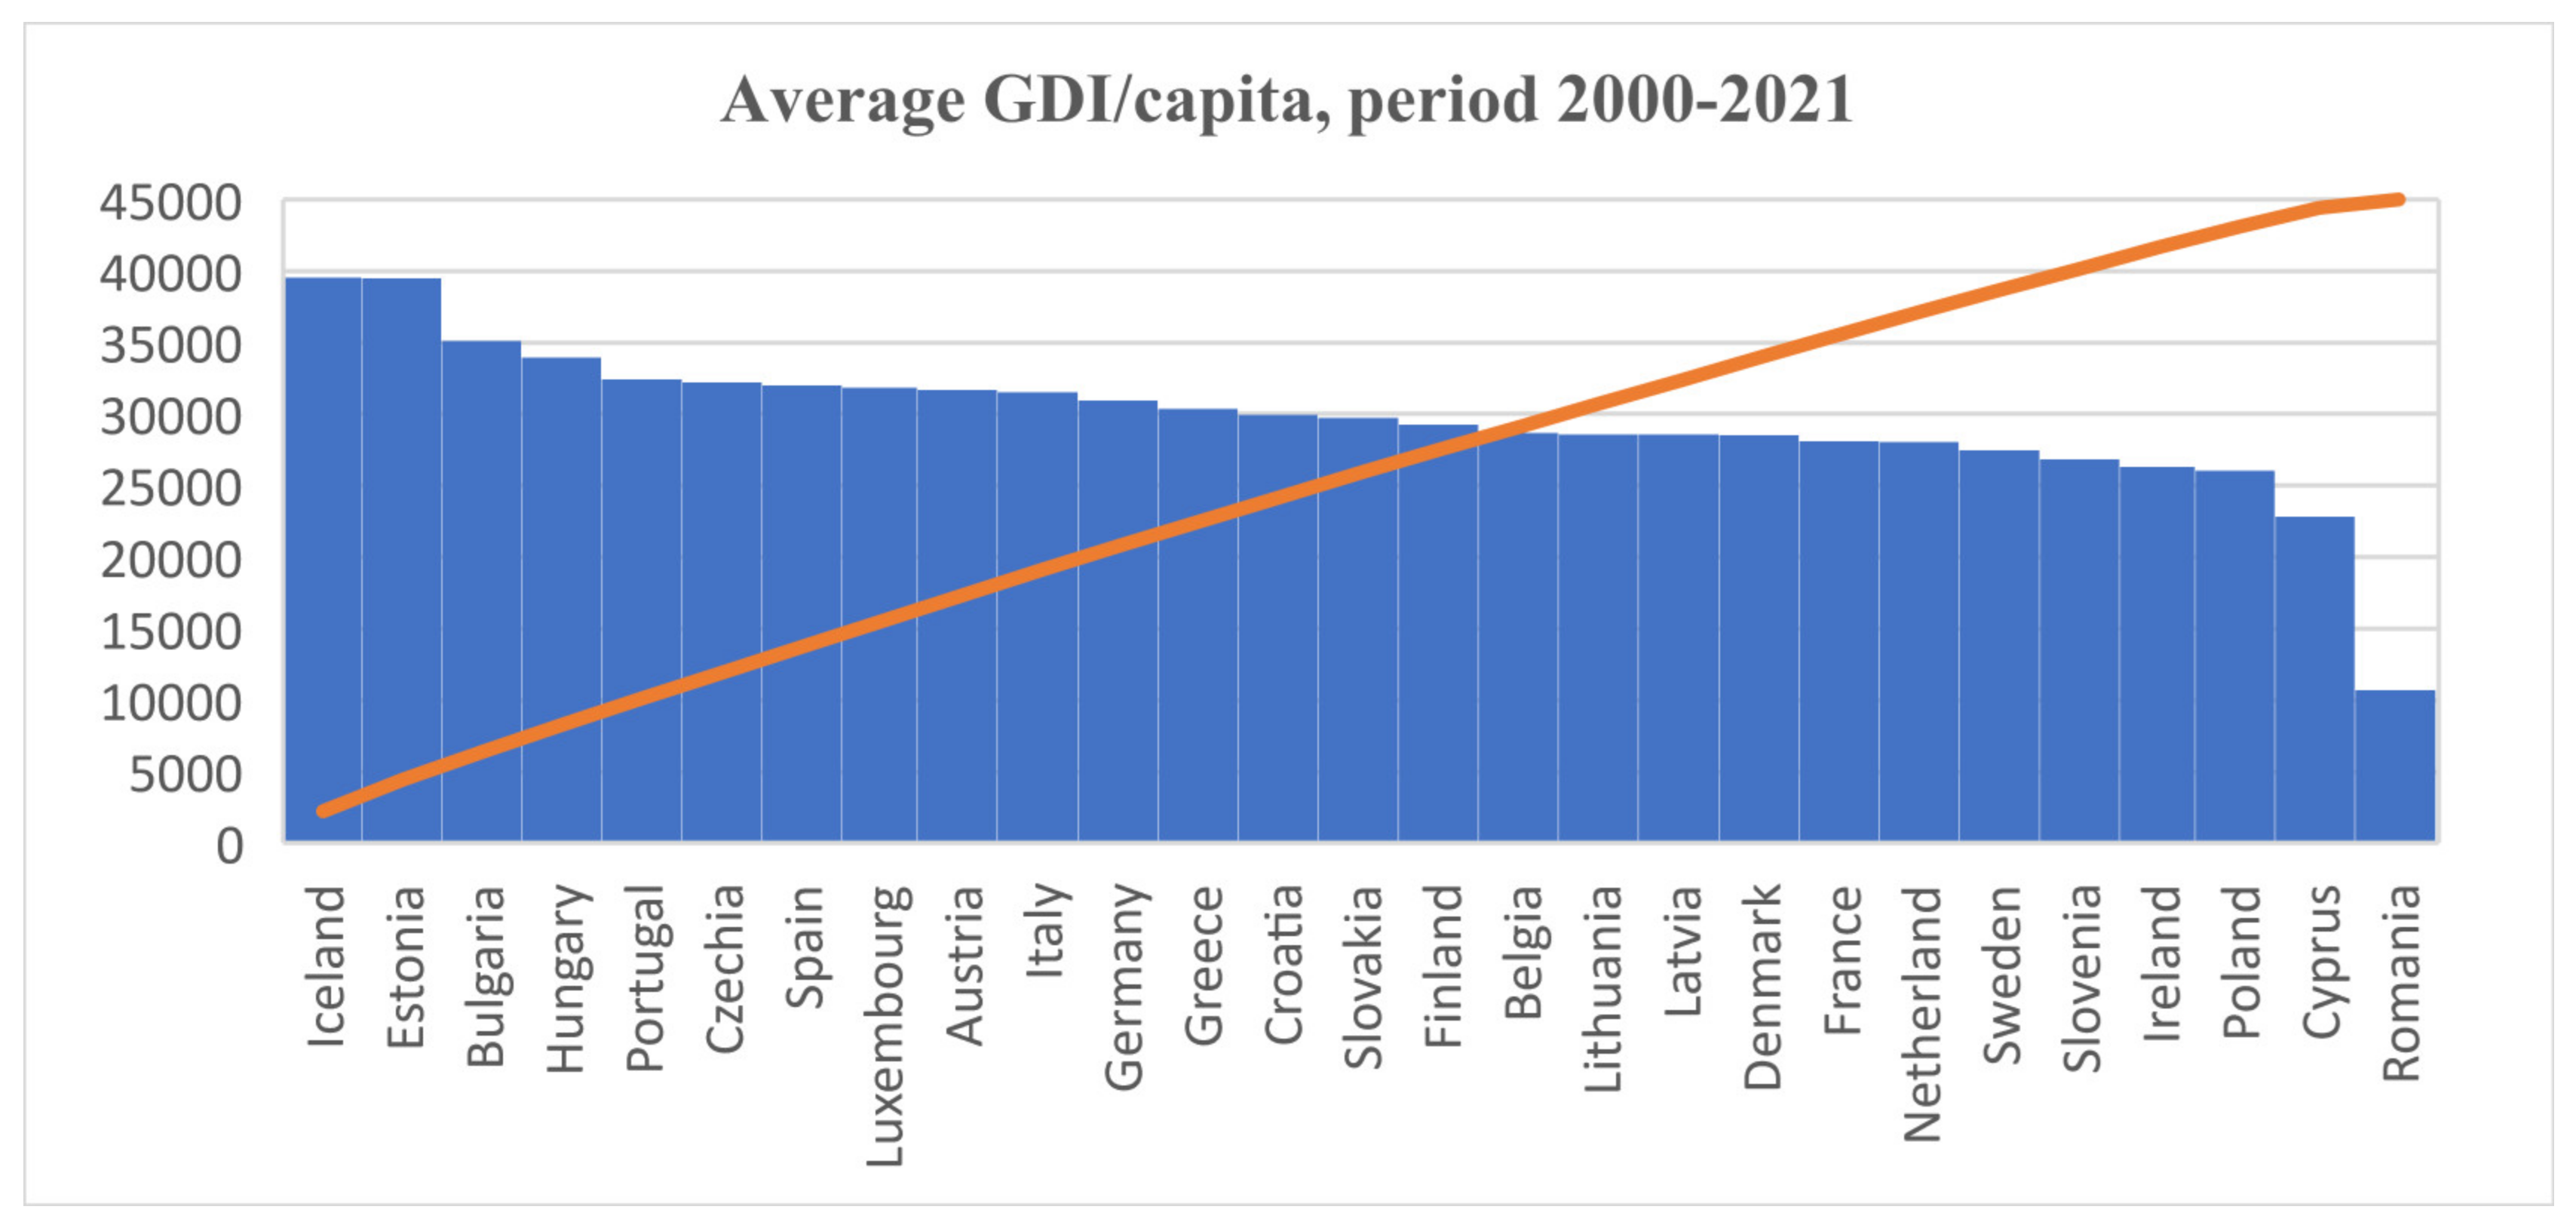
The indicator of adjusted gross disposable income per capita (GDI) reflects “the purchasing power of households and their ability to purchase goods and services or to save after the deduction of taxes and social contributions” [59]. Compared with 2006, GDI for analyzed countries increased by 8.26% in 2021. The lowest value of the GDI was recorded in Germany in 2000 at 10,959 EUR/capita, and the highest value was reached in 2008 in Estonia at 86,296.51. As shown in Figure 8, Iceland and Estonia have the greatest adjusted gross disposable income per capita, with GDI values above 39,000 EUR/capita.
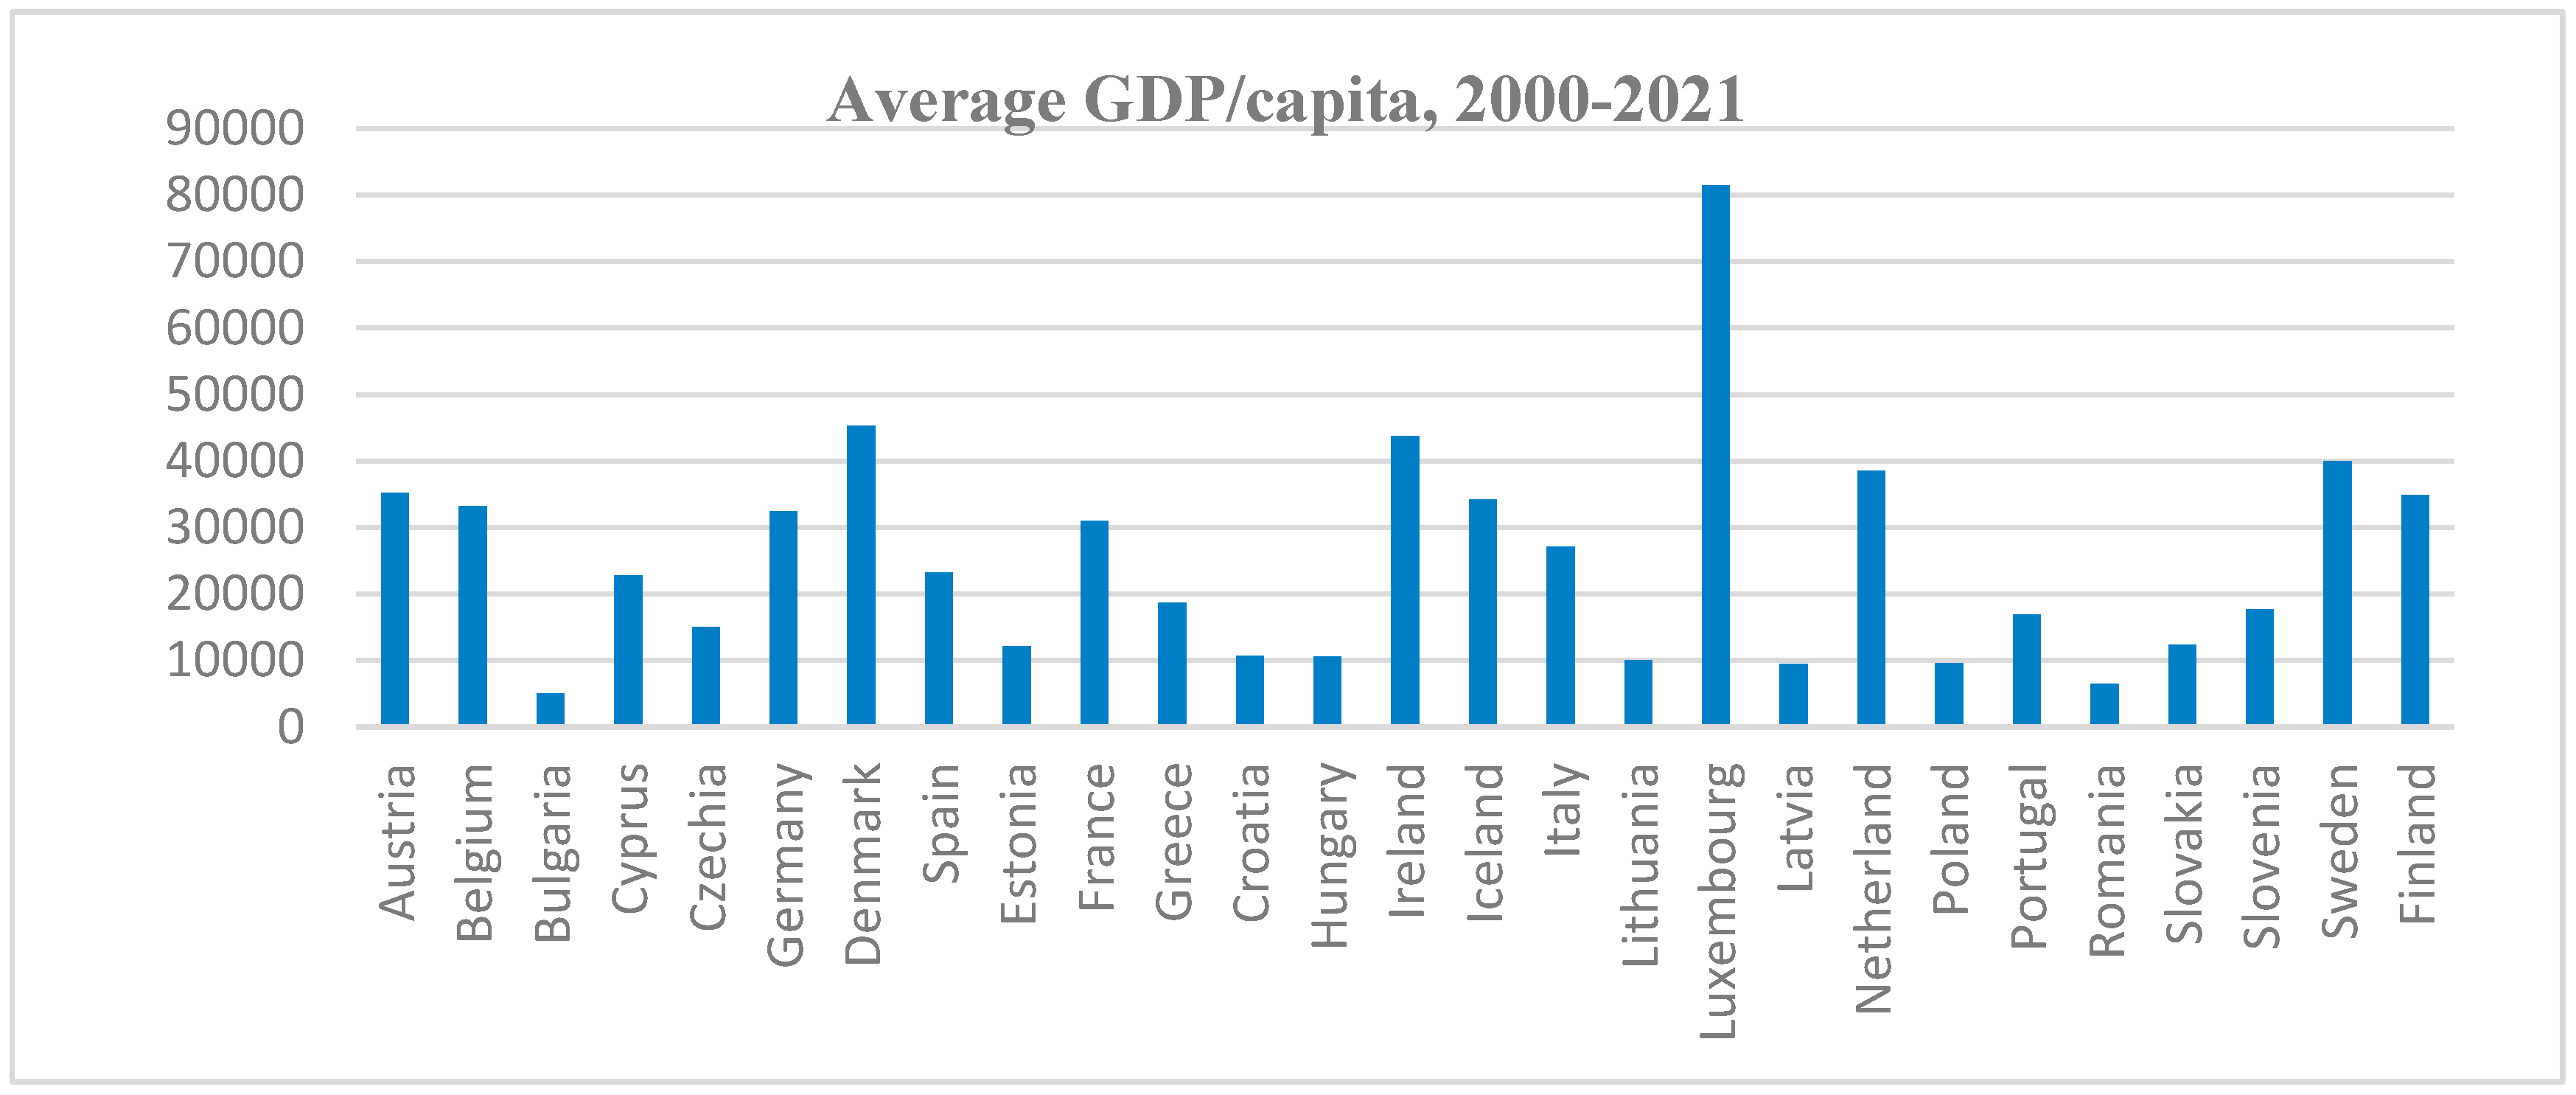
As shown in Figure 9, the highest values of GDP/inhabitant, over 35,000 EUR/inhabitant, were recorded in Luxembourg, Austria, Ireland, Denmark, and Sweden. Moreover, the lowest values of GDP/average inhabitant, under 10,000 EUR/inhabitant, were registered in Bulgaria, Romania, Poland, and Latvia.
From 2013, the GDP per capita at the level of the analyzed countries constantly increased to 27,104 EUR/capita in 2019, when it suffered a sudden decrease, with the COVID-19 pandemic having a significant effect. The minimum value of GDP/capita was recorded in Bulgaria in 2012 at 5390 million EUR/capita, and the maximum value was reached in 2007 in Luxembourg at 88,120 EUR/capita.

3.2. Methodology

The first stage consisted of testing the stationarity of the time-series-related variables used. The stationarity test for the variables was conducted using the Dickey–Fuller unit root tests for the CO2 levels, adjusted gross disposable income, GDP, energy use, median age, and GINI. The results indicate there is no stationarity in the dependent variable (CO2 emissions), as shown in Table 3. However, there is stationarity in the lagged CO2 emissions values, as shown in Table 3.
According to Table 3, all the p-values for the CO2 emissions are above 0.05, indicating no stationarity, since the panel contains unit roots. Instead, there is stationarity in the lagged CO2 since the p-values are all below 0.000. This satisfies the assumption that there is stationarity in the lagged model used in the panel dynamic regression.
The outcome of the stationarity test indicates there is no stationarity in CO2 since the p-values are greater than the critical value of 0.05. The properties of CO2 have changed over time in the European countries. A further stationarity test was conducted for lagged CO2 to determine whether there is stationarity in the lagged value. The outcome still showed there is no stationarity in the CO2 panel dynamic data over the period, since the p-values are higher than the critical value of 0.05.
The results from Table 3 indicate there is no stationarity in GDP/capita and in median age; since the p-values are higher than the critical value of 0.05, they are assumed to contain unit roots; this indicates that the properties of GDP/capita and median age have changed over time in the European countries. The outcome indicates there is stationarity in the GDI/capita, energy consumption/capita, and GINI over the test period, since the p-value is 0.00, which is lower than the critical value of 0.005.
The stationarity test for adjusted GDI, GINI, and energy consumption/capita indicates that there is stationarity in these variables, since the p-values are less than the critical value of 0.005. There are no unit roots in these variables.
To test the autocorrelation in the residuals, the regression of the residuals and the lagged residuals is calculated. The dependent variable is the residuals, while the lagged values of the residuals are the independent variables. The first lagged term is used for the autocorrelation analysis in the residuals. The number of observations is 567; this is a decrease in degrees of freedom by 27, or a decrease in observations by the number of countries in the residual’s calculation.
According to Table 4, the outcome indicates there is autocorrelation in the error terms since the p-value is lower than 0.05 at a 95% confidence interval; this is not good for the ordinary linear regression model. One of the assumptions for panel dynamic data ordinary least squares regression is that there is no autocorrelation in the data; this assumption is violated. Therefore, the ordinary least squares regression outcome cannot be used to make inferences about how CO2 is affected by the independent variables.
The panel data analysis checks the influence of the independent variables on the changes in carbon emissions over time. Since there is autocorrelation in the residual error terms, the Arellano–Bond estimator is used in the dynamic panel data correlation [60,61].
The Arellano and Bond test [62], using the generalized method of moments (GMM), is designed to diagnose the presence of serial correlation in differenced data. The test also applied by us in this study is based on the hypothesis that if the residuals of the first difference show serial correlation AR (1)/AR (2), this indicates that the basic levels of the variables in the model may also show serial correlation [63].
Consider the formulation of the dynamic panel model below [64,65]:
C O 2 E i t = γ i + γ 1 L 1 C O 2 + γ 2 G D I i t + γ 3 G D P i t + γ 4 E C i t + γ 5 M A i t + γ 6 G I N I i t + ε i t
where
C O 2 E   =   c a r b o n   d i o x i d e   e m i s s i o n s   i n   m e t r i c   t o n n e s   p e r   c a p i t a L 1 C O 2   =   l a g g e d   v a l u e   o f   C O 2 γ i   =   t h e   c o n s t a n t   c o e f f i c i e n t γ 1 , γ 2 , γ 3 , γ 4 , γ 5 , γ 6   =   b e t a   c o e f f i c i e n t s   f o r   t h e   i n d e p e n d e n t   v a r i a b l e s G D I   =   g r o s s   d i s p e n s a b l e   i n c o m e / c a p i t a G D P   =   g r o s s   d o m e s t i c   p r o d u c t p r o d u c t e   i n t e r i o r   b r u t / c a p i t a E C   =   e n e r g y   c o n s u m p t i o n   p e r   c a p i t a M A = m e d i a n   a g e GINI   =   economic   inequality   in   the   population i = t h e   n u m b e r   o f   c o u n t r i e s = 27 t = t h e   t i m e   a n a l y s i s ε i t = t h e   e r r o r   t e r m   i n   t h e   e q u a t i o n   f o r   t h e   c o u n t r i e s   o v e r   t h e   y e a r s

4. Results and Discussion

The dynamic panel data analysis indicates the dynamic changes in carbon emissions as positive; hence, the carbon emissions have increased over the years. An increase in the adjusted gross disposable income increases the carbon emissions over time; an increase in energy consumption per capita increases the carbon emissions; an increase in the gross domestic product decreases the carbon emissions; and the median age has an inverse relation with the carbon emissions; i.e., the lower the median age, the higher the carbon emission. Likewise, the lower the economic inequality, the higher the carbon emissions. The results are presented in Table 5:
The dynamic panel model is represented below:
C O 2 E i t = γ i + γ 1 L 1 C O 2 + γ 2 G D I i t + γ 3 G D P i t + γ 4 E C i t + γ 5 M A i t + γ 6 G I N I i t + ε i t C O 2 E = 4.70449 + 0.921 L 1 C O 2 E + 0.000003 G D I 0.00006 G D P + 0.0000005 E C 0.0677 M A 0.0088 G I N I
The robustness test is conducted to eliminate the effects of autocorrelation in the panel data [66]. The outcome is compared to the Arellano–Bond estimator conducted in the previous section:
The results are almost similar for the Arellano–Bond regression and the robustness regression tests. The standard errors and the robust standard errors are almost similar; hence, it affirms the findings of the panel data regression. The beta coefficients of regression are the same and the significance tests arrive at the same conclusion for all the variables. Therefore, the robustness test confirms the results of the dynamic panel data regression.
The dynamic change in carbon emissions has a direct proportionality to the carbon emissions. A 1% dynamic change in the emissions increases the carbon emissions by 0.92%. The p-value is 0.00, lower than 0.05, leading to the conclusion that the dynamic change in carbon emissions significantly impacts the carbon emissions. The tests were conducted at a 95% confidence interval; hence, the alpha value for the test is 5% (0.05).
The adjusted gross disposable income increases the carbon emissions in the European countries. The p-value is 0.224, which is higher than 0.05; this means that the adjusted gross disposable income has no significant effect on the carbon emission at a 95% confidence interval.
The GDP/capita increase produces an inversely proportional decrease in the carbon emissions/capita. A 1% increase in GDP produced a 0.006% decrease in carbon emissions in Europe. The p-value is 0.000; mean GDP has a significant effect on the carbon emissions in Europe at a 95% confidence interval. Our result is similar to that obtained in other studies [46,67,68,69].
Energy use (consumption) has a directly proportional impact on the carbon emissions in Europe. The p-value is 0.434, which is higher than the alpha value at 0.05; this indicates that energy consumption has no significant effect on carbon emissions in Europe.
The median age of the population has a negative correlation with the carbon emissions in Europe. A 1% increase in the median age leads to a 6.77% decrease in carbon emissions in Europe. The smaller the median age of the country’s population, the higher the carbon emissions. The p-value is 0.007, which is lower than the alpha value of 0.05; this indicates that median age has a significant impact on the carbon emissions at a 95% confidence interval. This finding agrees with the results obtained by other authors [70,71].
The economic inequality (GINI) in the population is inversely proportional to the carbon emissions in Europe. The p-value is 0.634, which is higher than the alpha value of 0.05, leading to the conclusion that GINI does not significantly impact the carbon emissions in Europe at a 95% confidence interval.
Based on the results obtained from the estimation and validation of the robustness of the two dynamic regressions, the research hypotheses H2 and H3 are confirmed. Thus, the change in GDP/capita level significantly and negatively influences carbon emissions. Similarly, median age has an inversely proportional impact on carbon emissions in Europe, so the older the generation, the lower the carbon emissions.
Research hypotheses H1 and H4 are not confirmed. Following the dynamic panel analysis, we found that energy consumption, adjusted gross dispensable income per capita, and economic inequality do not significantly impact on CO2 emissions (p value > 0.05). However, the dynamic regression showed a direct positive correlation between GDI/capita and CO2 emissions and between energy consumed/inhabitant and CO2 emissions, and a negative correlation between GINI and CO2 emissions; these correlations are not statistically significant.

5. Conclusions

In this article, we analyzed the correlation between carbon emissions/capita in 27 European countries: the adjusted gross dispensable income (GDI) per capita, the gross domestic product (GDP), the energy consumption per capita, the median age, and economic inequality in the population (GINI).
The valid results of the dynamic regression indicate a significant and negative correlation between CO2 emissions/capita and median age, and GDP/capita. The GDP/capita increase produces an inversely proportional decrease in the carbon emissions/capita. A 1% increase in GDP/capita produced a 0.006% decrease in carbon emissions in Europe. A 1% increase in the median age of the population leads to a 6.77% decrease in carbon emissions in Europe. The younger the population, the higher the carbon emissions.
On the other hand, our research also revealed some non-significant correlations. The adjusted gross disposable income/capita, the energy consumption/capita, and economic inequality do not significantly influence CO2 emissions/capita in the European countries we analyzed. Although the regression analysis showed a direct positive correlation between GDI/capita and CO2 emissions, and between energy consumed/inhabitant and CO2 emissions, these correlations are not statistically significant because p > 0.05.
This research is helpful in the academic environment for scientific research but can also be applied in university curricula by raising students’ awareness of their role in protecting the planet and reducing carbon emissions. This research is also helpful for governments in determining appropriate measures to reduce CO2 emissions and in informing public policies. Ensuring a balance between economic growth and environmental sustainability is crucial to reduce the impact of CO2 emissions and ensure sustainable economic development for future generations.
Whilst being aware of the limitations of this research—the limited number of variables that can influence CO2 emissions and the limited geographical space of the European Union member countries—we believe that this study can be deepened and improved, either by examining a more significant number of countries, by extending the analysis over a longer period, or by including other variables influencing carbon emissions.

Author Contributions

Conceptualization, C.D.S.-P. and A.F.; data curation, D.C.P. and A.F.; formal analysis, D.C.P. and L.R.; investigation, C.D.S.-P., L.R. and H.W.J.; methodology, C.D.S.-P., D.C.P. and L.R.; project administration, C.D.S.-P., D.C.P. and A.F.; software, H.W.J.; supervision, C.D.S.-P. and D.C.P.; validation, H.W.J. and D.C.P.; visualization, A.F. and L.R.; writing—original draft, C.D.S.-P., A.F., D.C.P. and L.R.; writing—review and editing, C.D.S.-P. and L.R. All authors have read and agreed to the published version of the manuscript.

Funding

The publication fee for this article is supported by the scientific research budget of the University of Oradea.

Institutional Review Board Statement

Not applicable.

Informed Consent Statement

Not applicable.

Data Availability Statement

The original contributions presented in the study are included in the article; further inquiries can be directed to the corresponding author.

Conflicts of Interest

The authors declare no conflicts of interest.

References

  1. Hardt, L.; O’Neill, D.W. Ecological Macroeconomic Models: Assessing Current Developments. Ecol. Econ. 2017, 134, 198–211. [Google Scholar] [CrossRef]
  2. Shahbaz, M.; Raghutla, C.; Chittedi, K.R.; Jiao, Z.; Vo, X.V. The effect of renewable energy consumption on economic growth: Evidence from the renewable energy country attractive index. Energy 2020, 207, 118162. [Google Scholar] [CrossRef]
  3. Karaaslan, A.; Çamkaya, S. The relationship between CO2 emissions, economic growth, health expenditure, and renewable and non-renewable energy consumption: Empirical evidence from Turkey. Renew. Energy 2022, 190, 457–466. [Google Scholar] [CrossRef]
  4. Mirziyoyeva, Z.; Salahodjaev, R. Renewable energy, GDP and CO2 emissions in high-globalized countries. Front. Energy Res. 2023, 11, 1123269. [Google Scholar] [CrossRef]
  5. Khan, H.; Weili, L.; Khan, I.; Han, L. The effect of income inequality and energy consumption on environmental degradation: The role of institutions and financial development in 180 countries of the world. Environ. Sci. Pollut. Res. 2022, 29, 20632–20649. [Google Scholar] [CrossRef]
  6. Guo, H.; Jiang, J.; Li, Y.; Long, X.; Han, J. An aging giant at the center of global warming: Population dynamics and its effect on CO2 emissions in China. J. Environ. Manag. 2023, 327, 116906. [Google Scholar] [CrossRef]
  7. Yuan, X.; Su, C.-W.; Umar, M.; Shao, X.; Lobonţ, O.-R. The race to zero emissions: Can renewable energy be the path to carbon neutrality? J. Environ. Manag. 2022, 308, 114648. [Google Scholar] [CrossRef]
  8. Zhang, S.; Li, J.; Jiang, B.; Guo, T. Government Intervention, Structural Transformation, and Carbon Emissions: Evidence from China. Int. J. Environ. Res. Public Health 2023, 20, 1343. [Google Scholar] [CrossRef]
  9. Dinda, S. Environmental Kuznets Curve Hypothesis: A Survey. Ecol. Econ. 2004, 49, 431–455. [Google Scholar] [CrossRef]
  10. Azam, M.; Khan, A.Q. Testing the Environmental Kuznets Curve hypothesis: A comparative empirical study for low, lower middle, upper middle and high income countries. Renew. Sustain. Energy Rev. 2016, 63, 556–567. [Google Scholar] [CrossRef]
  11. Stern, D.I. The Rise and Fall of the Environmental Kuznets Curve. World Dev. 2004, 32, 1419–1439. [Google Scholar] [CrossRef]
  12. Menz, T.; Welsch, H. Population aging and carbon emissions in OECD countries: Accounting for life-cycle and cohort effects. Energy Econ. 2012, 34, 1464–1473. [Google Scholar] [CrossRef]
  13. Yang, X.; Li, N.; Mu, H.; Pang, J.; Zhao, H.; Ahmad, M. Study on the long-term impact of economic globalization and population aging on CO2 emissions in OECD countries. Sci. Total Environ. 2021, 787, 147625. [Google Scholar] [CrossRef] [PubMed]
  14. Hassan, K.; Salim, R. Population ageing, income growth and CO2 emission. J. Econ. Stud. 2015, 42, 54–67. [Google Scholar] [CrossRef]
  15. Hondroyiannis, G.; Papapetrou, E.; Tsalaporta, P. The effect of population aging on environmental degradation: New evidence and insights. J. Econ. Stud. 2023, 5, 471–484. [Google Scholar] [CrossRef]
  16. Yu, Y.; Deng, Y.; Chen, F. Impact of population aging and industrial structure on CO 2 emissions and emissions trend prediction in China. Atmos. Pollut. Res. 2018, 9, 446–454. [Google Scholar] [CrossRef]
  17. Cao, P.; Liu, Z. The impact of population characteristics on transportation CO2 emissions—Does population aging important? Environ. Sci. Pollut. Res. 2024, 31, 10148–10167. [Google Scholar] [CrossRef]
  18. Okada, A. Is an increased elderly population related to decreased CO2 emissions from road transportation? Energy Policy 2012, 45, 286–292. [Google Scholar] [CrossRef]
  19. Liddle, B. Impact of population, age structure, and urbanization on carbon emissions/energy consumption: Evidence from macro-level, cross-country analyses. Popul. Environ. 2014, 35, 286–304. [Google Scholar] [CrossRef]
  20. Carella, V.; Monachesi, P. Greener through Grey? Boosting Sustainable Development through a Philosophical and Social Media Analyses of Ageing. Sustainability 2018, 10, 499. [Google Scholar] [CrossRef]
  21. Meidutė-Kavaliauskienė, I.; Dudzevičiūtė, G.; Maknickienė, N.; Vasilis Vasiliauskas, A. The relation between aging of population and sustainable development of EU countries. Entrep. Sustain. 2020, 7, 2026–2042. [Google Scholar] [CrossRef]
  22. Han, J.; Chan, E.H.W.; Qian, Q.K.; Yung, E.H.K. Achieving sustainable Urban Development with an Aging Population: An “Age-Friendly City and Community” Approach. Sustainability 2021, 13, 8614. [Google Scholar] [CrossRef]
  23. Xu, Y. New concept of aging care architecture landscape design based on sustainable development. AIP Conf. Proc. 2017, 1839, 020126. [Google Scholar] [CrossRef]
  24. Gietel, B.S. Adopting an adaptation-mitigation-resilience framework to ageing. Age Ageing 2021, 50, 693–696. [Google Scholar] [CrossRef] [PubMed]
  25. Tiraphat, S.; Kasemsup, V.; Buntup, D.; Munisamy, M.; Nguyen, T.H.; Hpone Myint, A. Active Aging in ASEAN Countries: Influences from Age-Friendly Environments, Lifestyles, and Socio-Demographic Factors. Int. J. Environ. Res. Public Health 2021, 18, 8290. [Google Scholar] [CrossRef]
  26. Syed, Q.R.; Rahut, D.B. Aging and carbon emissions in Asian economies: Policy recommendation from panel quantile regression. Geol. J. 2023, 59, 538–549. [Google Scholar] [CrossRef]
  27. Ameer, F.; Khan, N.R. Manager’s Age, Sustainable Development Orientation and Sustainable Performance: A Conceptual Outlook. Sustainability 2020, 12, 3196. [Google Scholar] [CrossRef]
  28. Sabău-Popa, C.D.; Bele, A.M.; Bucurean, M.; Mociar-Coroiu, S.I.; Tarcă, N.N. A Panel Analysis Regarding the Influence of Sustainable Development Indicators on Green Taxes. Sustainability 2024, 16, 4072. [Google Scholar] [CrossRef]
  29. Bibliometrix. Home. Available online: https://www.bibliometrix.org/home/ (accessed on 26 August 2024).
  30. Urbanicikova, N.; Zgodavova, K. Sustainability, Resilience and Population Ageing along Schengens’s Easter Border. Sustainability 2019, 11, 2898. [Google Scholar] [CrossRef]
  31. Cecchini, M.; Cividino, S.; Turco, R.; Salvati, L. Population age structure, complex socio-demographic systems and resilience potential: A spatio-temporal, evenness-based approach. Sustainability 2019, 11, 2050. [Google Scholar] [CrossRef]
  32. Cai, C.; Qiu, R.; Tu, Y. Pulling Off Stable Economic System Adhering Carbon Emissions, Urban Development and Sustainable Development Values. Front. Public Health 2022, 10, 84656. [Google Scholar] [CrossRef]
  33. Terjanika, V.; Pubule, J. Barriers and driving factoris for sustainable development of CO2 Valorisation. Sustainability 2022, 14, 5054. [Google Scholar] [CrossRef]
  34. Yumashev, A.; Ślusarczyk, B.; Kondrashev, S.; Mikhaylov, A. Global Indicators of Sustainable Development: Evaluation of the Influence of the Human Development Index on Consumption and Quality of Energy. Energies 2020, 13, 2768. [Google Scholar] [CrossRef]
  35. Razmjoo, A.; Gakenia, K.L.; Vaziri Rad, M.A.; Marzband, M.; Davarpanah, A.; Denai, M. A Technical analysis investigating energy sustainability utilizing reliable renewable energy sources to reduce CO2 emissions in a high potential area. Renew. Energy 2021, 164, 46–57. [Google Scholar] [CrossRef]
  36. Su, C.-W.; Xie, Y.; Shahab, S.; Faisal, C.M.N.; Hafeez, M.; Qamri, G.M. Towards Achieving Sustainable Development: Role of Technology Innovation, Technology Adoption and CO2 Emission for BRICS. Int. J. Environ. Res. Public Health 2021, 18, 277. [Google Scholar] [CrossRef]
  37. Kang, M.; Zhao, W.; Jia, L.; Liu, Y. Balancing Carbon Emission Reductions and Social Economic Development for Sustainable Development: Experience from 24 Countries. Chin. Geogr. Sci. 2020, 30, 379–396. [Google Scholar] [CrossRef]
  38. Rehman, A.; Ma, H.; Ozturk, I.; Murshed, M.; Dagar, V. The dynamic impacts of CO2 emissions from different sources on Pakistan’s economic progress: A roadmap to sustainable development. Environ. Dev. Sustain. 2021, 23, 17857–17880. [Google Scholar] [CrossRef]
  39. Azam, A.; Rafiq, M.; Shafique, M.; Yuan, J. An empirical analysis of the non-linear effects of natural gas, nuclear energy, renewable energy and ICT-Trade in leading CO2 emitter countries: Policy towards CO2 mitigation and economic sustainability. J. Environ. Manag. 2021, 286, 112232. [Google Scholar] [CrossRef]
  40. Weimin, Z.; Chishti, M.Z.; Rehman, A.; Ahmad, M. A pathway toward future sustainability: Assessing the influence of innovation shocks on CO2 emissions in developing economies. Environ. Dev. Sustain. 2022, 24, 4786–4809. [Google Scholar] [CrossRef]
  41. Tawaiah, V.; Zakari, A.; Adedoyin, F.F. Determinants of green growth in developed and developing countries. Environ. Sci. Pollut. Res. 2021, 28, 39227–39242. [Google Scholar] [CrossRef]
  42. Menyah, K.; Wolde-Rufael, Y. CO2 emissions, nuclear energy, renewable energy and economic growth in the US. Energy Policy 2010, 38, 2911–2915. [Google Scholar] [CrossRef]
  43. Salari, M.; Javid, R.J.; Noghanibehambari, H. The nexus between CO2 emissions, energy consumption, and economic growth in the U.S. Econ. Anal. Policy 2021, 69, 182–194. [Google Scholar] [CrossRef]
  44. Al-Mulali, U. Investigating the impact of nuclear energy consumption on GDP growth and CO2 emission: A panel data analysis. Prog. Nucl. Energy 2014, 73, 172–178. [Google Scholar] [CrossRef]
  45. Belaïd, F.; Zrelli, M.H. Renewable and non-renewable electricity consumption, environmental degradation and economic development: Evidence from Mediterranean countries. Energy Policy 2019, 133, 110929. [Google Scholar] [CrossRef]
  46. Wang, Q.; Li, L. The effects of population aging, life expectancy, unemployment rate, population density, per capita GDP, urbanization on per capita carbon emissions. Sustain. Prod. Consum. 2021, 28, 760–774. [Google Scholar] [CrossRef]
  47. Wang, Q.; Yang, T.; Li, R.; Wang, L. Population aging redefines the economic growth-carbon emissions nexus, energy consumption-carbon emissions nexus—Evidence from 36 OECD countries. Energy Environ. 2023, 34, 946–970. [Google Scholar] [CrossRef]
  48. Huang, Y.; Kuldasheva, Z.; Salahodjaev, R. Renewable energy and CO2 emissions: Empirical evidence from major energy-consuming countries. Energies 2021, 14, 7504. [Google Scholar] [CrossRef]
  49. Liu, X.; Yuan, X. Novel research methods for energy use, carbon emissions, and economic growth: Evidence from the USA. Econ. Res. Ekon. Istraživanja 2023, 36, 1735–1750. [Google Scholar] [CrossRef]
  50. Arminen, H.; Menegaki, A.N. Corruption, climate and the energy-environment-growth nexus. Energy Econ. 2019, 80, 621–634. [Google Scholar] [CrossRef]
  51. Fan, J.; Zhou, L.; Zhang, Y.; Shao, S.; Ma, M. How does population aging affect household carbon emissions? Evidence from Chinese urban and rural areas. Energy Econ. 2021, 100, 105356. [Google Scholar] [CrossRef]
  52. Hashmi, R.; Alam, K. Dynamic relationship among environmental regulation, innovation, CO2 emissions, population, and economic growth in OECD countries: A panel investigation. J. Clean. Prod. 2019, 231, 100–1109. [Google Scholar] [CrossRef]
  53. Abid, M. Impact of economic, financial, and institutional factors on CO2 emissions: Evidence from Sub-Saharan Africa economies. Util. Policy 2016, 41, 85–94. [Google Scholar] [CrossRef]
  54. Kang, H. Impacts of Income Inequality and Economic Growth on CO2 Emissions: Comparing the Gini Coefficient and the Top Income Share in OECD Countries. Energies 2022, 15, 6954. [Google Scholar] [CrossRef]
  55. Atici, C. Carbon emissions in Central and Eastern Europe: Environmental Kuznets curve and implications for sustainable development. Sustain. Dev. 2009, 17, 155–160. [Google Scholar] [CrossRef]
  56. Tutak, M.; Brodny, J. Renewable energy consumption in economic sectors in the EU-27. The impact on economics, environment and conventional energy sources. A 20-year perspective. J. Clean. Prod. 2022, 345, 131076. [Google Scholar] [CrossRef]
  57. Saidi, K.; Omri, A. The impact of renewable energy on carbon emissions and economic growth in 15 major renewable energy-consuming countries. Environ. Res. 2020, 186, 109567. [Google Scholar] [CrossRef]
  58. Eurostat. Available online: https://ec.europa.eu/eurostat/web/sdi/database (accessed on 2 May 2024).
  59. Data Base World Bank. Available online: https://databank.worldbank.org/metadataglossary/world-development-indicators/series/SI.POV.GINI (accessed on 2 May 2024).
  60. Regis, M.; Serra, P.; Van den Heuvel, E.R. Random autoregressive models: A structured overview. Econom. Rev. 2022, 41, 207–230. [Google Scholar] [CrossRef]
  61. Dragoş, S.L.; Mare, C.; Dragoş, C.M. Institutional drivers of life insurance consumption: A dynamic panel approach for European countries. Geneva Pap. Risk Insur. Issues Pract. 2019, 44, 36–66. [Google Scholar] [CrossRef]
  62. Arellano, M.; Bond, S. Some tests of specification for panel data: Monte Carlo evidence and an application to employment equations. Rev. Econ. Stud. 1991, 58, 277–297. [Google Scholar] [CrossRef]
  63. Sabău-Popa, C.D.; Bele, A.M.; Negrea, A.; Coita, D.C.; Giurgiu, A. Do Energy Consumption and CO2 Emissions Significantly Influence Green Tax Levels in European Countries? Energies 2024, 17, 2186. [Google Scholar] [CrossRef]
  64. González, R.M.; Marrero, G.A.; Rodríguez-López, J.; Marrero, Á.S. Analyzing CO2 emissions from passenger cars in Europe: A dynamic panel data approach. Energy Policy 2019, 129, 1271–1281. [Google Scholar] [CrossRef]
  65. Lv, Z.; Xu, T. Trade openness, urbanization and CO2 emissions: Dynamic panel data analysis of middle-income countries. J. Int. Trade Econ. Dev. 2019, 28, 317–330. [Google Scholar] [CrossRef]
  66. Flannery, M.J.; Hankins, K.W. Estimating dynamic panel models in corporate finance. J. Corp. Financ. 2013, 19, 1–19. [Google Scholar] [CrossRef]
  67. Chang, H.-W.; Chang, T.; Xiang, F.; Mikhaylov, A.; Grigorescu, A. Revisiting R&D intensity and CO2 emissions link in the USA using time varying granger causality test: 1870∼2020. Heliyon 2023, 9, e20319. [Google Scholar] [CrossRef] [PubMed]
  68. Begum, R.A.; Sohag, K.; Abdullah, S.M.S.; Jaafar, M. CO2 emissions, energy consumption, economic and population growth in Malaysia. Renew. Sustain. Energy Rev. 2015, 41, 594–601. [Google Scholar] [CrossRef]
  69. Wang, M.L.; Wang, W.; Du, S.Y.; Li, C.F.; He, Z. Causal relationships between carbon dioxide emissions and economic factors: Evidence from China. Sustain. Dev. 2020, 28, 73–82. [Google Scholar] [CrossRef]
  70. Ottelin, J.; Heinonen, J.; Nässén, J.; Junnila, S. Household carbon footprint patterns by the degree of urbanisation in Europe. Environ. Res. Lett. 2019, 14, 114016. [Google Scholar] [CrossRef]
  71. Charlier, D.; Legendre, B. Carbon Dioxide Emissions and Aging: Disentangling Behavior from Energy Efficiency. Ann. Econ. Stat. 2021, 143, 71–103. [Google Scholar] [CrossRef]
Figure 1. Keywords correlation map. Source: Authors’ projection of information from Web of Science database with VOS viewer, version 1.6.20.
Sustainability 16 07791 g001
Figure 2. The most relevant authors who publishes on the topic “CO2 emissions” and “population age”. Source: Authors’ projection from Web of Science database with Bibliometrix R-tool 4.3.0.
Sustainability 16 07791 g002
Figure 3. Trend of interest in research topics on CO2 emissions, age, and pollution. Source: Authors’ projection from Web of Science database with Bibliometrix R-tool 4.3.0.
Sustainability 16 07791 g003
Figure 4. CO2 emissions/capita for the years 2000–2021 (tones). Source: own computation.
Sustainability 16 07791 g004aSustainability 16 07791 g004b
Figure 5. Primary energy consumption for the years 2012–2021 (kwh/person). Source: own computation.
Sustainability 16 07791 g005aSustainability 16 07791 g005b
Figure 6. The average value of the GINI, period 2000–2021. Source: own computation.
Sustainability 16 07791 g006
Figure 7. The average value of the median age in European countries, period 2000–2021. Source: own computation.
Sustainability 16 07791 g007
Figure 8. The average value of the adjusted gross disposable income per capita, period 2000–2021. Source: own computation.
Sustainability 16 07791 g008
Figure 9. The average value of GDP per capita, period 2000–2021. Source: own computation.
Sustainability 16 07791 g009
Table 1. Identified relationships and methods used in the literature for polluting factors.
AuthorsRelationships Identified and AnalyzedMethod UsedConclusions
Wang, Q and Li, L. [46]Impact of population factors on carbon dioxide emissions.STIRPAT (stochastic impacts by regression
on population, affluence, and technology) model
The promoting effect of population urbanization has a significant effect on CO2 emissions.
Inhibitory effect of population aging, density, and life expectancy on CO2 emissions.
Wang, Q., Yang, T., Li, R., and Wang, L. [47]CO2 emissions—explained variable;
GDP/capita, energy consumption—explanatory variables;
population aging—threshold variable; population size, technological innovation level, the degree of urbanization, industrial structure, and energy intensity—control variables.
Panel threshold regression methodPopulation aging is an key factor that affects the relationship between economic growth and CO2 emissions, as well as the significant role of energy consumption and CO2 emissions.
Huang et al. [48]Economic variables (GDP per capita, foreign direct investment, etc.),
CO2 emissions
Fixed-effect regression method and GMM estimatorNegative effect of renewable energy on CO2 emissions.
The predictive power of social
variables and CO2 modeling
Causes of CO2 emissions and
power consumption
Liu and Yuan [49]CO2 emissions
Economic growth (GDP)
Non-renewable energy (EU)
Renewable energy consumption
Quantile regression approach (REC)The carbon impact of GDP and the EU is highest in underdeveloped countries and lowest in industrialized countries.
Arminen and Menegaki [50]Economic growth
Power consumption
CO2 emissions
High- and upper–middle-income countries
Simultaneous equation framework
Environmental Kuznets Curve (EKC) hypothesis
The countries under review base their economic growth on a two-way relationship with energy consumption.
Yuan et al. [7]Energy security (ENS)
Economic policy uncertainty (EPU)
Government ecological expenditure (GEE)
CO2 emissions
Quantile autoregressive distributed lag approach (QARDL)Energy consumption transition through
investing in renewable energy, updating energy technologies, and supporting reform of the energy price system.
Yu et al. [16]Status of demographic structure
Status of industrial structure
Population aging
Per capita wealth
CO2 emissions impact factors
STIRPAT ModelEffects on CO2 emissions:
Positive: population aging, industrial structure, and per capita wealth;
Negative: energy intensity.
Fan et al. [51]Meteorology, biomass, land use, population density and GDP/capita, CO2 emissions impact factorsGeneralized linear model
Genetic algorithm
Community Land Model version 4.5
Global carbon emissions have fallen due to rising GDP per capita. The meteorological factor strongly influences the cases of higher warming.
Hashmi, R. and Alam K. [52]The effects of environmental regulation and innovation on carbon emissions“Stochastic impacts by regression on population, affluence, regulation, and technology”
(STIRPART) and
generalized method of moments (GMM) models
The increase in the ecological patent determines the reduction in carbon emissions, and the increase in fiscal revenues from environmental taxes reduces
carbon emissions for OECD countries.
Abid, M. [53]Economic growth; economic, financial, and institutional development; pollutionordinary least squares (OLS); general method of momentsThe empirical results show that the Environmental Kuznets Curve hypothesis does not hold for Sub-Saharan Africa economies, indicating that there is a linear relationship between CO2 emissions and GDP/capita. At the same time, the results of the study highlight that political stability and control
of corruption negatively influence CO2 emissions. On the contrary, the regulatory quality and law have a positive effect on CO2 emissions.
Source: Synthesis made by the authors.
Table 2. Variable descriptive statistics.
CO2/CapitaAdjusted Gross Disposable Income/CapitaGDP/CapitaEnergy Use/CapitaMedian AgeGINI
Minimum2.3210,959299015,779.9830.422
Maximum25.6186,296.5188,120113,106.1846.841.3
Mean7.3630,309.525,359.6840,559.7839.2231.05
St. Deviation3.5713,035.8417,850.4816,948.292.83.88
Skewness1.910.6271.5511.58−0.389−0.106
Kurtosis5.770.5262.7863.2170.238−0.31
Source: Author’s calculations.
Table 3. Stationarity test for independent variables.
VariablesInverse Chi2p-ValueResult
CO2 emissions/capita46.30620.7623Non-stationary series
lagged CO2 emissions/capita42.72040.8657Non-stationary series
adjusted gross disposable income (GDI)/capita301.4790.00Stationary series
gross domestic product (GDP)/capita49.81850.6363Non-stationary series
energy consumption/capita121.04110.00Stationary series
median age11.14031.00Non-stationary series
economic inequality in the population (GINI)158.22040.00Stationary series
Source: Authors’ calculation with software Stata 16.
Table 4. Outcome of the autocorrelation tests.
Number of obs. = 567
F (1,565) = 7632.53
Prob > F = 0.0000
R-squared = 0.9311
Adj. R-squared = 0.9310
SourceSSDfMS
Model4405.60714405.607
Residual326.1265650.577
Total4731.7335668.360
Residual termsCoef.Std. Err.tp > | t | [95% Conf. Interval].
Residual terms L10.9820.01187.360.0000.961.004
_cons−0.1260.032−3.950.000−0.189−0.063
Source: Authors’ calculation with software Stata 16.
Table 5. Dynamic panel regression model.
Dependent   Variable :   C O 2 E / C a p i t a
Independent VariablesRegression AnalysisRobustness Test
CO2E/capita
L1.
0.92101 *** (0.000)0.92101 *** (0.000)
GDI/capita0.000003 (0.224)0.000003 (0.437)
GDP/capita−0.00006 *** (0.000)−0.00006 *** (0.001)
Energy use/capita0.0000005 (0.434)0.0000005 (0.306)
Median age−0.0677 *** (0.007)−0.0677 ** (0.055)
Gini−0.0088 (0.634)−0.0088 (0.699)
constant4.70449 *** (0.000)4.70449 *** (0.001)
Wald chi2(6)2400.16864.54
Prob > chi20.00000.0000
*** Significant at 1%; ** significant at 5%. Source: Authors’ calculation in Stata 16.
Disclaimer/Publisher’s Note: The statements, opinions and data contained in all publications are solely those of the individual author(s) and contributor(s) and not of MDPI and/or the editor(s). MDPI and/or the editor(s) disclaim responsibility for any injury to people or property resulting from any ideas, methods, instructions or products referred to in the content.