
Is Younger Population Generating Higher CO2 Emissions? A Dynamic Panel Analysis on European Countries
 , , and
Abstract
:1. Introduction
2. Literature Review
2.1. The Relationship between Population Age, CO2 Emissions, and Sustainable Economic Development
2.2. The Causes of CO2 Emissions and Their Connection with Energy Consumption, GDP/Capita, and Income Inequality
3. Materials and Methods
3.1. Analysis of the Data and Variables Used in Dynamic Panel Analysis
3.2. Methodology
4. Results and Discussion
5. Conclusions
Author Contributions
Funding
Institutional Review Board Statement
Informed Consent Statement
Data Availability Statement
Conflicts of Interest
References
- Hardt, L.; O’Neill, D.W. Ecological Macroeconomic Models: Assessing Current Developments. Ecol. Econ. 2017, 134, 198–211. [Google Scholar] [CrossRef]
- Shahbaz, M.; Raghutla, C.; Chittedi, K.R.; Jiao, Z.; Vo, X.V. The effect of renewable energy consumption on economic growth: Evidence from the renewable energy country attractive index. Energy 2020, 207, 118162. [Google Scholar] [CrossRef]
- Karaaslan, A.; Çamkaya, S. The relationship between CO2 emissions, economic growth, health expenditure, and renewable and non-renewable energy consumption: Empirical evidence from Turkey. Renew. Energy 2022, 190, 457–466. [Google Scholar] [CrossRef]
- Mirziyoyeva, Z.; Salahodjaev, R. Renewable energy, GDP and CO2 emissions in high-globalized countries. Front. Energy Res. 2023, 11, 1123269. [Google Scholar] [CrossRef]
- Khan, H.; Weili, L.; Khan, I.; Han, L. The effect of income inequality and energy consumption on environmental degradation: The role of institutions and financial development in 180 countries of the world. Environ. Sci. Pollut. Res. 2022, 29, 20632–20649. [Google Scholar] [CrossRef]
- Guo, H.; Jiang, J.; Li, Y.; Long, X.; Han, J. An aging giant at the center of global warming: Population dynamics and its effect on CO2 emissions in China. J. Environ. Manag. 2023, 327, 116906. [Google Scholar] [CrossRef]
- Yuan, X.; Su, C.-W.; Umar, M.; Shao, X.; Lobonţ, O.-R. The race to zero emissions: Can renewable energy be the path to carbon neutrality? J. Environ. Manag. 2022, 308, 114648. [Google Scholar] [CrossRef]
- Zhang, S.; Li, J.; Jiang, B.; Guo, T. Government Intervention, Structural Transformation, and Carbon Emissions: Evidence from China. Int. J. Environ. Res. Public Health 2023, 20, 1343. [Google Scholar] [CrossRef]
- Dinda, S. Environmental Kuznets Curve Hypothesis: A Survey. Ecol. Econ. 2004, 49, 431–455. [Google Scholar] [CrossRef]
- Azam, M.; Khan, A.Q. Testing the Environmental Kuznets Curve hypothesis: A comparative empirical study for low, lower middle, upper middle and high income countries. Renew. Sustain. Energy Rev. 2016, 63, 556–567. [Google Scholar] [CrossRef]
- Stern, D.I. The Rise and Fall of the Environmental Kuznets Curve. World Dev. 2004, 32, 1419–1439. [Google Scholar] [CrossRef]
- Menz, T.; Welsch, H. Population aging and carbon emissions in OECD countries: Accounting for life-cycle and cohort effects. Energy Econ. 2012, 34, 1464–1473. [Google Scholar] [CrossRef]
- Yang, X.; Li, N.; Mu, H.; Pang, J.; Zhao, H.; Ahmad, M. Study on the long-term impact of economic globalization and population aging on CO2 emissions in OECD countries. Sci. Total Environ. 2021, 787, 147625. [Google Scholar] [CrossRef] [PubMed]
- Hassan, K.; Salim, R. Population ageing, income growth and CO2 emission. J. Econ. Stud. 2015, 42, 54–67. [Google Scholar] [CrossRef]
- Hondroyiannis, G.; Papapetrou, E.; Tsalaporta, P. The effect of population aging on environmental degradation: New evidence and insights. J. Econ. Stud. 2023, 5, 471–484. [Google Scholar] [CrossRef]
- Yu, Y.; Deng, Y.; Chen, F. Impact of population aging and industrial structure on CO 2 emissions and emissions trend prediction in China. Atmos. Pollut. Res. 2018, 9, 446–454. [Google Scholar] [CrossRef]
- Cao, P.; Liu, Z. The impact of population characteristics on transportation CO2 emissions—Does population aging important? Environ. Sci. Pollut. Res. 2024, 31, 10148–10167. [Google Scholar] [CrossRef]
- Okada, A. Is an increased elderly population related to decreased CO2 emissions from road transportation? Energy Policy 2012, 45, 286–292. [Google Scholar] [CrossRef]
- Liddle, B. Impact of population, age structure, and urbanization on carbon emissions/energy consumption: Evidence from macro-level, cross-country analyses. Popul. Environ. 2014, 35, 286–304. [Google Scholar] [CrossRef]
- Carella, V.; Monachesi, P. Greener through Grey? Boosting Sustainable Development through a Philosophical and Social Media Analyses of Ageing. Sustainability 2018, 10, 499. [Google Scholar] [CrossRef]
- Meidutė-Kavaliauskienė, I.; Dudzevičiūtė, G.; Maknickienė, N.; Vasilis Vasiliauskas, A. The relation between aging of population and sustainable development of EU countries. Entrep. Sustain. 2020, 7, 2026–2042. [Google Scholar] [CrossRef]
- Han, J.; Chan, E.H.W.; Qian, Q.K.; Yung, E.H.K. Achieving sustainable Urban Development with an Aging Population: An “Age-Friendly City and Community” Approach. Sustainability 2021, 13, 8614. [Google Scholar] [CrossRef]
- Xu, Y. New concept of aging care architecture landscape design based on sustainable development. AIP Conf. Proc. 2017, 1839, 020126. [Google Scholar] [CrossRef]
- Gietel, B.S. Adopting an adaptation-mitigation-resilience framework to ageing. Age Ageing 2021, 50, 693–696. [Google Scholar] [CrossRef] [PubMed]
- Tiraphat, S.; Kasemsup, V.; Buntup, D.; Munisamy, M.; Nguyen, T.H.; Hpone Myint, A. Active Aging in ASEAN Countries: Influences from Age-Friendly Environments, Lifestyles, and Socio-Demographic Factors. Int. J. Environ. Res. Public Health 2021, 18, 8290. [Google Scholar] [CrossRef]
- Syed, Q.R.; Rahut, D.B. Aging and carbon emissions in Asian economies: Policy recommendation from panel quantile regression. Geol. J. 2023, 59, 538–549. [Google Scholar] [CrossRef]
- Ameer, F.; Khan, N.R. Manager’s Age, Sustainable Development Orientation and Sustainable Performance: A Conceptual Outlook. Sustainability 2020, 12, 3196. [Google Scholar] [CrossRef]
- Sabău-Popa, C.D.; Bele, A.M.; Bucurean, M.; Mociar-Coroiu, S.I.; Tarcă, N.N. A Panel Analysis Regarding the Influence of Sustainable Development Indicators on Green Taxes. Sustainability 2024, 16, 4072. [Google Scholar] [CrossRef]
- Bibliometrix. Home. Available online: https://www.bibliometrix.org/home/ (accessed on 26 August 2024).
- Urbanicikova, N.; Zgodavova, K. Sustainability, Resilience and Population Ageing along Schengens’s Easter Border. Sustainability 2019, 11, 2898. [Google Scholar] [CrossRef]
- Cecchini, M.; Cividino, S.; Turco, R.; Salvati, L. Population age structure, complex socio-demographic systems and resilience potential: A spatio-temporal, evenness-based approach. Sustainability 2019, 11, 2050. [Google Scholar] [CrossRef]
- Cai, C.; Qiu, R.; Tu, Y. Pulling Off Stable Economic System Adhering Carbon Emissions, Urban Development and Sustainable Development Values. Front. Public Health 2022, 10, 84656. [Google Scholar] [CrossRef]
- Terjanika, V.; Pubule, J. Barriers and driving factoris for sustainable development of CO2 Valorisation. Sustainability 2022, 14, 5054. [Google Scholar] [CrossRef]
- Yumashev, A.; Ślusarczyk, B.; Kondrashev, S.; Mikhaylov, A. Global Indicators of Sustainable Development: Evaluation of the Influence of the Human Development Index on Consumption and Quality of Energy. Energies 2020, 13, 2768. [Google Scholar] [CrossRef]
- Razmjoo, A.; Gakenia, K.L.; Vaziri Rad, M.A.; Marzband, M.; Davarpanah, A.; Denai, M. A Technical analysis investigating energy sustainability utilizing reliable renewable energy sources to reduce CO2 emissions in a high potential area. Renew. Energy 2021, 164, 46–57. [Google Scholar] [CrossRef]
- Su, C.-W.; Xie, Y.; Shahab, S.; Faisal, C.M.N.; Hafeez, M.; Qamri, G.M. Towards Achieving Sustainable Development: Role of Technology Innovation, Technology Adoption and CO2 Emission for BRICS. Int. J. Environ. Res. Public Health 2021, 18, 277. [Google Scholar] [CrossRef]
- Kang, M.; Zhao, W.; Jia, L.; Liu, Y. Balancing Carbon Emission Reductions and Social Economic Development for Sustainable Development: Experience from 24 Countries. Chin. Geogr. Sci. 2020, 30, 379–396. [Google Scholar] [CrossRef]
- Rehman, A.; Ma, H.; Ozturk, I.; Murshed, M.; Dagar, V. The dynamic impacts of CO2 emissions from different sources on Pakistan’s economic progress: A roadmap to sustainable development. Environ. Dev. Sustain. 2021, 23, 17857–17880. [Google Scholar] [CrossRef]
- Azam, A.; Rafiq, M.; Shafique, M.; Yuan, J. An empirical analysis of the non-linear effects of natural gas, nuclear energy, renewable energy and ICT-Trade in leading CO2 emitter countries: Policy towards CO2 mitigation and economic sustainability. J. Environ. Manag. 2021, 286, 112232. [Google Scholar] [CrossRef]
- Weimin, Z.; Chishti, M.Z.; Rehman, A.; Ahmad, M. A pathway toward future sustainability: Assessing the influence of innovation shocks on CO2 emissions in developing economies. Environ. Dev. Sustain. 2022, 24, 4786–4809. [Google Scholar] [CrossRef]
- Tawaiah, V.; Zakari, A.; Adedoyin, F.F. Determinants of green growth in developed and developing countries. Environ. Sci. Pollut. Res. 2021, 28, 39227–39242. [Google Scholar] [CrossRef]
- Menyah, K.; Wolde-Rufael, Y. CO2 emissions, nuclear energy, renewable energy and economic growth in the US. Energy Policy 2010, 38, 2911–2915. [Google Scholar] [CrossRef]
- Salari, M.; Javid, R.J.; Noghanibehambari, H. The nexus between CO2 emissions, energy consumption, and economic growth in the U.S. Econ. Anal. Policy 2021, 69, 182–194. [Google Scholar] [CrossRef]
- Al-Mulali, U. Investigating the impact of nuclear energy consumption on GDP growth and CO2 emission: A panel data analysis. Prog. Nucl. Energy 2014, 73, 172–178. [Google Scholar] [CrossRef]
- Belaïd, F.; Zrelli, M.H. Renewable and non-renewable electricity consumption, environmental degradation and economic development: Evidence from Mediterranean countries. Energy Policy 2019, 133, 110929. [Google Scholar] [CrossRef]
- Wang, Q.; Li, L. The effects of population aging, life expectancy, unemployment rate, population density, per capita GDP, urbanization on per capita carbon emissions. Sustain. Prod. Consum. 2021, 28, 760–774. [Google Scholar] [CrossRef]
- Wang, Q.; Yang, T.; Li, R.; Wang, L. Population aging redefines the economic growth-carbon emissions nexus, energy consumption-carbon emissions nexus—Evidence from 36 OECD countries. Energy Environ. 2023, 34, 946–970. [Google Scholar] [CrossRef]
- Huang, Y.; Kuldasheva, Z.; Salahodjaev, R. Renewable energy and CO2 emissions: Empirical evidence from major energy-consuming countries. Energies 2021, 14, 7504. [Google Scholar] [CrossRef]
- Liu, X.; Yuan, X. Novel research methods for energy use, carbon emissions, and economic growth: Evidence from the USA. Econ. Res. Ekon. Istraživanja 2023, 36, 1735–1750. [Google Scholar] [CrossRef]
- Arminen, H.; Menegaki, A.N. Corruption, climate and the energy-environment-growth nexus. Energy Econ. 2019, 80, 621–634. [Google Scholar] [CrossRef]
- Fan, J.; Zhou, L.; Zhang, Y.; Shao, S.; Ma, M. How does population aging affect household carbon emissions? Evidence from Chinese urban and rural areas. Energy Econ. 2021, 100, 105356. [Google Scholar] [CrossRef]
- Hashmi, R.; Alam, K. Dynamic relationship among environmental regulation, innovation, CO2 emissions, population, and economic growth in OECD countries: A panel investigation. J. Clean. Prod. 2019, 231, 100–1109. [Google Scholar] [CrossRef]
- Abid, M. Impact of economic, financial, and institutional factors on CO2 emissions: Evidence from Sub-Saharan Africa economies. Util. Policy 2016, 41, 85–94. [Google Scholar] [CrossRef]
- Kang, H. Impacts of Income Inequality and Economic Growth on CO2 Emissions: Comparing the Gini Coefficient and the Top Income Share in OECD Countries. Energies 2022, 15, 6954. [Google Scholar] [CrossRef]
- Atici, C. Carbon emissions in Central and Eastern Europe: Environmental Kuznets curve and implications for sustainable development. Sustain. Dev. 2009, 17, 155–160. [Google Scholar] [CrossRef]
- Tutak, M.; Brodny, J. Renewable energy consumption in economic sectors in the EU-27. The impact on economics, environment and conventional energy sources. A 20-year perspective. J. Clean. Prod. 2022, 345, 131076. [Google Scholar] [CrossRef]
- Saidi, K.; Omri, A. The impact of renewable energy on carbon emissions and economic growth in 15 major renewable energy-consuming countries. Environ. Res. 2020, 186, 109567. [Google Scholar] [CrossRef]
- Eurostat. Available online: https://ec.europa.eu/eurostat/web/sdi/database (accessed on 2 May 2024).
- Data Base World Bank. Available online: https://databank.worldbank.org/metadataglossary/world-development-indicators/series/SI.POV.GINI (accessed on 2 May 2024).
- Regis, M.; Serra, P.; Van den Heuvel, E.R. Random autoregressive models: A structured overview. Econom. Rev. 2022, 41, 207–230. [Google Scholar] [CrossRef]
- Dragoş, S.L.; Mare, C.; Dragoş, C.M. Institutional drivers of life insurance consumption: A dynamic panel approach for European countries. Geneva Pap. Risk Insur. Issues Pract. 2019, 44, 36–66. [Google Scholar] [CrossRef]
- Arellano, M.; Bond, S. Some tests of specification for panel data: Monte Carlo evidence and an application to employment equations. Rev. Econ. Stud. 1991, 58, 277–297. [Google Scholar] [CrossRef]
- Sabău-Popa, C.D.; Bele, A.M.; Negrea, A.; Coita, D.C.; Giurgiu, A. Do Energy Consumption and CO2 Emissions Significantly Influence Green Tax Levels in European Countries? Energies 2024, 17, 2186. [Google Scholar] [CrossRef]
- González, R.M.; Marrero, G.A.; Rodríguez-López, J.; Marrero, Á.S. Analyzing CO2 emissions from passenger cars in Europe: A dynamic panel data approach. Energy Policy 2019, 129, 1271–1281. [Google Scholar] [CrossRef]
- Lv, Z.; Xu, T. Trade openness, urbanization and CO2 emissions: Dynamic panel data analysis of middle-income countries. J. Int. Trade Econ. Dev. 2019, 28, 317–330. [Google Scholar] [CrossRef]
- Flannery, M.J.; Hankins, K.W. Estimating dynamic panel models in corporate finance. J. Corp. Financ. 2013, 19, 1–19. [Google Scholar] [CrossRef]
- Chang, H.-W.; Chang, T.; Xiang, F.; Mikhaylov, A.; Grigorescu, A. Revisiting R&D intensity and CO2 emissions link in the USA using time varying granger causality test: 1870∼2020. Heliyon 2023, 9, e20319. [Google Scholar] [CrossRef] [PubMed]
- Begum, R.A.; Sohag, K.; Abdullah, S.M.S.; Jaafar, M. CO2 emissions, energy consumption, economic and population growth in Malaysia. Renew. Sustain. Energy Rev. 2015, 41, 594–601. [Google Scholar] [CrossRef]
- Wang, M.L.; Wang, W.; Du, S.Y.; Li, C.F.; He, Z. Causal relationships between carbon dioxide emissions and economic factors: Evidence from China. Sustain. Dev. 2020, 28, 73–82. [Google Scholar] [CrossRef]
- Ottelin, J.; Heinonen, J.; Nässén, J.; Junnila, S. Household carbon footprint patterns by the degree of urbanisation in Europe. Environ. Res. Lett. 2019, 14, 114016. [Google Scholar] [CrossRef]
- Charlier, D.; Legendre, B. Carbon Dioxide Emissions and Aging: Disentangling Behavior from Energy Efficiency. Ann. Econ. Stat. 2021, 143, 71–103. [Google Scholar] [CrossRef]


| Authors | Relationships Identified and Analyzed | Method Used | Conclusions |
|---|---|---|---|
| Wang, Q and Li, L. [46] | Impact of population factors on carbon dioxide emissions. | STIRPAT (stochastic impacts by regression on population, affluence, and technology) model | The promoting effect of population urbanization has a significant effect on CO2 emissions. Inhibitory effect of population aging, density, and life expectancy on CO2 emissions. |
| Wang, Q., Yang, T., Li, R., and Wang, L. [47] | CO2 emissions—explained variable; GDP/capita, energy consumption—explanatory variables; population aging—threshold variable; population size, technological innovation level, the degree of urbanization, industrial structure, and energy intensity—control variables. | Panel threshold regression method | Population aging is an key factor that affects the relationship between economic growth and CO2 emissions, as well as the significant role of energy consumption and CO2 emissions. |
| Huang et al. [48] | Economic variables (GDP per capita, foreign direct investment, etc.), CO2 emissions | Fixed-effect regression method and GMM estimator | Negative effect of renewable energy on CO2 emissions. |
| The predictive power of social variables and CO2 modeling | |||
| Causes of CO2 emissions and power consumption | |||
| Liu and Yuan [49] | CO2 emissions Economic growth (GDP) Non-renewable energy (EU) Renewable energy consumption | Quantile regression approach (REC) | The carbon impact of GDP and the EU is highest in underdeveloped countries and lowest in industrialized countries. |
| Arminen and Menegaki [50] | Economic growth Power consumption CO2 emissions High- and upper–middle-income countries | Simultaneous equation framework Environmental Kuznets Curve (EKC) hypothesis | The countries under review base their economic growth on a two-way relationship with energy consumption. |
| Yuan et al. [7] | Energy security (ENS) Economic policy uncertainty (EPU) Government ecological expenditure (GEE) CO2 emissions | Quantile autoregressive distributed lag approach (QARDL) | Energy consumption transition through investing in renewable energy, updating energy technologies, and supporting reform of the energy price system. |
| Yu et al. [16] | Status of demographic structure Status of industrial structure Population aging Per capita wealth CO2 emissions impact factors | STIRPAT Model | Effects on CO2 emissions: Positive: population aging, industrial structure, and per capita wealth; Negative: energy intensity. |
| Fan et al. [51] | Meteorology, biomass, land use, population density and GDP/capita, CO2 emissions impact factors | Generalized linear model Genetic algorithm Community Land Model version 4.5 | Global carbon emissions have fallen due to rising GDP per capita. The meteorological factor strongly influences the cases of higher warming. |
| Hashmi, R. and Alam K. [52] | The effects of environmental regulation and innovation on carbon emissions | “Stochastic impacts by regression on population, affluence, regulation, and technology” (STIRPART) and generalized method of moments (GMM) models | The increase in the ecological patent determines the reduction in carbon emissions, and the increase in fiscal revenues from environmental taxes reduces carbon emissions for OECD countries. |
| Abid, M. [53] | Economic growth; economic, financial, and institutional development; pollution | ordinary least squares (OLS); general method of moments | The empirical results show that the Environmental Kuznets Curve hypothesis does not hold for Sub-Saharan Africa economies, indicating that there is a linear relationship between CO2 emissions and GDP/capita. At the same time, the results of the study highlight that political stability and control of corruption negatively influence CO2 emissions. On the contrary, the regulatory quality and law have a positive effect on CO2 emissions. |
| CO2/Capita | Adjusted Gross Disposable Income/Capita | GDP/Capita | Energy Use/Capita | Median Age | GINI | |
|---|---|---|---|---|---|---|
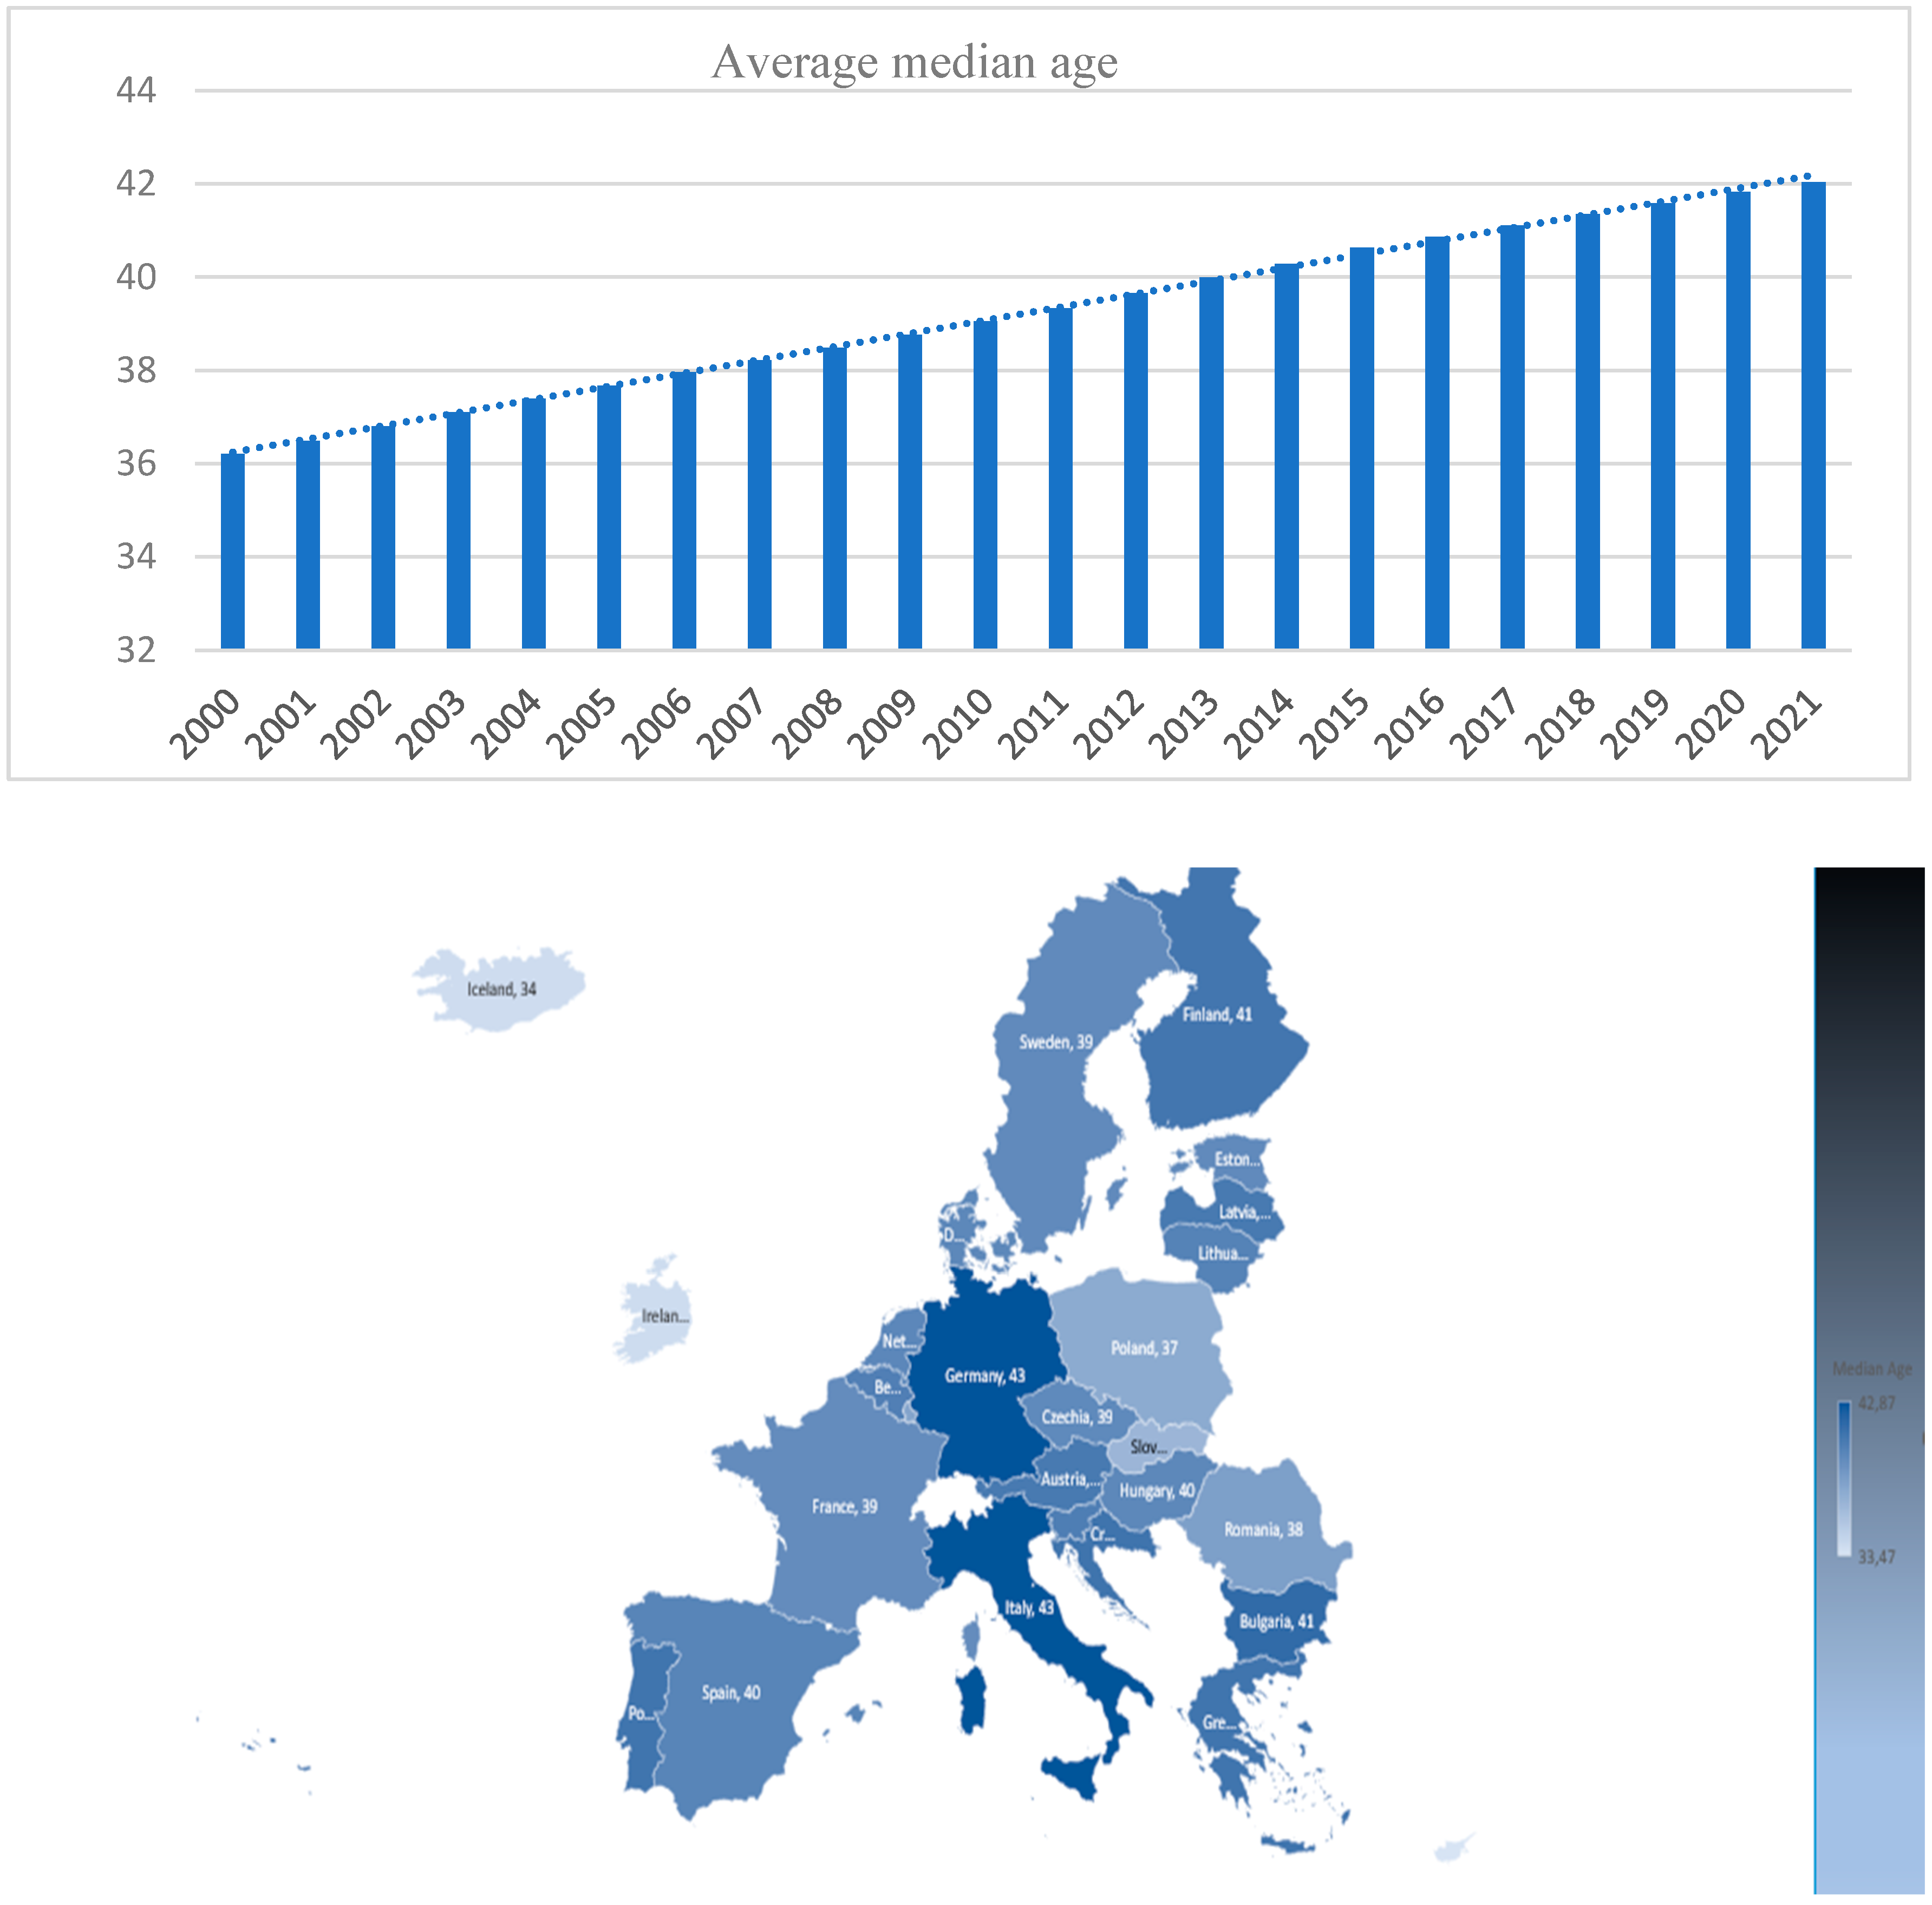
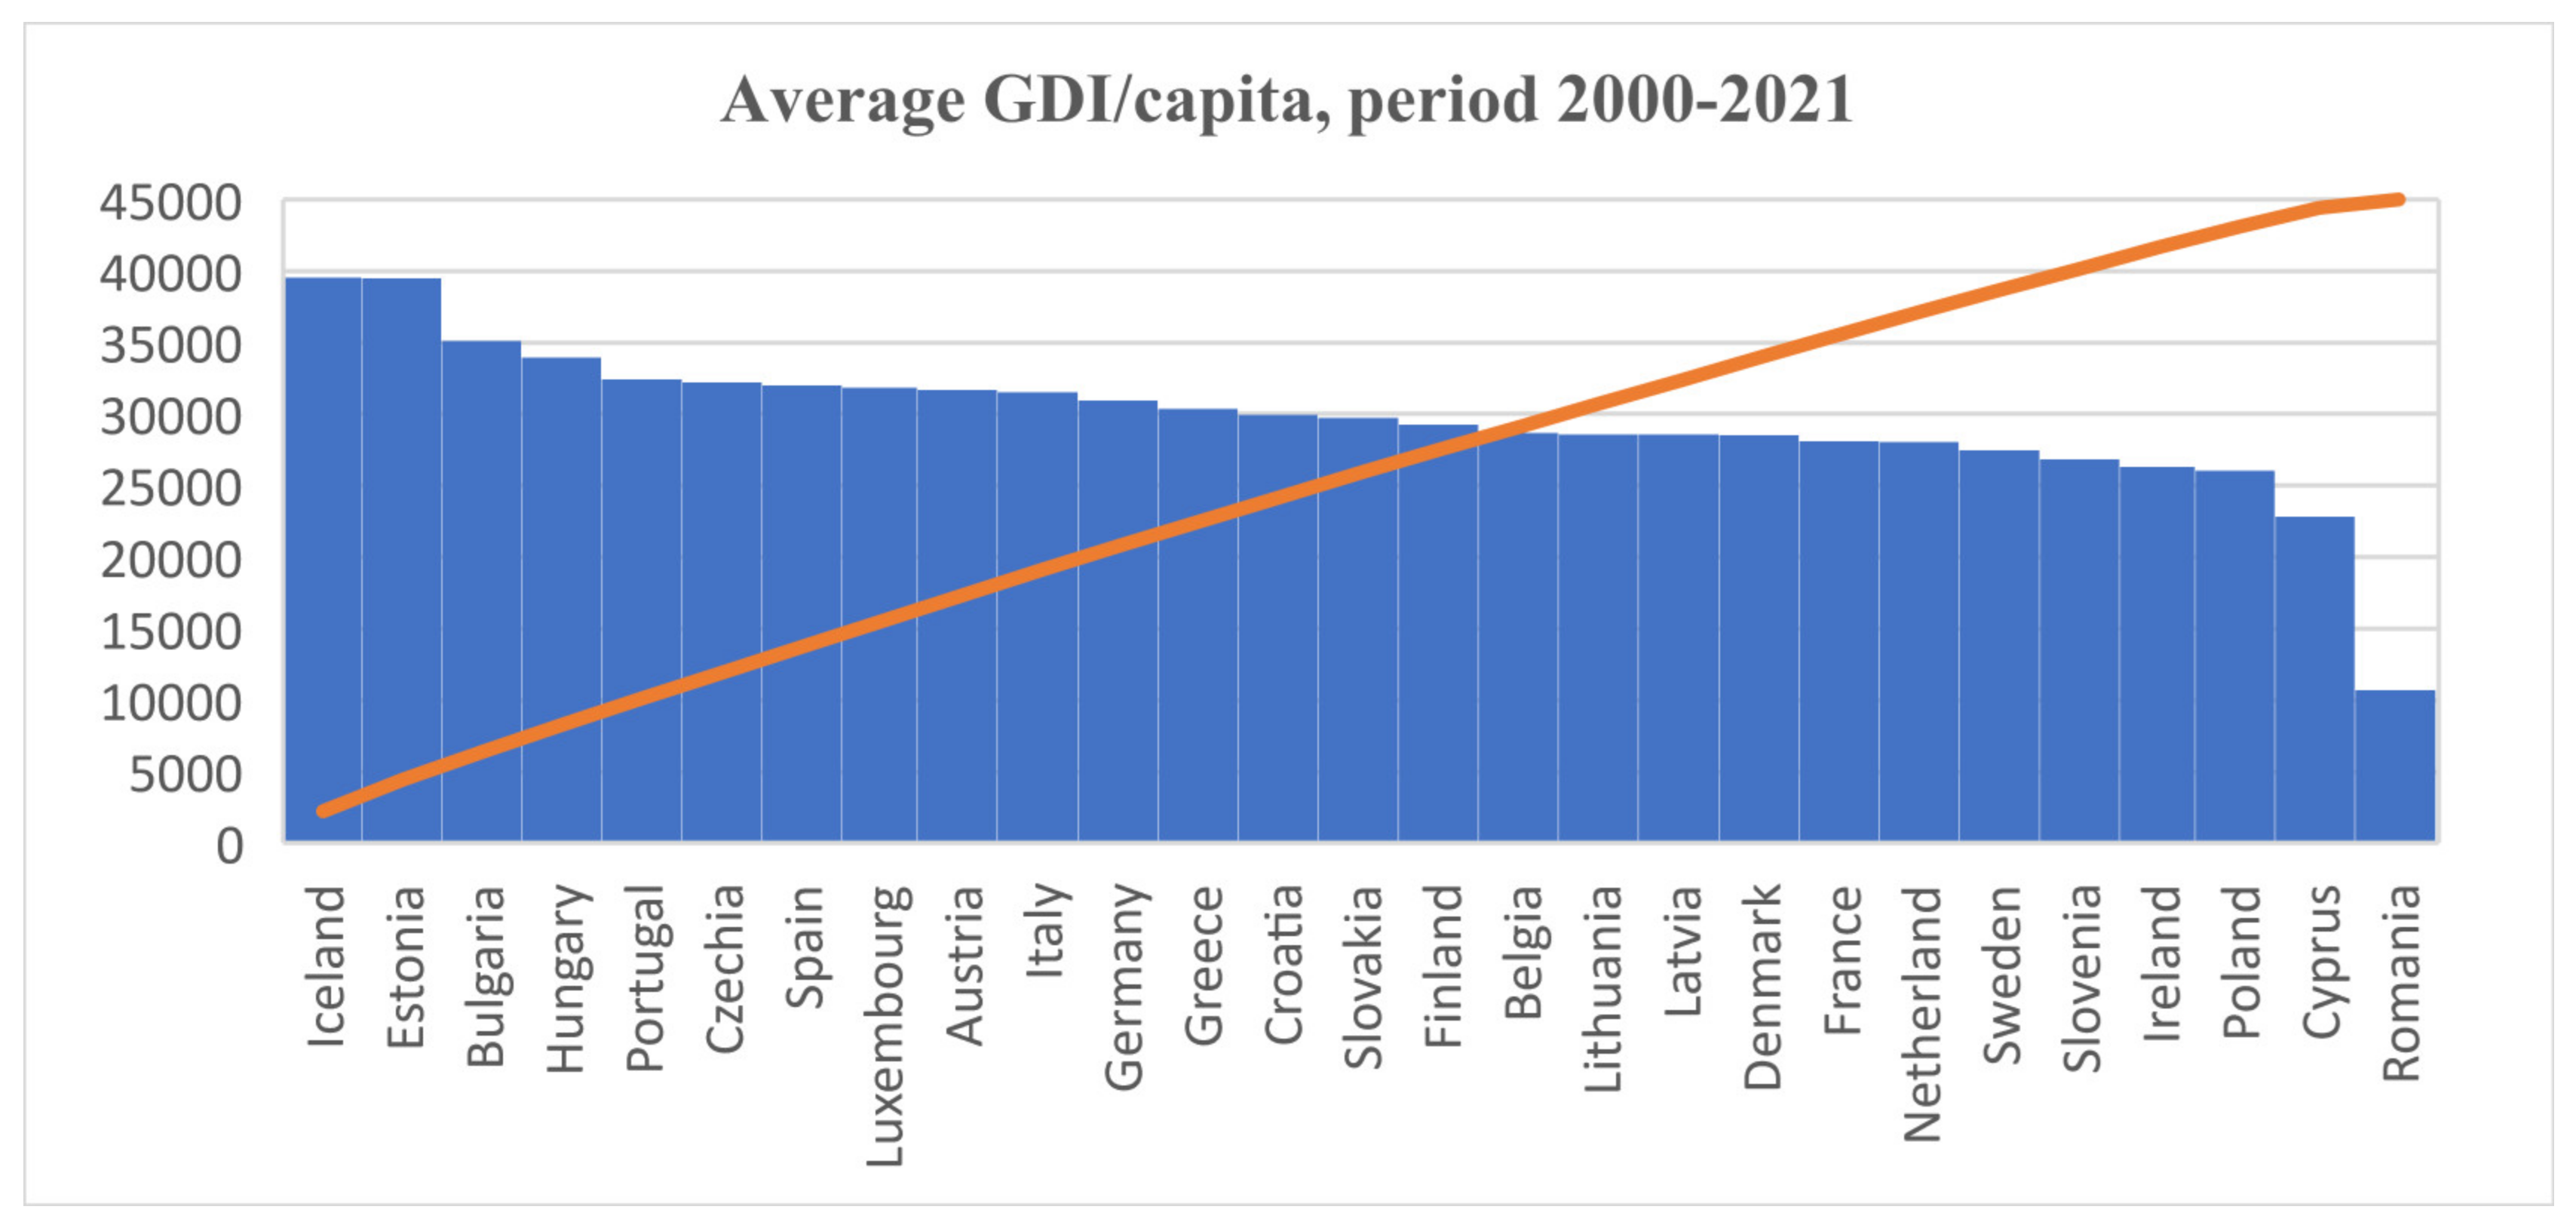
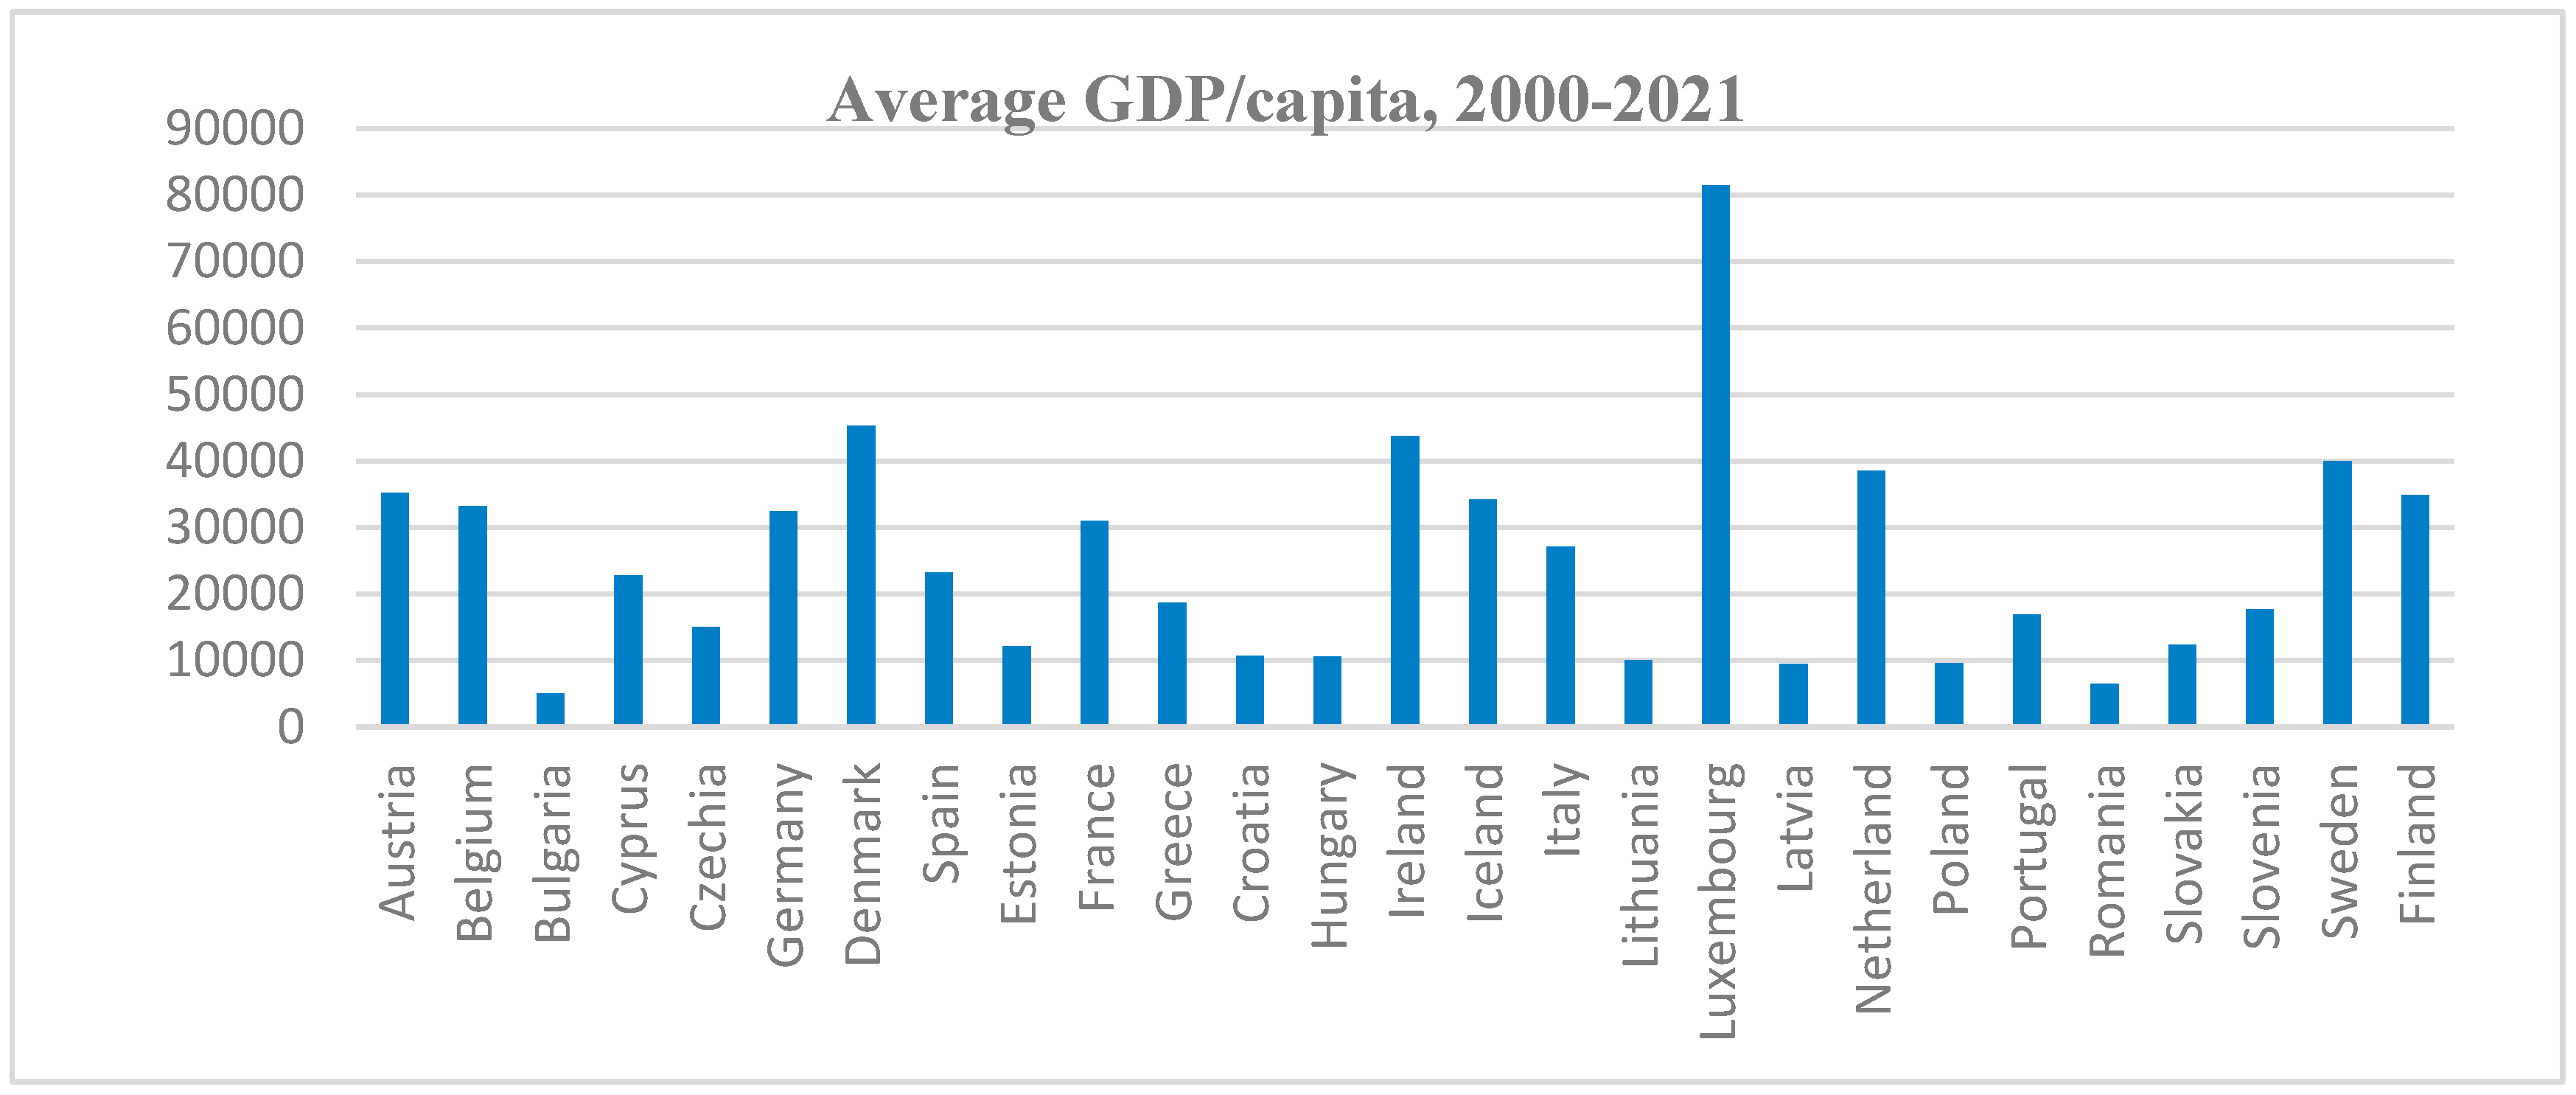
| Minimum | 2.32 | 10,959 | 2990 | 15,779.98 | 30.4 | 22 |
| Maximum | 25.61 | 86,296.51 | 88,120 | 113,106.18 | 46.8 | 41.3 |
| Mean | 7.36 | 30,309.5 | 25,359.68 | 40,559.78 | 39.22 | 31.05 |
| St. Deviation | 3.57 | 13,035.84 | 17,850.48 | 16,948.29 | 2.8 | 3.88 |
| Skewness | 1.91 | 0.627 | 1.551 | 1.58 | −0.389 | −0.106 |
| Kurtosis | 5.77 | 0.526 | 2.786 | 3.217 | 0.238 | −0.31 |
| Variables | Inverse Chi2 | p-Value | Result |
|---|---|---|---|
| CO2 emissions/capita | 46.3062 | 0.7623 | Non-stationary series |
| lagged CO2 emissions/capita | 42.7204 | 0.8657 | Non-stationary series |
| adjusted gross disposable income (GDI)/capita | 301.479 | 0.00 | Stationary series |
| gross domestic product (GDP)/capita | 49.8185 | 0.6363 | Non-stationary series |
| energy consumption/capita | 121.0411 | 0.00 | Stationary series |
| median age | 11.1403 | 1.00 | Non-stationary series |
| economic inequality in the population (GINI) | 158.2204 | 0.00 | Stationary series |
| Number of obs. = 567 F (1,565) = 7632.53 Prob > F = 0.0000 R-squared = 0.9311 Adj. R-squared = 0.9310 | ||||||
| Source | SS | Df | MS | |||
| Model | 4405.607 | 1 | 4405.607 | |||
| Residual | 326.126 | 565 | 0.577 | |||
| Total | 4731.733 | 566 | 8.360 | |||
| Residual terms | Coef. | Std. Err. | t | p > | [95% Conf. Interval]. | |
| Residual terms L1 | 0.982 | 0.011 | 87.36 | 0.000 | 0.96 | 1.004 |
| _cons | −0.126 | 0.032 | −3.95 | 0.000 | −0.189 | −0.063 |
| Independent Variables | Regression Analysis | Robustness Test |
|---|---|---|
| CO2E/capita L1. | 0.92101 *** (0.000) | 0.92101 *** (0.000) |
| GDI/capita | 0.000003 (0.224) | 0.000003 (0.437) |
| GDP/capita | −0.00006 *** (0.000) | −0.00006 *** (0.001) |
| Energy use/capita | 0.0000005 (0.434) | 0.0000005 (0.306) |
| Median age | −0.0677 *** (0.007) | −0.0677 ** (0.055) |
| Gini | −0.0088 (0.634) | −0.0088 (0.699) |
| constant | 4.70449 *** (0.000) | 4.70449 *** (0.001) |
| Wald chi2(6) | 2400.16 | 864.54 |
| Prob > chi2 | 0.0000 | 0.0000 |
Disclaimer/Publisher’s Note: The statements, opinions and data contained in all publications are solely those of the individual author(s) and contributor(s) and not of MDPI and/or the editor(s). MDPI and/or the editor(s) disclaim responsibility for any injury to people or property resulting from any ideas, methods, instructions or products referred to in the content. |
© 2024 by the authors. Licensee MDPI, Basel, Switzerland. This article is an open access article distributed under the terms and conditions of the Creative Commons Attribution (CC BY) license (https://creativecommons.org/licenses/by/4.0/).
Share and Cite
Sabău-Popa, C.D.; Perțicaș, D.C.; Florea, A.; Rus, L.; Juma, H.W. Is Younger Population Generating Higher CO2 Emissions? A Dynamic Panel Analysis on European Countries. Sustainability 2024, 16, 7791. https://doi.org/10.3390/su16177791
Sabău-Popa CD, Perțicaș DC, Florea A, Rus L, Juma HW. Is Younger Population Generating Higher CO2 Emissions? A Dynamic Panel Analysis on European Countries. Sustainability. 2024; 16(17):7791. https://doi.org/10.3390/su16177791
Chicago/Turabian StyleSabău-Popa, Claudia Diana, Diana Claudia Perțicaș, Adrian Florea, Luminița Rus, and Hillary Wafula Juma. 2024. "Is Younger Population Generating Higher CO2 Emissions? A Dynamic Panel Analysis on European Countries" Sustainability 16, no. 17: 7791. https://doi.org/10.3390/su16177791